
Abstract
Apparel sales forecasting plays an important role in production planning, distribution decision, and inventory management of enterprises. Especially, the sportswear market has been shown rapid growth characterized by long-term sales. This paper proposes a sales forecasting model for sportswear sales based on the multi-layer perceptron (MLP) and the convolutional neural network (CNN). A novel loss function is also proposed to improve the prediction accuracy. The proposed model is trained and validated on the time-series retailing data collected from three offline local sports stores in China. The influencing factors of retailing forecasting, such as time-series sales data, product features, distribution strategy, shop size, and other parameters, were also defined. Experimental results show that the proposed forecasting model outperforms the compared statistical methods by a large margin. Specifically, the proposed model provided 65% prediction accuracy, while the compared methods provided 16% prediction accuracy. The results show that the proposed model could be potentially used in sportswear sales forecasting, especially offline clothing and other long lifecycle clothing fields.
The rapid growth of the textile and apparel industries has attracted many scholars’ attention in clothing retailing forecasting research. Sales forecasting, also known as demand forecasting, contributes to implementing an efficient production management plan and plays a decisive role in the operational decision support system. A fast and robust estimation is essential for store merchandisers and brand producers in the product shipment planning. 1 It can also help retailers avoid product losses and enable flexible business planning. 2 It is crucial to understand the clothing products and impact factors that influence sales forecasting in order to choose proper forecasting methods and make reasonable sales forecasts. 3 The early sales amount of a specific retail product is significant for inferring the overall sales life span, and is often considered a good indicator for retailers. 4 Despite the significance, the overall product sales prediction using only early sales data has not been studied. On the other hand, various forecasting models have been studied in many applications.5, 6
Accurate retail forecasting is challenging due to the diversity of clothing types and the significant impact of marketing strategies on a decision for forecasting data models. Figure 1(c) demonstrates three major impact factors for clothing sales forecasts: (a) diverse features of clothing, (b) retailing strategy factors influencing forecasting result, 7 and (c) forecasting methods and dataset. As shown in Figure 1(a), sports clothing, especially team-wear clothing with a relatively long-term lifecycle (more than 1 year), is selected as the target category. Sportswear is different from fast fashion, one-time shot, classical sales clothing such as the white shirt and jeans (the full-year selling items). In the sport fashion industry, regional distributors are a main global retailing channel of sports products.
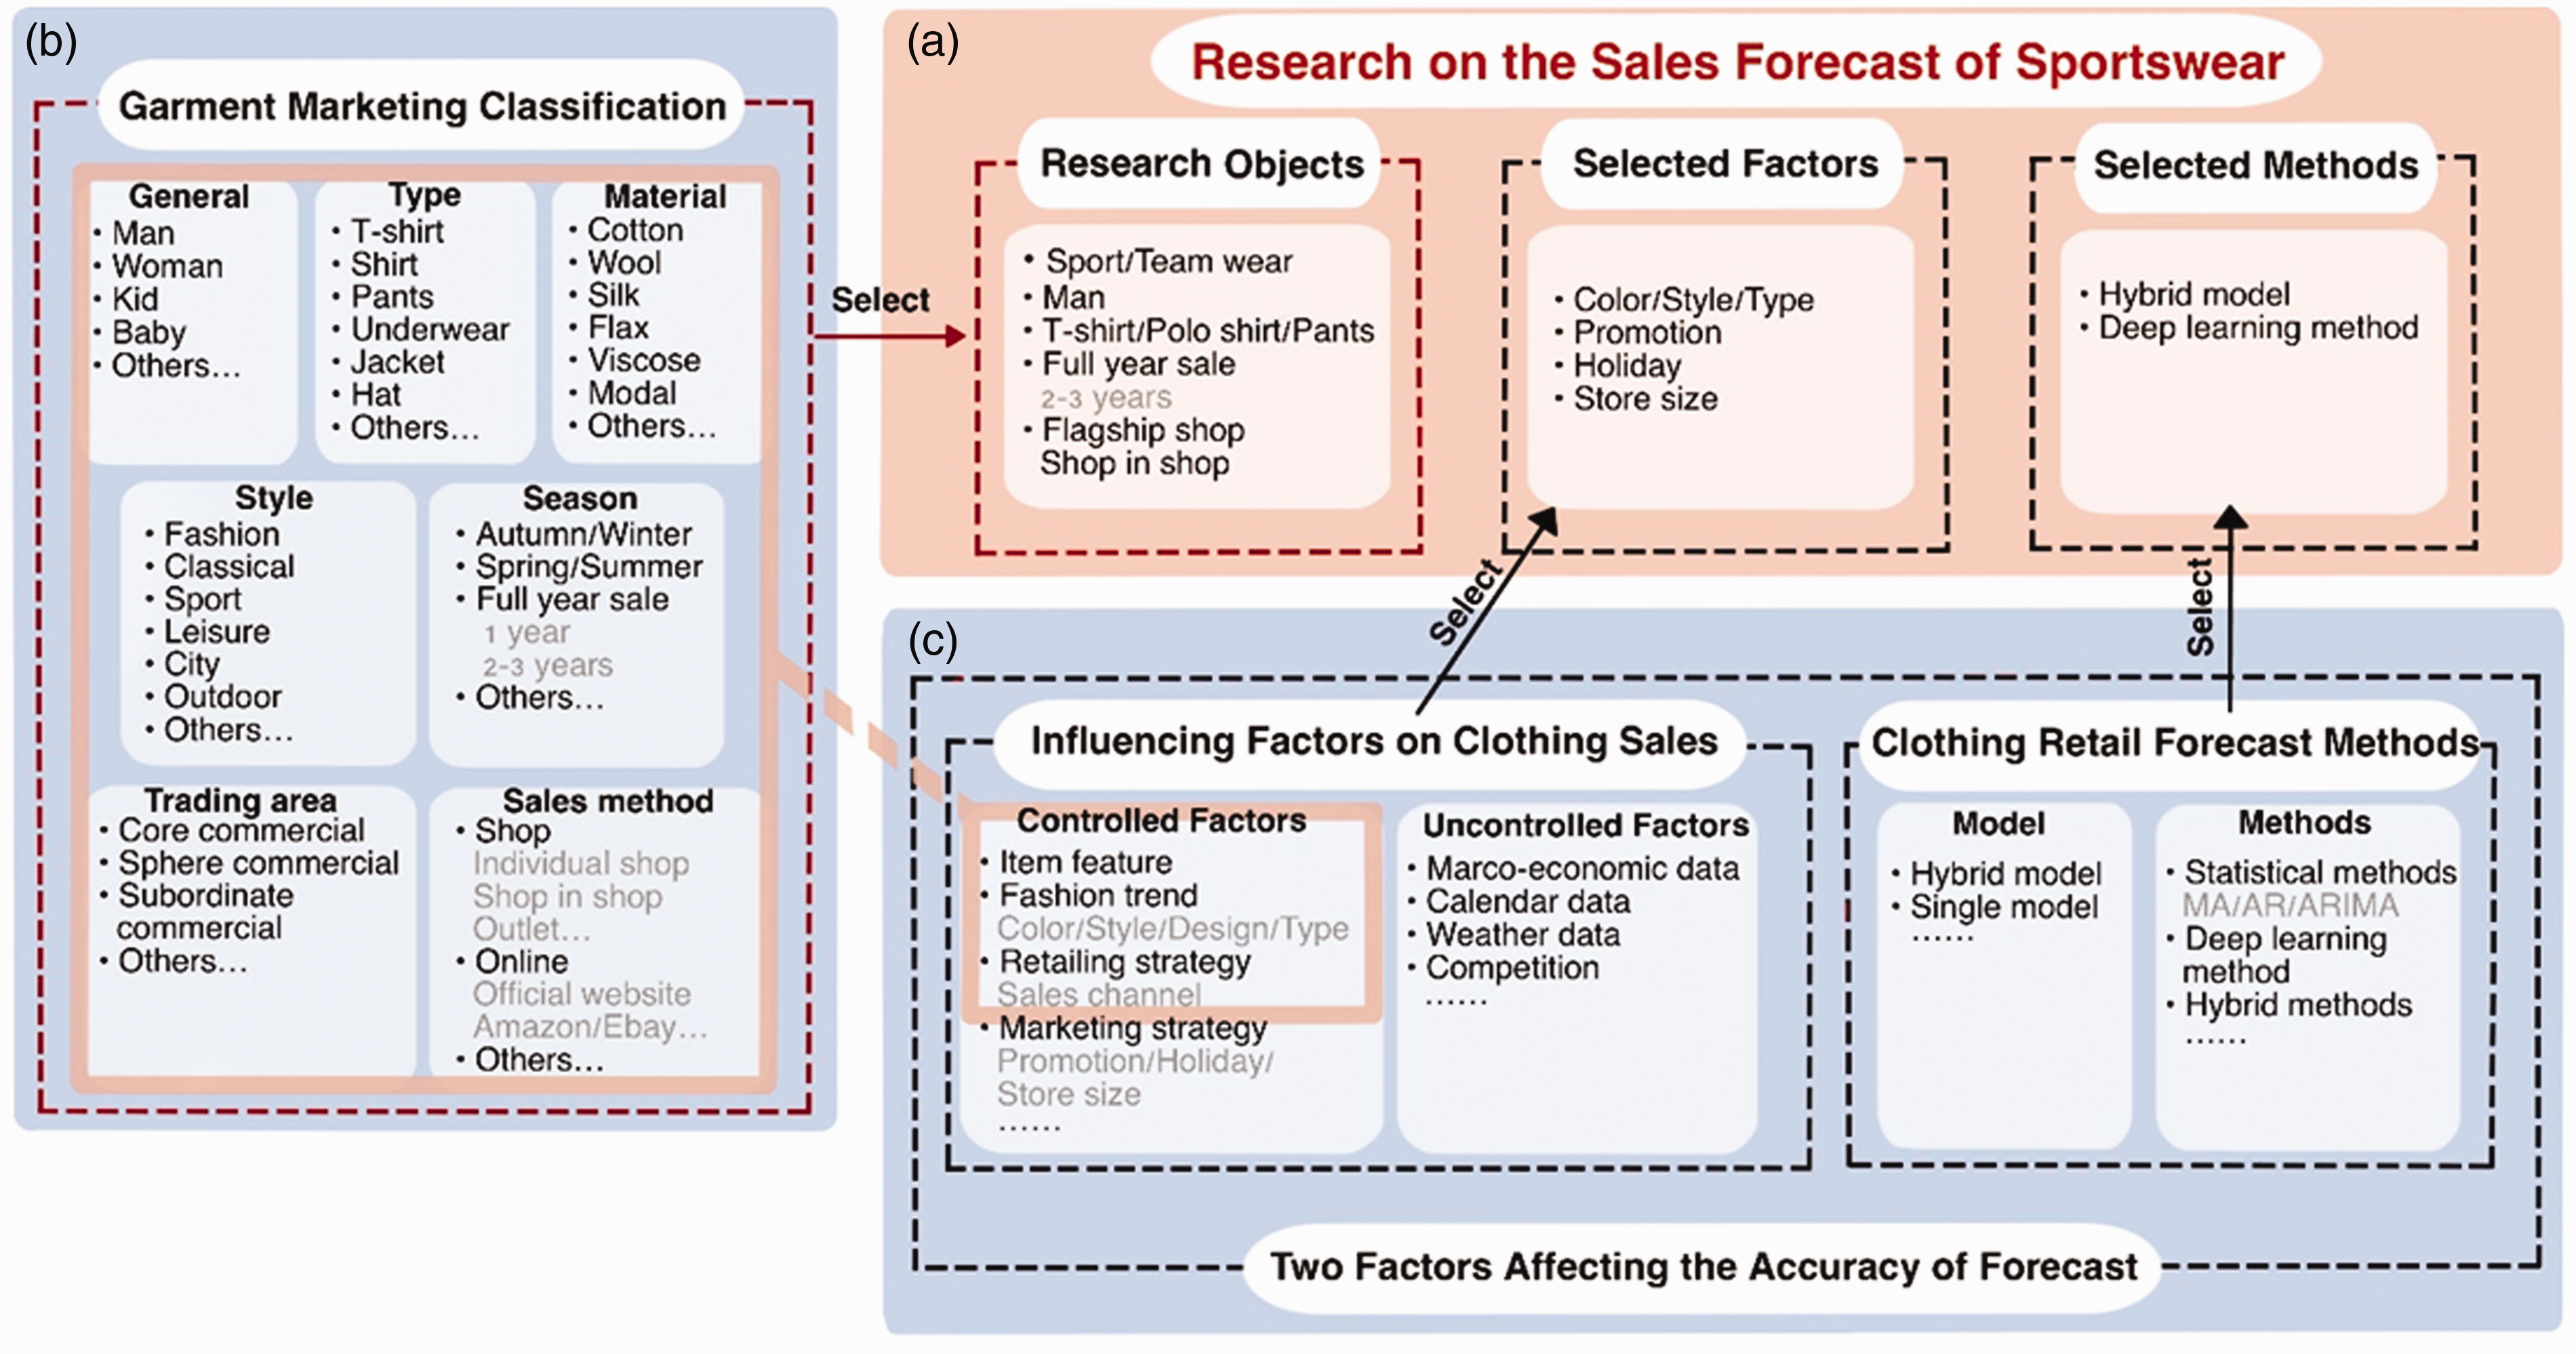
Selected research object and method of this work and two aspects influencing accuracy of sales forecasting.
The data source plays an important role in influencing the prediction results. 8 Time-series data have been commonly used in apparel sales forecasting. However, the forecasting prediction accuracy is limited with a single time-series data as the input. Caglayan et al. 9 showed that traditional forecasting methods based on time-series only consider product cycles, sales data, and sales trends, which were biased and inaccurate. In practical applications in offline clothing retail stores, more data are required to obtain higher prediction accuracy. Jain and Kumar 10 proposed a hybrid prediction model combining the traditional time-series method with the artificial neural network (ANN). A multi-channel data-based forecast model was constructed to capture more complex time-series data, improving the sales forecast of a specific clothing type.
This paper focuses on the early sales of time-series sports apparel. A new machine learning-based forecasting model is proposed to estimate the retailing number of the selected sport styles. The proposed hybrid model is based on the combination of multi-layer perceptron (MLP) and convolutional neural network (CNN). Instead of just using historical sales data of similar products, the model utilizes the influencing factors, including promotion strategy, product attributes, early sales, promotional activities, and shop size. The proposed model is the first attempt to combine time-series and classification data, especially offline sales forecasting, for sports apparel. A 2-year sports product retailing dataset was used to compare different techniques and evaluate the forecast accuracy. The proposed model is applicable in forecasting sports/team-wear styles sales for merchandisers and small–medium industry with a small dataset.
Related works
Influencing factors on clothing sales
Frank et al.7 analyzed clothing sales forecasts involving both internal and external factors, such as product attributes, climate data, and media effects. Then, they proposed a mathematical sales forecast model for women’s clothing, in which fuzzy logic was used to synthesize the parameters and remove unnecessary factors. The ANN showed better results than the other two methods: the seasonal single exponential smoothing model and the Winters’ three-parameter model. However, it was shown that considering only specific factors limit the prediction accuracy. Aksoy et al. 11 established a clothing demand prediction model based on the adaptive network-based fuzzy inference system, which employs more factors, such as fashion trends, distribution models, and competitive environments.
Several studies were conducted on investigating a specific influencing factor on the clothing retail forecasting. Guven and Simsir 12 investigated the effect of color parameters on clothing retail forecasting using ANN and support vector machines (SVM). The results showed that the ANN provided better accuracy than SVM with color parameters. Zhou et al. 13 considered the influence of consumers’ purchasing preferences and seasons on the forecast. The traditional Bass model was improved by combining similar clothing feature data. The previous retailing forecasting research works involved two aspects: (a) defining exogenous influencing factors on clothing sales and (b) developing a suitable model for a specific clothing target market.
Thomassey 14 divided exogenous factors related to clothing item sales into two categories: uncontrolled and controlled factors. Uncontrolled factors include macro-economic data, calendar data, competition, and weather data, while controlled factors include item features, fashion trends, retailing strategy, and marketing strategy. Macro-economic data involve the national and global economic situation. According to a study of the changes in the Australian apparel retail industry, 15 the economic depression in the post-war period and the general decline in consumer demand caused inventory backlogs. After struggling with severe challenges for a while, the apparel manufacturing and sales industries have recently continued developing with economic recovery, technological innovation, and the expansion of import and export trade. Badorf and Kai 16 maintained that consumers’ buying behavior would be affected by the uncontrollable factor: weather. The weather may cause consumers to postpone or abandon the purchase of products; this is an unpredictable and uncontrolled factor affecting retail volume and strategy. Ma and Fildes 17 showed that the product sales volume of offline retail stores fluctuates significantly under the influence of seasonal cycles and holidays. Promotional activities during this period could result in a significant increase in sales. It is unrealistic to forecast a single piece of clothing retail from a macro level using uncontrollable factors.
Several studies were conducted on controllable factors of garment features. Consumers usually purchase clothing based on fashion trends and pay more attention to the style, color, design, and other clothing product features. Mo et al. 18 found that appearance affects consumers’ purchases more than product quality. As many people purchase their clothes online these days, media channels (such as Twitter 19 and Amazon 20 ) have also had a considerable impact on retailing strategy. Although external factors also have a certain impact on clothing retail, the extent of the effect is difficult to measure.
Clothing retail forecast methods
Clothing retail forecast methods are divided into three main categories: statistical methods, deep learning methods, and hybrid methods. Statistical models and neural network models were first explored for clothing retail forecasting. 21 In recent years, deep learning methods have shown outstanding performance in many forecasting fields.
Statistical methods
The statistical forecast model was first proposed in 2002, 22 and was an efficient prediction model that can predict thousands of historical datasets in few seconds. Since then, various statistical models have been studied for clothing forecasting: linear regression, 23 time-series regression, 24 moving average (MA), exponential smoothing, 25 autoregressive integrated moving average (ARIMA),26–28 and driver moderator method. 29 A case study using the statistical model 30 was recently shown to be successfully applied to a Mexican fashion company’s sales increase, and to anticipate product behavior from early weeks. In this successful case in Mexico, the size of the shop, retailing number, and historical price of each item were used to define the shop ‘LEVEL.’ Then, the amount and price of the sales for new products were appropriately forecasted by utilizing the pre-knowledge of the shop ‘LEVEL.’ The statistical model typically consisted of the following steps: a model selection by a statistical analysis expert and the data structure analysis. The statistical models were fast, processing a huge amount of data in few seconds to obtain a final forecasting result. However, the statistical methods required pre-understanding of sales data structure, and determining a proper statistical model was time-consuming.
Deep learning methods
Recently, deep learning methods, especially ANN, have shown their ability to solve complex problems in many applications. Other successful machine learning methods in fashion applications include extreme learning machine, 31 decision tree, 32 and genetic algorithm.33,34 The neural network was also applied in fashion color estimation, fashion forecasting, 11 and stock inventory. A large-scale adaptive non-linear dynamic system, ANN provides robustness and error tolerance with strong collective computing and learning capabilities. However, a deep neural network, such as ANN, requires a huge amount of data for training. Also, the training using gradient descent-based optimization is often relatively slow, as it requires many iterative learning steps to obtain good learning performance. Despite such a slow training speed, the ANN model has the advantage of learning complex features and patterns from the input data without requiring a deep understanding of the dataset or an additional labeling process.
Sales forecasting is very important in e-commerce to make efficient business decisions, and is affected and influenced by many factors, such as promotional activities, product competition, and user preferences. A deep sales forecasting framework (DSF) was proposed for e-commerce sales forecasting to reduce the influence of interference items in sales forecasting and capture more effective information. 35 A sales residual network was introduced on top of the decoder to establish a learning sequence, targeting to model the sales impact caused by product competition. The DSF improved the prediction accuracy for the e-commerce sales prediction, showing robustness to complex input data. In Zhao and Wang, 36 the CNN was used for sales forecasting in e-commerce. The employed CNN realized more accurate sales forecasting through its effective features learning ability. In view of the successful case of CNN being used in e-commerce sales forecasting, it can be derived from the trend that neural networks can also be used in sales forecasts with a small dataset. 21
Hybrid methods
Clothing sales forecasting is complicated because it is affected by many factors, such as weather, marketing, psychological considerations, and fashion trend, which have a certain degree of volatility. Thus, it is difficult to achieve accurate prediction with a single mathematical model. To overcome this limitation, hybrid approaches have been studied, aiming to obtain a better forecasting process.
Similar to a single model case, there are two main categories: the statistical-based hybrid method and the deep learning-based hybrid method. Different types of hybrid models have been explored to address various problems in fashion forecasting applications, resulting in various levels of accuracy, speed, and performance. Fan et al. proposed a hybrid method that combines the Bass model and sentiment analysis. 37 Early sales with fewer historical sales data, using a hybrid method, presented outstanding performance. 38 In Huang and Lin, 39 a hybrid approach was applied to a Canadian fashion company stock-out estimation application. Grey system theory and fuzzy time-series 40 were used to forecast the growth of green electronic materials, taking advantage of the robustness to a limited number of industrial sample data. However, these two models required an understanding of theoretical assumptions and specific mathematical knowledge. Different forecasting models, fuzzy logic, neural networks, and data mining were proposed to evaluate real fashion data by Thomassey. 41 Also, based on real data, the sourcing and forecasting processes were simulated and analyzed. In summary, the hybrid method combined the advantages of the statistical method, robustness, and deep learning, fast speed. The choice of different models within the same dataset will achieve very different prediction success rates in light of the above. Note that a hybrid method also showed better performance when pre-knowledge of the specific dataset is provided.
The proposed forecasting model
In the proposed method, the weekly sales units are modeled as time-series. Although in previous studies, sequence data have been mostly modeled with recurrent neural networks (RNN),
42
some recent studies showed that CNN provides better performance over the RNN on specific tasks such as language translation. For instance, a simple convolutional architecture outperformed the state-of-the-art recurrent networks such as long short-term memory in a diverse range of applications and datasets.
43
It showed that CNN is more suitable than RNNs for domains where a long history is required, with the following three characteristics of CNN for time-series input data:
The convolutions are causal, indicating that only past information is used to predict future information. The architecture can take any length sequence as an input and output any length sequence. The architecture can build a very long history size. The receptive field of the network is directly linked to the network depth, indicating that a deeper network can use more historical data in predicting future information.
Another advantage of CNN over RNN is that CNN does not depend on any previous predictions. It uses only the current window (receptive field) for prediction, enabling the model to understand the sales data patterns occurring in that specific window.
The proposed method consists of the CNN and MLP to model time-series and process numerical sales data, respectively. The flowchart of the proposed method is depicted in Figure 2. Although it was originally designed for two-dimensional image data, CNN can be used to model time-series forecasting problems. The adopted CNN architecture in the proposed model is inspired by the Wave Net architecture, 44 proposed by Google DeepMind for raw audio time-series. The key idea of the architecture is adopting Dilated Causal Convolution to extract causal features only; in such a way, the network cannot see intermediate future time-series data. A sequence of dilated convolutions with increasing dilated rate allows increasing the receptive field of the network without compromising its performance. No pooling layer is required to sample the output feature vectors into a lower dimension. In the following sections, subnetworks are described in more detail.
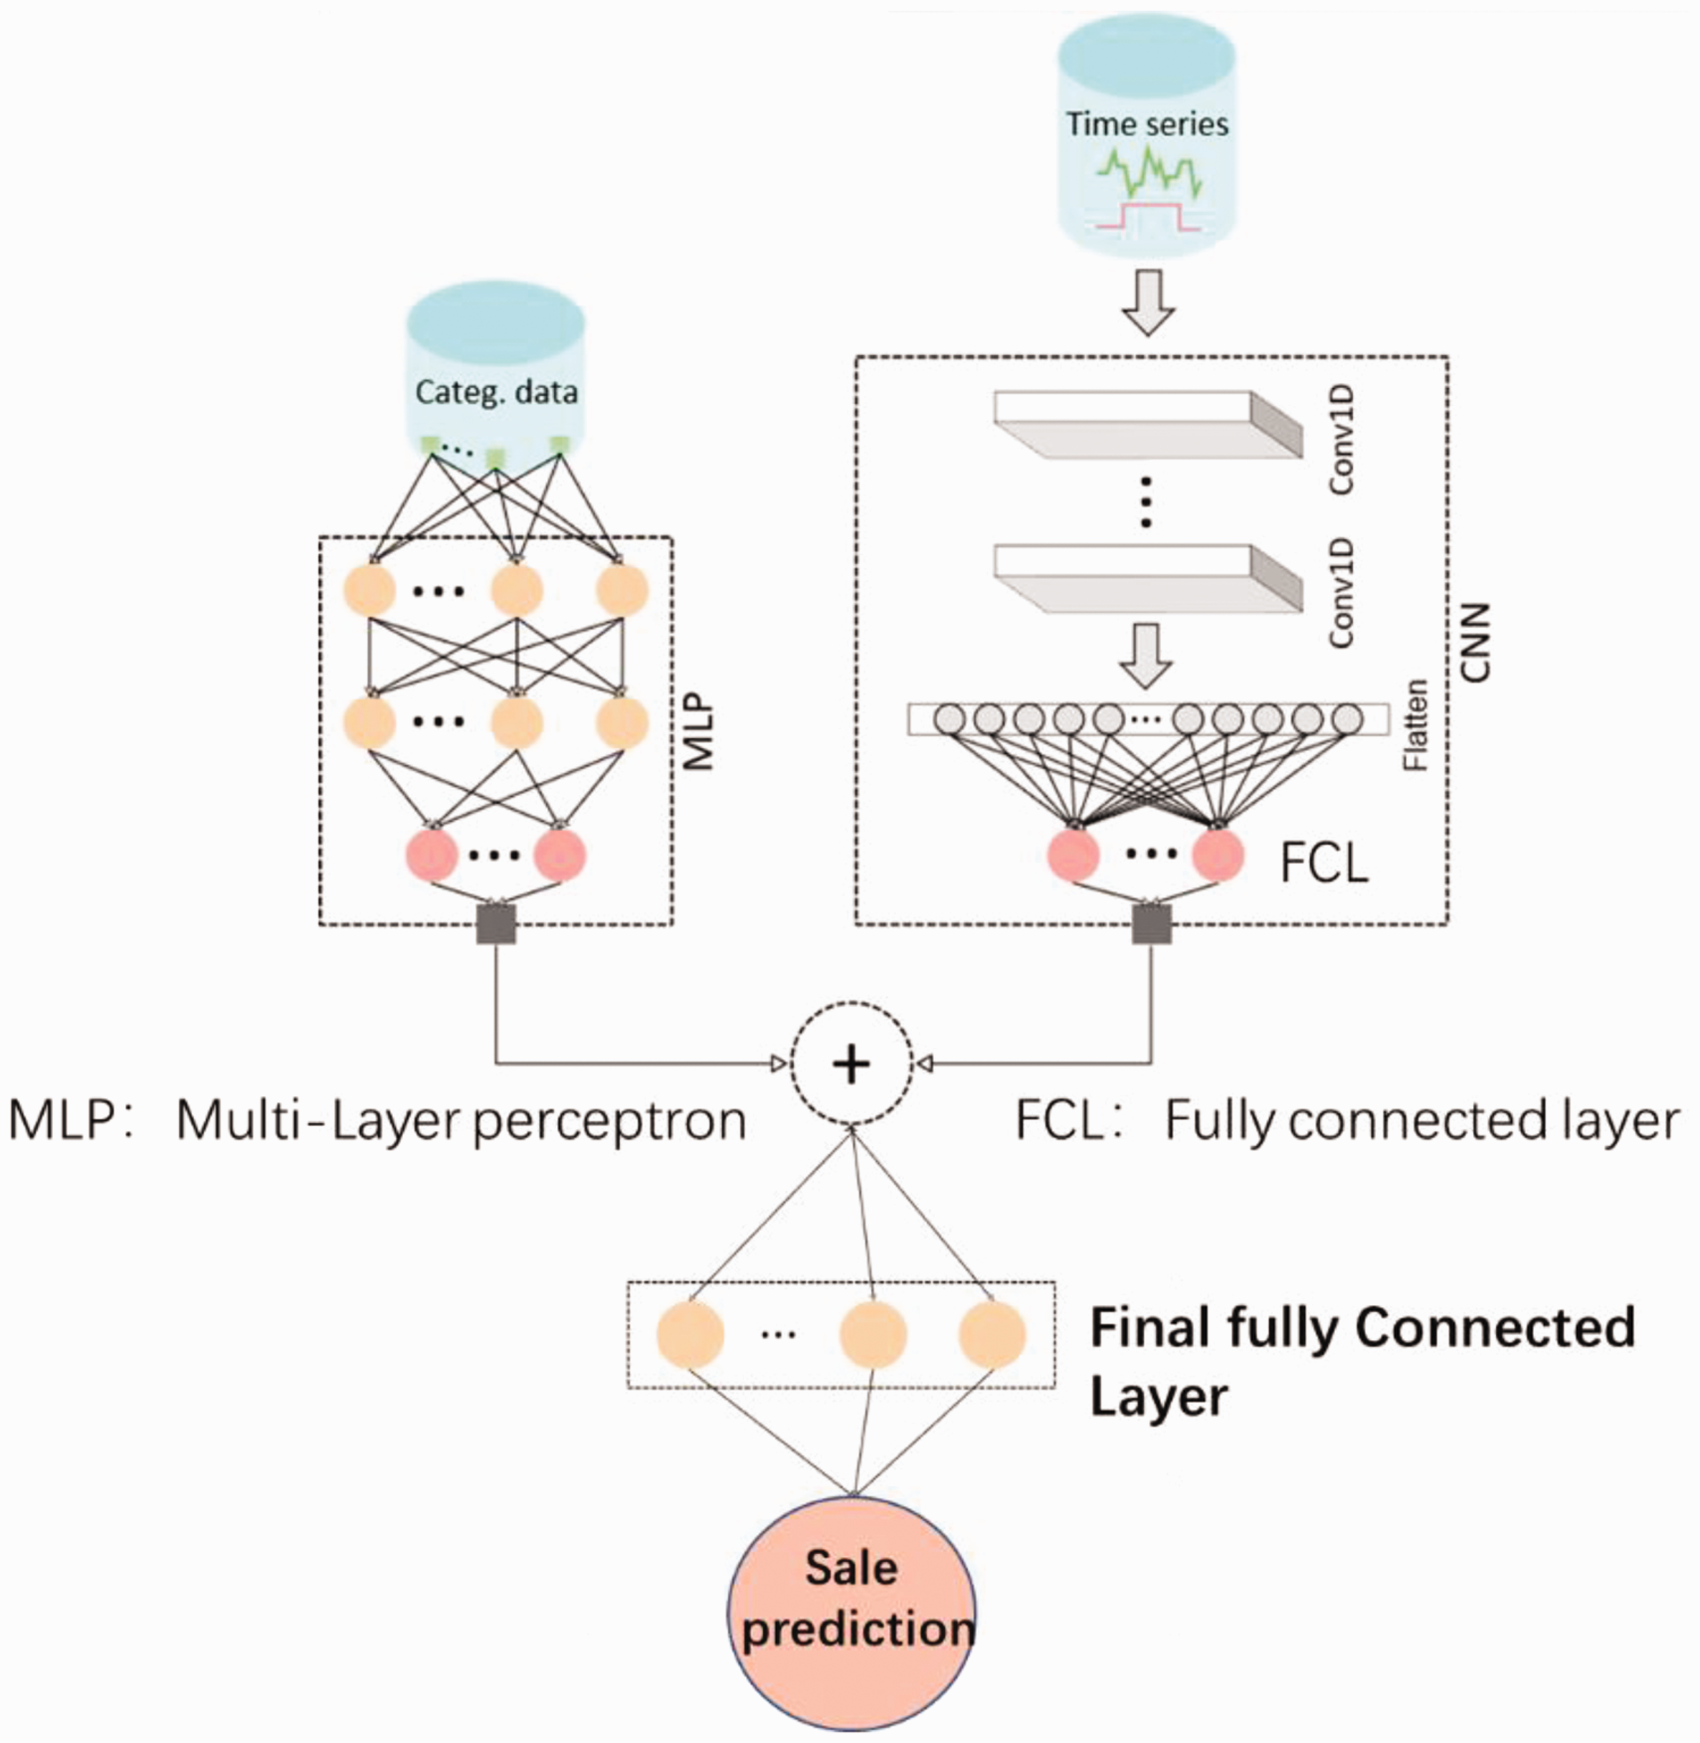
The flowchart of the proposed method.
MLP: feature extraction of the time-invariant metadata
For all styles in our database, we use additional time-invariant information to improve the sales forecasting, which is defined as follows:
Style_id: indicates the styles of clothing. Our dataset is composed of three styles (StyleA: 0, StyleB: 1, StyleC: 2). Shop_size: indicates the size of the shop, usually related to the total amount of the sold products in the shop. The data are divided into three groups (SMALL: 1, MEDIUM: 2, BIG: 3). Shop_id: differentiates each shop in our database. Clothing_size: indicates the clothing size. Four different clothing sizes exist in our present dataset (S: 0, M: 1, L: 2, XL: 3). Clothing_color: indicates the color of the current clothing. The clothes were classified into 12 different colors (Black, White, Red, Orange, Yellow, Blue, Green, Gray, Neon Yellow, Brown, Violet, Stone gray). There is no hard constraint on the color set, and more colors can be dynamically added to the proposed model.
Note that the categorical information can vary from one application to another. Clothing color is defined as a sequence of 12-bits (individual colors are either present or not). Each cloth is labeled with at most two main colors, meaning that the 12-bits color-encoding sequence can have at most two bits with value 1, and all other bits are set to value 0. For example, the bit sequence “110000000000” indicates that the cloth involves two main colors: black and white.
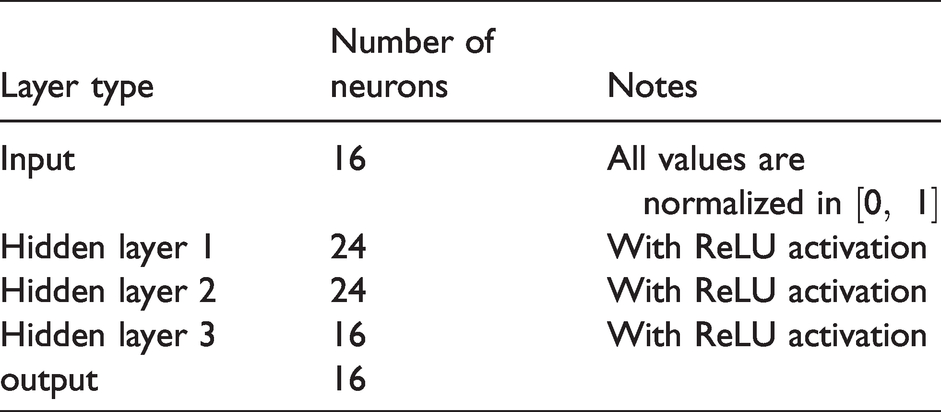
The categorical data are processed with the MLP model that consists of three hidden fully connected layers (FCL). The input is a vector of 16 variables (
The detailed structure of the used MLP network is described in Table 1. Each hidden layer comprises a FCL followed by a rectified linear activation function (ReLU). The ReLU activation is widely used due to its simplicity yet robustness against the gradient-vanishing problem that hinders the deeper network from converging. The proposed MLP adopts 24 neurons for the first two hidden layers from an original 16 values input vector to extract interconnected features on the categorical data. The number of neurons, 24, was empirically selected after testing different numbers of neurons.
The detailed architecture of the proposed MLP
CNN: feature extraction of the time-series data
A 1D CNN is employed to process time-series retailing data. The network is composed of four dilated causal 1D-convolutions to extract the diverse features from time-series data. Each convolution has an increasing (doubled) dilation rate, increasing the receptive field ([1, 2, 4, 8]).
The FCL interprets the features extracted by the convolutional part of the model. The flatten layer converts the output from the convolutional layers into a single one-dimensional vector to fit the FCL. Table 2 shows the detailed structure of the proposed CNN. As shown in Table 2, four 1D-convolution layers are used (denoted 1DConv). All 1D convolution layers share common parameters such as a Kernel Size of 3 and a stride of 1 with causal padding.
The detailed structure of the employed CNN
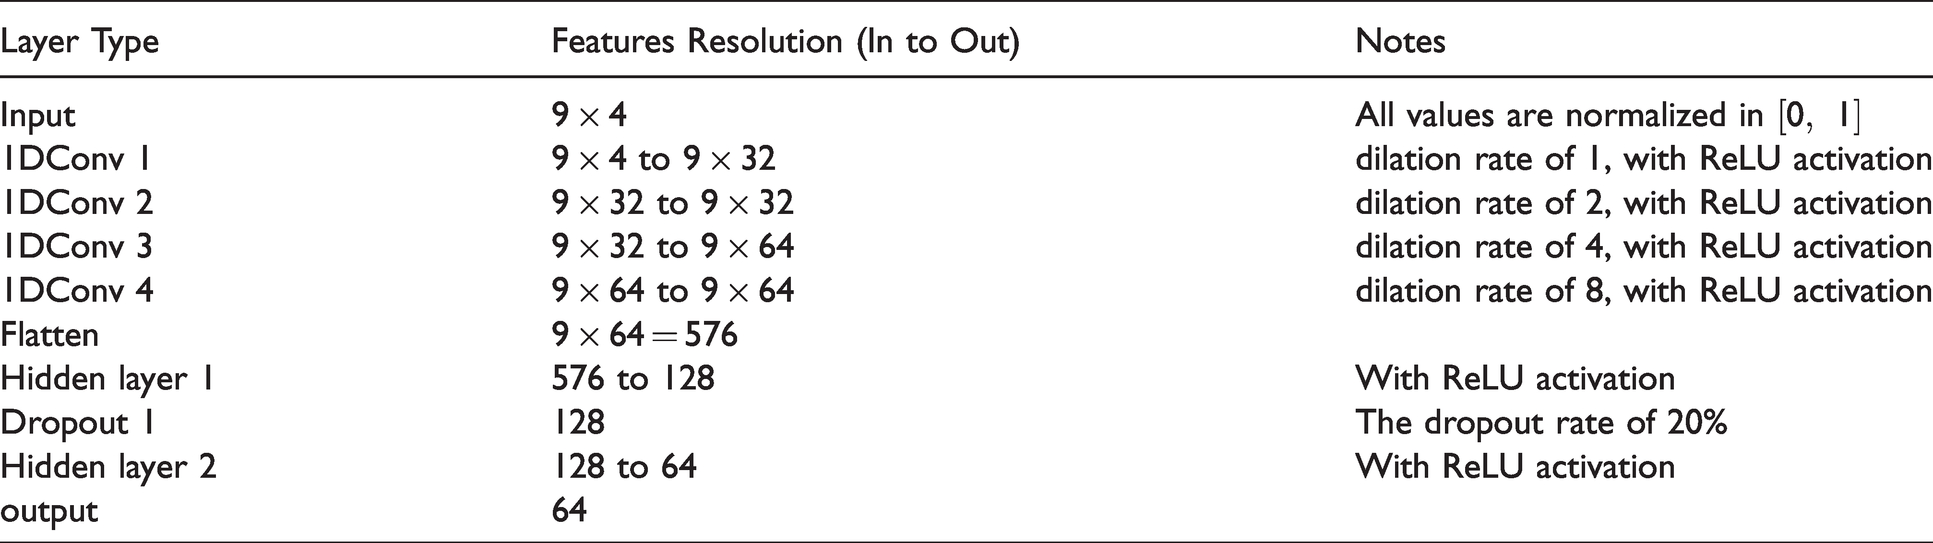
The input data of the CNN model is a subset of four time-series. The retailing data are sampled in weeks for a period of 2 years from 2018 to 2019. For each week of the year, the amount of the sold specific clothing is given along with the information of price and the fact if it was sold during a promotion week, as follows:
Sale_count: indicates the number of the sold specific clothing during the current week. Note that we assume the weekly sales range in Promotion_period: is a binary indicator, where 1 means the current week is the promotion period, and 0 means otherwise. Clothing_price: indicates the price of the clothing during the current week. The prices range in Holidays_period: is a binary indicator, where 1 means the current week is the holiday period (school or public), and 0 means otherwise.
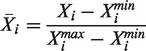
These four time-series data are normalized with the corresponding min-max range and then fed into the CNN as input data.
Feature fusion
The output vectors from two subnetworks, MLP and CNN, are merged via a concatenation layer. Then, the merged vector is processed with the final FCL to obtain the sales prediction score. The output of the CNN (modeling the time-series data) is a 64-features 1D-vector, while the output of the MLP (modeling the categorical data) is a 16-features 1D-vector. Accordingly, the dimension of the combined 1D-vector is 80-features.
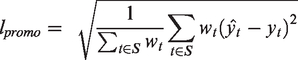
Promotion-aware loss function
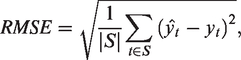
In this paper, a promotion-aware loss function is proposed based on the root mean square error (RMSE) that drives the model to be more performant on sales forecasting during the sports clothing promotion period. The promotion-aware loss is defined as follows:
The experimental results
Experimental dataset
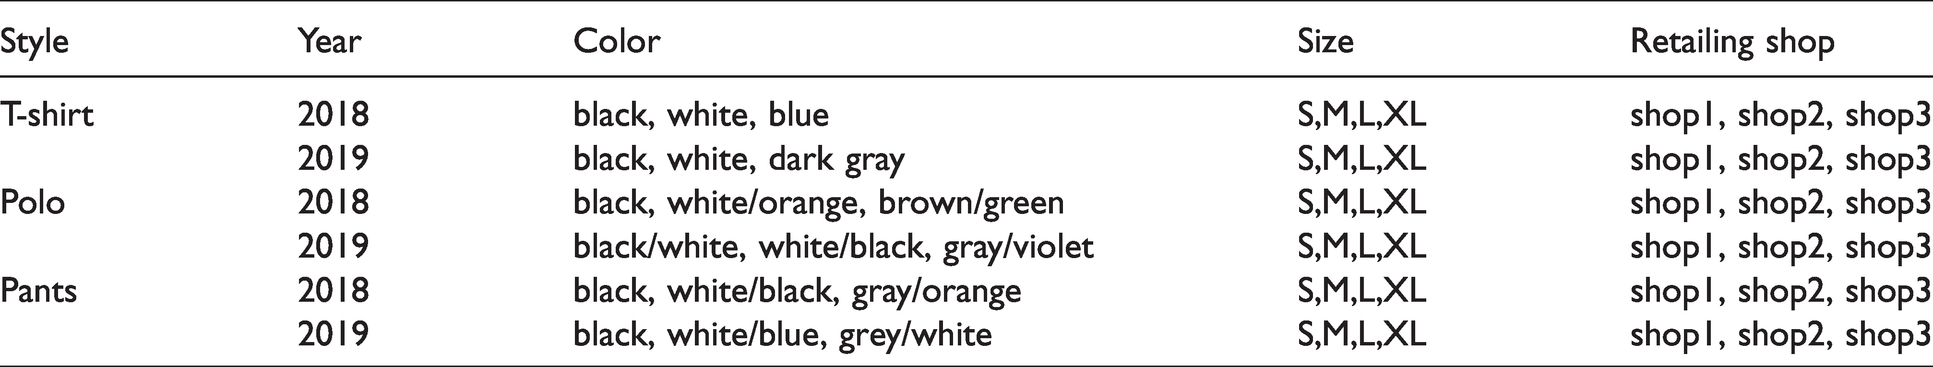
We have collected sales data of three main-lines styles: T-shirt, Polo, and Pants (Style A, Style B, and Style C) from a specific sports brand in three different shops located in China. These three shops (labeled shop1, shop2, and shop3) are of different sizes to model the full spectrum of shop sales. The labels shop1, shop2, shop3, refer to a small, medium, and big size, respectively. The collected retailing data are summarized in Table 3 and are composed of:
An overview of the dataset: three selected sportswear products
Sale-units per week.
Sold-prices per week.
Metadata of the sportswear clothes (size, colors, etc.).
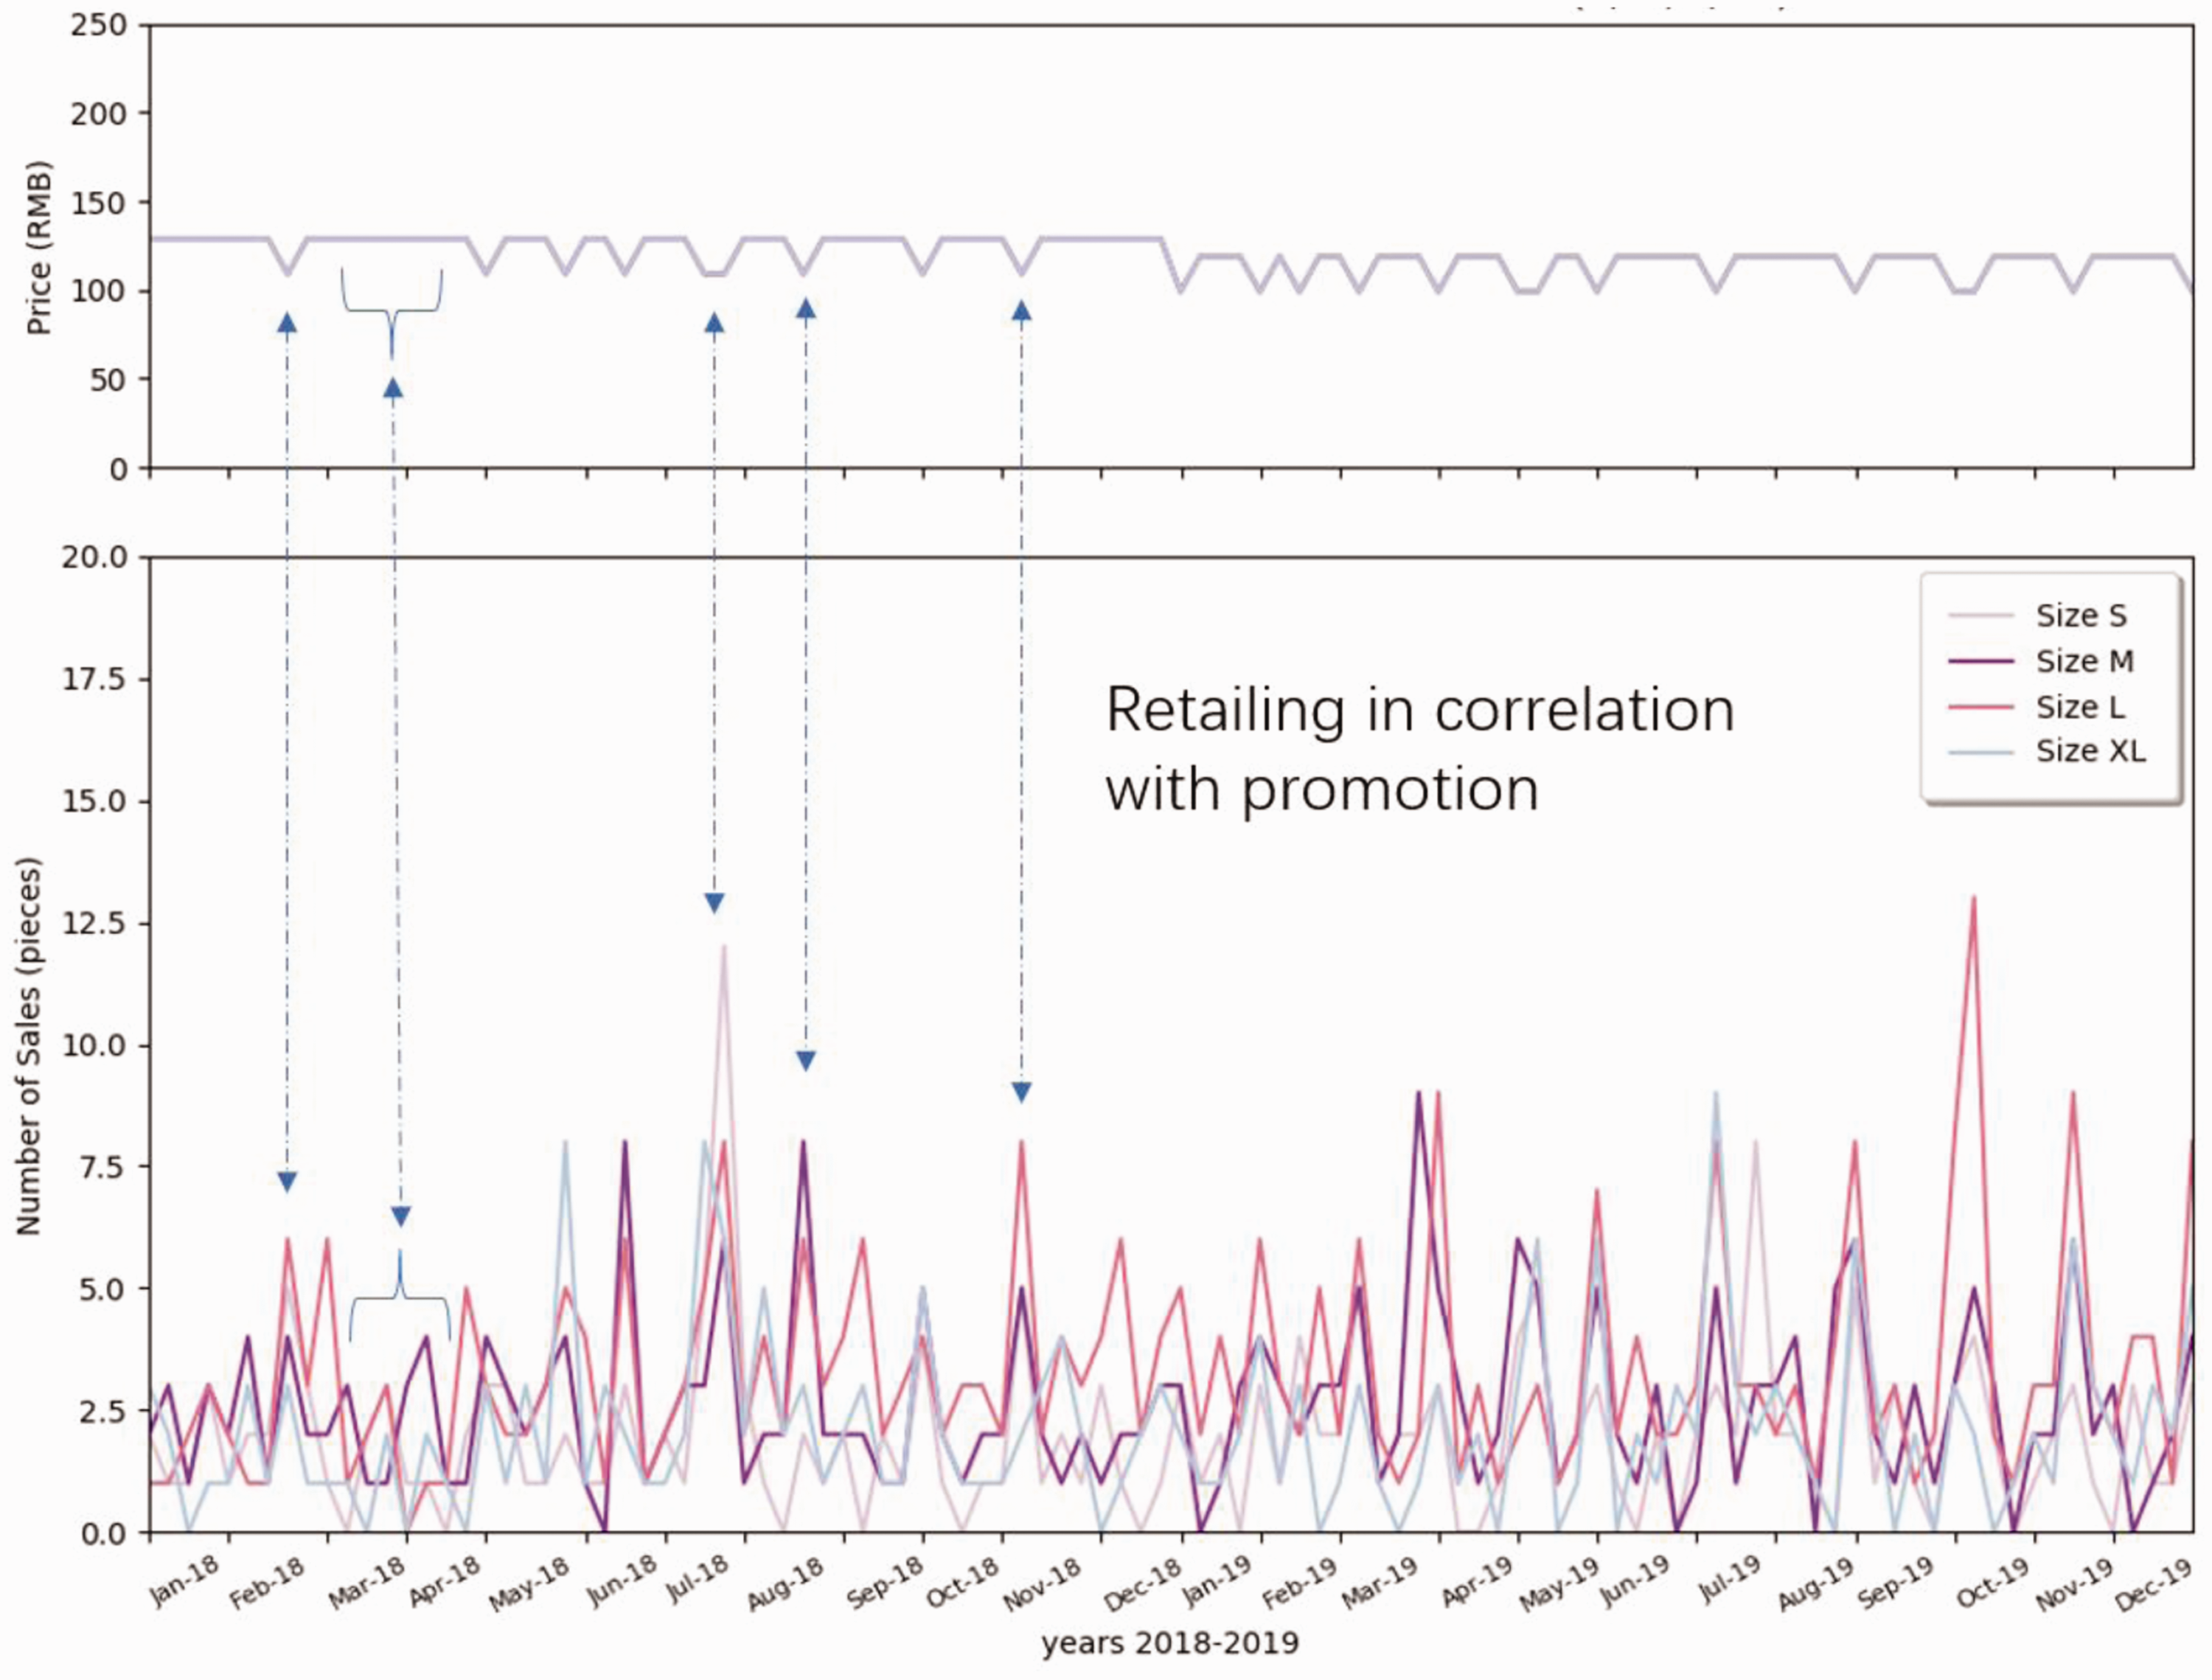
The examples of retailing data are illustrated to visualize the customer behavior in terms of size, promotion, and different styles. As shown in Figure 3, T-shirts were sold at a similar price from 2018 to 2019, except for the promotion period. The promotion of this brand was highly linked with public holidays, commercial holidays, and school holidays. During the promotion period, the number of retailing was increased for most sizes. Therefore, it is difficult to distinguish whether the sales behavior is due to holidays or promotion of the brand. In addition, consumers’ purchase choices regarding the size do not depend on promotions. Figure 4 illustrates different styles of clothes retailing curves in the function of promotion weeks. As shown in Figure 4, tops (T-shirts and Polo) were sold more than pants, which is matched to the general retailing experience. It is known that consumers, especially male customers, tend to buy tops over pants. Most of the retailing peak was related to holiday promotion. Figure 5 shows that the retailing amount of each shop was rapidly increased during holidays and promotion periods. The curve for the T-shirt shows that it was seasonally well retailed in both summers 2018 and 2019. Figure 6 depicts the retailing curve of the L-size T-shirt with three different colors in terms of promotion and holidays for shop2. As shown in Figure 6, for the same style of different colors, the retailing peak dramatically increases in some promotion weeks. However, in other promotion weeks, the sales volume was not improved. The amount of retailed Style A (T-shirt, size L, all color types) is summarized in Figure 7. It is hard to see a repeated retailing pattern in the correlation of months directly.
Retailing data for Style A (T-shirt), Black, all sizes (S, M, L, XL) in shop2.
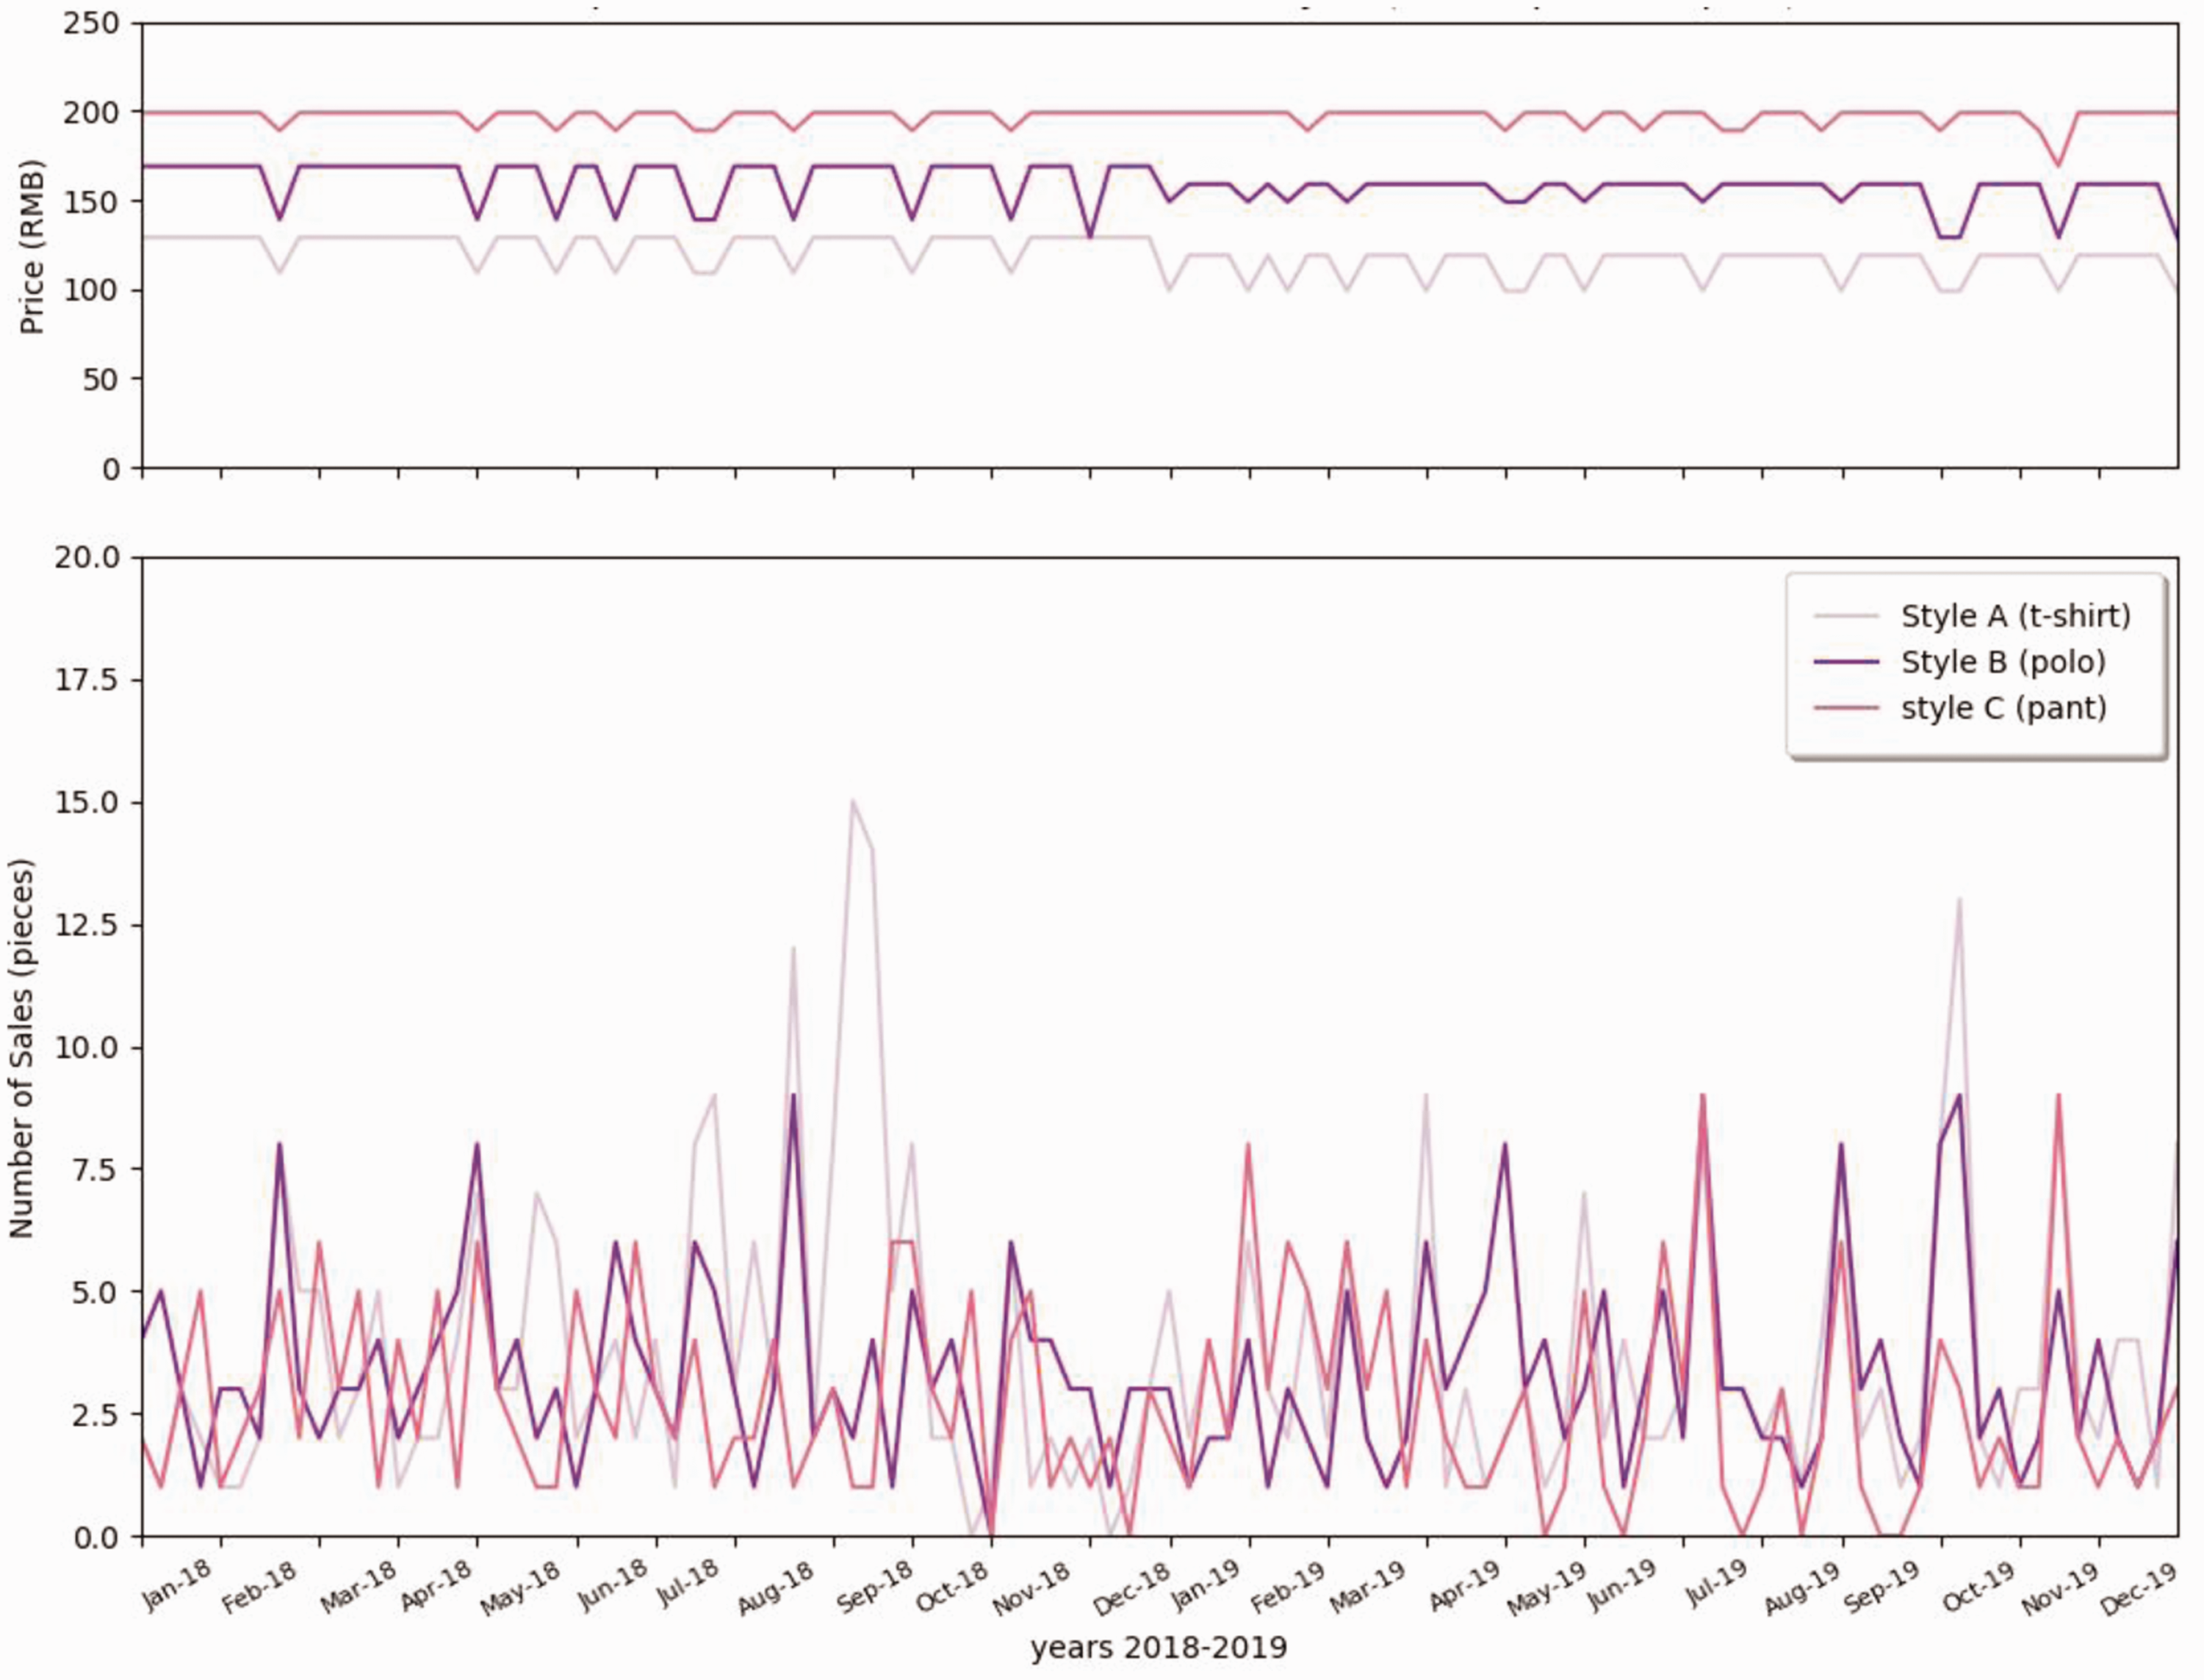
Retailing data of all styles A, B, C (T-shirt, Polo, Pants), black, and size L in shop 2.
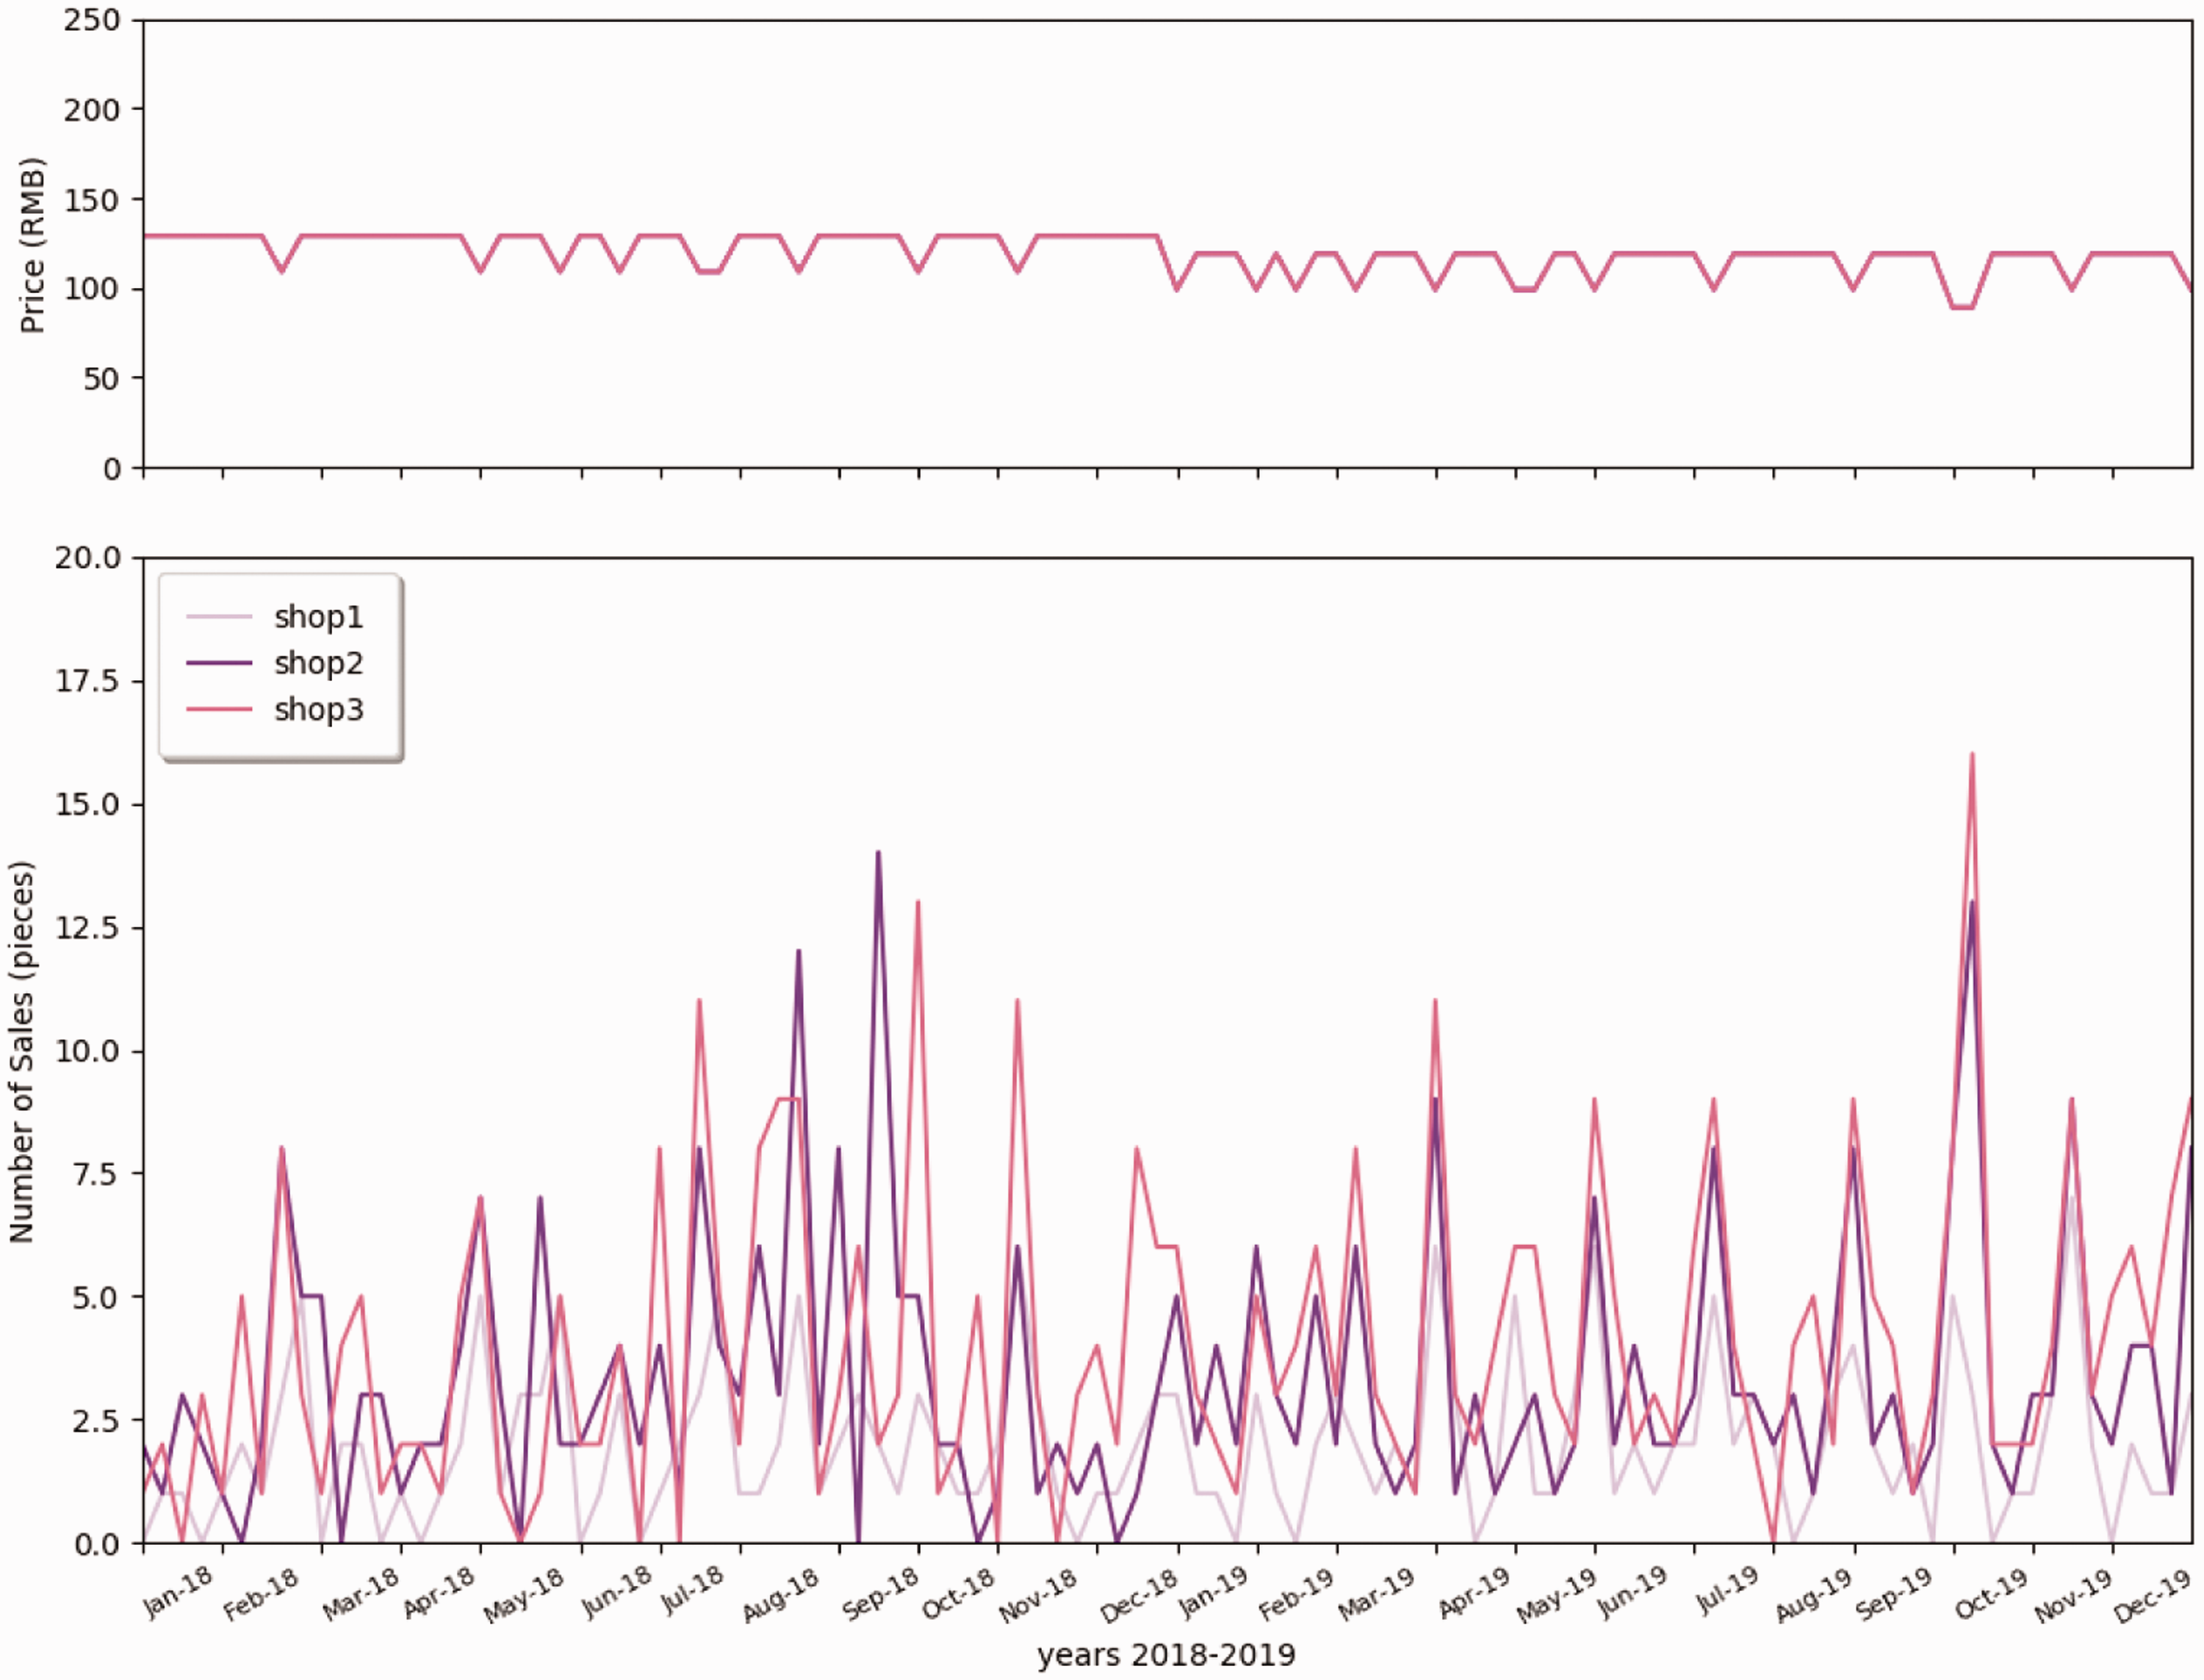
Retailing data of Style A (T-shirt), Black, Size L in shop1, shop2, and shop3.
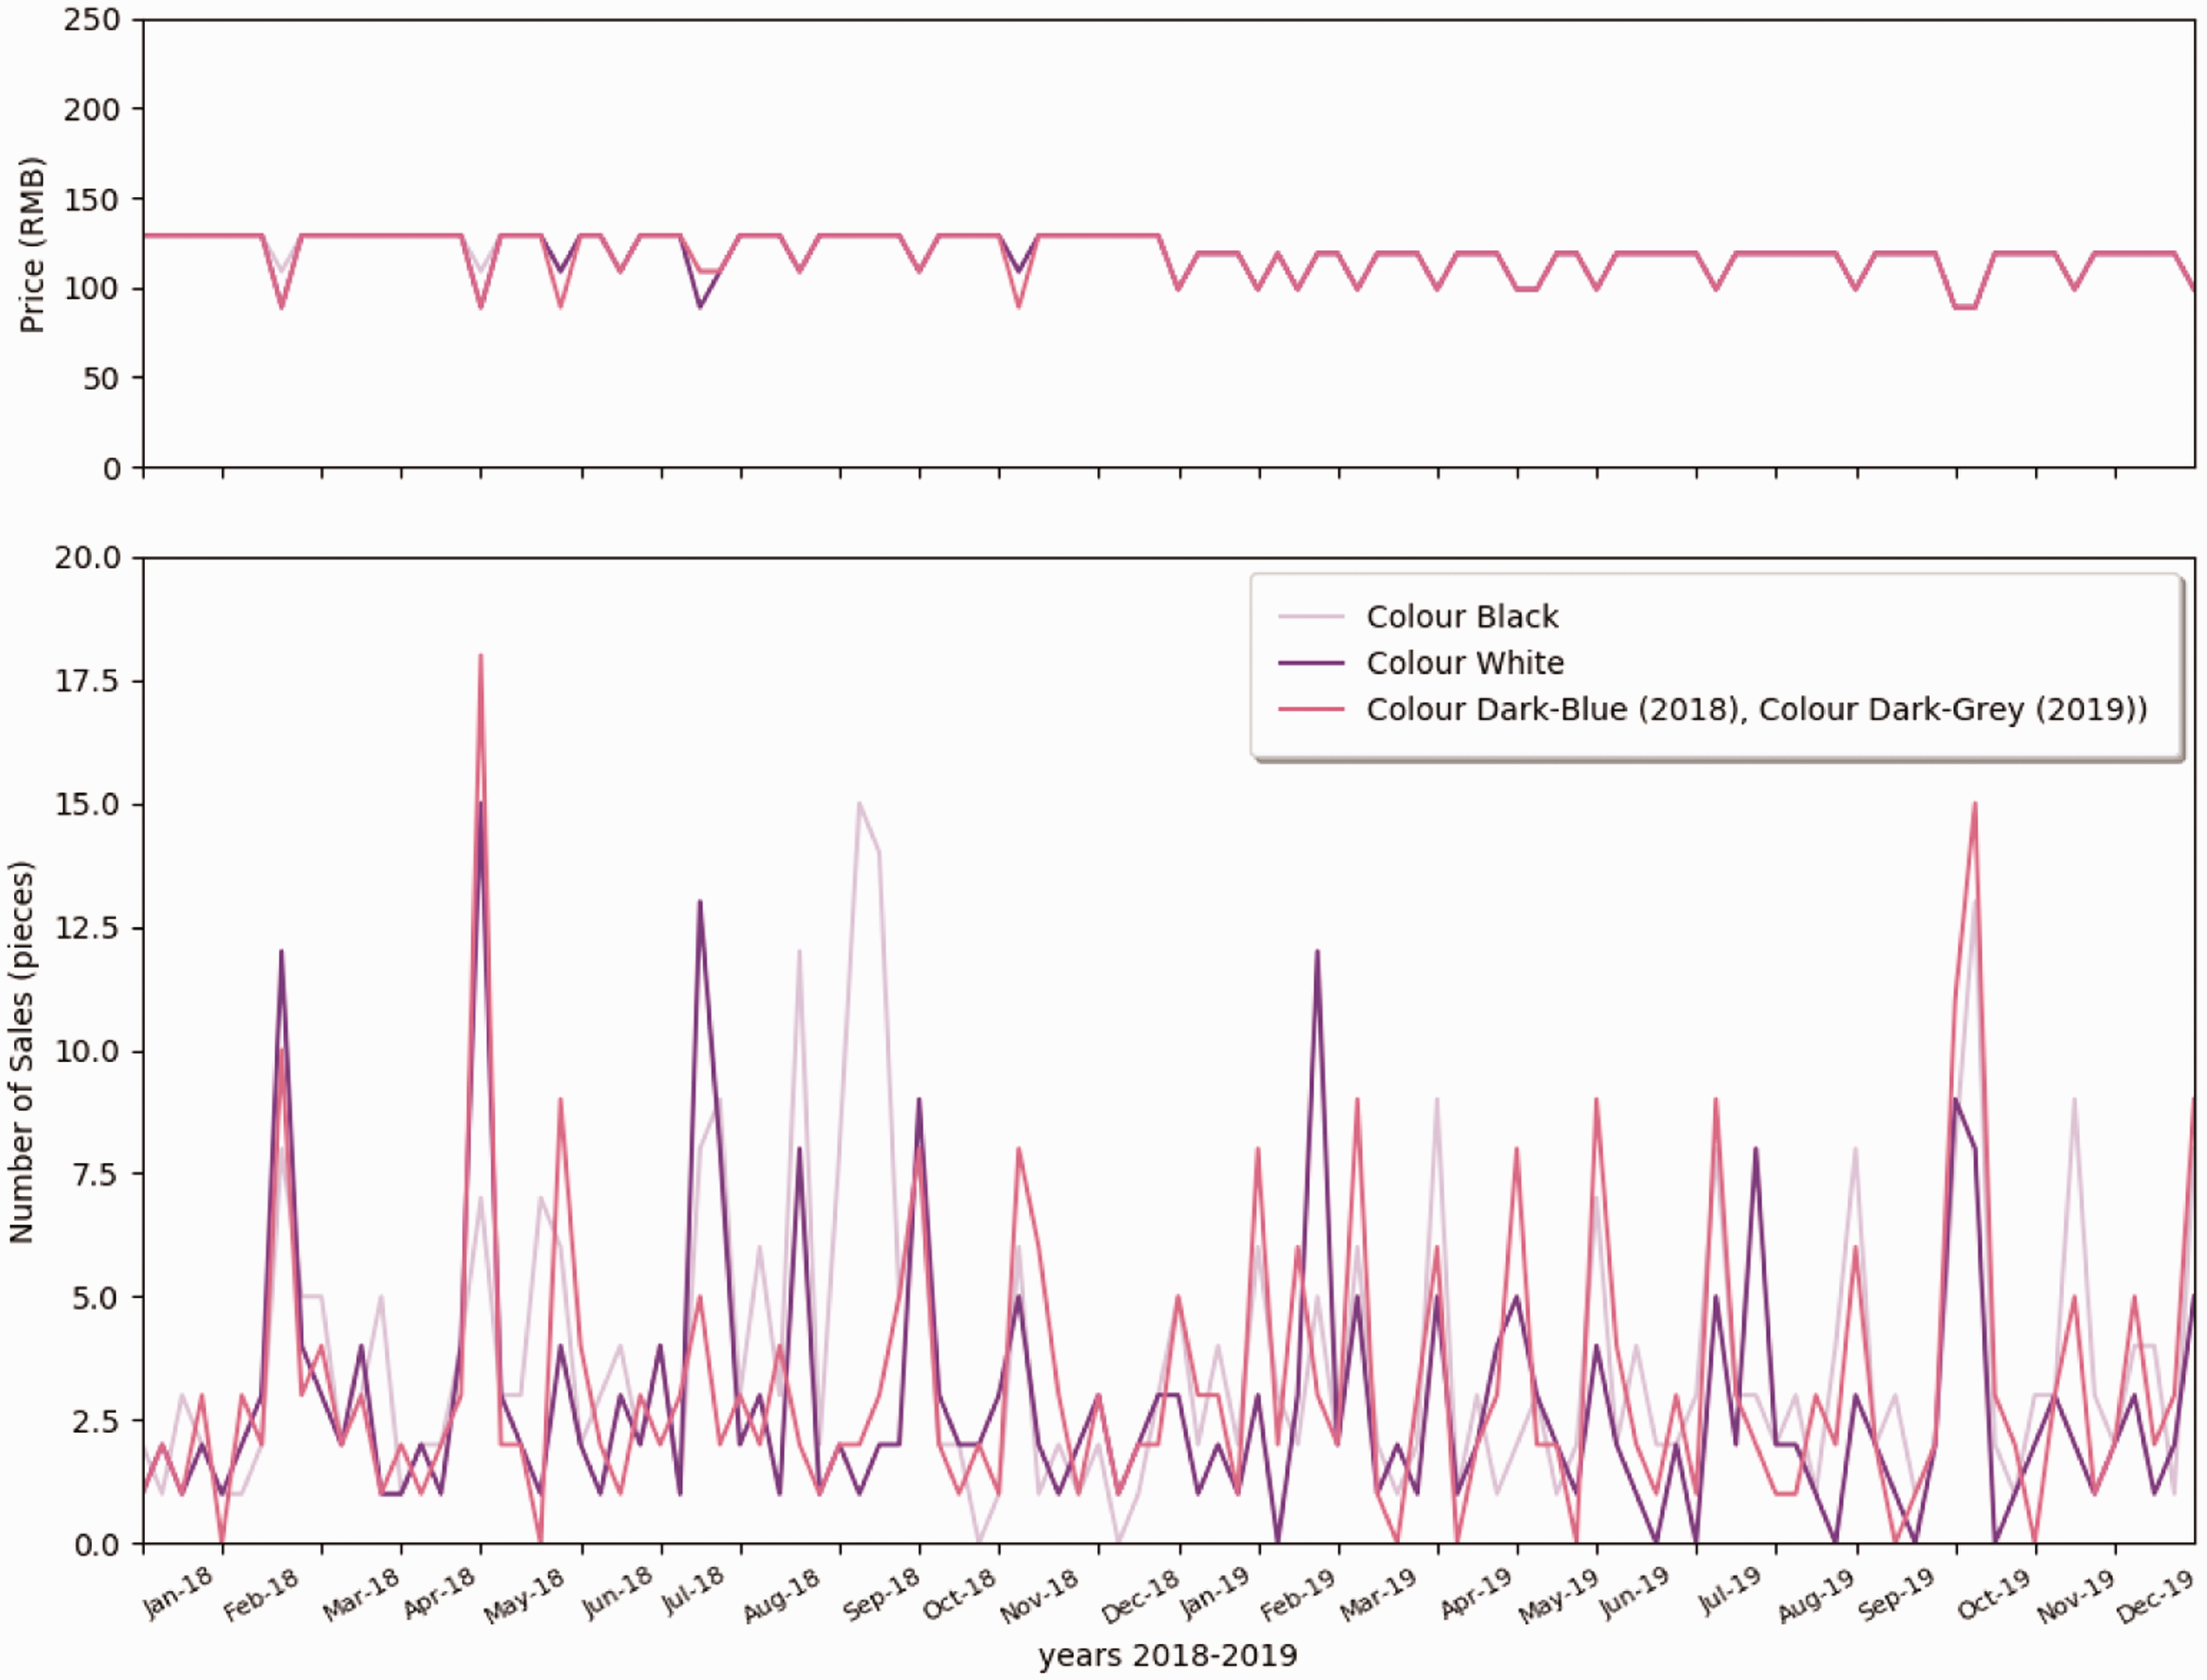
Retailing data of Style A (T-shirt) in different colors (Black, White, and Dark blue (2018)/Dark Gray (2019)), Size L in shop2.
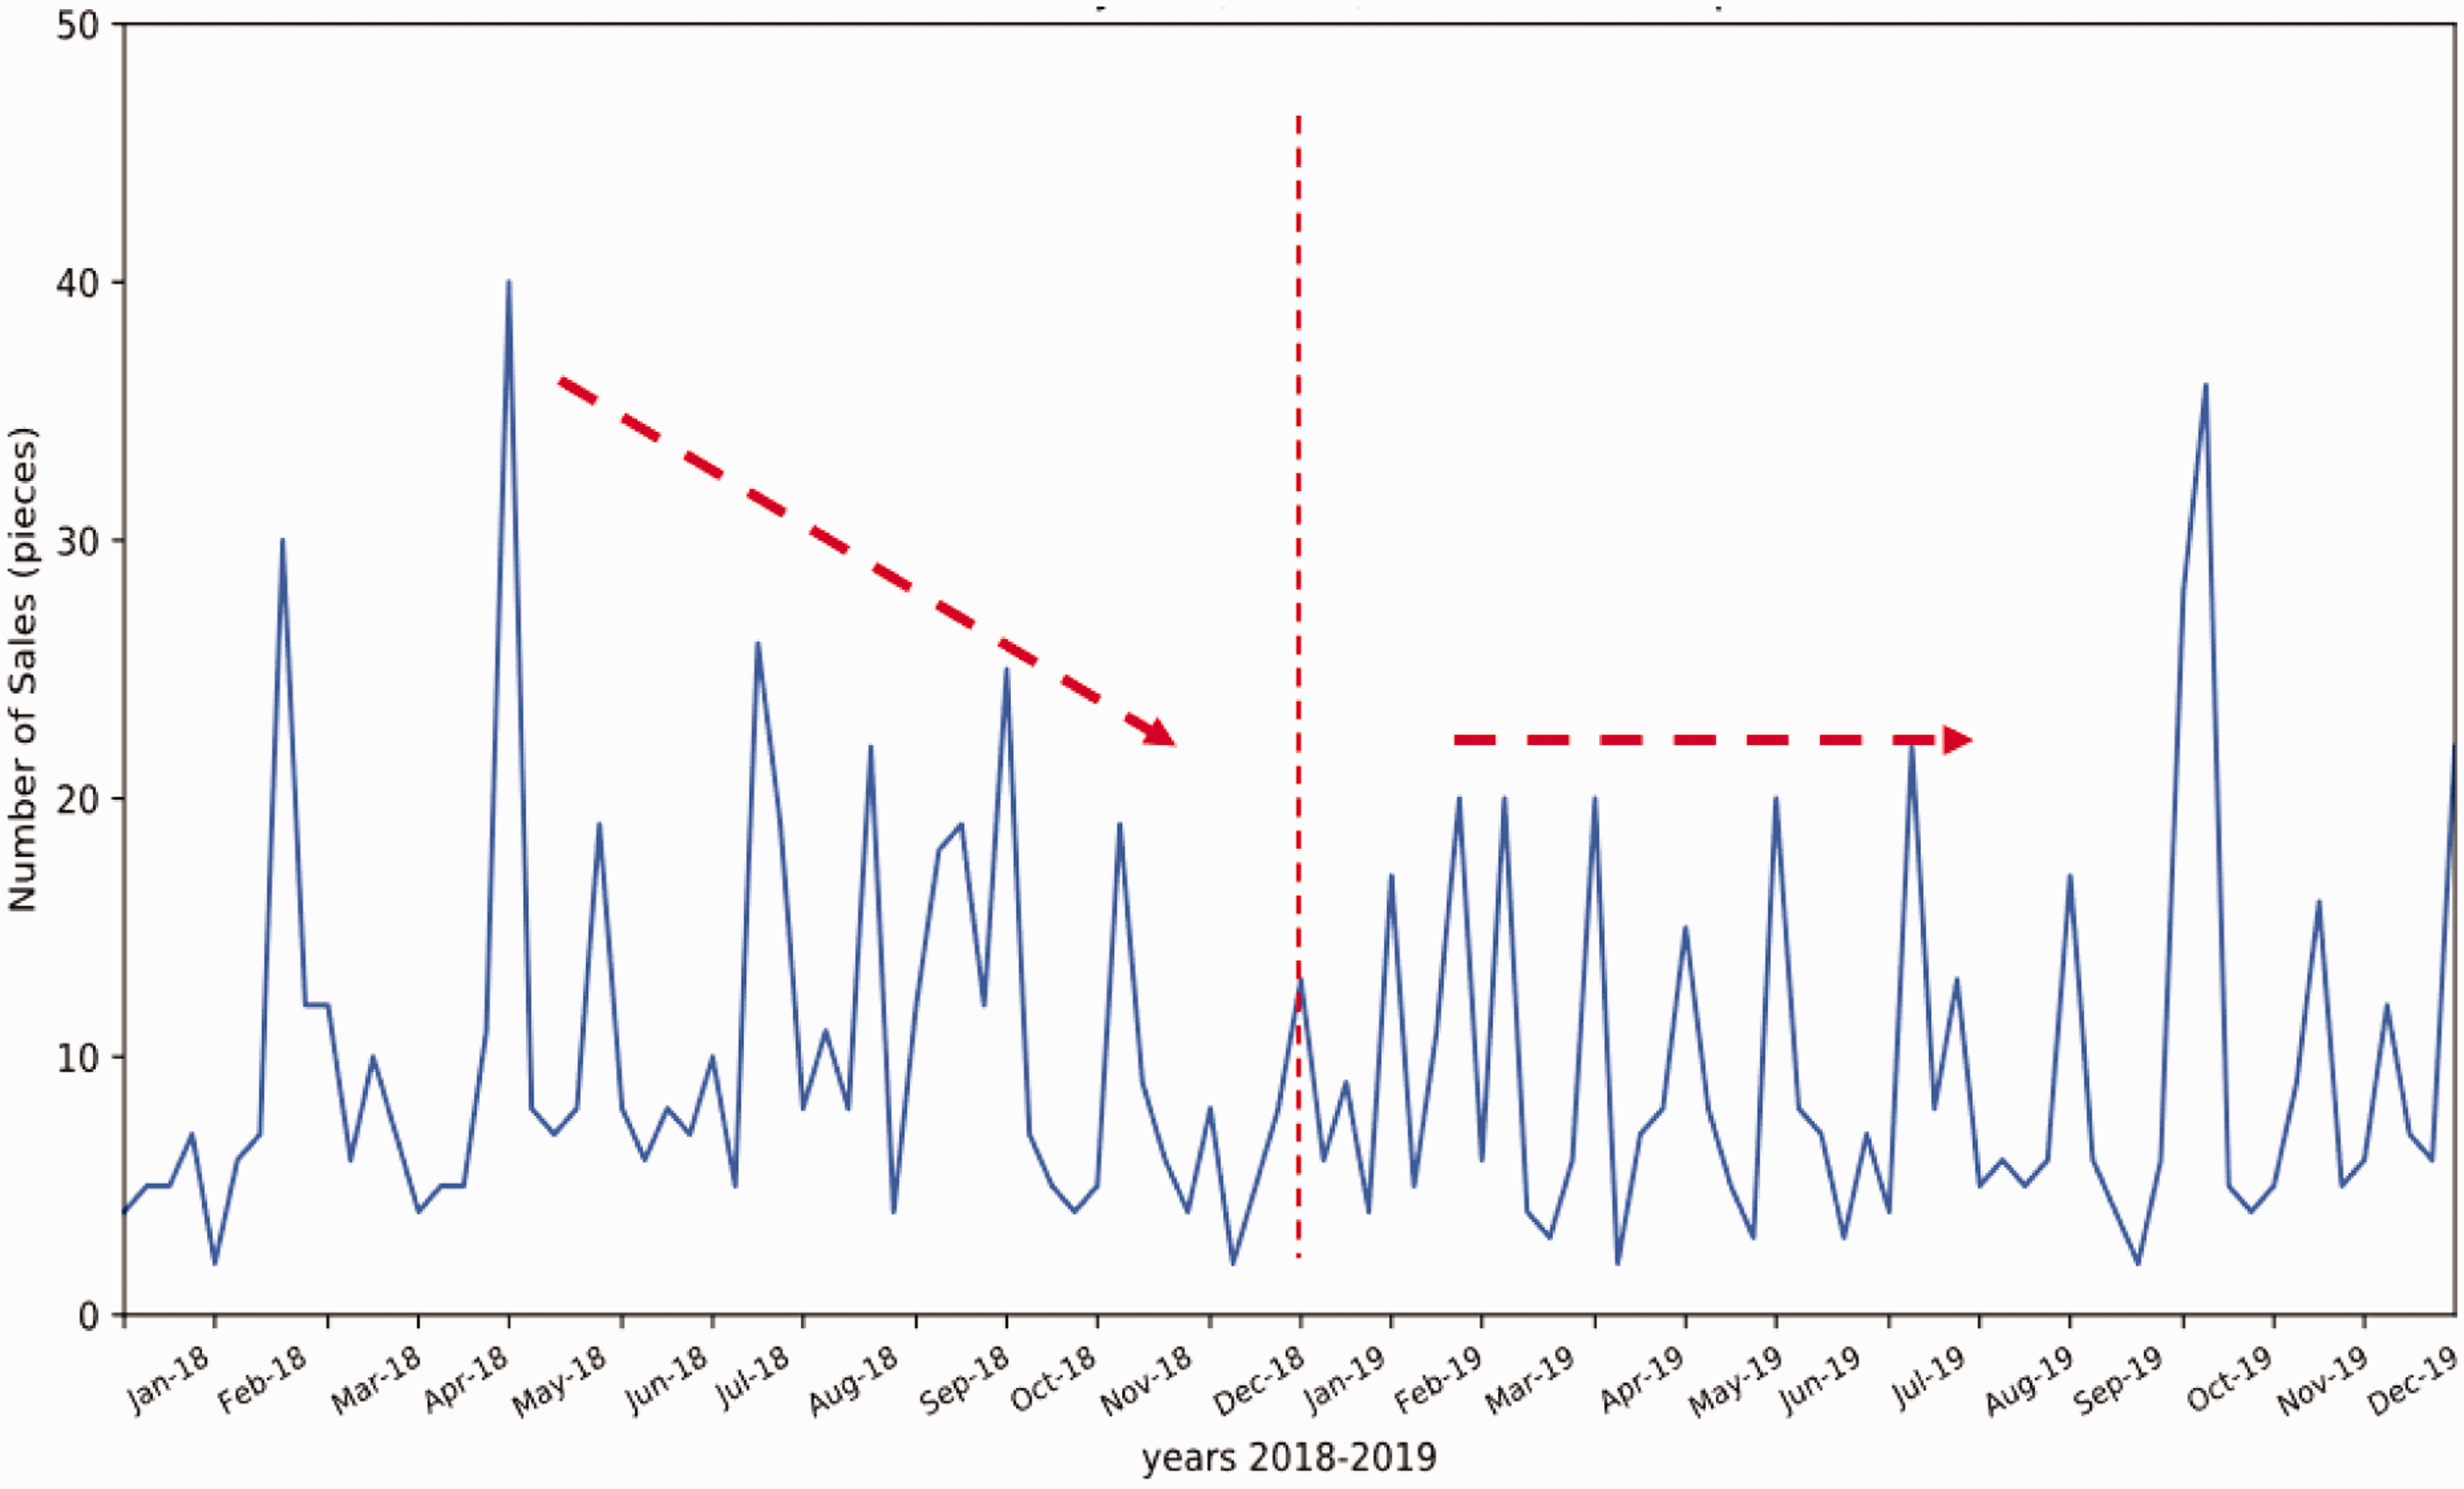
The sum-up of retailing data of Style A (T-shirt) all colors (Black, White and Dark blue (2018)/Dark Gray (2019)), Size L in shop2.
The above sales data, together with clothing marketing experience, show that promotion/holidays, retailing price, clothing color and shop size/location, type of clothing are important indexes of purchasing behavior. However, it is difficult to quantify and summarize the tracking retailing prediction and how each index impacts the retailing number.
Experimental dataset split
The performance and robustness of the proposed method for sales forecasting are evaluated through qualitative evaluation and comparisons. The compared methods are autoregressive (AR), MA, and ARIMA methods. The compared methods were implemented using the Statsmodel library. For a fair comparison, the parameters of each model are tuned to give the least forecasting error along with our full test sets. To achieve this, we use a brute-force grid searching minimization for parameters. An iterative rolling forecast mechanism was used, in which each statistical model is recreated with the full data history of the current clothing after each new observation (forecast). Each test set is chosen in such a way that at least 6 months of data are available for training. For each test set, and for each single week prediction, all three statistical models are regenerated using all available previous sales data in an iterative rolling forecast manner. This is a small advantage compared with training sets used for the proposed method where no test data are leaked during the training phase. In this way, a direct comparison on forecast quality between statistical methods with the neural network method is possible.
The dataset is divided into three subsets:
Training data (70%): used for training models. Validation data (10%): used to validate the model for each epoch (excluded from training). The validation error is used to adjust the learning rate during the training process. Test data (20%): used to compare the models.
As the lifecycle of our sport/team-wear clothing ranges from 1 year to 2 years, the dataset was randomly split to ensure that at least 4 months of sale units of a specific clothing item belong to the training set. Random split selection is a good way to evaluate methods when dealing with big data. All results presented in this paper were validated with 10 differently split datasets leading to the same forecasting effectiveness. This way enables confirmation of a fair comparison with other statistical methods that require a sale unit’s history to make predictions. The split of the dataset is visualized in Figure 8, in which the red denotes the testing set used for specific clothing.
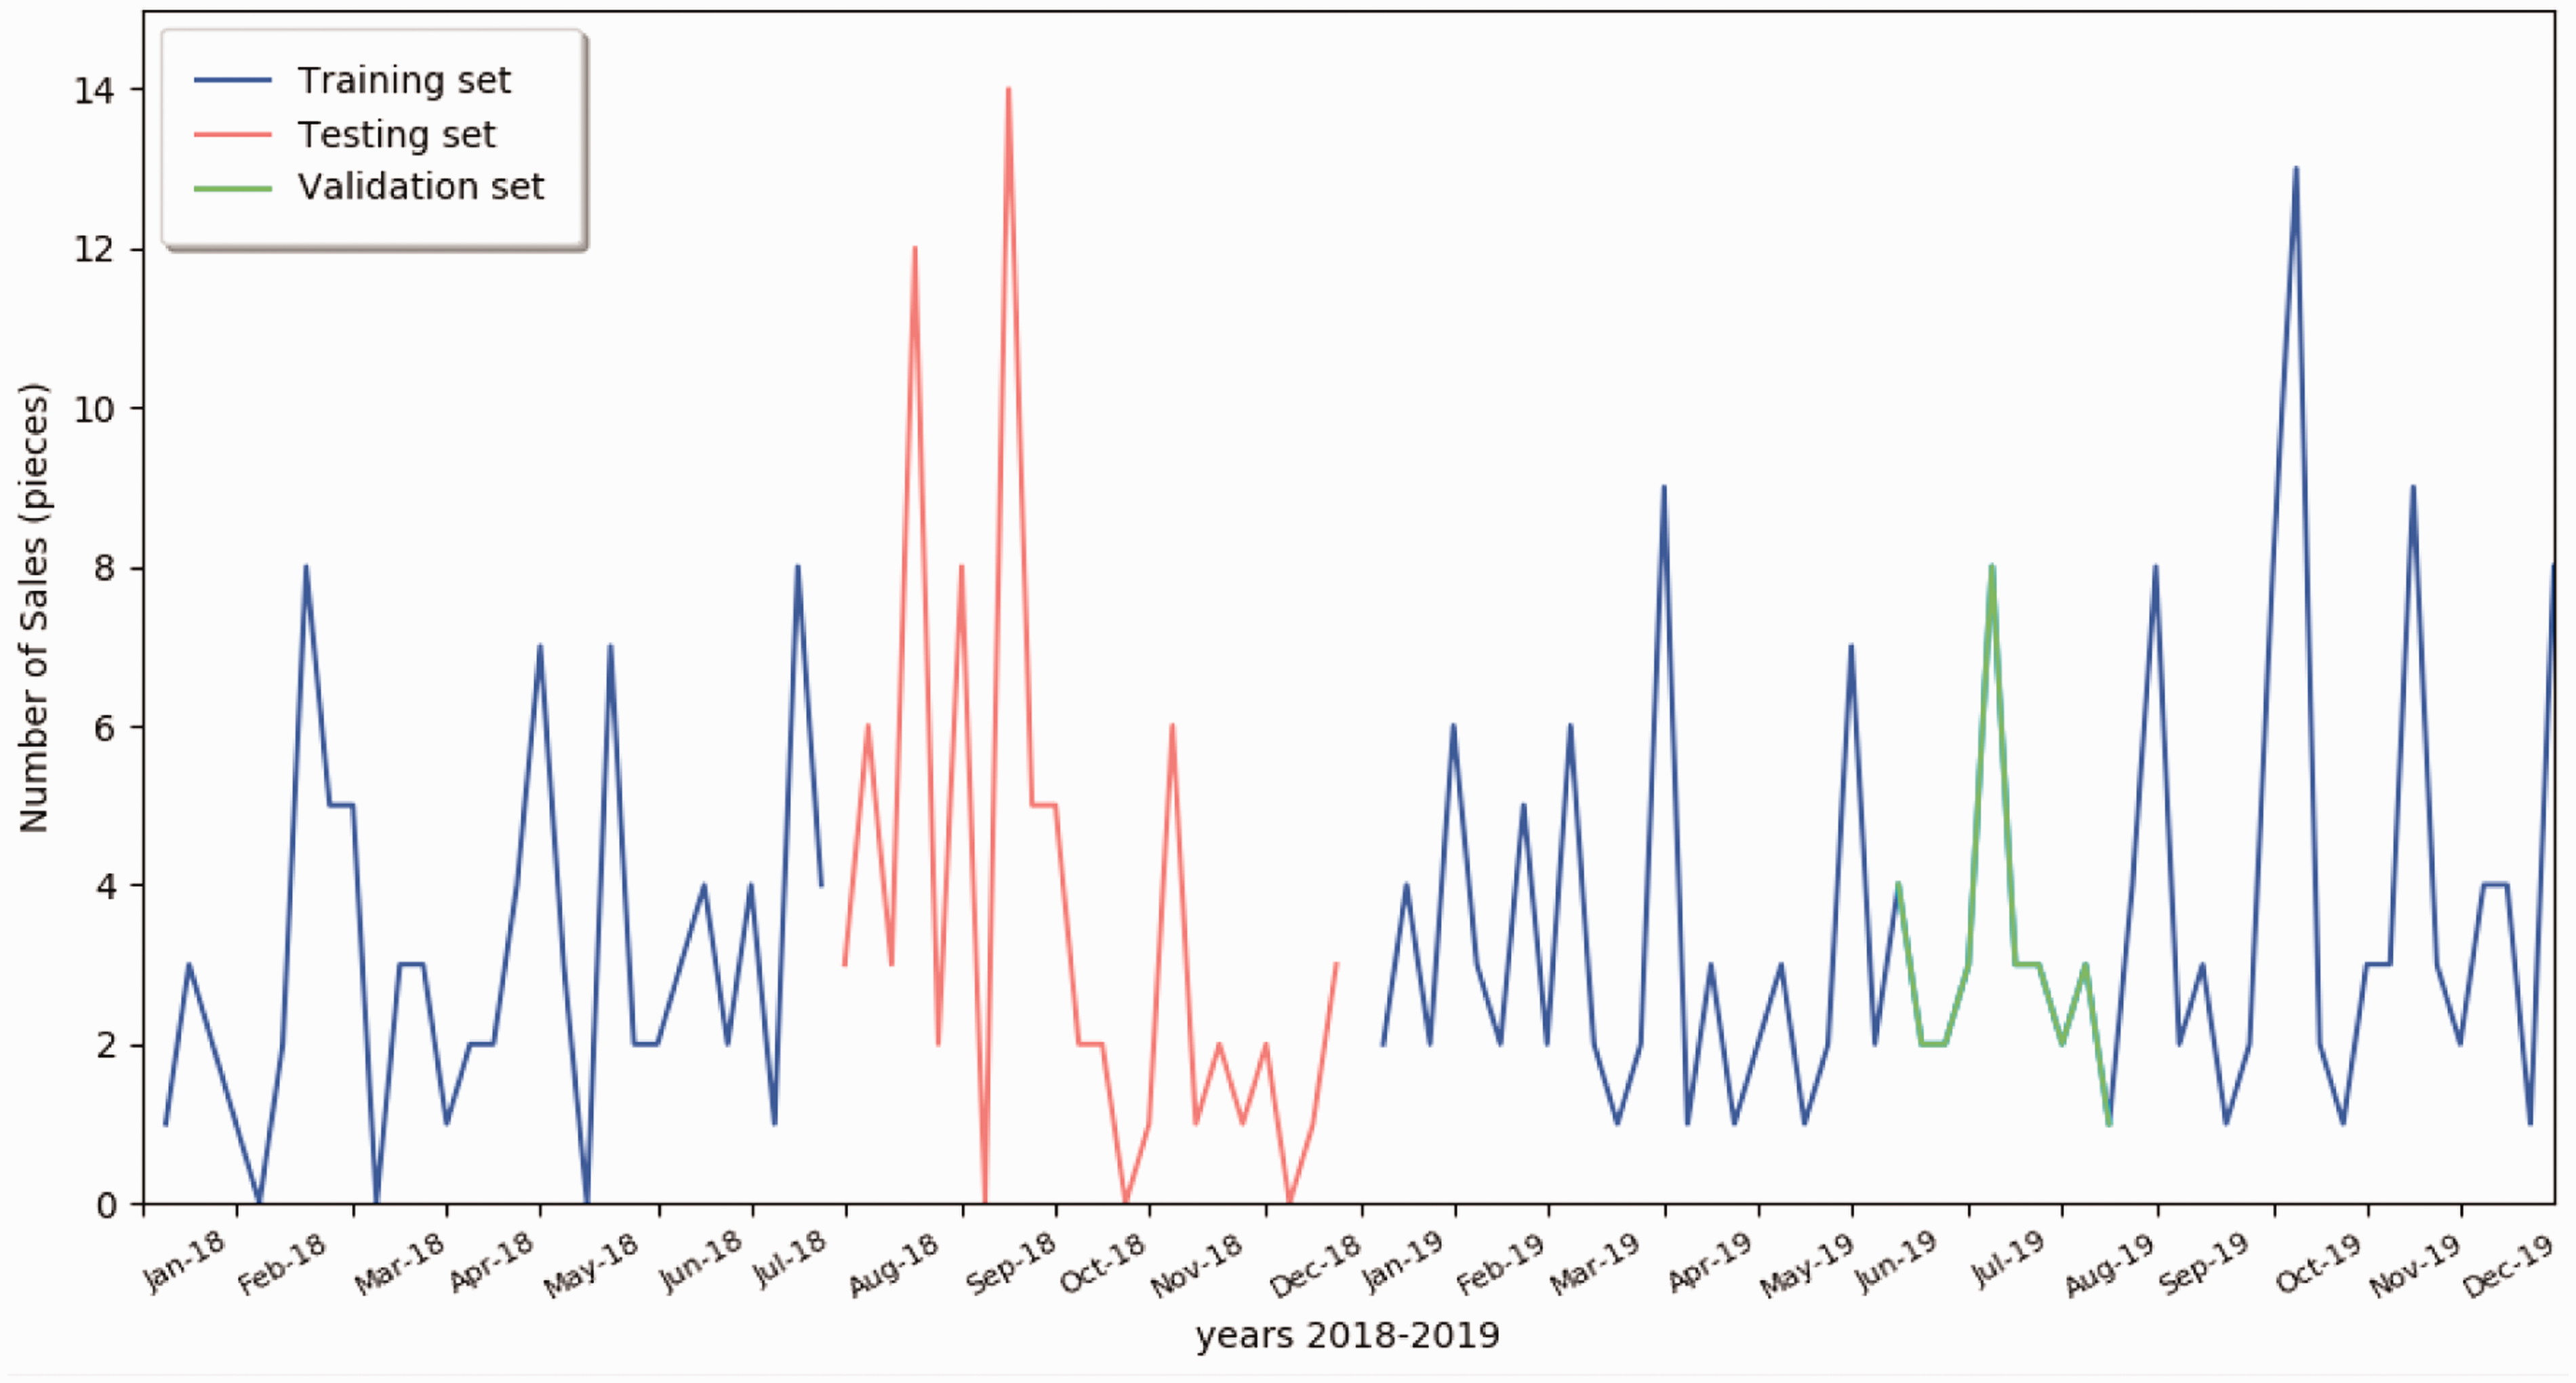
Dataset split of the black T-shirt (Size L) in shop2.
Quantitative comparison with state-of-the-art statistical approaches
The proposed method is compared with three statistical models for the test sets. Figure 8 shows the complete sales data of black L-size T-shirt from shop2; the test, validation, and training sets are denoted as red, green, and blue lines, respectively.
Figure 9 compares four methods, AR, MA, ARIMA, and the proposed method, for the test set given in Figure 8. Note that the ground-truth curve of Figure 9 is exactly the same as the red curve in Figure 8 (period 07.2018–12.2018). As shown in Figure 9, the proposed method provides more aligned results to the ground-truth over the other compared statistical methods.
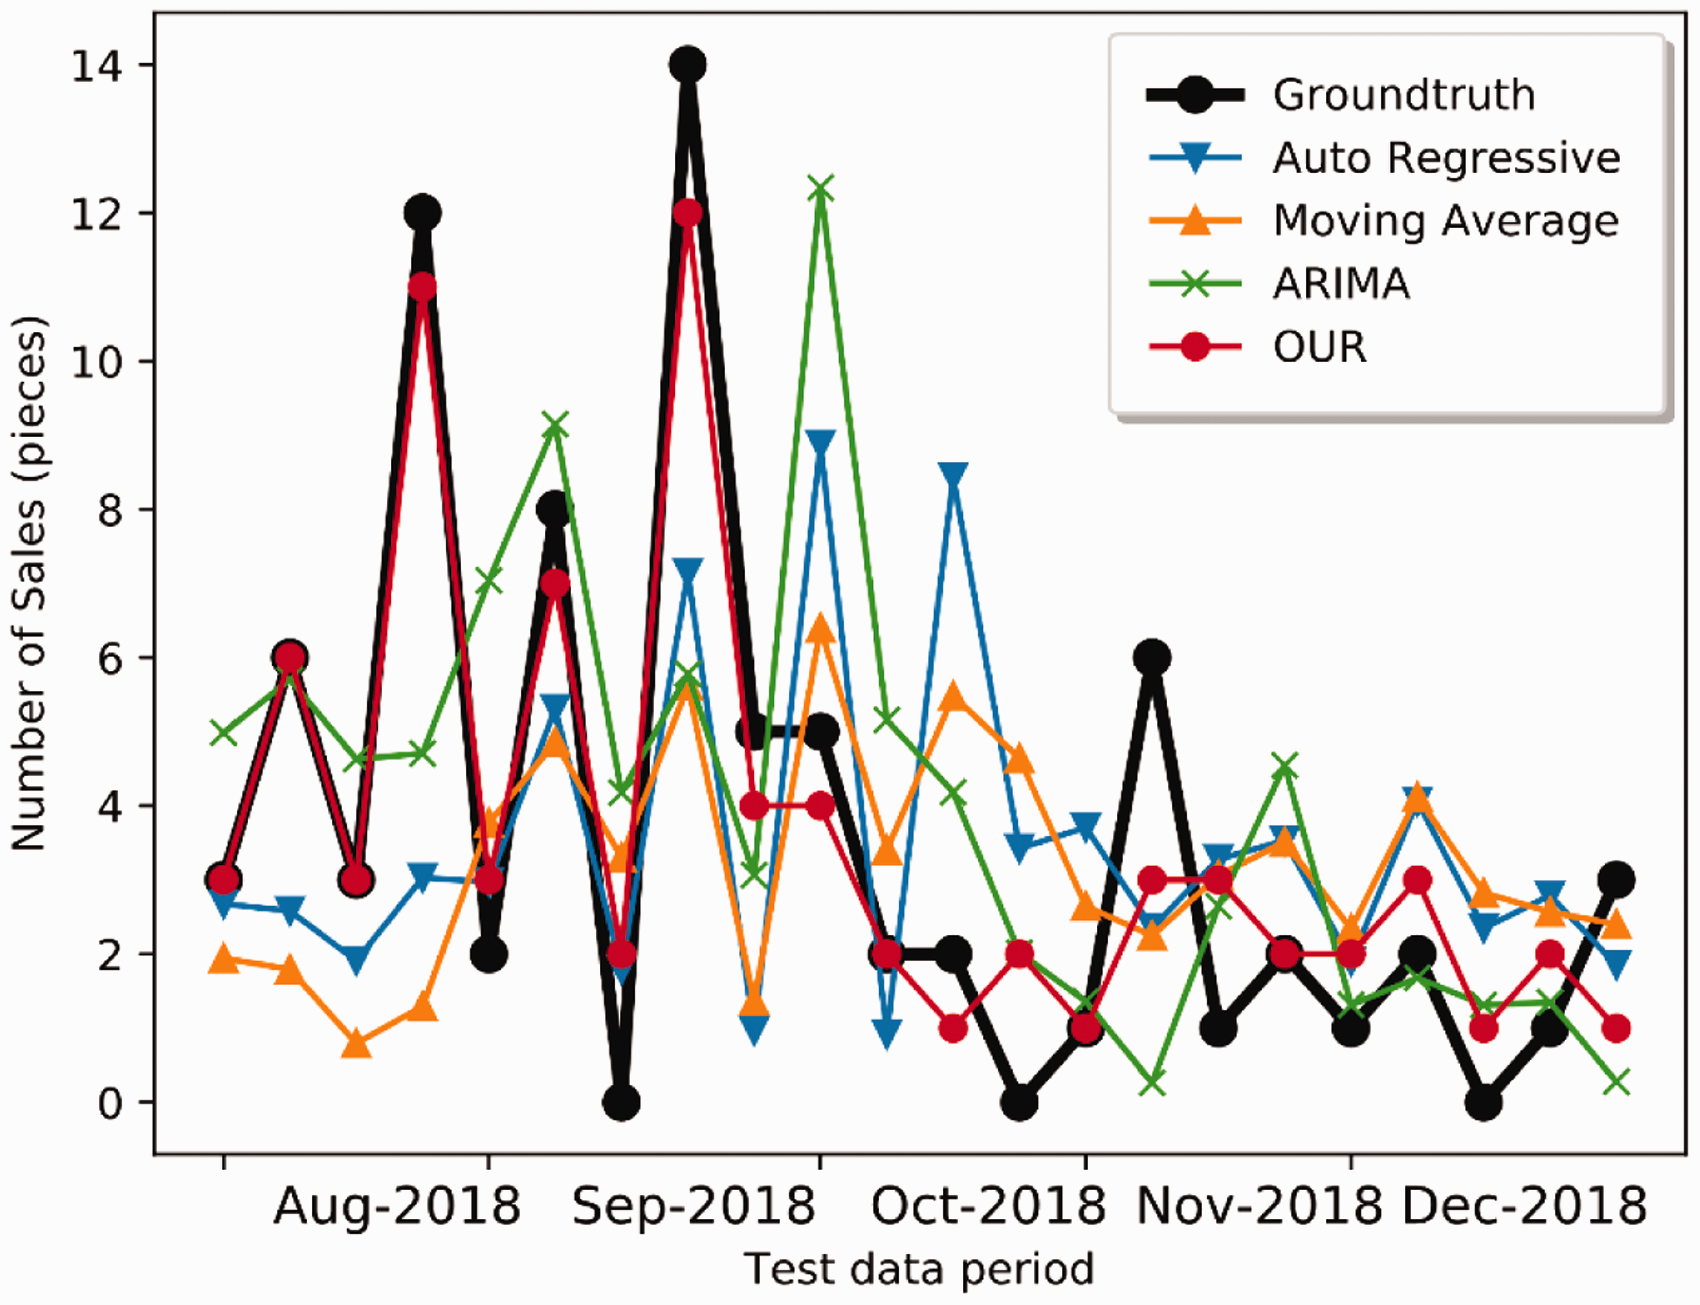
Comparison of different sales forecasting methods on the test data.
To quantitatively evaluate the proposed method, the following four statistical error metrics are computed for each method:
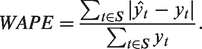
Min and Max error Mean and Std error RMSE Weighted Absolute Percent Error (WAPE)
The RMSE is defined as:
A quantitative comparison between the proposed method and the three statistical-based forecasting methods is summarized in Table 4. In the remainder of this paper, all following quantitative comparisons adopt the same way in reporting error statistics.
Quantitative comparisons for the test data of black L-size T-shirt in shop2. Bold indicates the lowest error for each error matrix
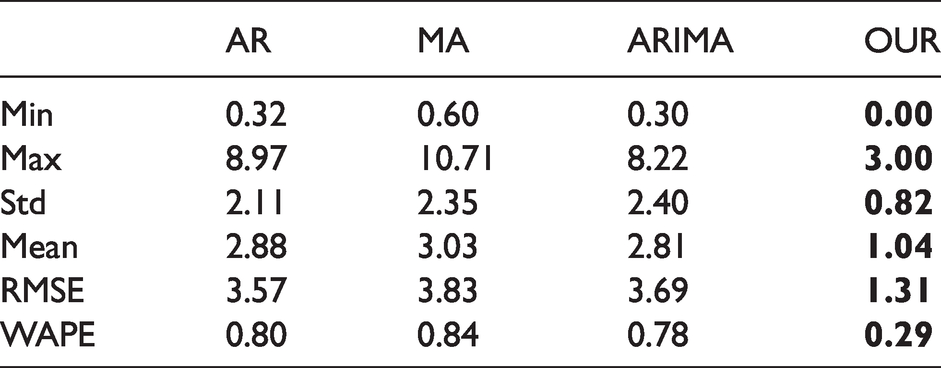
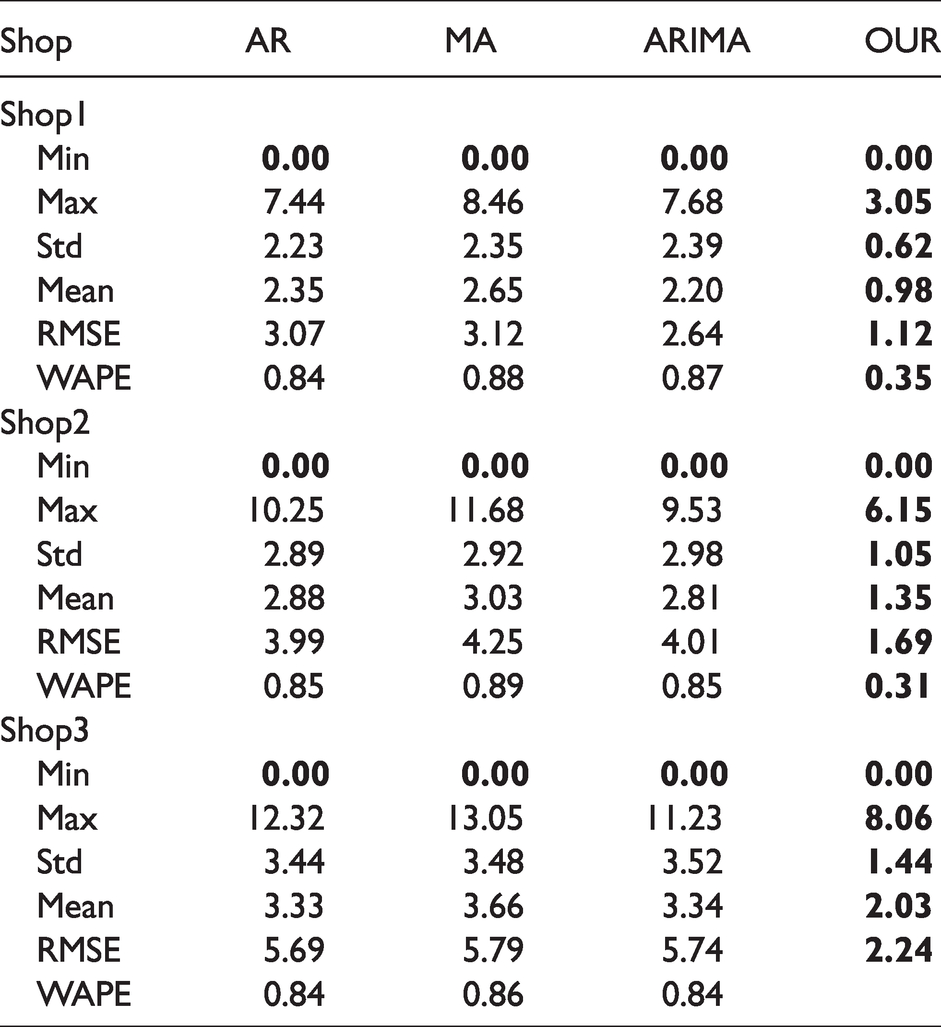
Table 5 shows the complete comparisons for the full test dataset. As shown in Table 5, the proposed method outperforms the other statistical methods for sale forecasting in terms of all the error matrices. It confirms that a hybrid solution that merges time-series data with categorical data can provide better prediction accuracy, mainly based on the robust and meaningful extracted features. From Table 5, the WAPE error rate of the proposed method is less than 35% for the complete dataset. Thus, the overall accuracy of the proposed method is higher than 65%.
Quantitative comparisons for three styles of all sizes and color sale forecasting errors in three shops. Bold indicates the lowest error for each statistic category
Evaluation of the importance of the metadata
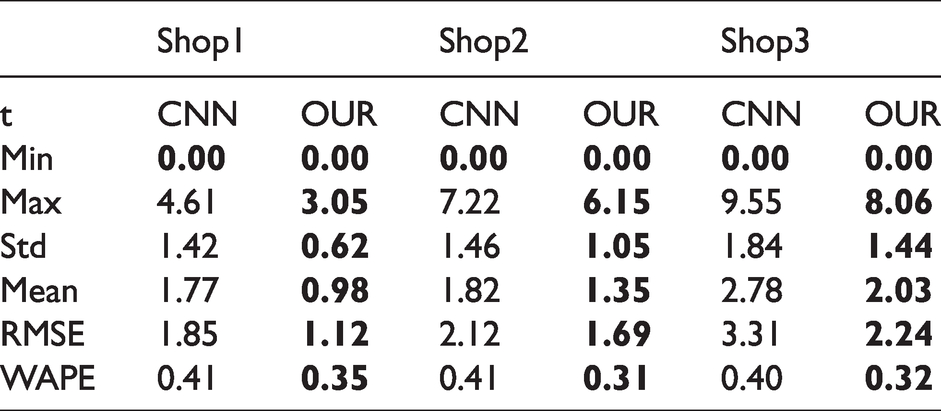
In this section, the proposed model is compared against the standard CNN-based sales prediction model to prove the advantage of the proposed hybrid solution. The standard CNN-based prediction model was trained using the same data and settings that were used to train the proposed hybrid model, including epochs, training parameters, and data split. Similar to the previous section, six error matrices were used to compare the prediction accuracy of both networks (Table 6). As shown in Table 6, the proposed model outperforms the standard CNN-based model, proving the advantage of the hybrid approach.
Comparison of the proposed hybrid model and the standard CNN-based model for all styles and sizes in three shops. Bold indicates the lowest error for each error matrix
Ablation study for the promotion-aware loss
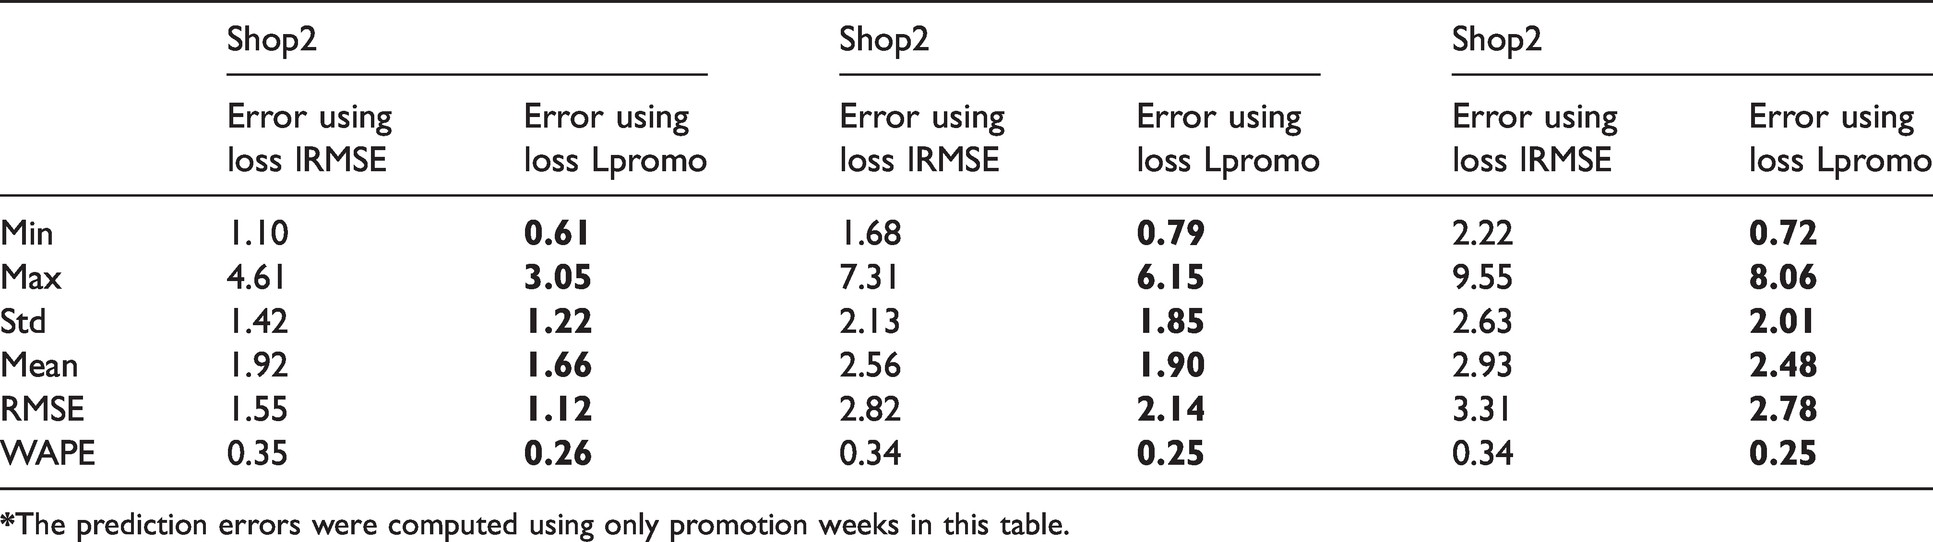
In this ablation study, the proposed promotion-aware loss is evaluated. As a basis network, the same network structure is trained using RMSE loss (
Prediction errors with two compared loss functions for three styles (all colors, all sizes) in three shops. Bold indicates the lowest error for each error matrix
Discussion
A set of qualitative and quantitative evaluations was conducted, highlighting the superiority of the proposed method in sales forecasting compared with three other statistical methods (AR, MA, and ARIMA). All evaluations were conducted based on a real retail dataset obtained from three different business scales (three offline sale stores) for three different sportswear items. In the proposed method, the MLP subnetwork detects stationary categorical data features (such as shop size, item color, item style), and the CNN subnetwork gathers information from four time-series data from the previous 9 weeks (sale units, item price evolution, promotion period, and holiday period). The sales unit for the next week is predicted by combining these outputs from two subnetworks via a final hidden layer. The accuracy and robustness of the proposed hybrid forecasting model were verified on the test dataset. The accuracy of the proposed model reaches 65% with taking only a small amount of incomplete sales data as input (the last 9 weeks), which is more than four times more accurate than AR, MA, and ARIMA. Further, it was proved that the adoption of the hybrid approach decreases the prediction error rate by 6% (from 41% for the standard CNN-only model to 35% for the proposed hybrid model). This indicates that the external factors are appropriately modeled into the proposed hybrid model via additional sales forecasting meta-information.
Furthermore, a new loss function, promotion-aware loss function, is proposed to enhance the training convergence and robustness of forecasting at different periods of the year. This loss function measures a weighted RMSE while paying more attention in the promotion period. The promotion-aware loss results in 75% prediction accuracy, increased by 10% compared with the RMSE loss. It validates the contribution of the proposed loss on the entire forecasting accuracy. The considerable performance gain achieved by the proposed model over the other state-of-the-art methods shows promising potential for sportswear retailers, as it can reduce capital investments so that the inventory management problem can be better solved. One limitation of the proposed method is the requirement of a massive amount of data to train the model, due to the employed deep learning subnetwork. This design choice is also explained by the fact that this study is focusing on long-term sales clothing. However, suppose the training data is already spanning a variety of different products and characteristics. In that case, the current model will be robust and accurate for a new sportswear collection.
In a real business environment, there may be several possible scenarios:
When the same retailer introduces a new product to replace the same type and brand of sportswear, for example, a model trained with a dataset including POLO samples can be directly used to forecast the sales of a new POLO item. In this example, the previous POLO dataset can be directly used as input data. Accordingly, a robustly trained model can be obtained. When new retailers enter the market where retailing data lack, the existing model can be used for sales forecasting at the initial stage of retail, as sports clothing usually has more than 1 year of retail cycle. As retail data are accumulated, the robustness of the forecasting model can be gradually enhanced. Sportswear retailing has a specific sales pattern. For example, football sportswear retailing is highly related to the football Premiership. Therefore, for long-term (more than 1 year) sales types, the proposed model can be extended to any sportswear with a short initial training.
Conclusion and future works
This paper presents an efficient method to forecast retail sales, focusing on the sportswear apparel industry. It is essential in sportswear to reliably solve the challenge of supply and replenishment, due to the very long-life cycle. To this end, a hybrid model is proposed based on the combination of categorical data via MLP network and time-series data via CNN. The robustness and accuracy of the model were verified on three different team styles datasets obtained from three different stores, compared with three state-of-the-art forecasting methods. The proposed method reaches a prediction accuracy of more than 65%, outperforming the compared methods. Further, a new training loss, the promotion-aware loss, was proved to improve the overall forecasting accuracy of the model. It proves that the method is of great significance for sportswear sales forecasting. In addition, without a long-term retailing dataset, the proposed model can be adapted to the long-term sales of sports clothing retail and similar categories. Applicable global industrial users include clothing retailers, brands, and merchandisers in the sports clothing and team-wear field.
Future works will include studying the proposed method for online sales where a large amount of data can be collected. Furthermore, the sports retail business has recently experienced a very challenging time due to the COVID situation, and it would be very interesting to feed our model with such new input factors. The macro-economic analysis is also very valuable for regional sellers to make predictions on the purchase intention of local consumers. A fast and affordable forecasting software or APP will be practically helpful for small and medium-sized enterprises and sellers.
Footnotes
Declaration of conflicting interests
The author(s) declared no potential conflicts of interest with respect to the research, authorship, and/or publication of this article.
Funding
The author(s) received no financial support for the research, authorship, and/or publication of this article.