



Abstract
Electromyography is a technique to record and analyze signals from muscle tissue. Commonly, gel-based (Ag/AgCl) electrodes are used to detect muscle action potentials. Current gel-based electrode designs, however, do not perform well under constant movement and therefore are less suitable to monitor muscle behavior under everyday activities. Textile electrodes do well under movement and extended use, but produce weaker signals than their gel-based counterparts. This work points towards a reduction of this performance gap when the textile electrodes are designed to fit the target muscle. Four textile electrodes of different sizes and shapes are tested on the biceps brachii of 13 subjects. Signal parameters such as the signal-to-noise ratio and voltage root-mean-square are used to determine the quality of the myoelectric signals generated by these electrodes. Results with statistically significant differences show that the electrode area and alignment to the muscle fibers affect signal quality and strength. These results indicate that target muscle characteristics should dictate the electrode dimensional parameters to optimize surface electromyography signal acquisition.
Keywords
The study of electrical signals produced by multicellular organisms dates to the 1600s, when it was discovered that the electric ray fish produced electrical currents from highly specialized muscles. 1 Moreover, from the mid-1800s to the early 1900s, scientists confirmed that all muscle fibers emit electrical signals. 1 , 2 These scientists correctly found that muscles generate electrical potentials thanks to ion exchanges triggered by motor neurons. Electromyography (EMG) refers to techniques used to collect and analyze said signals with electrodes and data acquisition systems. 3 , 4 EMG electrodes cluster in two groups: invasive (needle or wire electrodes) 5 , 6 and non-invasive (surface electrodes). 2 , 7 The former requires a thin conductor to be inserted beneath the skin and into the muscle. This technique obtains highly localized signals since the electrode stands directly between muscle fibers. This avoids signal artifacts caused by the skin and adipose tissue. Conversely, surface electrode placement over the skin makes them non-invasive. This facilitates its implementation, but limits signal quality, especially on highly bundled muscle groups (e.g. forearm). Surface electromyography (sEMG) refers to techniques that use non-invasive electrodes to measure muscle activity. 2
Commonly, sEMG electrodes present a thin layer of silver/silver chloride (Ag/AgCl) 8 that adheres to the skin and maximizes interface conductivity. 2 Some sEMG clinical applications include muscular activity monitoring, 9 muscular fatigue detection, 10 muscular disorders diagnosis, physical rehabilitation, 11 and control of prosthetic 12 and orthotic devices (e.g. exoskeletons). 13 Gel electrodes are widely available and easy to apply, and their disposal does not carry the same burden as invasive electrodes. In contrast, the downsides of this technology include electrode desiccation, skin irritation, and allergic reactions. Moreover, electrode failure by adhesive degradation limits the long-term use of any gel-based device as it affects the system impedance and therefore distorts the acquired signals. 14 Dry textile electrodes are considered in this paper as they tackle the disadvantages of gel-based electrodes in long-term applications. In contrast, downsides of this technology include the need for a greater electrode area to match the signal strength of their gel-based counterparts and more noise at low frequencies (<0.67 Hz), regardless of the electrode area. 15 Textile electrodes consist of a conductive yarn that can be easily redesigned and manufactured to comply with different users’ needs. 16 Following criteria from state of the art literature, 17 , 18 this study intends to compare and evaluate the performance of textile electrodes in terms of their signal quality and ability to filter noise as a cheaper, reusable, and more comfortable replacement for gel-based electrodes.
Researchers have used textile electrodes to record electrocardiogram (ECG) signals, 15 ,19–22 sEMG signals, 11 ,23–25 electroencephalogram (EEG) signals, 26 , 27 and even electrooculography (EOG) signals. 28 Similarly, textile electrodes have also been used in transcranial electrical stimulation. 29 Regardless of the application, textile electrodes have been reported to present behavior comparable to gel-based electrodes in terms of parameters such as the signal-to-noise ratio (SNR), 11 root-mean-square (RMS), 30 repeatability, 31 power spectral density (PSD), 32 , 33 and skin–electrode impedance. 23 , 34 Textile electrodes have been used to record muscular activity on the thigh muscles (e.g. biceps femoris), 35 the lower legs, 36 upper arm (e.g. biceps brachii),37–39 and forearm (e.g. brachioradialis), 40 where authors use different electrode sizes 15 , 30 and contact pressures 41 during their experimental protocols to ensure appropriate signal strength. Silver,15,30,42,43 steel, 32 and conductive polymers 20 , 21 , 24 represent viable materials for textile electrodes.
Reviews from previous literature results include important considerations that have directed this work experimental design process, such as skin–electrode contact time 30 or designated textile electrode surface area for the best performance. 15 However, most studies that are focused on protocol design for signal acquisition are for ECGs. Furthermore, parameters such as the RMS and SNR are used to assess the signal quality of both gel and textile electrodes, particularly when the muscle experiences isometric contractions. 11 For this reason, the experiments presented in this work focus on muscles experiencing this type of contraction. Moreover, no significant difference in median frequencies between textile and gel-based electrodes were shown during frequency response trials when applying a 2-kg load.23,25
Some authors have worked on textile electrodes of different sizes for sEMG.24,44 These studies show a positive correlation between signal quality and the size of the electrodes. These works, however, did not line up to EMG treatises, such as the SENIAM Project, which standardizes the use and placement of EMG sensors. 45 This decoupling is in part caused by the non-trivial effects of the size, shape, and alignment of the electrode signal (electrodes with a large surface area can present signals with smaller amplitude if alignment is neglected).
Therefore, the objective of this work is to study the performance of textile electrodes of different shapes and sizes on the biceps brachii muscle for sEMG signal acquisition. The resulting performances are compared to gel-based electrodes placed on said muscle. This document couples the effects of electrode shape and size into a single model, which enables objective comparison between variants of different dimensional characteristics. Therefore, we shine new light on textile electrode technology. Textile-based, dry electrodes have not received the same attention as their gel-based counterparts. Such an imbalance is understandable in some environments (e.g. medical), but unwarranted in others. Proper understanding of textile electrode behavior will enable high-quality biometric data acquisition and in turn bridge the gap between textile-based wearable devices and the ever-increasing demand for self-monitoring health devices. 46
This work is organized as follows: the next section presents the materials used in the tests as well as a description of the analytical methods that were implemented. This is followed by a presentation of the results obtained for all textile electrode signals compared to gel electrodes and its discussion. Finally, this work presents the conclusions of this research work and suggestions for future developments.
Materials and methods
Participants
For the experimental process, a total of 14 subjects (nine males, five females) were recruited for this study, age 24.7 ± 4.1 years, weight 67.1 ± 9.5 kg, and height 1.7 ± 0.1 m (mean ± SD). The test subjects had a healthy condition, most of them did regular exercise and were all right-handed (i.e. all subjects reported a dominant right hand). Note that subject body build was not a selection factor.
A consent form was signed by all the subjects. The total number of subjects was approved by the Ethics Committee of Wearobot S.A.P.I. de C.V. and conducted according to the Declaration of Helsinki. This number agrees with the terms of working on consecutive days with different subjects on an experiment lasting about 1 hour to complete the entire measuring process. This includes attaching all the electrodes, performing the experiments, removing the electrodes, and preparing the setup for the next subject.
Materials
This work evaluates different textile sEMG electrodes made of silver-plated conductive fibers. The textile used in this work is sold as “Stretch Conductive Fabric” (catalog number A321) by Less EMF, Inc. The silver coated medical grade fabric is composed of nylon (76%) and elastic fiber (24%). The textile presents a knitted weave structure, namely stocking stitch (see Figure 1). The fabric presents a thickness of 0.40 mm and areal density of 4.3 oz/yd 2 and it is advertised as having a stretch of ∼100% and ∼65% in the length and width directions, respectively. The availability, stretching characteristics, and its silver content compared to similar products make this fabric ideal for textile electrodes. Textile electrode edges should be cut parallel or perpendicular to muscle fibers to best evaluate electrode-to-muscle fiber interactions. Rectangular shapes fulfill this requirement for electrodes placed at the center of the biceps brachii muscle, where its fibers are vertically aligned (from the shoulder to the elbow). Note that the above-mentioned rule could shape electrodes differently depending on the muscle and its location (e.g. the pectoralis major would require triangular or trapezoidal shaped electrodes to fulfil the above-mentioned requirement). Therefore, the biceps brachii muscle was chosen due to its accessibility during electrode placement and flexion–extension exercise for the subjects, as well it being less likely to finding body hair that could affect the sEMG recordings. Furthermore, as the biceps brachii is relatively isolated from other muscles, centimeter-scale displacements of the electrodes did not produce observable effects on the signal and, therefore, the results of the experiments presented in this document. Previous work confirms this assessment. 47 Rectangular electrodes allow the study of the aspect ratio and its effects on sEMG signal quality by constraining the design on two parameters: length and width. The authors of this work were unable to find previous studies that focus on the electrode aspect ratio and how it relates to signal quality.
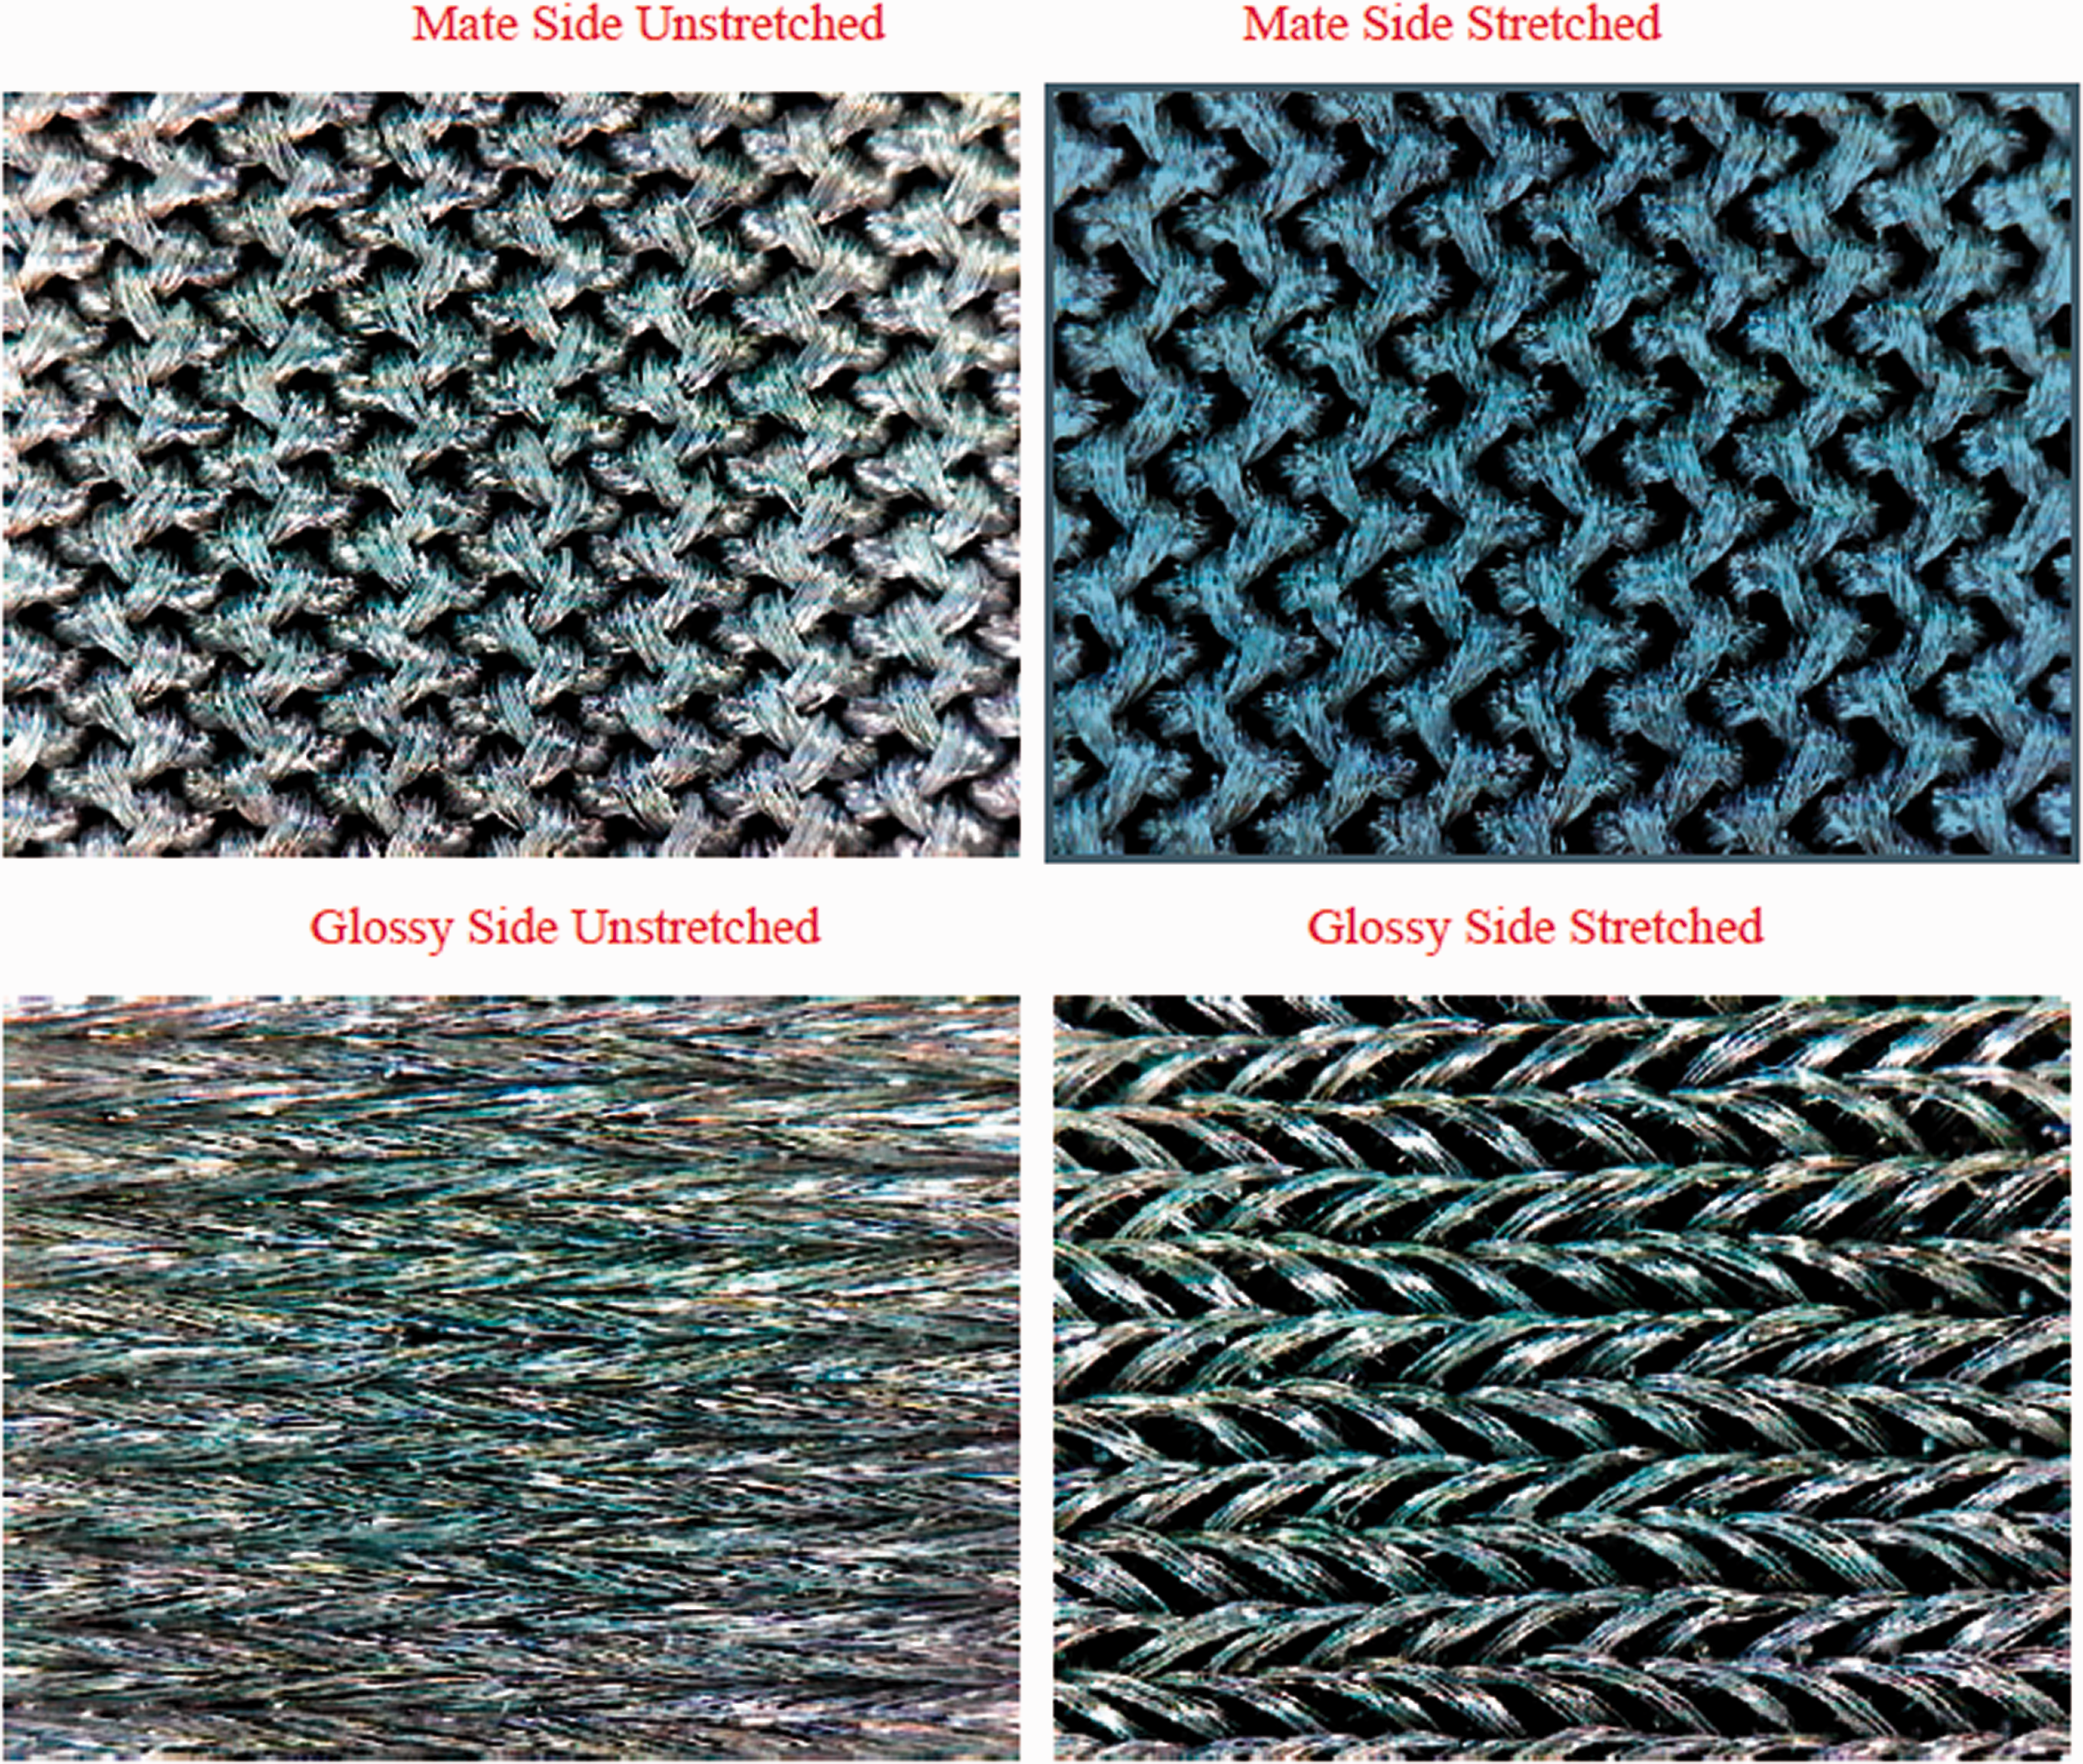
Optical microscopy photographs of the textile electrodes at rest and vertically stretched. The matt side of the textile is depicted unstretched (a) and stretched (b). Similarly, the glossy side of the fabric is shown unstretched (c) and stretched (d).
The textile electrode manufacturing starts with the sewing of the conductive fabric into adjustable elastic bands (see Figure 2(a)). A metallic snap fastener is clipped to the conductive textile to connect the electrode to the data acquisition system (see Figure 2(b)). Hook-and-loop fasteners are sewed to both ends of the band.

Schematic of textile electrodes sewn into elastic bands. The internal view (subject arm side) shows the conductive area of the electrode. The external view (environment side) shows the snap fastener to connect the electromyography wires. Elastic bands are adjusted with hook-and-loop fasteners for subject comfort (a). Photograph of textile electrodes sewn into elastic bands named A–D, for identification (b). Textile electrode sizes with specific measurements (L1, L2) of the surface conductive area (c). Surface areas A–D are as follows: 12, 5.4, 7.2, and 3.24 cm2.
The electrode surface area ranges between 3.24 and 12 cm2. The process that leads to this size range is explained as follows. Four different sizes (Figure 2(c)) are created for this study, based on the following criteria: (1) the biceps brachii is taken as the muscle of interest, given its superficial location and isolation from other muscles that could bring signal interference (cross-talk); (2) the average biceps brachii width is 3 cm, assuming it has a cylindrical shape 48 ; (3) previous studies on textile electrode design showed a similar performance with gel-based electrodes when the surface area 15 was at least 4 cm2 and it had a minimum diameter of 20 mm; 11 and (4) the maximum length was calculated by considering the proper place in which to place the electrodes (inter-electrode distance or IED), with 2 cm of separation according to the SENIAM project, 45 , 49 which results in about 4 cm. From this, the maximum length and width are established as 4 and 3 cm, respectively, while a minimum of 1.8 cm for both is taken from the squared root of the minimum recommended area. Hence, four different size combinations, named A–D, are manufactured to obtain optimal shaped electrodes for comparison. The sample size of the four electrodes is obtained by considering the combination of maximum and minimum width and length, shown in Figure 2(c). A reference electrode from a conductive textile is also made with length and width of 1.8 cm. Electrode D is the smallest of the four with an area of 3.24 cm2, while electrode A is the largest at 12 cm2. The sizes of electrodes B and C fall in between, with surface areas of 5.4 and 7.2 cm2, respectively.
In addition, sEMG hydrogel electrodes are used to obtain a comparison baseline for textile electrode performance. Gel-based electrodes have a total area of 2.81 cm2 (Kendall/Covidien H124SG) and are round-shaped, with a diameter of 24 mm. This allows the textile electrode to be placed close to the gel electrodes and ensure real time synchronized signal acquisition without errors during signal recording.
Experimental protocol
The test protocol requires the subject under recording to perform forearm flexion and extension processes while in a standing position. Biceps area preparation involves rubbing alcohol around six times on the electrode position. 45 No other skin preparation (skin abrasion, peeling, or shaving) is made nor additional chemicals applied. The subject's arm length is measured to position each type of electrode, according to the SENIAM project guidelines 45 : the first on the muscle belly, the second 2 cm below the first one, and a reference electrode placed 1 cm below the elbow (see Figure 3). In total, three textile electrodes and three gel-based electrodes are placed on the patient's arm. Gel-based electrodes are placed first. On top of them, the elastic bands are adjusted to the subject's biceps brachii considering that both textile and gel-based electrodes are in full contact with the skin. To do this, the tester makes sure that the gel-based electrode adhesive is entirely in contact with the skin. The elastic band with the textile electrodes must be secured enough that it does not move when the subject rotates or flexes their arm, but is not so tight that it would harm them. A 15-minute period wait prior to the experiment is done to ensure skin–electrode contact. 30 The waiting period is set with a timer. This protocol is followed by the same tester and was written as a guide in order to repeat the same process for all subjects. The main test consists of a 5-second rest signal recording plus a 35-second intermittent 90-degree forearm flexion and extension signal recording. The flexion–extension process is ruled by a sound signal (0.5-second duration) in order to standardize the subjects’ arm motion frequency. The first trial is done without load in forearm flexion (from extended arm, palm facing forward, to flexing arm 90 degrees, palm facing upwards), and the second trial is performed the same while holding a 2-kg dumbbell. The load is applied by requesting the subject to hand hold the dumbbell with the active arm. Between each trial (with and without load) a 5-minute break is given to the subject to avoid any muscle fatigue. This process is repeated four times, one for each textile electrode size. Total test duration was about 1.5 hours per subject.
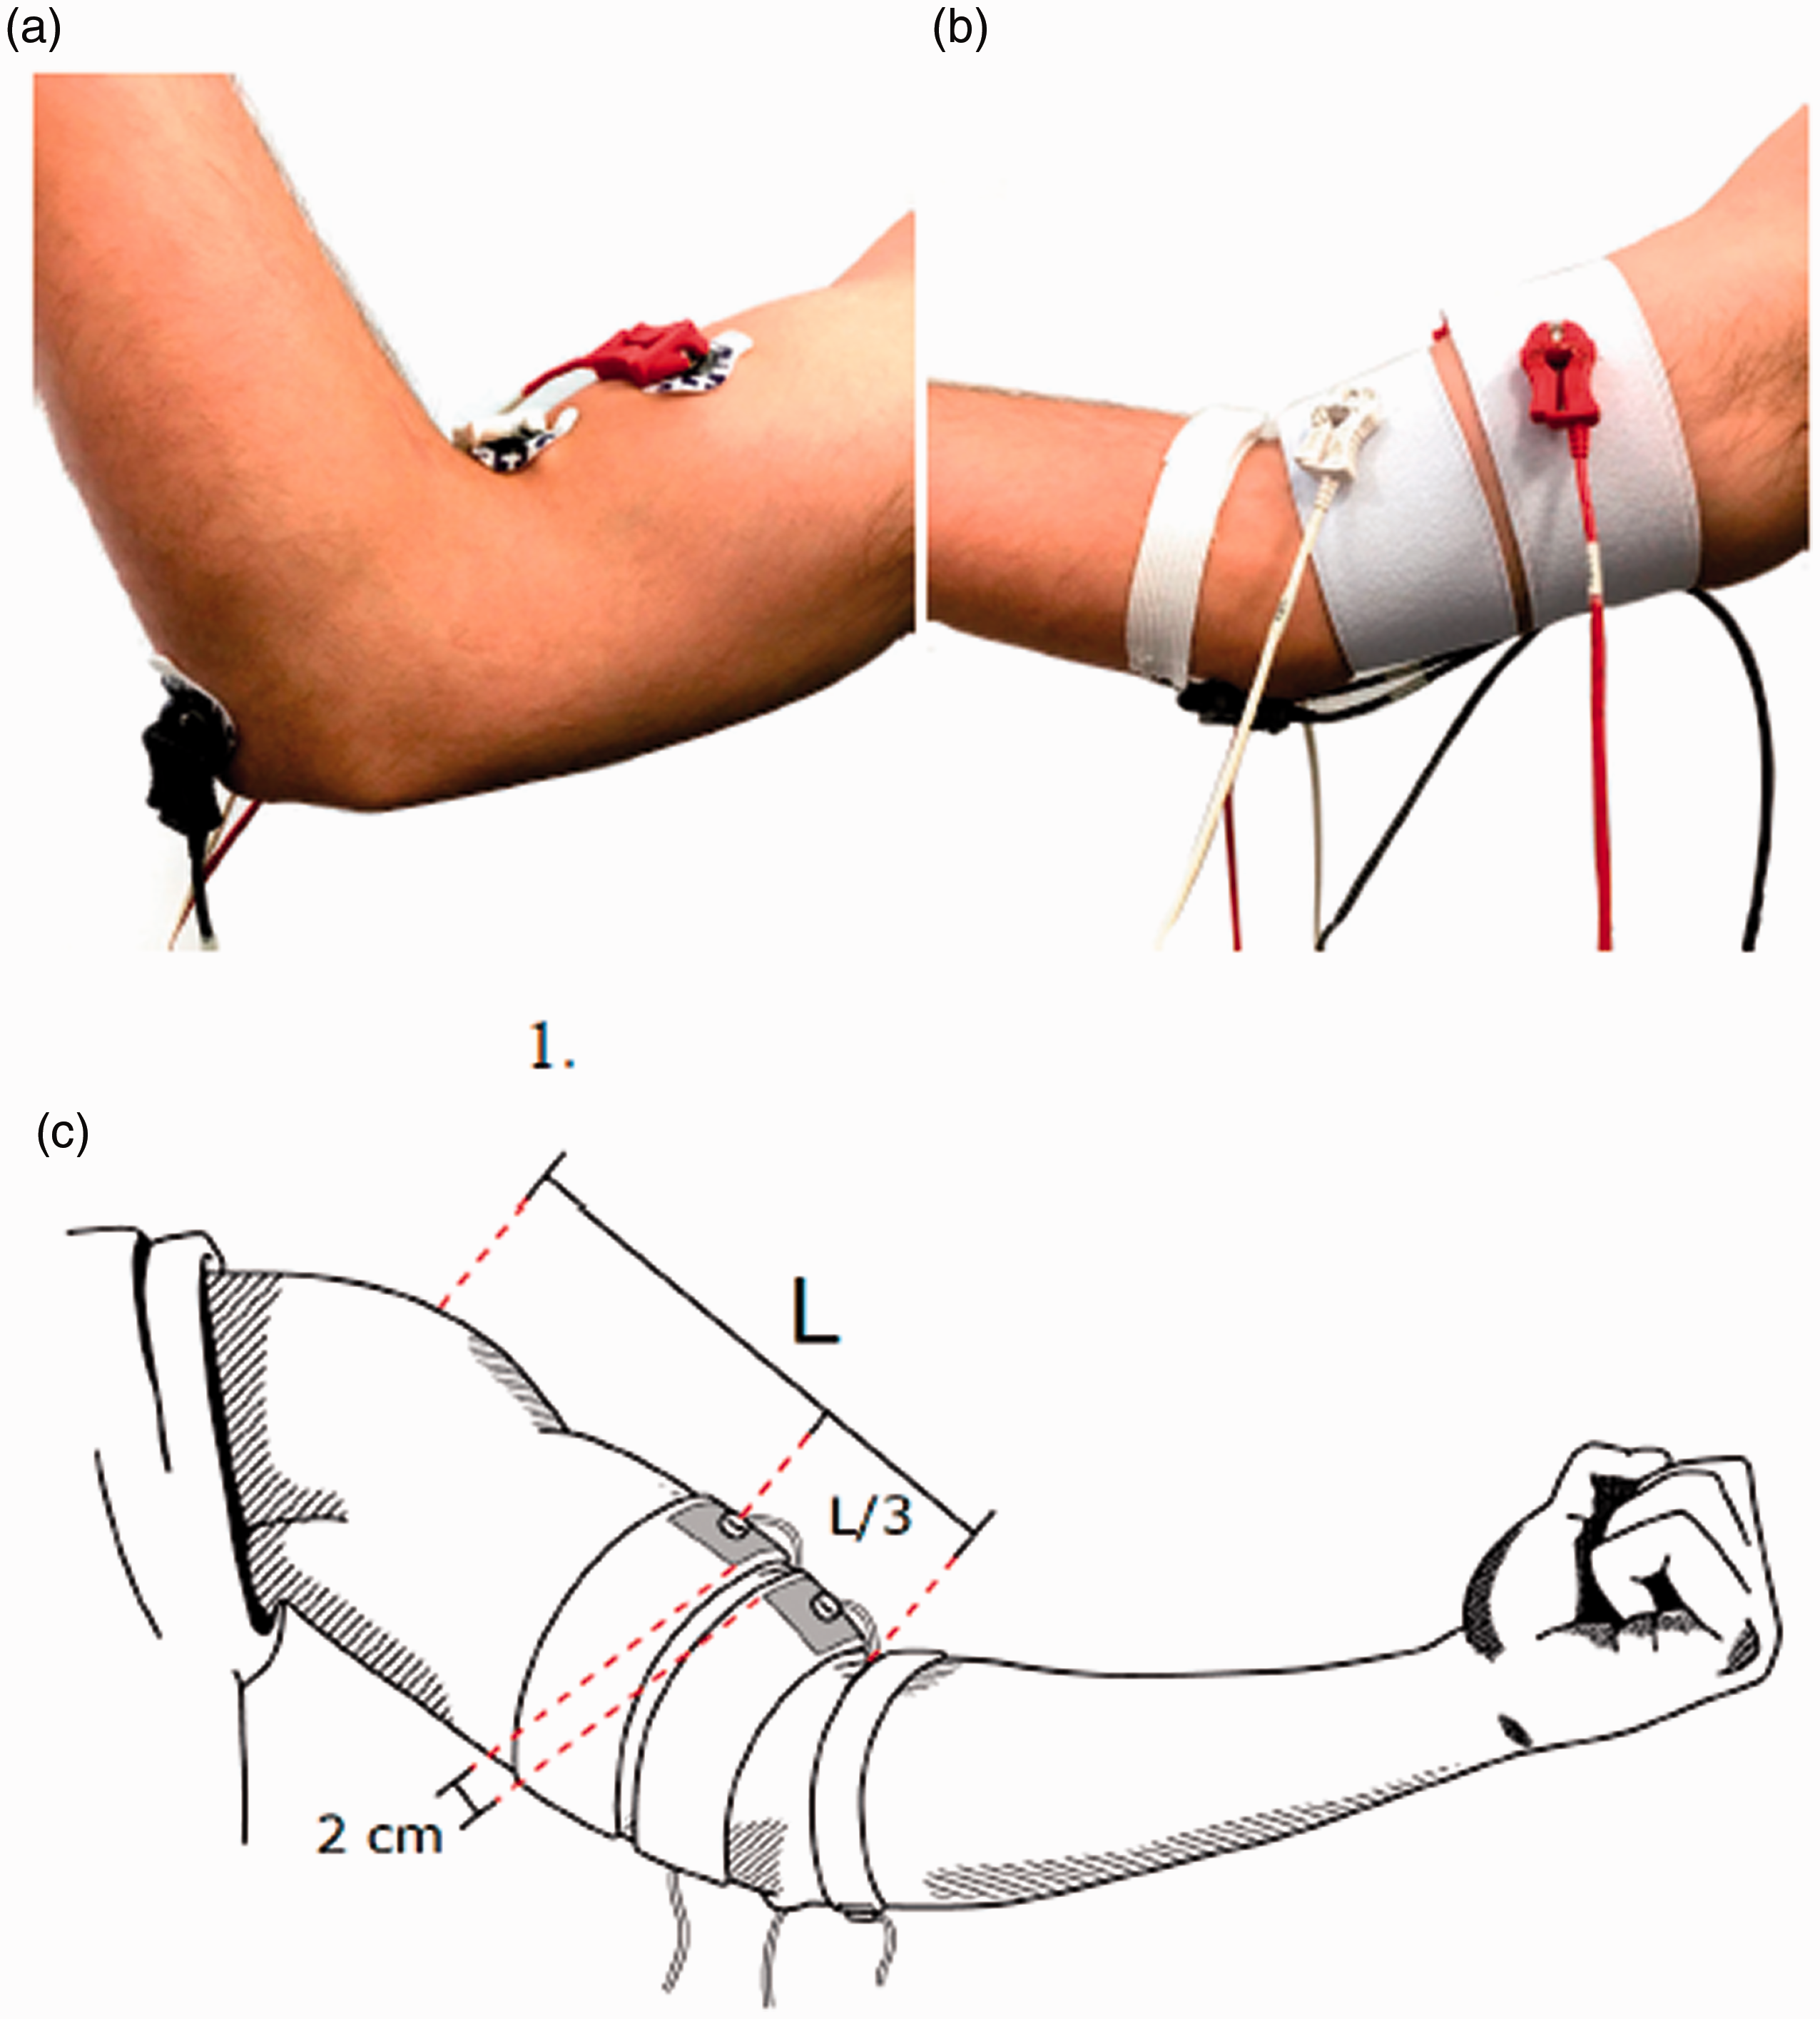
Gel-based electrode positions on the biceps brachii (a) and textile electrode positions (b), which are placed over the gel-based counterpart electrode at a minimum distance, so all electrodes capture clear signals from the muscle belly. Electrodes are placed as defined by SENIAM (c), placing the active electrode at one-third of the arm's length. The inter-electrode distance is 2 cm from edge-to-edge.
Data acquisition
EMG signals are recorded using a Biopac MP35 (Biopac Systems, Inc.). This data acquisition unit has four channels to connect a variety of biological transducers. The experiments presented in this work use two channels to obtain both textile and gel-based electrode signals simultaneously from properly separated locations within the same muscle. 50 Acquisition sampling is set to 1000 Hz and the gain is set to 1000× on both channels. The acquisition band-pass filter is set to 30–500 Hz as predefined from the system for EMG signal acquisition. The common mode rejection ratio (CMRR) is set by default by the system at a minimum of 85 dB. There is a very low possibility of sEMG cross-talk from surrounding muscles because the electrodes placed over the biceps brachii are well isolated (meaning they do not have contact with other muscles). There is no implementation of a notch filter for interference noise (60 Hz) due to the possibility of losing important information from muscle electrical activity, given its frequency range. 51
Signal processing
Data collection of the above-mentioned individuals lasted 3 consecutive days. The processing of the signal is performed after all experiments are completed to avoid in-experiment biases. A 1-second signal sampling is taken for both the noise baseline and biceps contraction process of every subject using LabVIEW (National Instruments, 2014). For all subjects, the SNR for each sample is calculated as follows

To make a general comparison of the performance of each electrode, voltage RMS from all samples and subjects is obtained as

A time–frequency spectrum is created for each electrode to visualize the frequency range of the signals within the time domain.
The results presented in the following section use an index based on the electrode dimensions and their alignment to the muscle fibers. This index complements the electrode area, and together they produce a strong predictor of electrode performance. The henceforth called Electrode Index (EI) is calculated as the following ratio

Statistical analysis
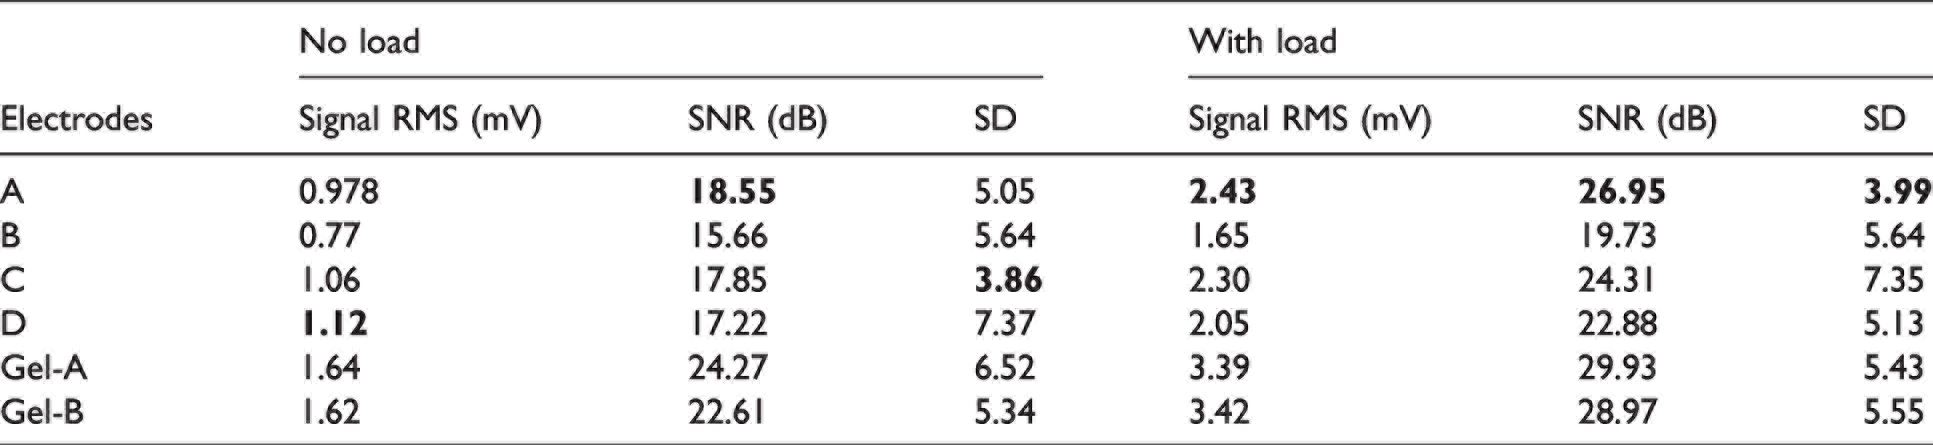
A thorough statistical analysis assures that the above-mentioned differences of distributions are products of real disparities between electrodes and not the effect of natural randomness in the acquisition of data. Analysis of variance (ANOVA), Mann–Whitney U, and Student’s t-tests were considered for statistical analysis. The ANOVA is preferred when working with several groups if normality and homoscedasticity (similar variance) can be assumed. For this study, however, the standard deviation (square root of its variance) differs by more than an order of magnitude between electrodes (see Table 1) and therefore the ANOVA test is discarded. Note that the Student’s t-test works on distributions with different variances as long as the distributions are normal. For this reason, a Kolmogorov–Smirnov (KS) test is performed to test normality. Values p < 0.05 of the KS test would suggest non-normal behavior and suggest the use of a Mann–Whitney U-test. For this work, however, all results fail to reject the null hypothesis that the distributions are normal. Namely, this normality test yields values in the range 0.102 < p < 0.862 with a mean of 0.554. Therefore, the data is assumed to be normal and Student's t-tests are used.
Signal parameters for the four textile electrodes, including average signal voltage (root-mean-square (RMS)) and signal-to-noise ratio (SNR), and its standard deviation (SD). The highest value for the RMS and SNR is signaled in bold as well as the lowest SD of the data. Gel-based electrode signal parameter values are given for the best electrode counterpart behavior, electrode A, and the worst electrode behavior, electrode B
Results
Raw signal data from the textile electrodes shows the three distinct moments in which the subject is flexing their arm for about 5 seconds (Figure 4). Additional 5-second release-and-rest periods follow each flexion. All textile electrode signals show a lower magnitude but a similar timing of the muscle activation (time and frequency domain) when compared to their gel-based counterpart electrode. Note, however, that high-activity sEMG signals surpass the mentioned 5-second interval as the subjects move their arms to the resting position. Samples of 1 second are taken from the signals to further calculate parameters for ambient noise and muscle signal. These samples are programmed to be taken within the same time-rate for each subject signal. Note that subject 5 is excluded from per-protocol analysis since the signal sampling would often obtain noise artifacts.
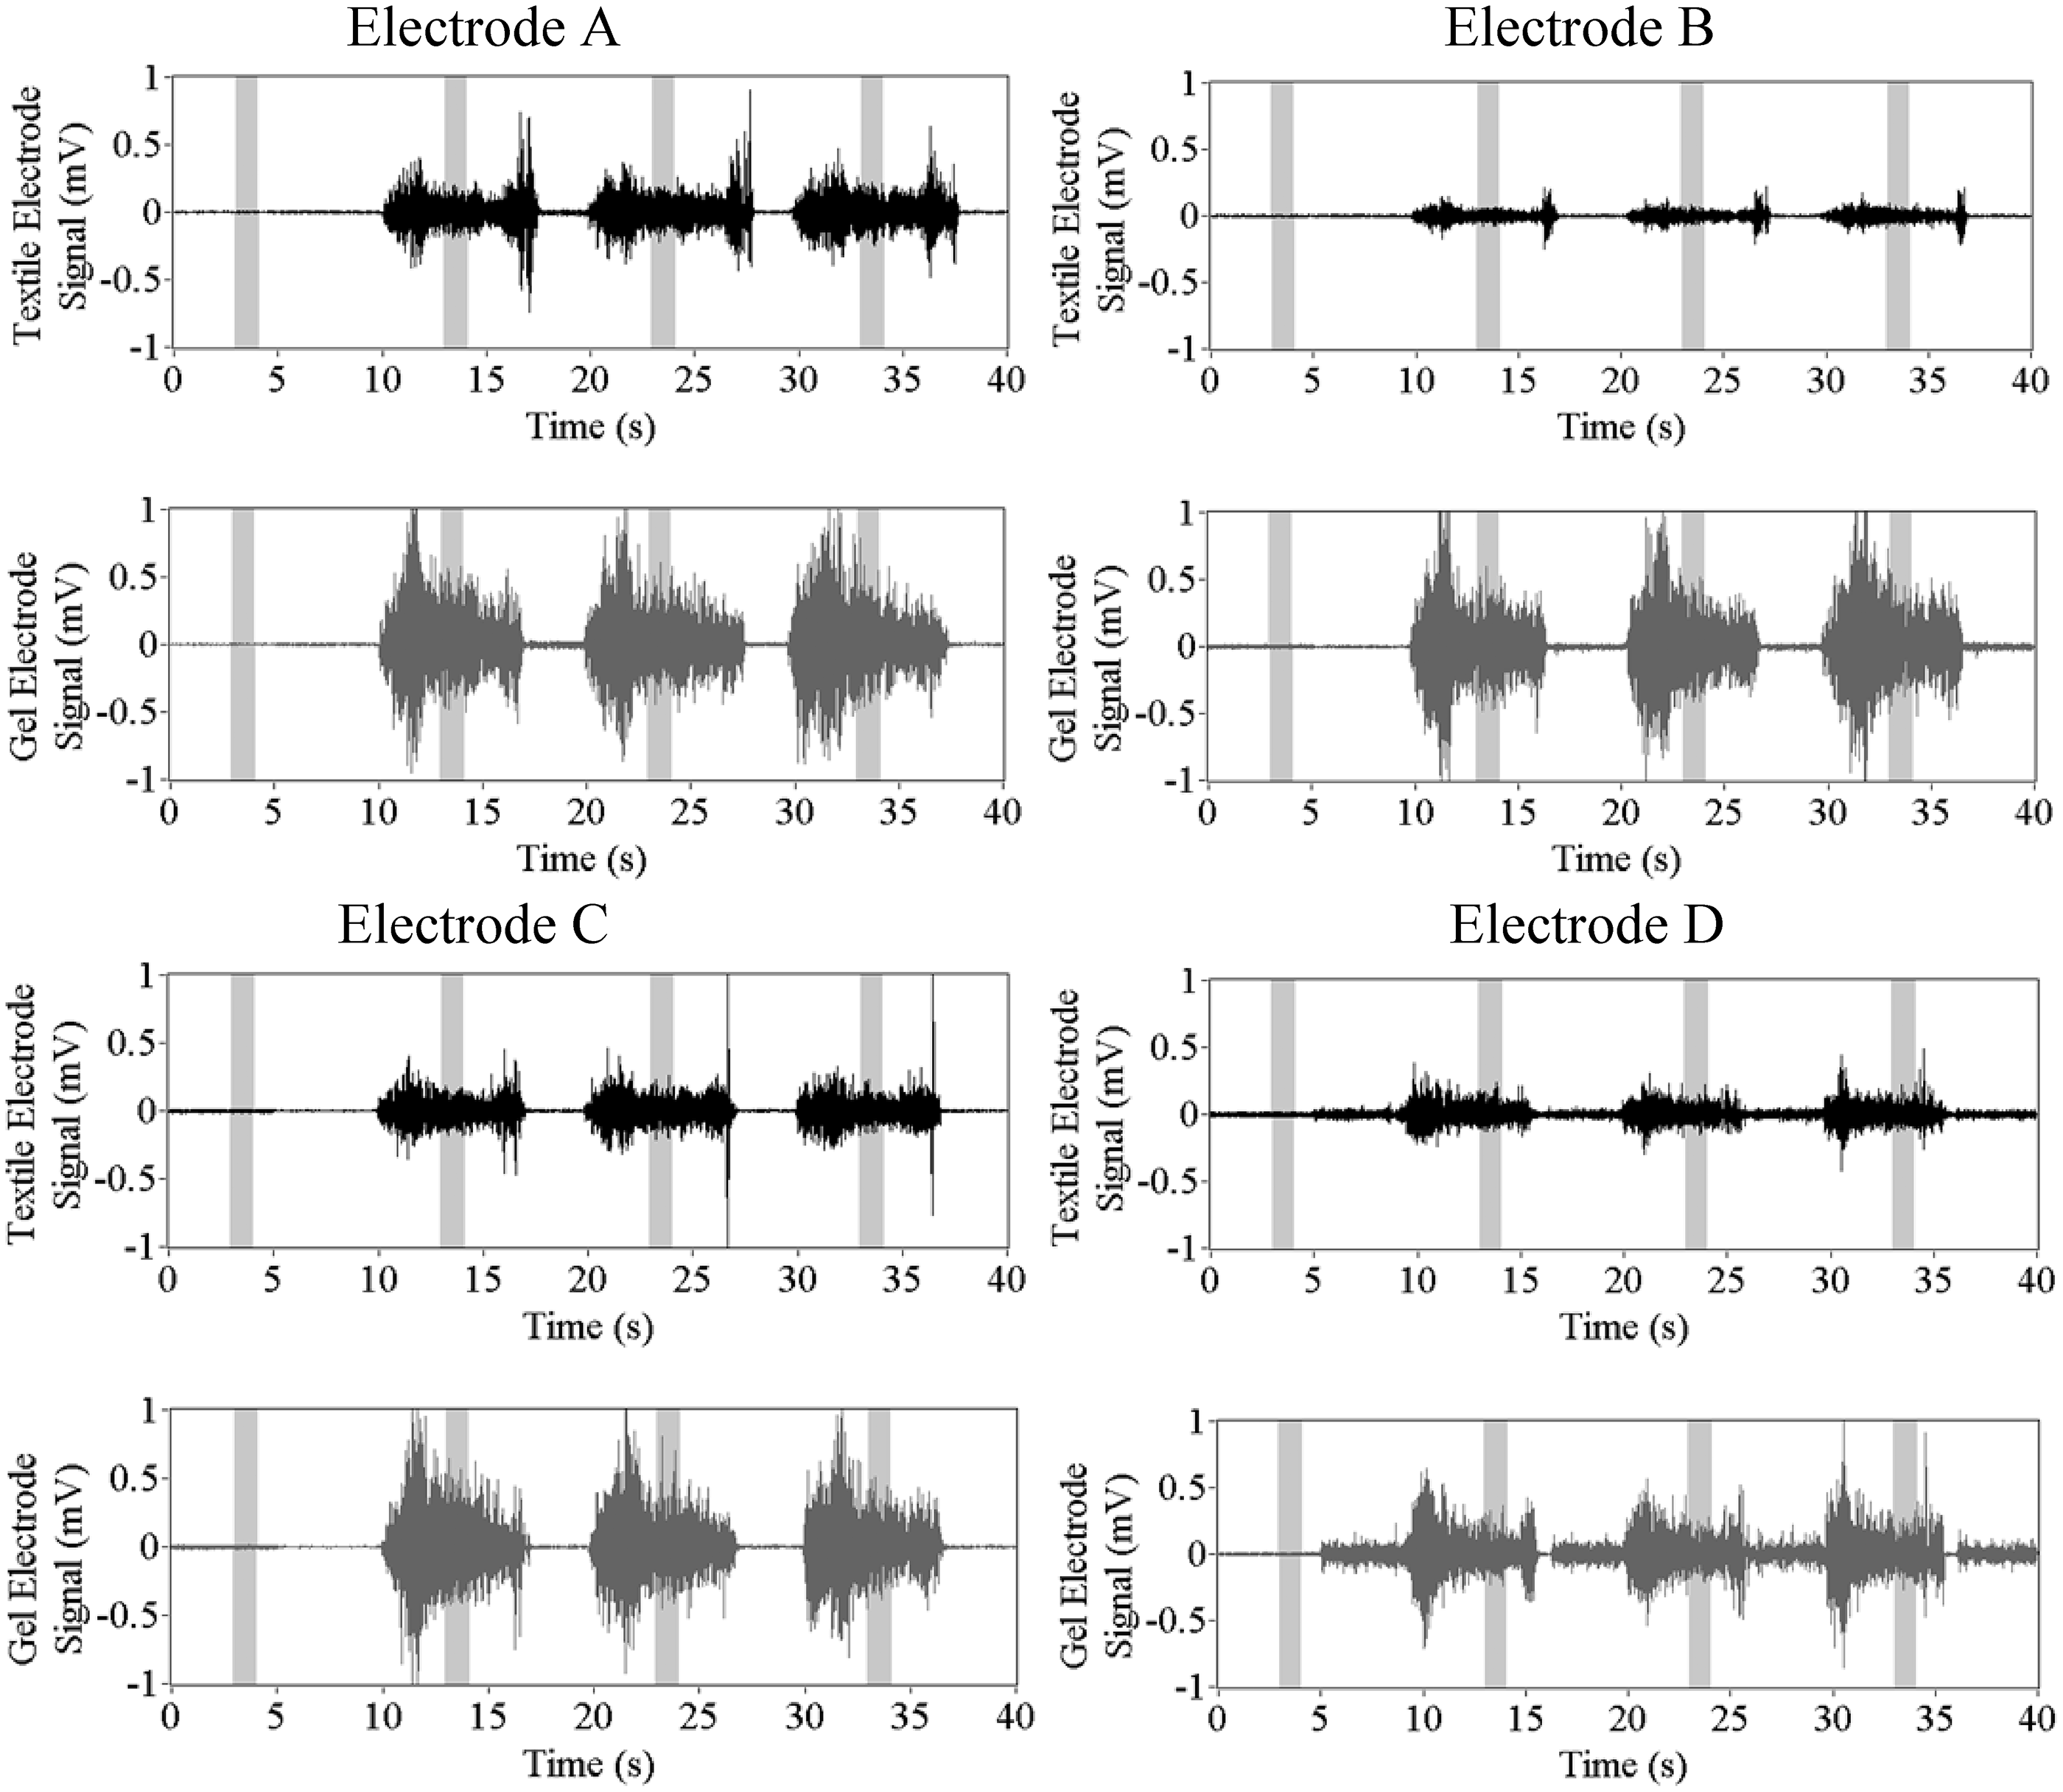
Surface electromyography signals from participant 1 for each type of textile electrode (black) and the gel-based counterpart electrode (dark grey) placed nearby for contrast. A 1-second fragment of each signal (light grey) is extracted for frequency and statistical analysis.
Time–frequency spectrogram visualization of muscle activity shows a more complex behavior of muscle activity than a simple ON/OFF switching (see Figure 5). In particular, signal peaks are visible at the beginning and end of load-carrying movements. For this reason, the analysis performed in this work, including SNR analysis, compares the muscle signal at rest with the muscle behavior at the middle of the load-carrying activity (shaded time intervals). This sets the minimum values of the SNR, which only increase in the above-mentioned regions of increased activity.
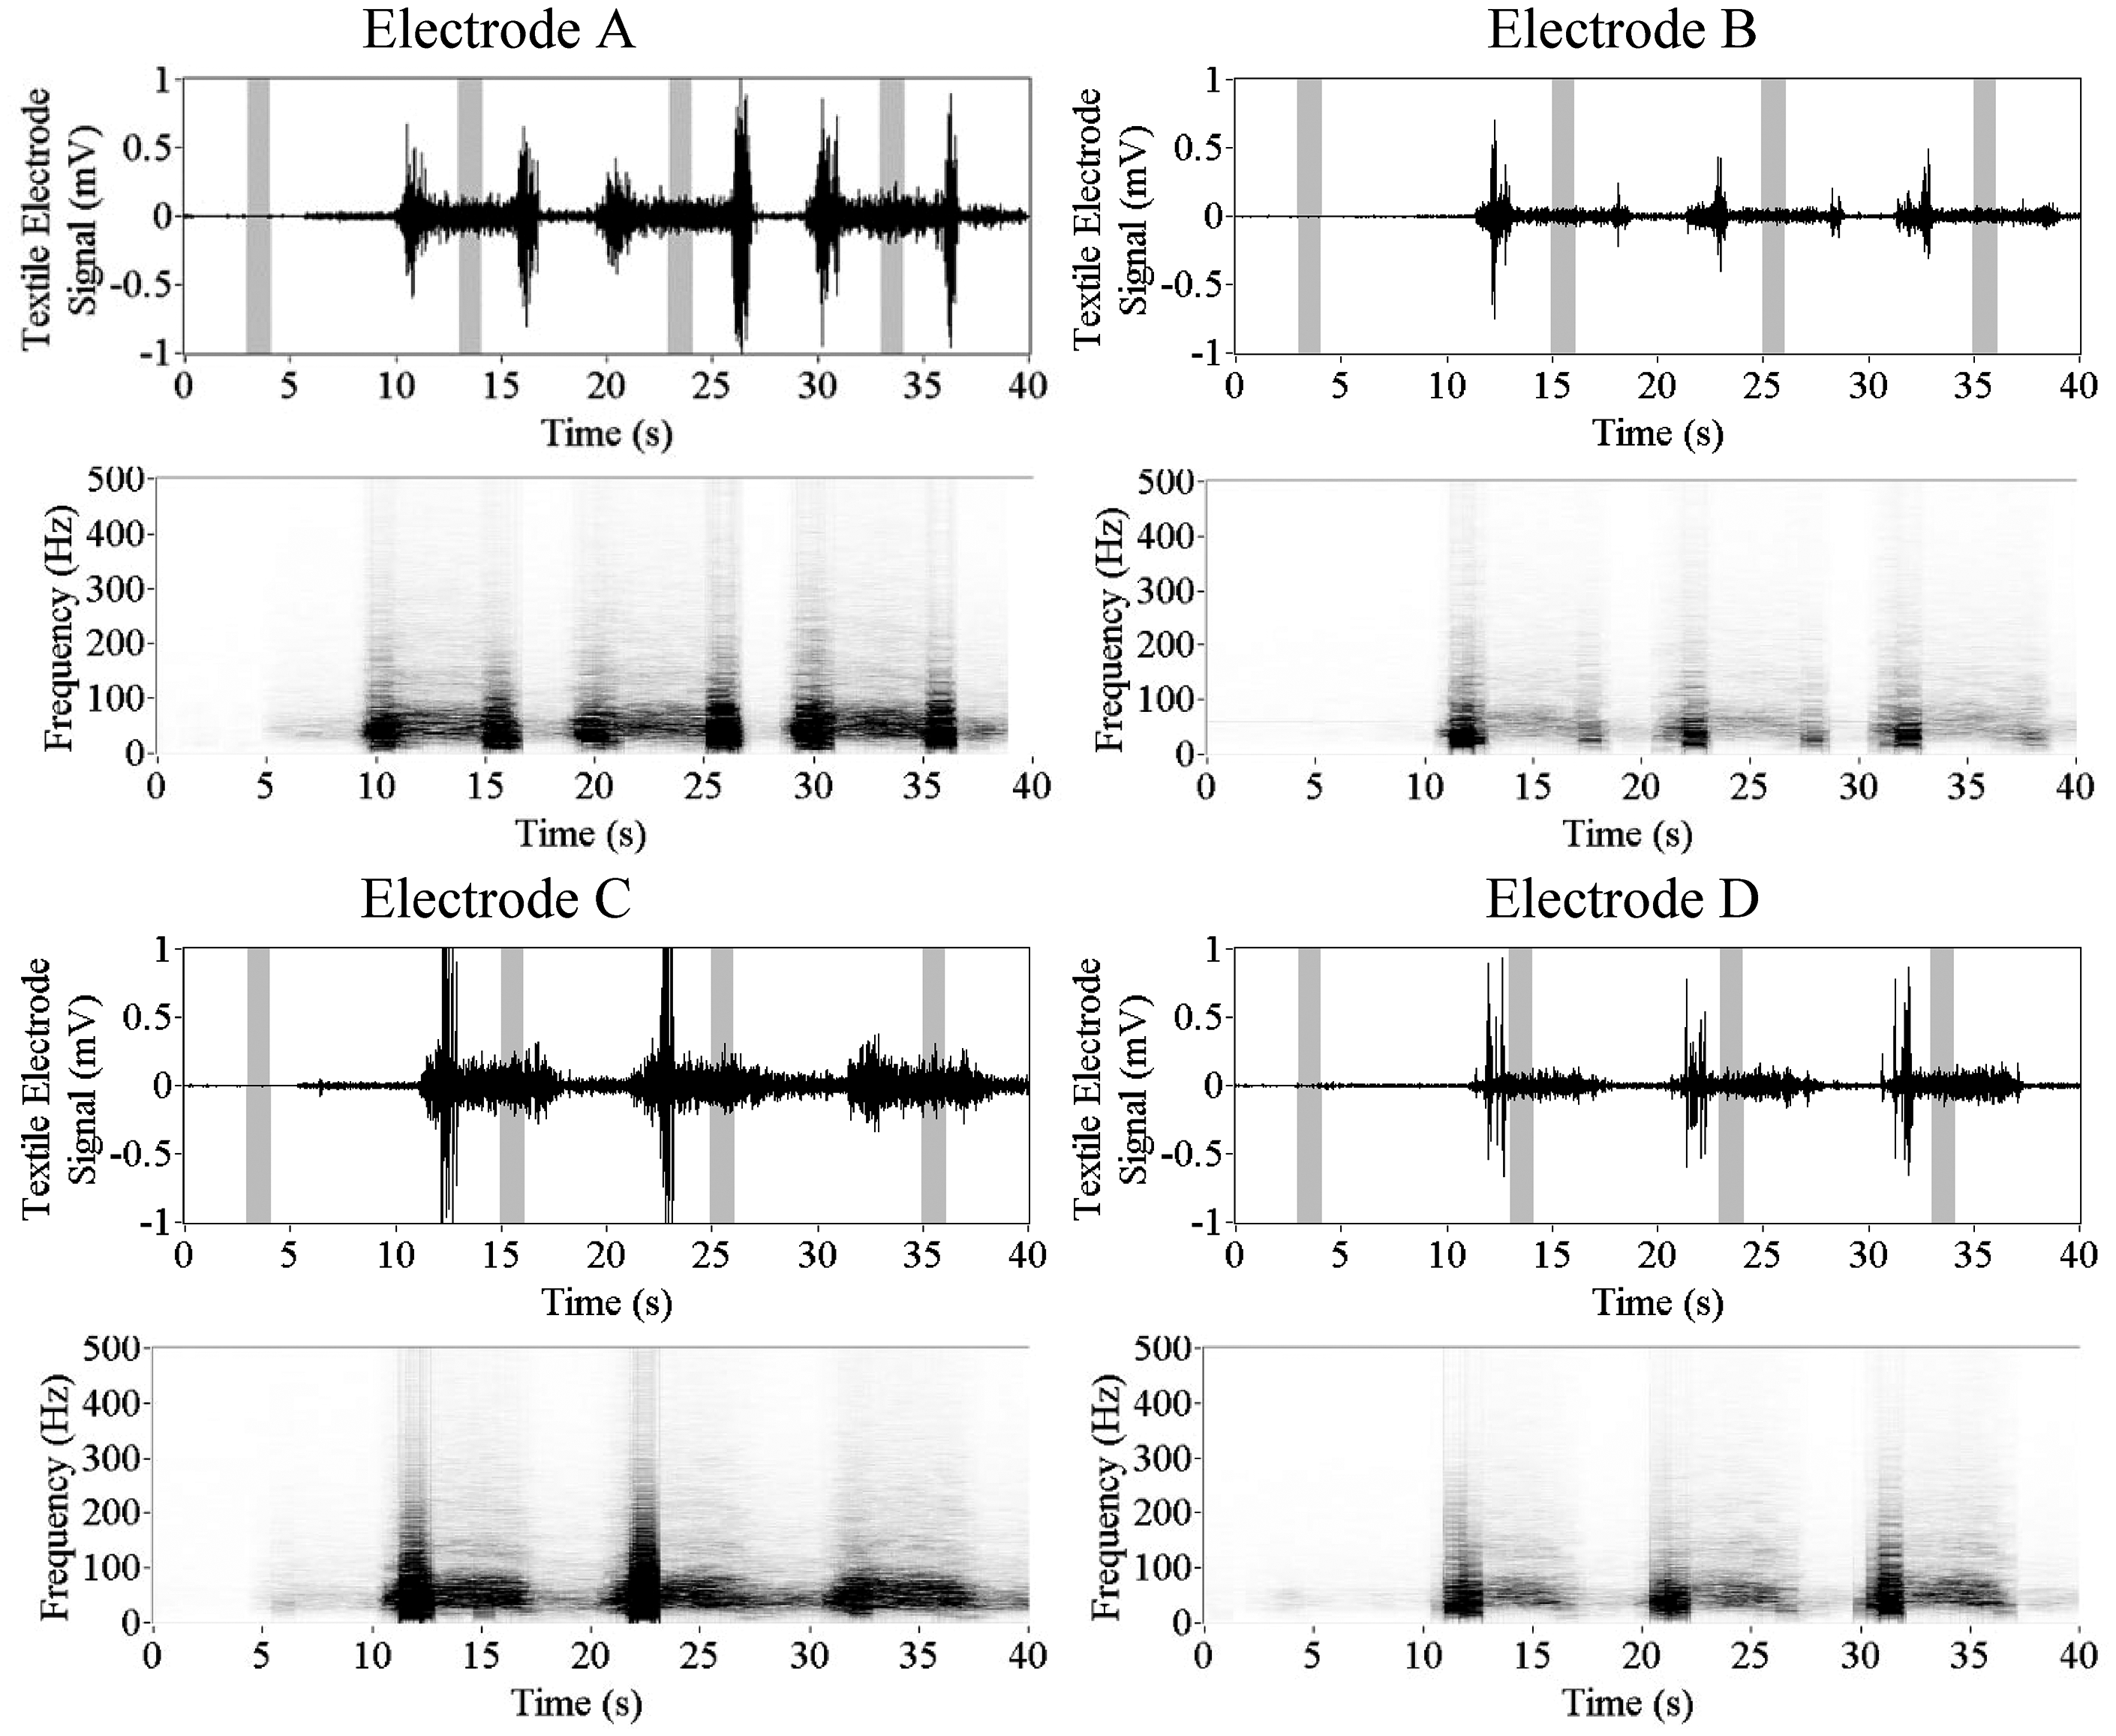
Electromyography signals from participant 14 for each type of textile electrode on the time and the frequency domains.
The sEMG signals in the frequency domain consistently show high amplitude values between 0 and 500 Hz and, more specifically, between 60 to 150 Hz, which is a normal sEMG range for muscle contraction. 51 As seen in Figure 5, electrodes A and C show a stronger frequency signal within the adequate range when the electrode is activated, notably at the beginning of the contraction signal. Both electrodes can clearly capture sEMG frequencies, whereas electrodes B and D show a visibly weaker spectrum. This means that even though they respond as well as the other electrodes, they do not provide enough signal strength.
SNR values are calculated for gel-based and textile electrode signals following Equation (1). The values are normalized in decibels (dB) for a more accurate comparison (see Figure 6). Gel-based electrodes present SNR values higher than their textile counterparts, regardless of the load applied. Textile electrodes show only a slightly lower value range than gel-based electrodes. However, their performance is different from each other. When the subjects do not carry a load, textile electrodes A and C present similar average results to their gel-based counterpart electrodes (values displayed in Table 1). Also, both electrodes present high SNR values, resulting in a great performance for capturing high-quality sEMG signals. On the other hand, textile electrodes B and D present large variability in their results, indicating a poor performance when calculating signal strength.
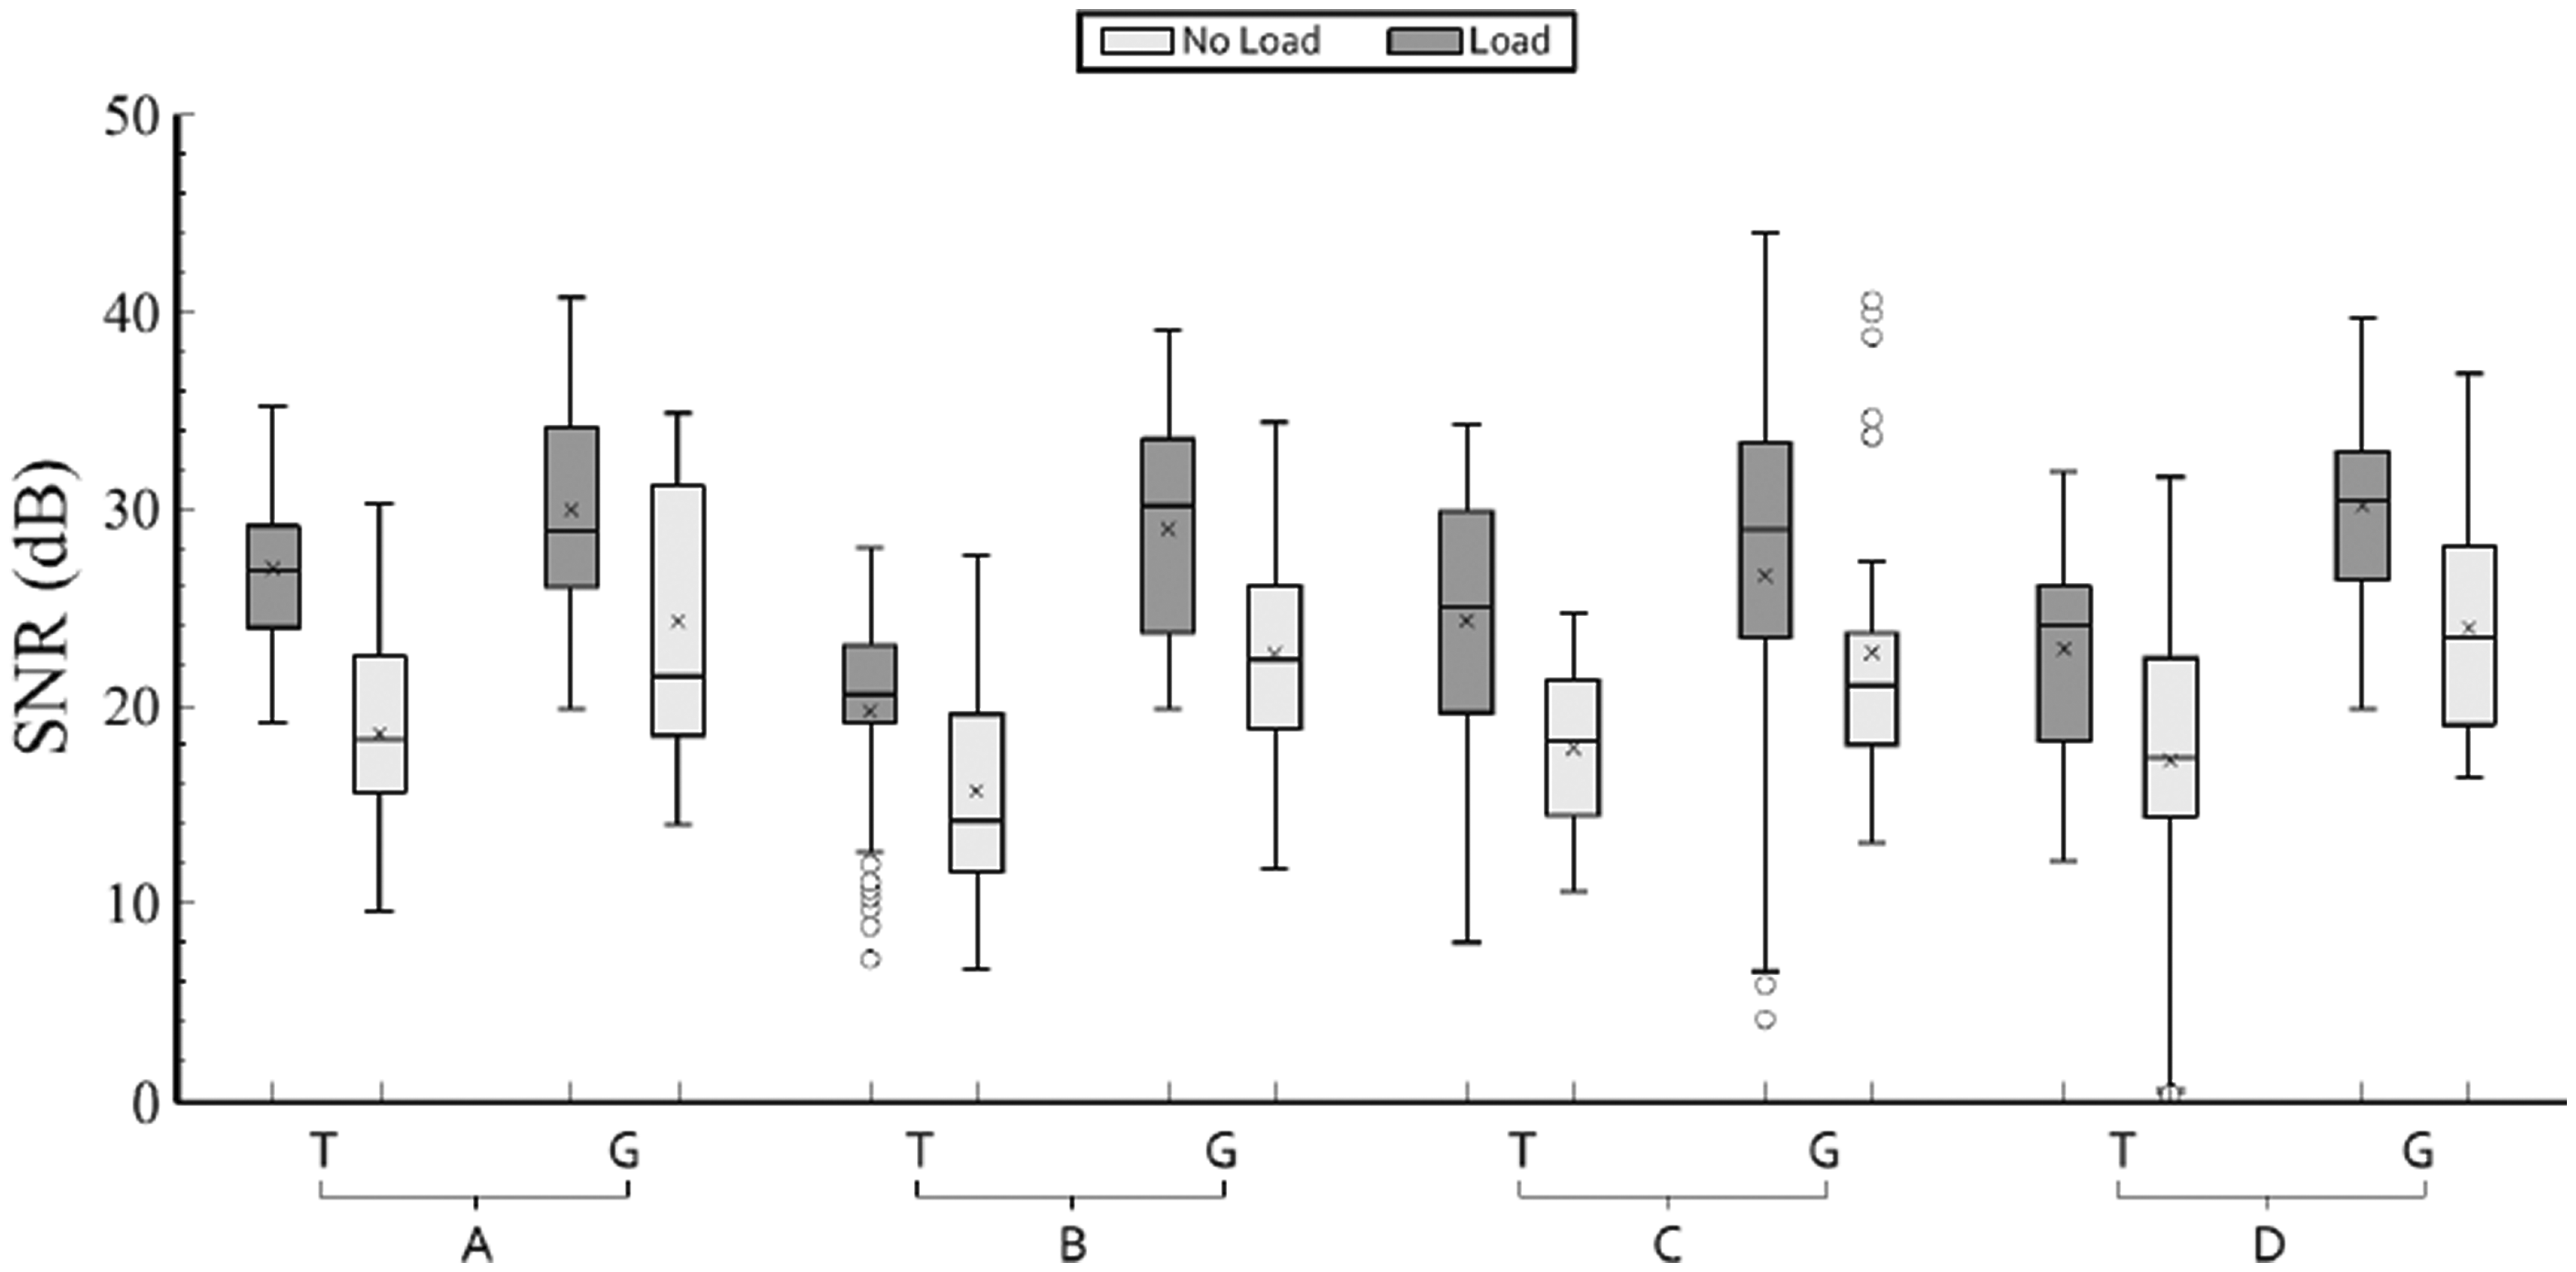
Signal-to-noise-ratio (SNR) of both types of surface electromyography electrodes. Distributions are differentiated when subjects did and did not carry a load during the experiment. Textile electrode (T) SNR is shown with its gel-based electrode (G) counterpart. The SNR is shown in decibels (dB).
The performance of sEMG signal acquisition is modeled with two values that consider the electrode size and its alignment to muscle fibers, namely, the electrode area and its index, which are defined in the previous section. While a larger electrode area would increase the measured action potentials, this criterion alone fails to be deterministic given that action potentials from different muscle fibers and their artifacts could be added to the sEMG signal. On the other hand, the EI would consider the distribution of muscle fibers, pondering the action potentials that are measured and their possible source, such as fibers from different muscles, which produce a detrimental effect on the signal.
Each parameter alone fails to completely predict the behavior recorded in the experiments. For example, electrode area fails to explain why the smaller electrode D is better than its larger counterpart B (see Figure 7(a)). Values from this figure are also shown in Table 1. Similarly, EI alone predicts the signal of electrode C to be the better than that of A, which is not the case. By only considering both the electrode area and the EI, it is possible to predict the behavior observed in the experiments. In addition, since this work presumes that size and shape actually influence difference in performance, a similarity analysis has to be conducted in order to obtain feasible and meaningful data. Even though average voltage levels obtained from each electrode are consistently different, to claim real difference could lead to misleading conclusions. Thus, a Student's t-test is applied to the compound of signals that were experimentally obtained. Results from this test failed to prove the equality of signals obtained from every pair of electrodes, except A and C, confirming the results obtained and shown in Figures 7(a) and (b), and supporting area and EI predictions. Namely, electrodes A and C present the strongest signal, while electrode B presents the weakest. Note that differences in signal strength between electrodes A and C do not present statistical significance in any experiment (p > 0.1). This shows how changes in electrode shape are comparable to changes in size (see Figure 7(c)).
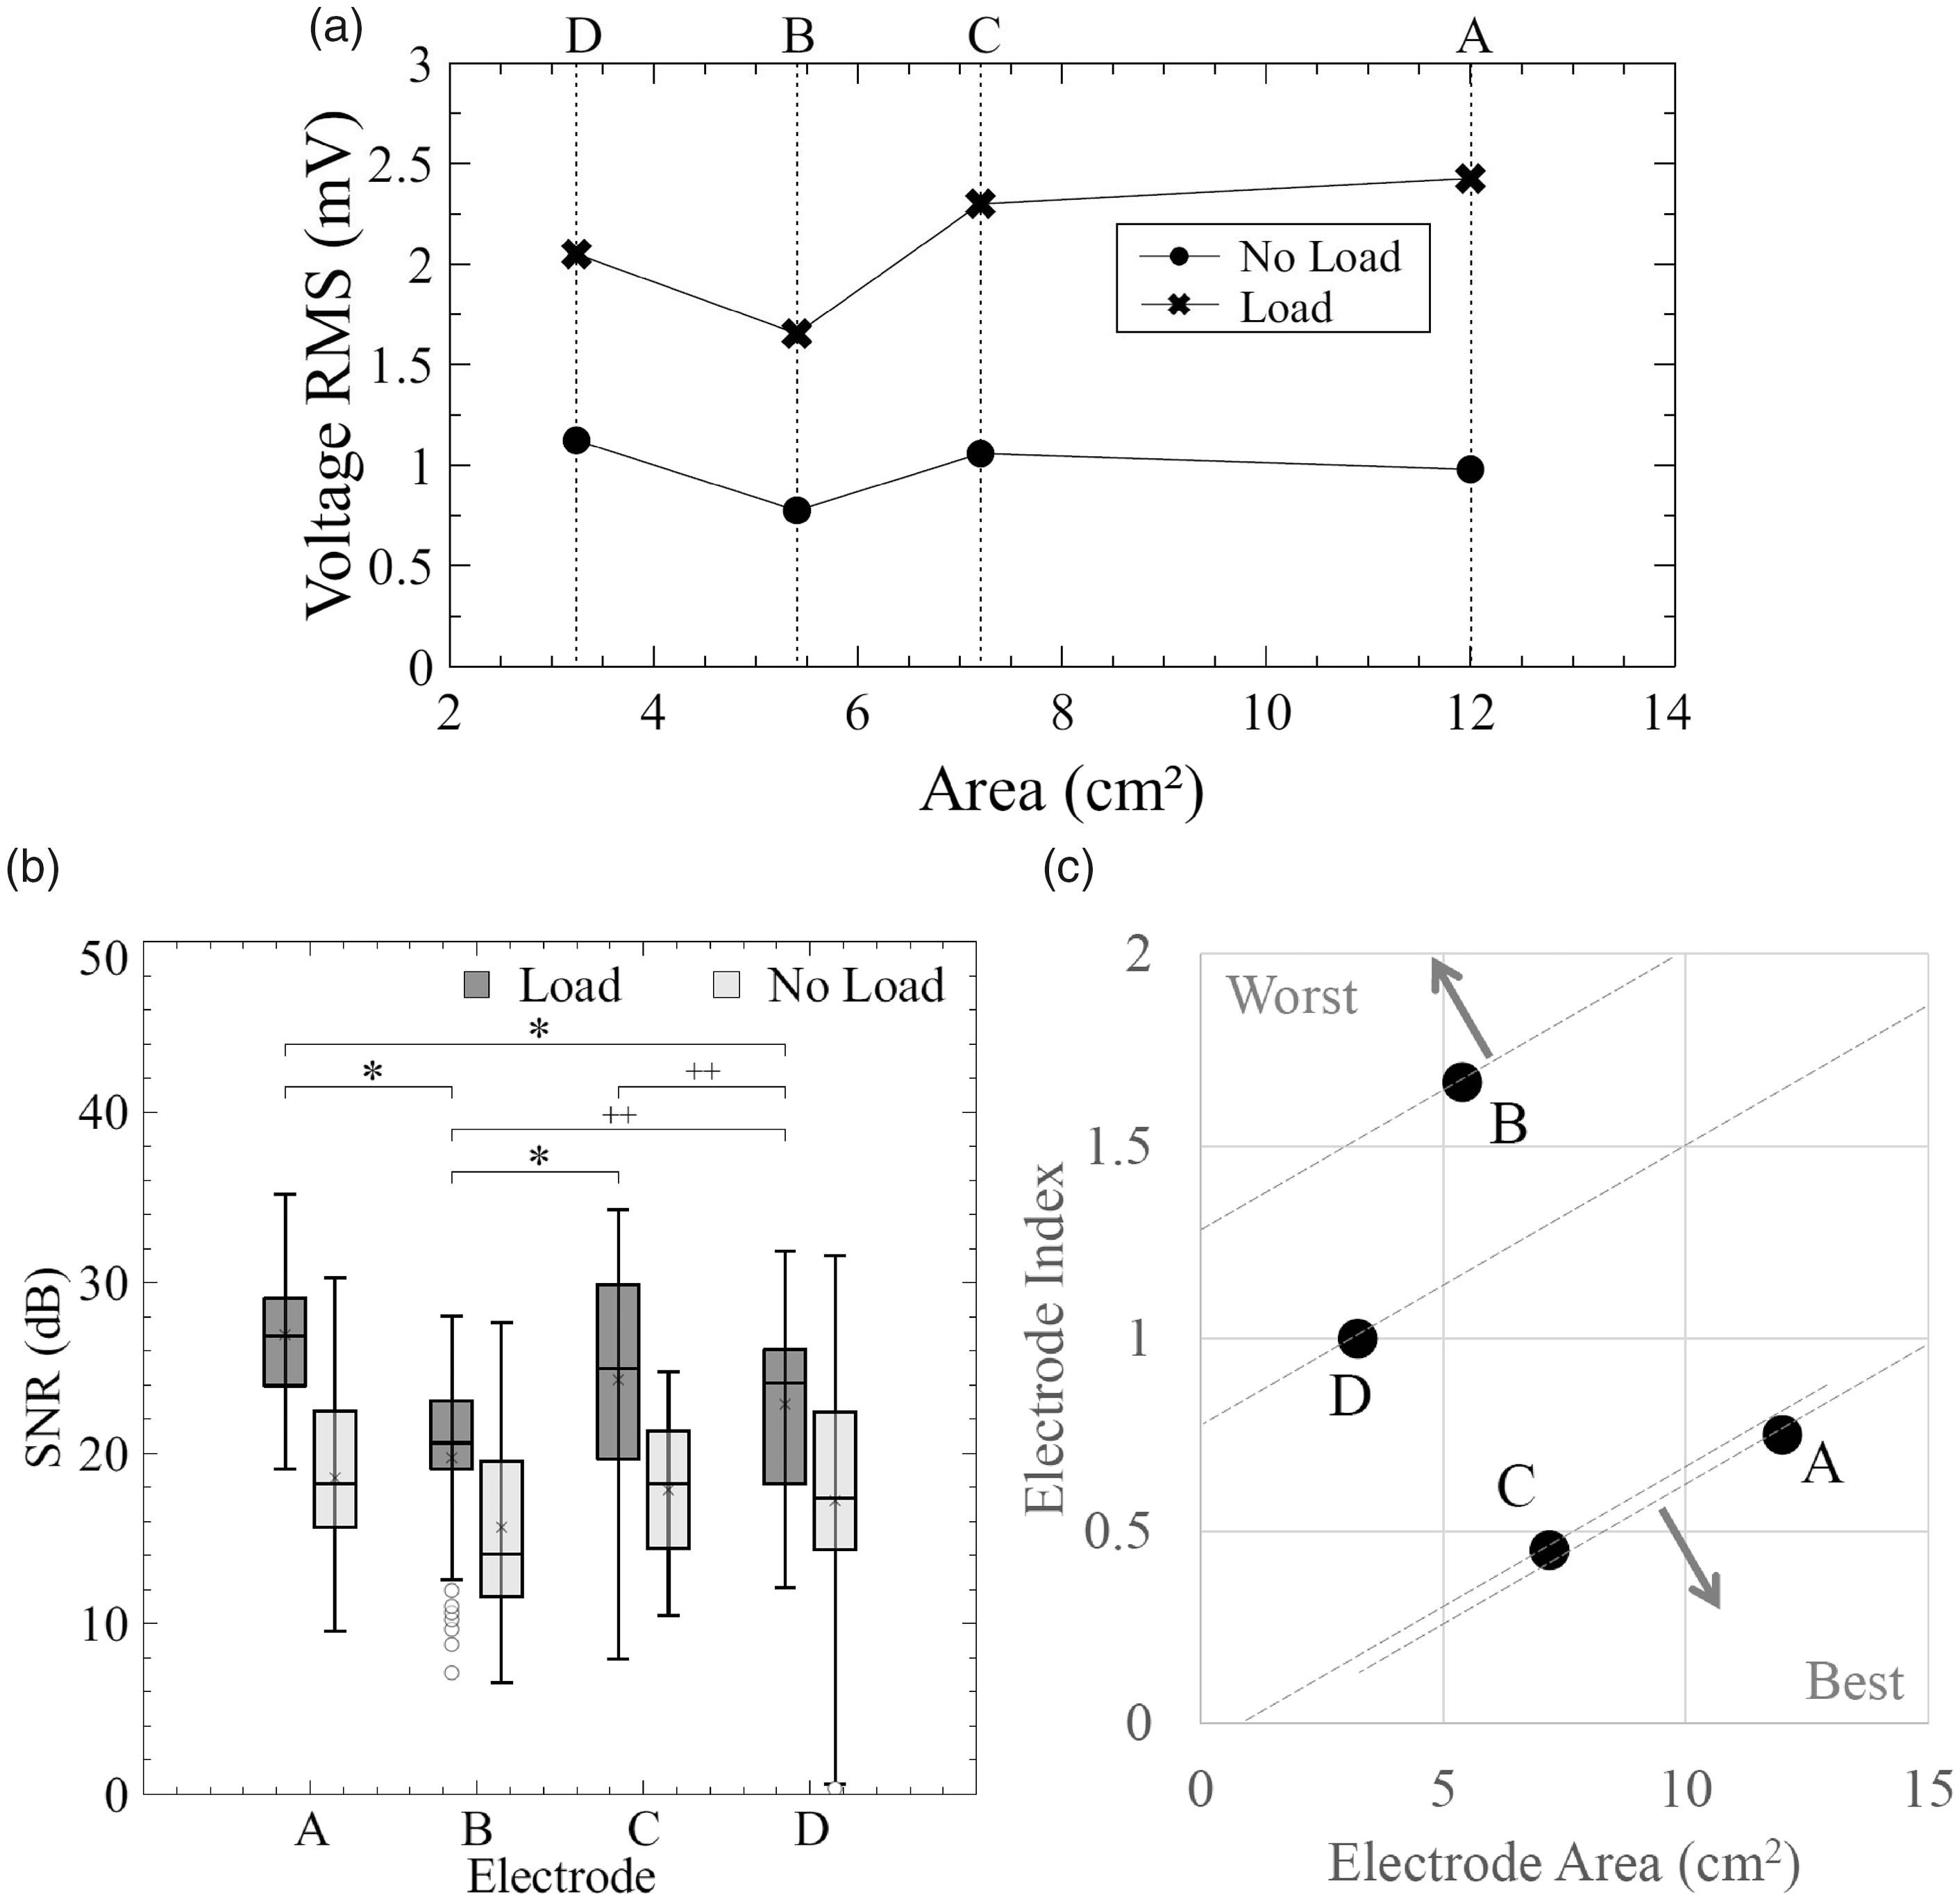
Voltage root-mean-square (RMS) for textile electrodes with regard to the surface area. Electrode size alone is a poor predictor of performance (a). Statistically significant difference is confirmed beyond the p < 0.05 threshold between every electrode pair, except A and C (b). A model that considers electrode size and shape explains this behavior (c). SNR: signal-to-noise ratio.
Finally, there were no reports of signs of irritation or discomfort on the skin of the subjects, suggesting there was no inflammatory response from the textile electrodes. Each electrode was placed on for 20 minutes and the total time for the experiment was about 80 minutes. No discomfort was reported from the subjects from wearing the elastic band for that amount of time.
Discussion
The present work studied the performance between four different textile electrodes of different sizes and standard gel-based electrodes on the biceps brachii of 13 subjects for sEMG signal acquisition. All textile electrodes record accurate, clean sEMG signals from the biceps brachii.
A visual comparison of the resulted signals shows an adequate similarity in their composition and response when compared to their Ag/AgCl electrode similes (Figure 4). A high-amplitude peak is seen on each textile electrode when muscle activity ceases before the 5-second resting period. This peak could be explained due to the piezoresistive deformation of the material. Also, all textile electrodes display an accurate frequency response. However, only textile electrodes A and C capture larger amplitudes compared to textile electrodes B and D. This means that electrodes A and C have a greater performance in accurately detecting sEMG signals and their frequency components.
In addition, quantitative measurements were obtained to better analyze the resulting signals. It is statistically determined that each textile electrode performed differently from the others (see Figure 7(b)), meaning all responses are different and each of them captures sEMG signals in a different way, either accurately or inaccurately. Also, it was determined that textile electrodes A and C performed the best since there is no statistical difference between them. All 13 subjects' SNR values are included in Figure 5 for all textile electrodes and their gel-based counterpart electrode. SNR values are notably smaller when subjects are not carrying a load than when they do, since the muscle force for a 2-kg load is stronger.
Textile electrode B shows large data variability when subjects carry a load and average values are much smaller than its gel-based counterpart electrode, which leads to a poor performance of signal strength. Figure 5 also shows the small amplitude signals that textile electrode B recorded as well as its frequency components. Finally, its voltage RMS is the smallest of all textile electrodes, as seen in Figure 7(a). Therefore, as mentioned in the previous section, textile electrode B shows the worst behavior for sEMG signal acquisition.
Textile electrode D presents consistent values for SNR when subjects carry a load. A large data variability is, however, found when subjects do not carry a load, meaning a less accurate performance for signal strength. However, textile electrode D recorded better sEMG signals than textile electrode B. Its voltage RMS is also greater than that of electrode B and is even almost equal to those of electrodes A and C. However, in most subjects, the signals are not completely clean (large noise baseline) and, thus, resulting in large data variability of the SNR. Textile electrode D is rated to have a good performance.
Textile electrode C can clearly capture accurate sEMG signals (see Figure 4). Its voltage RMS is almost equal to textile electrode A and greater than the other electrodes. Its average SNR value is the second highest and with the least standard deviation when subjects do not use a load (see Table 1). Textile electrode C can be categorized as having a great performance.
Finally, textile electrode A showed the best performance of all textile electrodes. It is able to clearly capture sEMG signals from the muscle with minimal baseline noise. Their frequency components are within acceptable range. SNR values are consistent and very close to its gel-based counterpart electrode, especially when subjects use a load (see Table 1 and Figure 6). Average values for voltage RMS and SNR when subjects carry a load are the highest. Overall, textile electrode A has the best capacity to capture clear sEMG signals from the biceps brachii.
Statistically, all textile electrodes perform differently, which is due to their difference in shape and size. Textile electrode B has a horizontal-like shape that, when placed, is not parallel to the muscle fibers of the biceps brachii. Textile electrode D has the smallest size and can surprisingly perform better than electrode B. It is possible that since it does not have a clear orientation (parallel or perpendicular) to the muscle fibers, its performance is great despite its size. However, when subjects did not use a load it shows a poor performance in its signal strength (SNR), such as displaying values close to 1 dB. Therefore, it would be inadequate to be fully considered for further applications.
Textile electrodes A and C have shown the best performance. Their sizes are similar and the difference between them other is their width (see Figure 2(c)). Both textile electrodes are placed parallel to the muscle fibers of the biceps brachii. Evidently, when a textile electrode is placed parallel to the muscle fibers, its performance is best for signal acquisition with a great SNR. Electrodes A and C present different surface areas but both have a length of 4 cm, which is placed parallel to muscle fibers of the biceps. These results suggest the following: (1) a larger area should be considered when designing a textile electrode for sEMG signal acquisition; (2) the shape and position of the electrode matters in signal acquisition, depending on the muscle fiber direction; (3) adding a load can notably affect the signal quality and noise filtering of textile electrodes; and (4) for the biceps brachii muscle, a vertical parallel-oriented to the muscle fiber shape, with areas between 7.2 and 12 cm2, is appropriate for sEMG signal acquisition.
In the literature, the study of dry electrodes for sEMG is poorly reported. 17 Usually, authors tend to use small sized electrodes for sEMG, as standardized gel-based electrodes for this application are also small (diameter of 10 mm). 7 , 18 In this study, we choose to expand the surface area of the electrodes to cover the muscle surface as much as possible. Seemingly, signal strength has a larger magnitude for a larger surface area. Pani et al. 14 states that a reduction in the surface area of an electrode can lead to a reduced signal quality. However, the authors do not focus on proving that statement and the study is performed on ECG dry electrodes. Moreover, Pani et al. 24 present two different sizes of textile electrodes for sEMG. Their electrodes were screen-printed on cotton fabric with conductive ink. Dry and saline electrodes were tested on the tibialis anterior muscle. Their performance was compared to standard Ag/AgCl sEMG electrodes. Even though the differences in the studies lie in the muscle of interest and the manufacture of the textile electrode, their results are consistent with the present study as their smallest textile electrode presents more RMS voltage noise (mV) than their largest electrode. Evidently, a large surface area can improve signal quality. However, one must be careful with the size of the electrode since muscle cross-talk is possible for certain muscle groups, notably the quadriceps. Also, the authors conclude that the addition of hydrogel on textiles can improve signal quality compared to standard gel-based electrodes. Other authors have evaluated the use of hydrogels in textile or dry electrodes, 20 , 30 as they improve the skin-contact impedance and overall signal recording. Further research on the application of hydrogel on the presented type of textile electrodes could ensure a reduction of noise on sEMG signals.
In addition, the orientation of the studied textile electrode with respect to the muscle fibers is also poorly reported in the literature. 17 The present study has clearly made an objective to report the difference on the shape of the electrode (notably its vertical or horizontal orientation) with respect to the muscle fibers of the biceps brachii. Our results conclude that there is a statistical difference between each of the tested textile electrodes and, thus, between each shape. A textile electrode oriented parallel with the muscle fibers has the best performance to acquire sEMG signals compared with an electrode placed with perpendicular orientation (the difference between textile electrodes A and C, and B). However, as mentioned, a large surface area could present the possibility of muscle cross-talk as well as changes in the electrode impedance. Therefore, the authors suggest that further studies are conducted to differentiate between larger and smaller areas of dry electrodes by keeping the concept of parallel orientation with muscle fibers. Considering the results of the present study, it is possible that the orientation of the electrode plays a bigger role than surface area for a stronger sEMG signal.
Finally, the limitations of this study cover the fact that the textile electrodes are rectangular-shaped and would only be used on the biceps brachii specifically. For this long muscle with a limited width, the electrodes are modeled to fit this anatomy. For other muscles, such as the trapezius, the shape and size of the textile electrodes would have to change to properly acquire sEMG signals. A second limitation is the lack of portability in the design of the electrode setup. For long-term monitoring use, further implementation of a small and portable solution for the signal acquisition and processing must be done to ensure a safe recording of sEMG signals for multiple hours. Nevertheless, the conductive fabric on the textile electrodes is overall safe to use as for this study.
Conclusions
This work presented a functional set of textile electrodes of varying sizes and shapes. These components were tested alongside comparable Ag/AgCl electrodes on the biceps brachii muscle of 13 individuals. Subjects performed controlled isometric contractions with and without holding a weight with intermediate resting periods. Both the movements and the resting periods generated unique signals that were recorded with the textile and Ag/AgCl electrodes. Statistical information, such as signal mean, variance, and normality, were extracted from these fragments. Furthermore, a statistical analysis was performed in order to assess whether divergences in the data sets were the result of real differences between the electrodes or just natural variation. The results align with the current literature that indicates the dominance of Ag/AgCl electrodes over their textile counterparts. However, the data sets also showed that electrode size and shape determine signal strength and quality in textile electrodes. Electrodes with larger surface areas and with shapes that more closely match the target muscle produced a stronger signal. A model that accounts for these parameters was presented in the document. This model corresponds with the experimental data and confirms the results in which electrode size alone does not always translates into an enhancement of the EMG signal. Furthermore, the present study has achieved reporting of proper information of sEMG electrodes according to the recommendations of the SENIAM: electrode size and shape (refer to Figures 2(b) and (c)), electrode materials (silver-plated conductive fiber fabric), ensemble of electrodes (bipolar), IED (2 cm, as per recommendation), and instrumentation (Biopac MP35 for biosignals). The general application of this study was to present a detailed methodology and design for textile electrodes for sEMG signal acquisition.
Textile electrode size alone is a poor predictor of performance. For example, electrode D is smaller than electrode B, but presents a stronger signal when the subject carries a load (see Figure 7(a)). A model that accounts for electrode size and shape explains the improved behavior of electrode D over electrode B. It also explains the similarity between electrodes A and C regardless of their difference in area (see Figure 7(c)).
This work shows that textile electrode signal strength depends on surface-of-contact shape and area. The effect of contact area is well known in the research community. The role of shape is less clear and has received less attention than size in the literature reviewed for this work. This points towards untapped potential for textile electrodes in applications where other technologies struggle. Wearable technology and personal self-monitoring devices represent such niches.
Subject body build was not a selection factor and did not present an apparent effect in these experiments. It is not possible, however, to disregard the possibility that some body builds can affect the performance of textile electrodes. Further work will address how different morphological parameters affect textile electrode behavior.
Further work will also focus on muscles and muscles complexes that are not as well isolated as the biceps brachii and whose fibers do not present the same degree of alignment. Namely, muscles such as the trapezius and the gluteus maximus present fibers that radiate in contrast to the parallel fibers of the biceps brachii. Similarly, the muscles that control the wrist, hand, and finger movements are bundled in the forearm (e.g. flexor carpi radialis, pronator teres, palmaris longus, and flexor carpi ulnaris). Future work attending to this and similar muscle groups will have to analyze the effect on signal quality of centimeter-scale displacements of electrode position. Signal acquisition and muscle action discernment represents a challenge. The effectiveness of custom shape electrodes to tackle this challenge needs to be studied.
Footnotes
Author contributions statement
CSB and EPM conceived the experiments, CSB and EPM conducted the experiments, CSB, EPM, and RR analyzed the results, and CSB, EPM, RR, and ERL reviewed the manuscript.
Acknowledgements
The authors would like to acknowledge the Instituto Nacional del Emprendedor (INADEM) for supporting this research, as well as the participation of Mr Fernando Gomez and Mr Rodrigo Anza during the experimental protocol design and development. The authors thank Consejo Nacional de Ciencia y Tecnologia (CONACyT), e-Robots Research Chair and the Laboratorio de Robotica, and Escuela de Ingenieria y Ciencias from Tecnologico de Monterrey, Campus Monterrey, for supporting this research. The authors thank José León for facilitating the Biopac MP35 (Biopac Systems, Inc.) EMG measuring equipment used in this work.
Declaration of Conflict of Interest
The author(s) declare the following competing interests: E Rodriguez-Leal and E Piña-Martínez are co‐founders of Wearobot S.A.P.I. de C.V., which is mentioned in this article.
Funding
The author(s) disclosed receipt of the following financial support for research, authorship, and/or publication of this article: The authors received financial support from Instituto Nacional del Emprendedor (INADEM) and Consejo Nacional de Ciencia y Tecnologíafor the research presented in this article.
