



Abstract
When a garment is given a certain amount of ease, the body shape characteristics and matching degree of air gap distribution determine the aesthetic fit of garment sculpt. The purpose of this study is to investigate the relationship between the aesthetic fit and air gap distribution of the bust and waist sections. Three factors, the ratio of the horizontal radius vector to the bust and waist sections (HrvB, HrvW) and the location and proportion of darts (DL, DP), have been considered in this analysis. Ten female participants with different Hrv (including HrvB and HrvW) were recruited and asked to wear 10 sample blouses with different DL and DP. Samples worn by participants are observed at different angles, and evaluated with scores by 30 experts. The air gap thickness (THA) between the garment and skin are measured by a TC2 scanner and Qualisys three-dimensional motion capture system. The results show that Hrv is the most important factor affecting the aesthetic fit, while DL and DP have significant influence on the formation of garment wrinkles. A round body shape has higher scores when wearing sample garments whose waist dart is close to the front and middle (samples L2, L3) and smaller back middle dart and front waist dart (samples P1, P2), while a flat body shape has higher scores in the opposite condition (sample L5, P5). In terms of air gap distribution, there is a significant positive correlation between HrvB and THA in the front area (132–180°). Here, HrvW was negatively correlated with THA in the back side area. The correlation coefficients are all above 0.6. The DL has a great influence on THA in the side area of the bust section and front side area of the waist section, while DP has a great influence on THA in the front and back areas of the bust section and the back side area of the waist section. In a comparative analysis, this paper proved that the smaller fluctuation of THA and the uniform ease distribution are more likely to present an aesthetic and fit dressing appearance. Although the relationship between THA and the three factors was not significant, the regularity of its distribution is accompanied by a significant change of dressing score.
Aesthetic fit is the unity of fit and beauty in the state of dress. It refers to the silhouette when a garment dovetails with the body shape. Garment patterns modified according to the aesthetic fit can meet consumers’ demands better. The current methods of garment fitness assessment include subjective evaluation, virtual try-on, and definition of ease, which show how the garment fits the human body through stress assessment, appearance, and mathematical modeling.1–6
Good fit is important for garments and has been used for a long time. Poor fit is one of the predominant reasons for disposal of garments, especially for women's clothing. Therefore, a further study on the reasons that affect aesthetic design of key parts of fitting garments is needed imperatively. Only after grasping the reasons for the changes in the laws of aesthetic fit can we design garment patterns based on aesthetics. Aesthetic design includes decorative pattern design, fabric design, and pattern design. Ease is the allowance in garment patterns when taking human movement, breathing, and body surface retraction into consideration. Pattern design is the combination of ease and darts, 7 which produces different appearance such as folds, contour line, split lines, etc., 8 and influences the aesthetic fit. In turn, dart design also has an important impact on the change in dressing appearance.6,9 However, in existing researches, the location and value of dart settings generally depend on the experience of designers. 10 Thus, a method of pattern design that has mathematical regularity needs more exploration.
The wearer’s body characteristics are also an important factor that affects aesthetic fit. 11 Variations of body shape, such as size and height, on the bust and waist lead to different pattern designs.12–17 Compared with the circumference information, the ratio of the horizontal radius vector (Hrv) to the characteristic sections can represent the body shape in the lateral direction. 18 Existing studies classify the human body into a round shape, middle size, and flat shape according to the characteristic sections, such as the bust section and waist section. 19 The effect of body shape change and pattern design on the appearance of garments can be explored by observing the change of air gap thickness (THA) in the characteristic sections.20,21 Since the essence of personalized customization is to combine the body information and ease value to form a fitting garment according to the body’s characteristics, 22 it is necessary to combine pattern design and body characteristics together.
THA, the space distance from the body surface to the garment, reflects the difference between the body and the garment. It is an important factor that can affect the garment shape, thermal properties, wet comfort, protection, and mobility.23–28 It has a great influence on the assessment of garment fitness,1,29 the improvement of protective garment performance,30,31 and three-dimensional (3D) clothing design. In virtual fitting or design software, THA can be calculated directly through the virtual try-on system. In static wear trials, it is obtained by two aligned 3D images of the body and garment processed in computer-aided design (CAD) software, such as Geomagic,15,32,33 scanned from a 3D scanner when the garment fits a specific dummy. In dynamic wear trials, the curve of the body is fitted with coordinate information of marked points captured by a motion capture system with the steepest descent method. 34 Existing studies showed that the distribution of THA in different areas of the body demonstrated completely different trends, which were also different with the change of body shape.22,35 In pattern modification guided by air gap distribution, researchers intended to distribute it evenly through modifying the darts and ease. 32 However, whether the evenly distributed THA could bring aesthetic fit and dynamic comfort is still worthy of in-depth study.
In this paper, participants with different Hrv were selected. Ten blouses with the same sizes but different locations and proportions of darts (DL, DP) were made as the sample garments. By observing the aesthetic fit and air gap distribution of the bust and waist sections caused by the variation of factors including Hrv, DL, and DP, the influence of dart designs on different body shapes was evaluated, thus providing the preliminary basis for garment making.
Experimental details
Garments and fabric
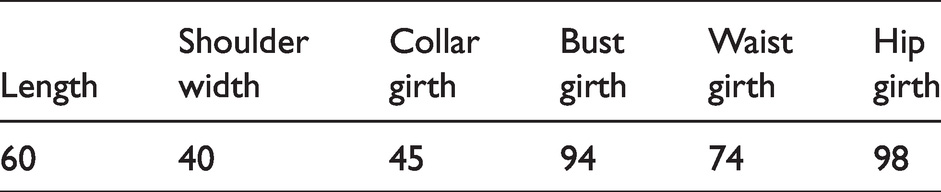
The sample blouse was a sleeveless fitted blouse designed on the basis of the seventh Generation of Japanese cultural prototype. 36 It was made up of two pieces, and the darts were set at the shoulder, armpits, and waist respectively. Waist darts were at the back middle, back waist, side seam, and front waist. Eases at the bust, waist, and hip were 10, 8, and 8 cm, respectively. The specifications are shown in Table 1.
Specifications of the sample blouse (cm)
According to the common methods of garment pattern making,37–39 we designed five scenarios of location for waist darts, labeled as L1, L2, L3, L4, L5. The front waist dart (Df) of L1 is 6.9 cm left of the front middle line, and the back waist dart (Db) is 8.9 cm right of the back middle line. Based on L1, the Df values of L2, L3, L4, L5 were moved 1 cm to the left, and the Db values were moved 2 cm to the right (shown in Figure 1).
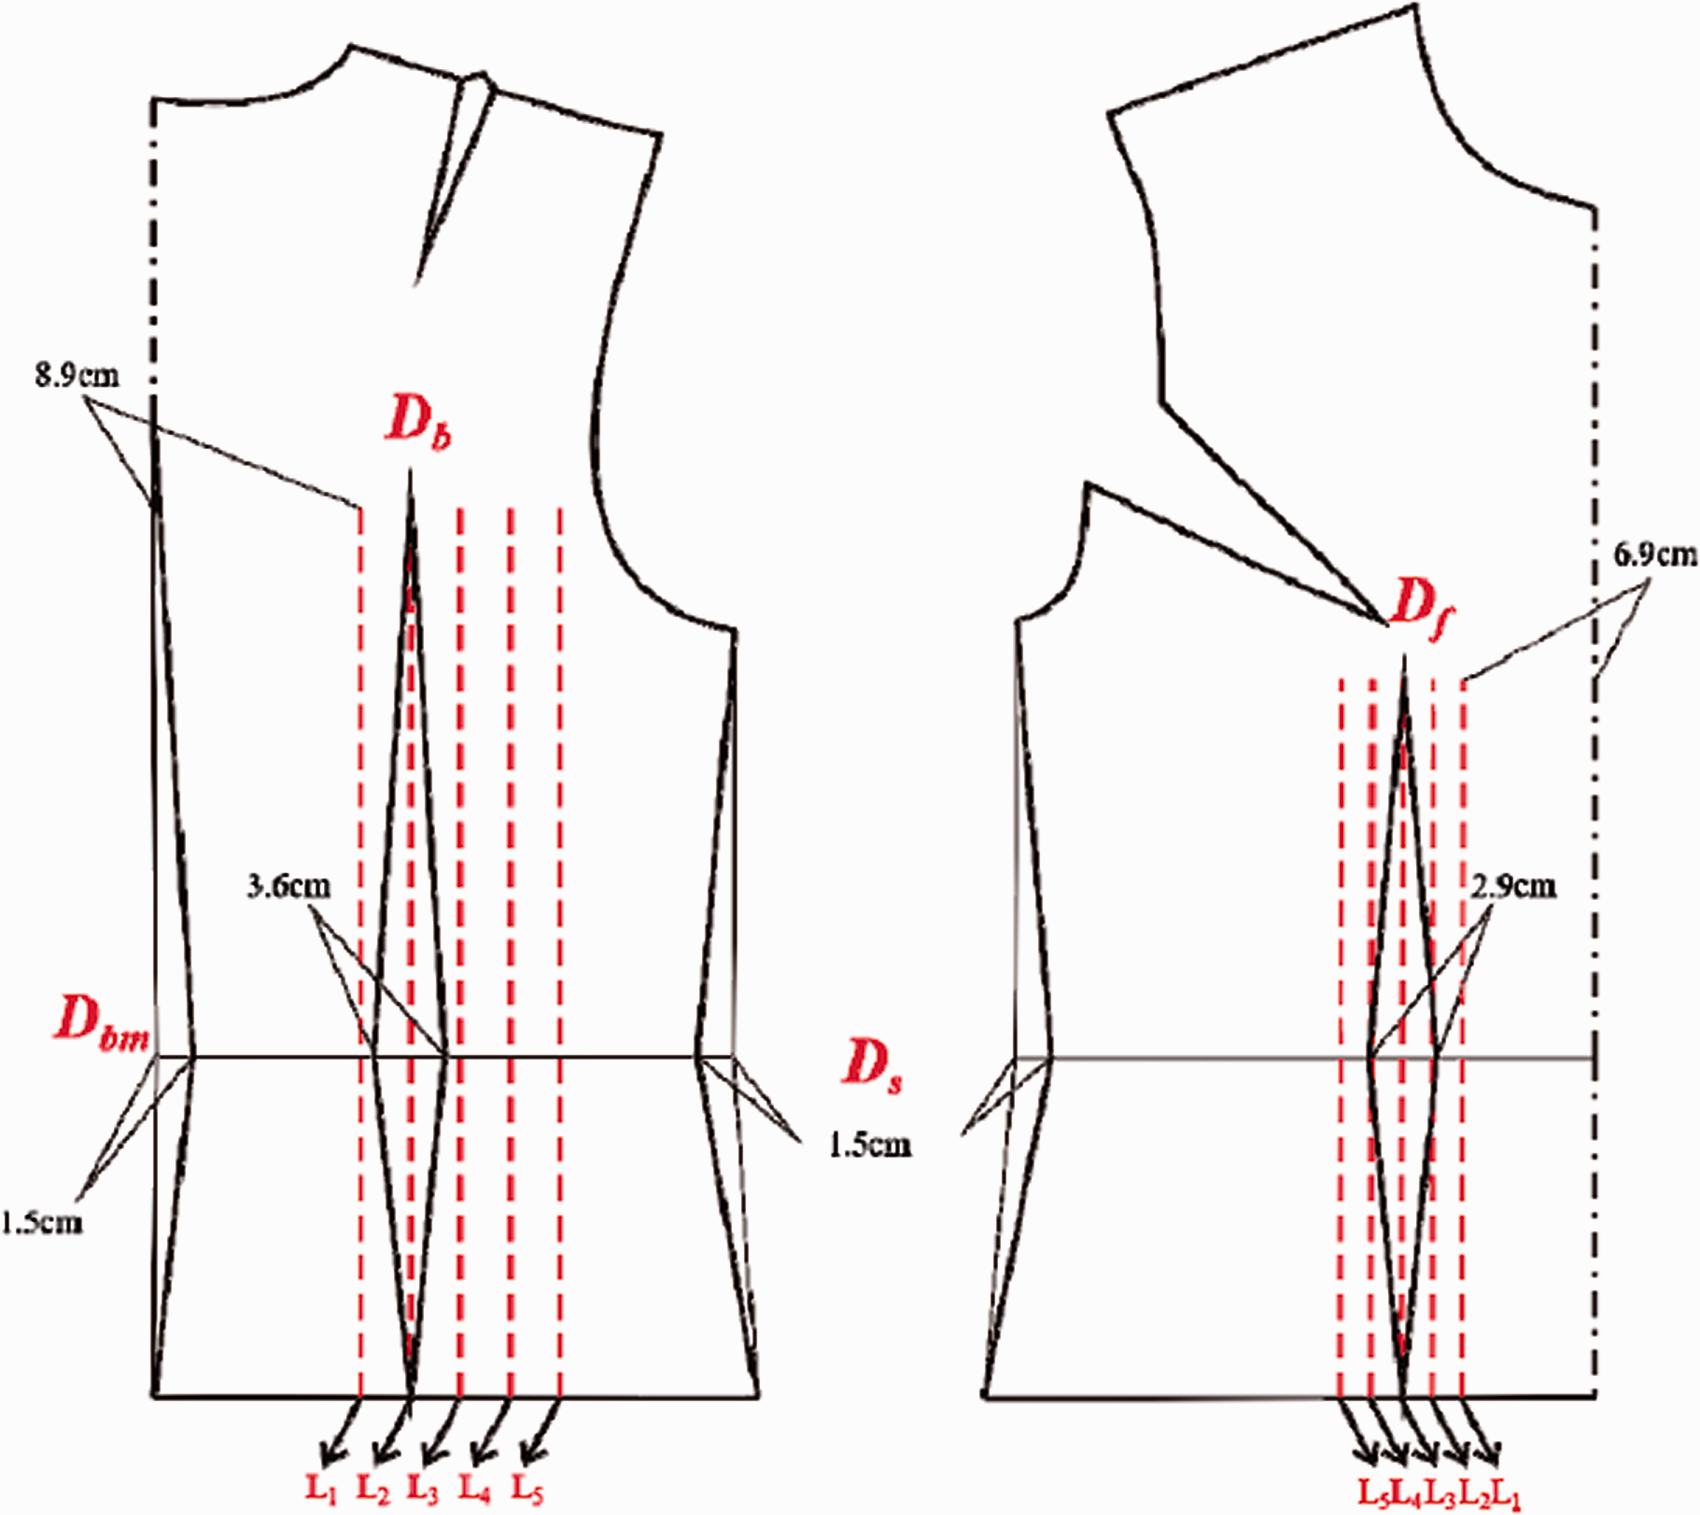
Patterns for the sample blouse.
Taking the proportion of darts into consideration, we used L3 as the benchmark dart; five different proportions were set and labeled as P1, P2, P3, P4, P5. The value of the waist dart is 8 cm. As shown in Table 2, from P1 to P5, the proportions of the back middle dart (Dbm) and front waist dart (Df) increased, while back waist dart (Db) and side dart (Ds) decreased.
Proportion of darts (the waist dart value is 8 cm, and each row total is 100%)

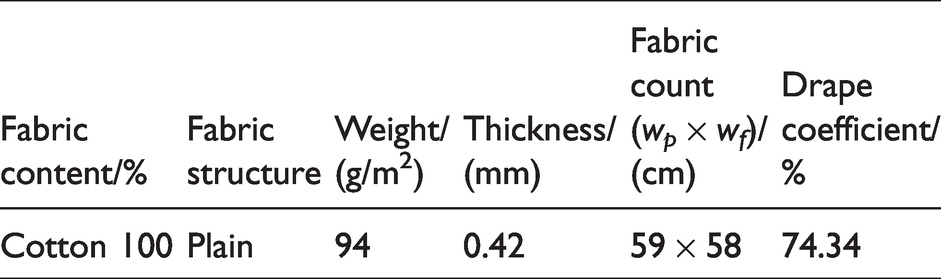
The samples were made according to the pattern shown in Figure 1 and there was a 35 cm invisible zipper in the right-hand seam. A 100% cotton fabric was selected as the material for samples; the specific parameters are shown in Table 3.
Fabric specification
Participants
A TC2 scanner, NX-16 (TC2, Cary, North Carolina, USA), which can take more than 180 items of anthropometry data of the human body, was used to collect the body information of the subjects. In this paper, over 50 young female participants aged from 18 to 25 from Zhejiang province in China were selected for the experiment. Their heights, bust girth, and waist girth ranged from 155 to 165, 82 to 86, and 67 to 71 cm, respectively. The information of the participants is shown in Table 4. The degree of flatness of the subjects’ body shapes was classified according to the ratio of the horizontal radius vector of bust and waist sections (HrvB, HrvW). Here, Hrv, which including HrvB and HrvW, can be calculated by Equation (1)18

Information about participants

There were subjects with a relatively small HrvB (round bust) and a relatively large HrvW (flat waist), or the opposite. Ten females with HrvB ranging from 1.21 to 1.43 and HrvW from 1.25 to 1.50 were selected as the subjects. Their Hrv presented approximately an arithmetic progression. As shown in Figure 2, according to the shape of the bust and waist sections, the body shape of these 10 participants was divided into the categories of barrel shape, normal shape, and flat shape.
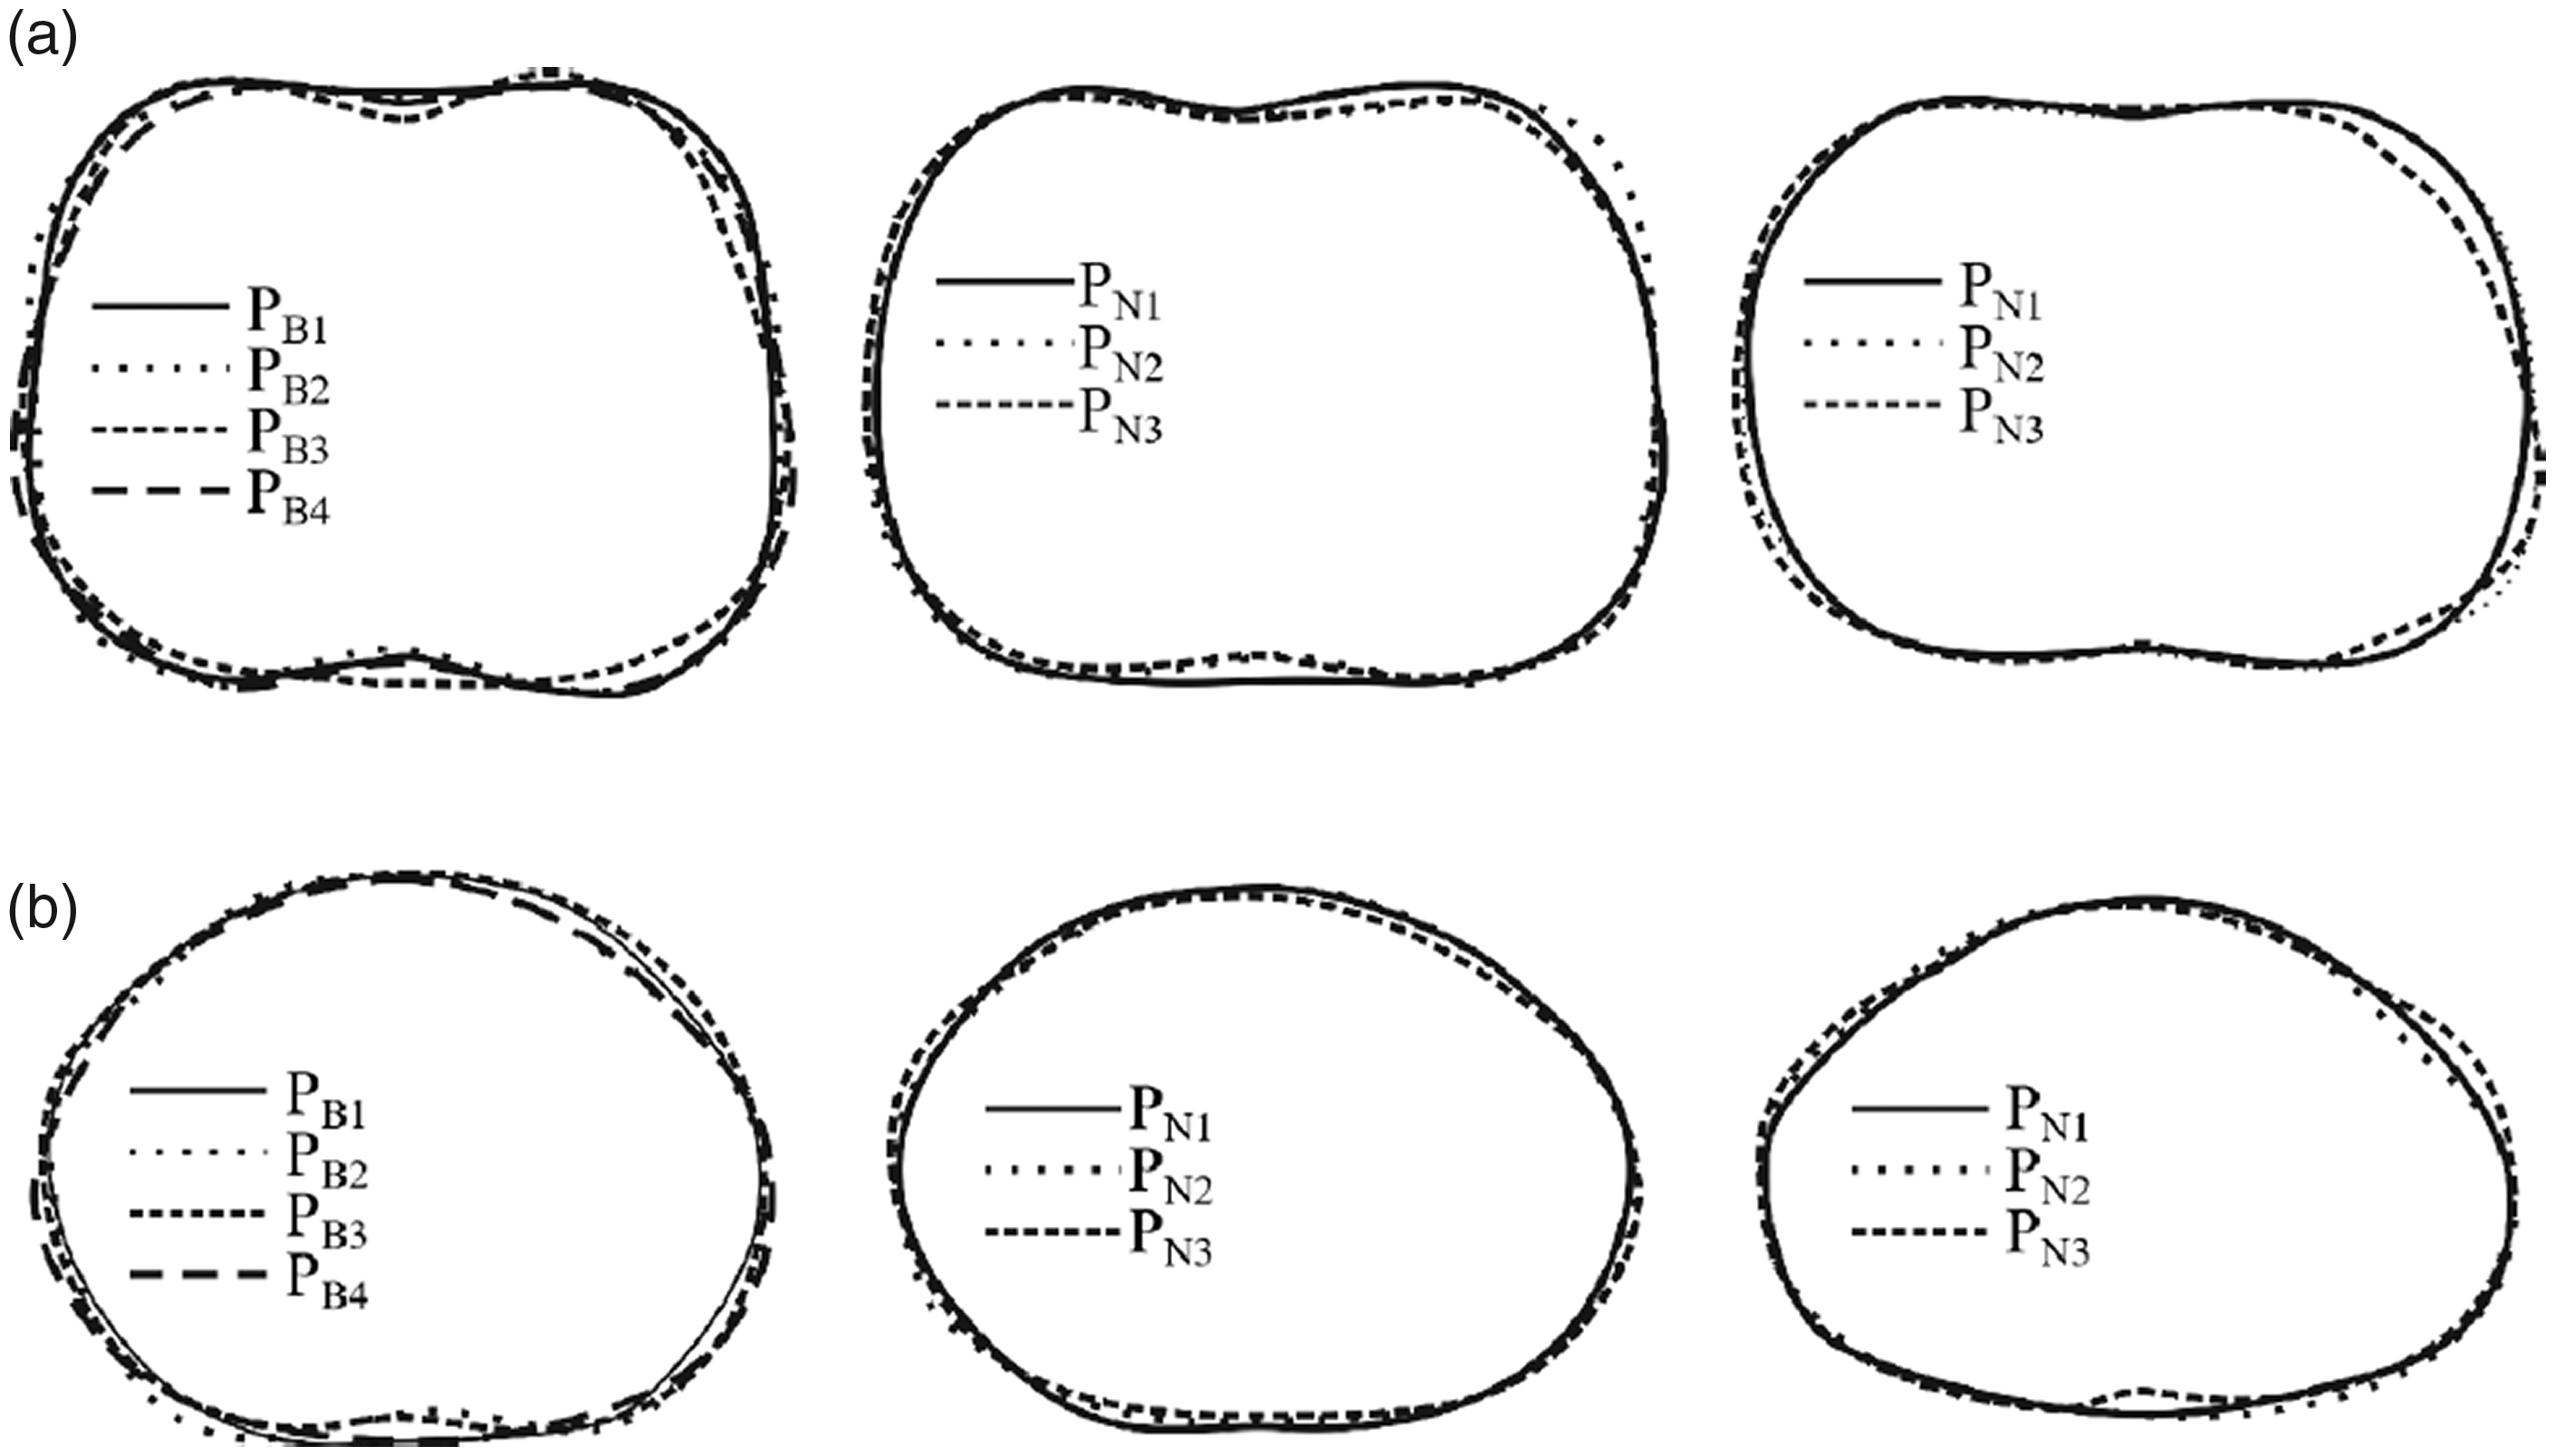
Bust and waist sections of participants: (a) bust sections; (b) waist sections.
Subjective evaluation
The participants were asked to put on the tested samples immediately after body scanning to ensure that their body morphology was basically consistent with the scanning results after the samples were worn. When trying on the samples, they were required to wear experimental body-fitted underwear and leggings in a light color. The garments were ironed before dressing and hung at a distance of 20 cm for storage. Participants were required to retain natural standing postures during scanning and keep their hands and elbows open slightly.
Subjective evaluation was obtained by dressed image scoring, taking the body center as the center of a circle and body width as the horizontal coordinate axis. A Canon 5D digital camera with pixels of 6000 × 4000 was set up at a height of 1.2 m above the ground and a distance of 1.5 m away from the body to capture images at 0°, 90°, and 180°. Figure 3 shows the position of participants and the setup of the camera.
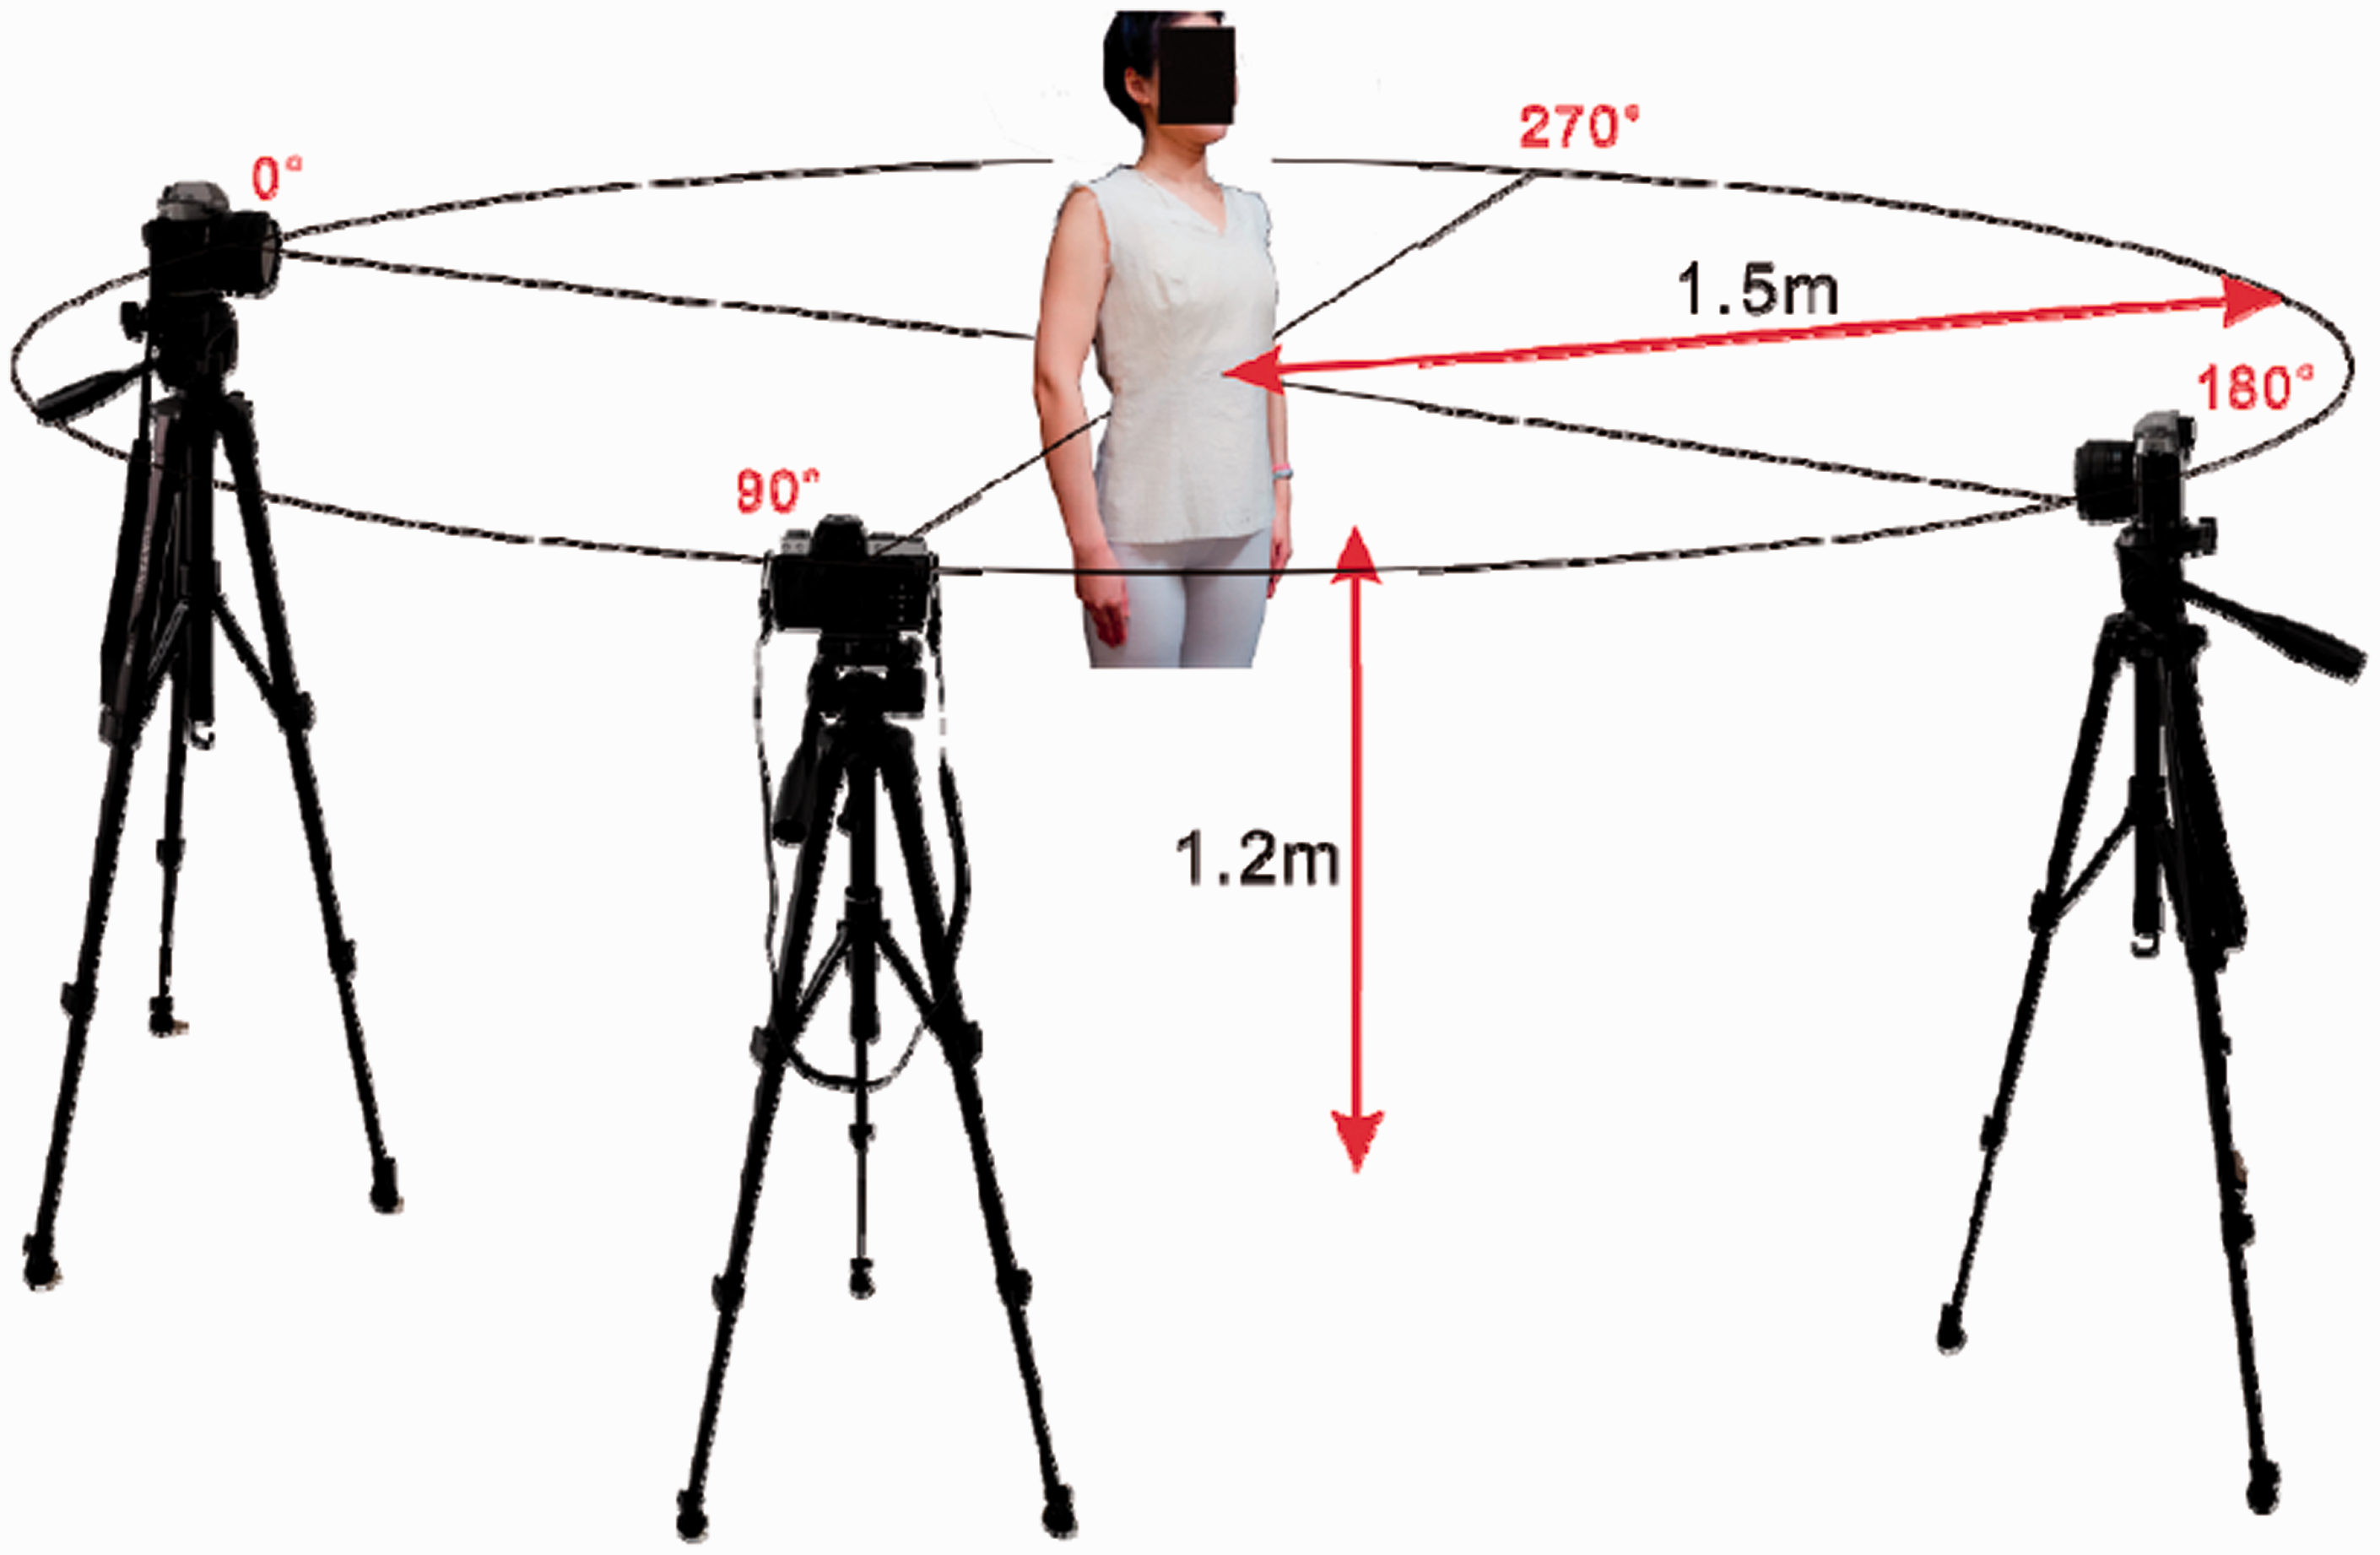
Positions of the body and the camera.
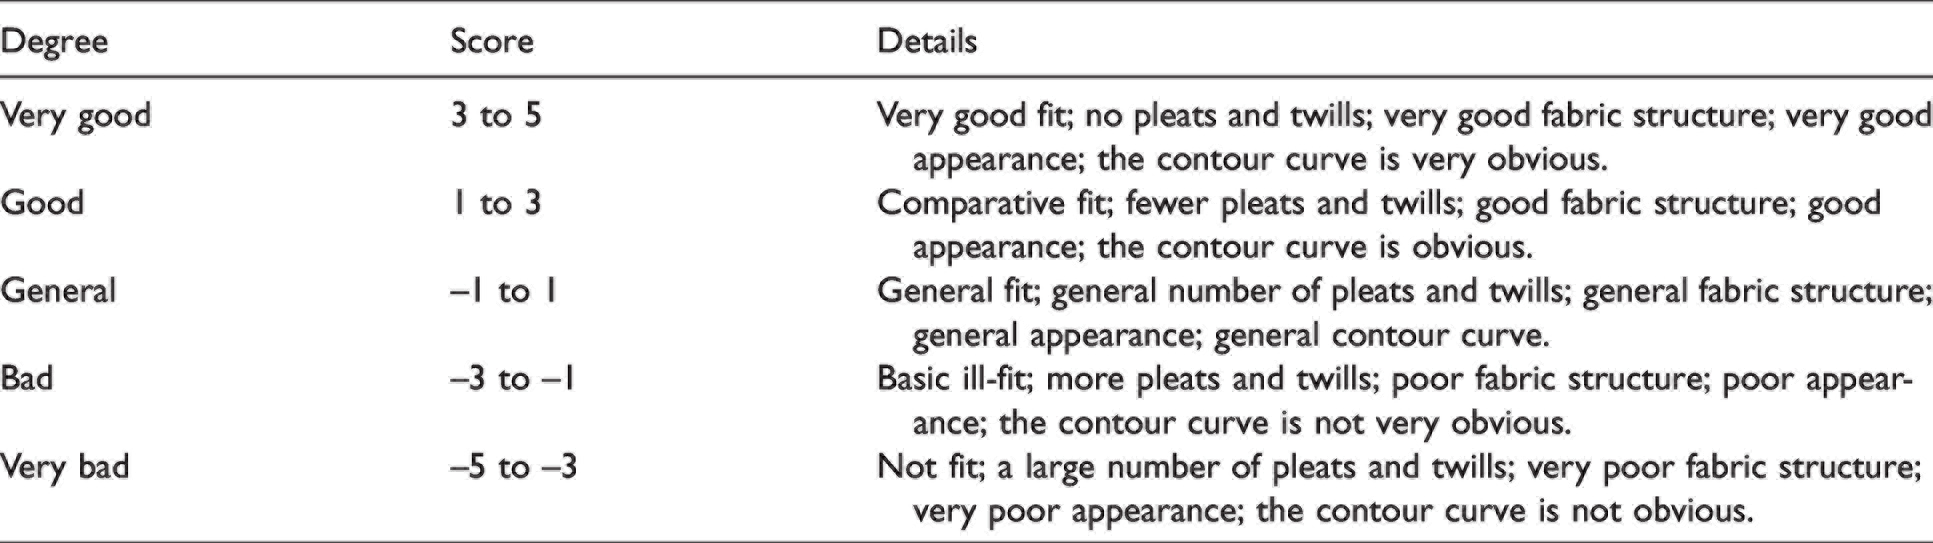
The dressing effect was evaluated with scores by subjective evaluation and prepared in the form of a questionnaire to 30 experts (15 males and 15 females). They were garment researchers and practitioners and had at least 4 years of professional training. In order to avoid visual fatigue caused by too many samples in a short time, and ensure the effectiveness and accuracy of the evaluation results, each expert was required to fill in the questionnaire at intervals of 0.5 h or more. Each questionnaire contained 300 pictures (10 subjects * 10 sample conditions * 3 angle degrees). The criteria of evaluation included the fitting, the presence of body curves, and the flatness of fabric, as shown in Table 5. A Likert scale [1-5] was used to give a score to each item. A higher score represented a better aesthetic fit. Figure 4 shows three evaluation angles of PF2.
The criteria for evaluation
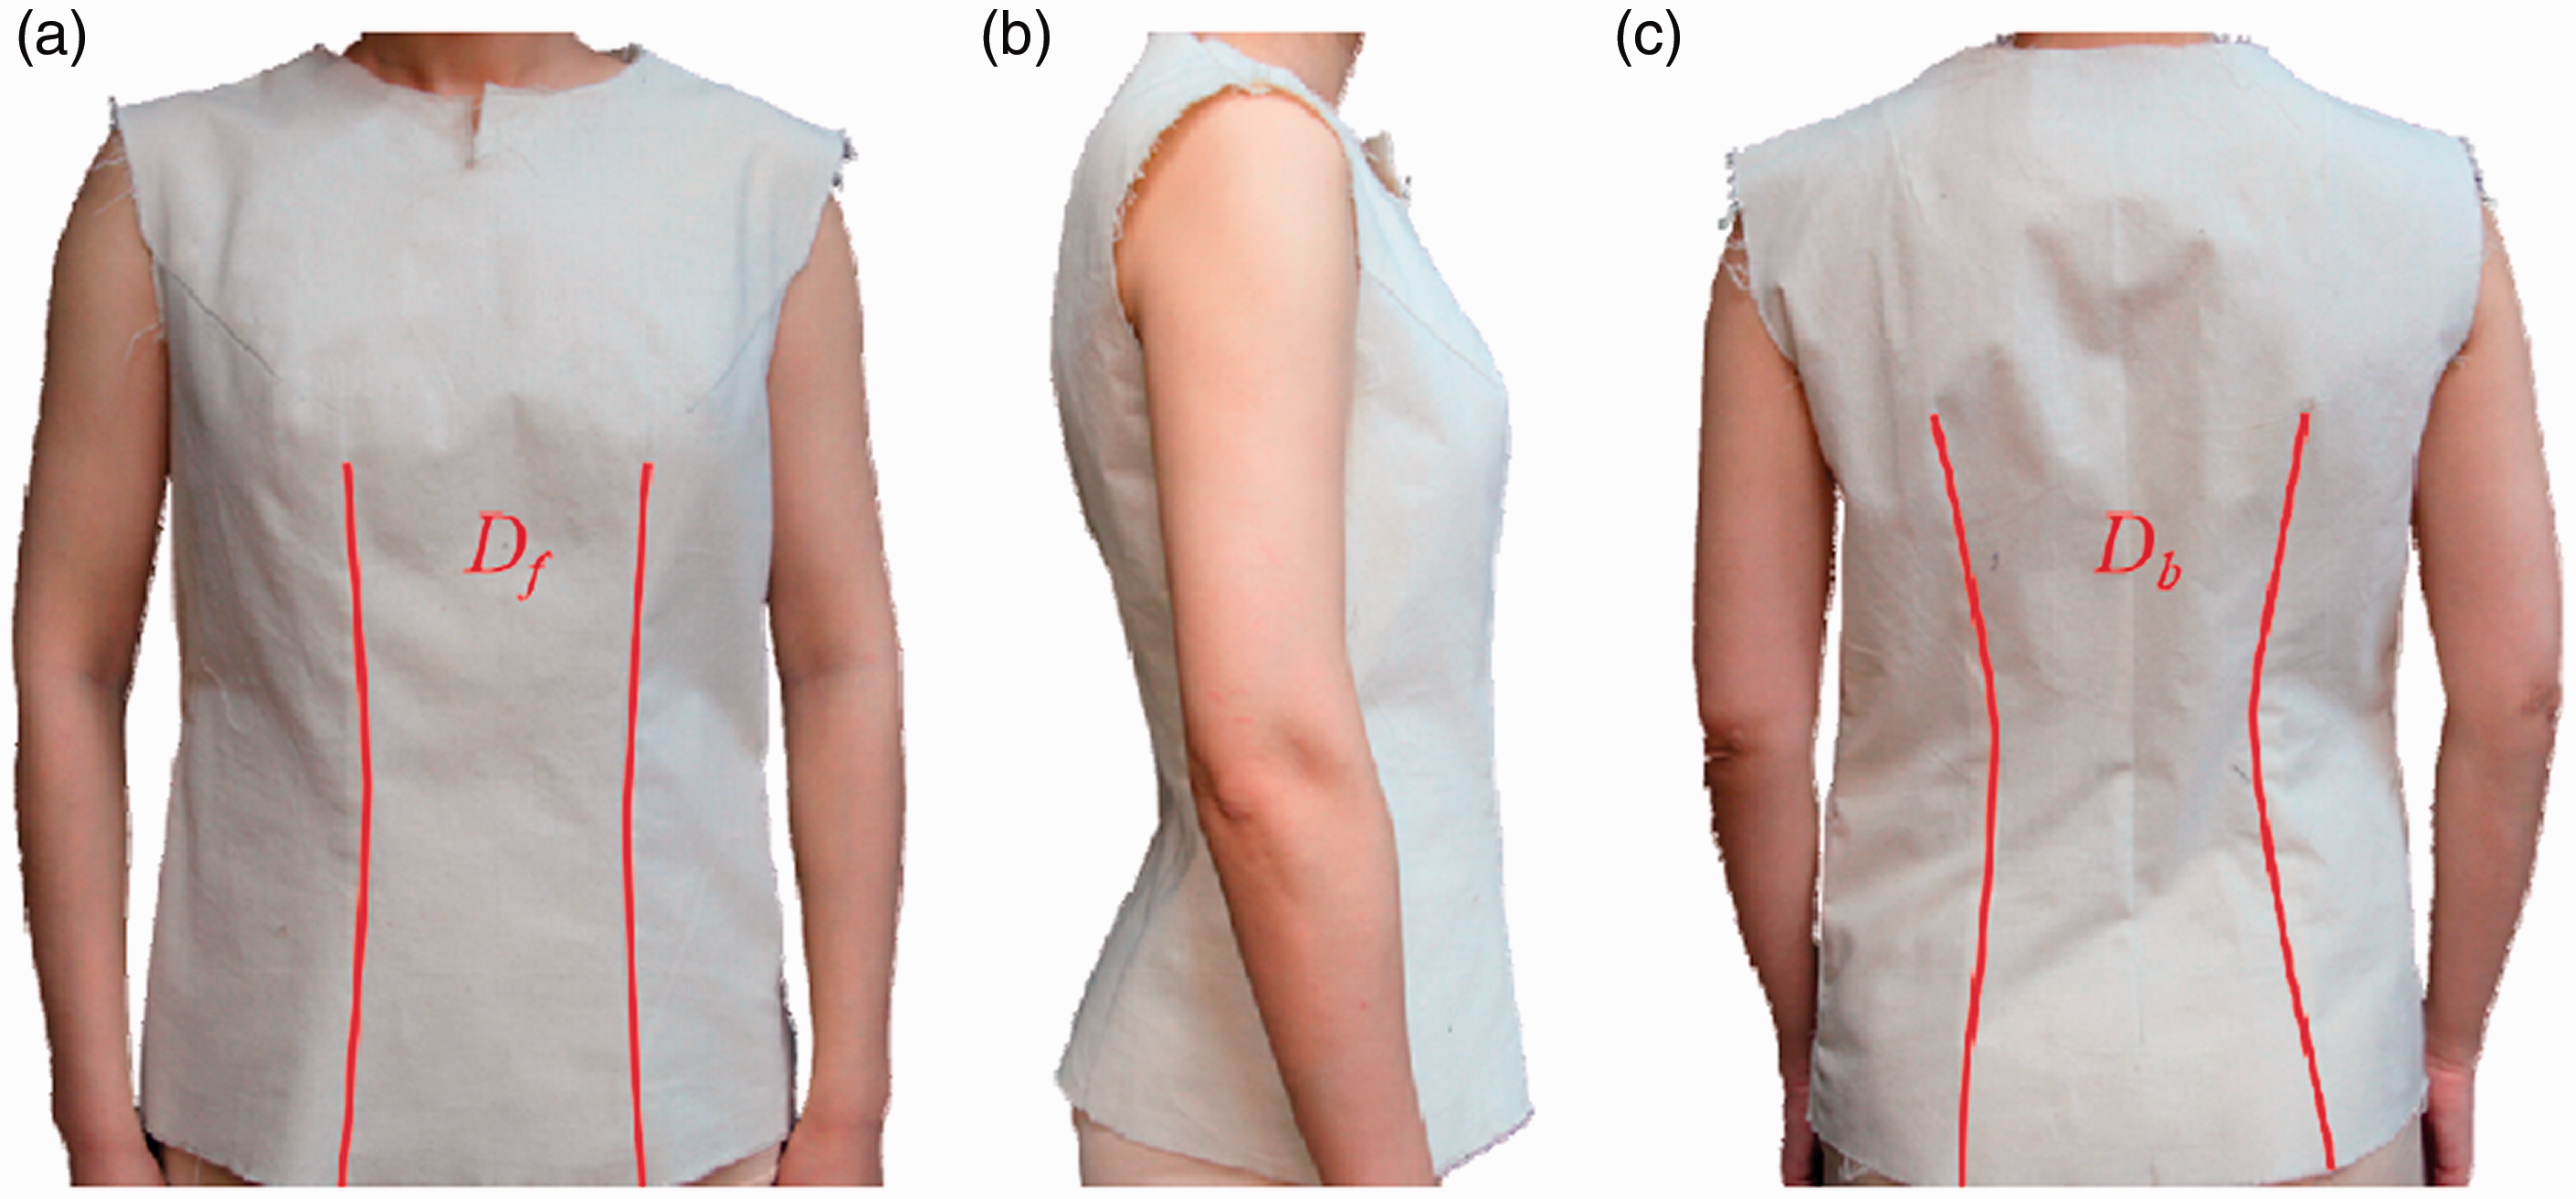
Evaluation angles of PF2 as an example: (a) front view (180°); (b) side view (90°); (c) back view (0°).
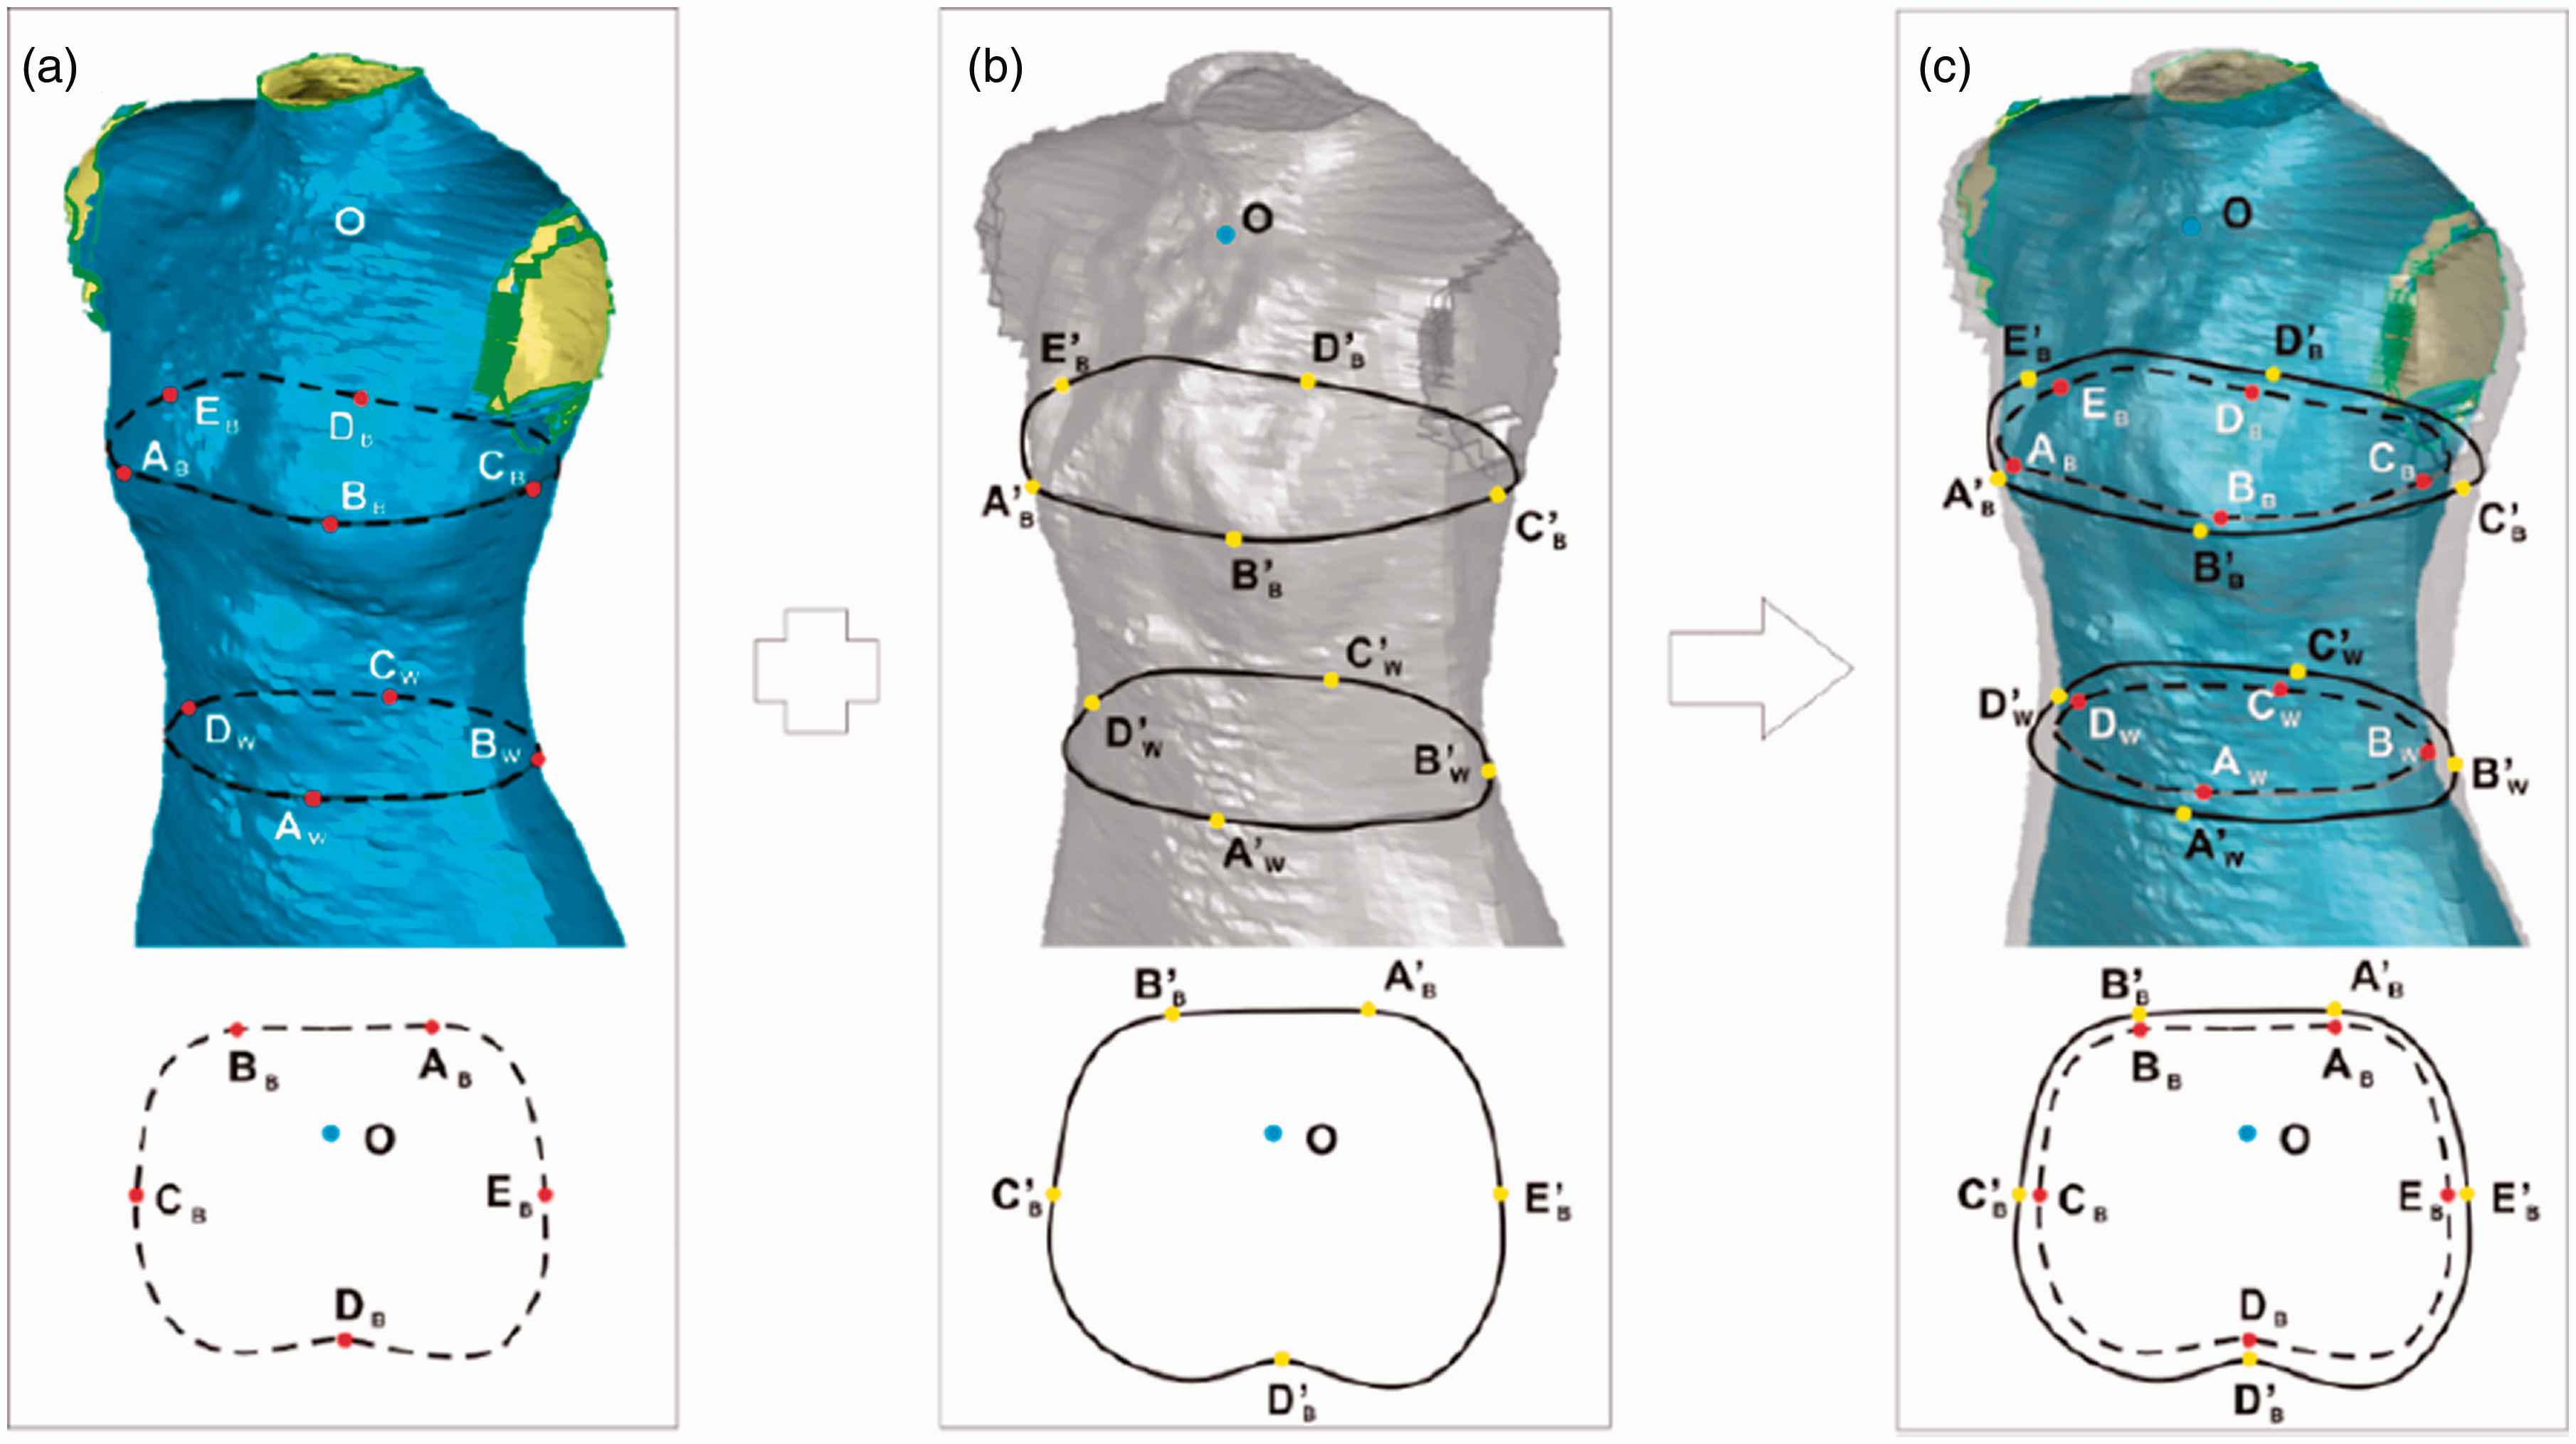
The method to capture the air gap, taking the bust section as an example: (a) not dressed model; (b) dressed model; (c) aligned model.
Spatial ease allowance capture
Firstly, the models of participants with and without garments were obtained respectively by the TC2 scanner. The scan experiment was conducted three times, and the best imaging was adopted. The section curves of the bust and waist were generated by planar cutting, as shown in Figure 5(a) and (b). Secondly, a Qualisys Oqus500+ (Sweden), which could generate the spatial location of a subject at a given moment, was used to determine the relative positions of sections. Point O, which was less affected by breathing and shaking in the transverse plane, was selected as the target point of the sections. The fluctuation range was within 3 mm and the imaging was stable within 10 s. The 3D coordinates of point O and sectional feature points AB, BB, CB, DB, EB, AW, BW, CW, DW were captured. Finally, taking the bust section as an example, through point O and feature points, the curve of the bust and waist sections in the nude state and dressed were aligned, and the curve of THA was acquired, as shown in Figure 5(c).
Taking the intersection of the bust width line and the front mid-line as the center point of the body to establish a coordinate system, sections were segmented at intervals of 6°. The normal distance di at each interval was noted as the THA.
22
The calculation formula of THA fluctuation σ is expressed as (2)

In order to investigate the fluctuation of THA at different angles, the human body was divided into four parts: the front area (120–240°), side areas (60–120° and 240–300°), and back area (300–60°), as shown in Figure 6.

Area divisions of the human body sections.
Statistical analysis
The IBM SPSS Statistics 25 program was used for statistical analysis. An analysis of variance (ANOVA) was used to examine the differences in the subjective evaluation and the THA and its fluctuation in the sample garment according to Hrv, DL, and DP. Spearman correlation coefficients was employed to analyze the relationships between independent variables (Hrv, DL, and DP) and dependent variables (dressing scores and THA and its fluctuation).
Results and discussion
Dressing effect
The correlation analysis was performed with Hrv, DL, and DP as independent variables and dressing scores for each observation angle as dependent variables. The results are as follows.
For sample garments with different DL, there was a weak correlation between Hrv and dressing scores. Here, DL had a significant correlation with dressing scores in front observation angles. The back waist dart (Db) had a positive correlation with SFront (correlation coefficient r = 0.424, p = 0.002 < 0.05). There was a negative correlation between the front waist dart (Df) and SFront with a correlation coefficient of –0.424, p = 0.002 < 0.05. This indicates that SFront increases as the dart moves from the front and back middle to the side. For sample garments with different DP, Hrv was positively correlated with SSide. The correlation coefficient between HrvB and SSide was 0.476, p = 0.000 < 0.05, and the correlation coefficient between HrvW and SSide was 0.420, p = 0.002 < 0.05. This indicates that in this series of experimental samples, SSide increases as Hrv increases. The effect of DP on dressing scores was not as significant as Hrv.
As shown in Figure 7, averaged dressing scores present a similar trend in sample garments with different DL and DP. With the increase of Hrv, STotal shows an increasing trend followed by a decrease. Participants with a normal shape had the best dressing effect. The barrel shape and flat shape were similar. Overall, the dressing effects of PB4, PN1, PN2, PN3 (HrvB in 1.28–1.36, HrvW in 1.31–1.44) were better. The score trends were basically the same as the total score trends under the three sub-views.
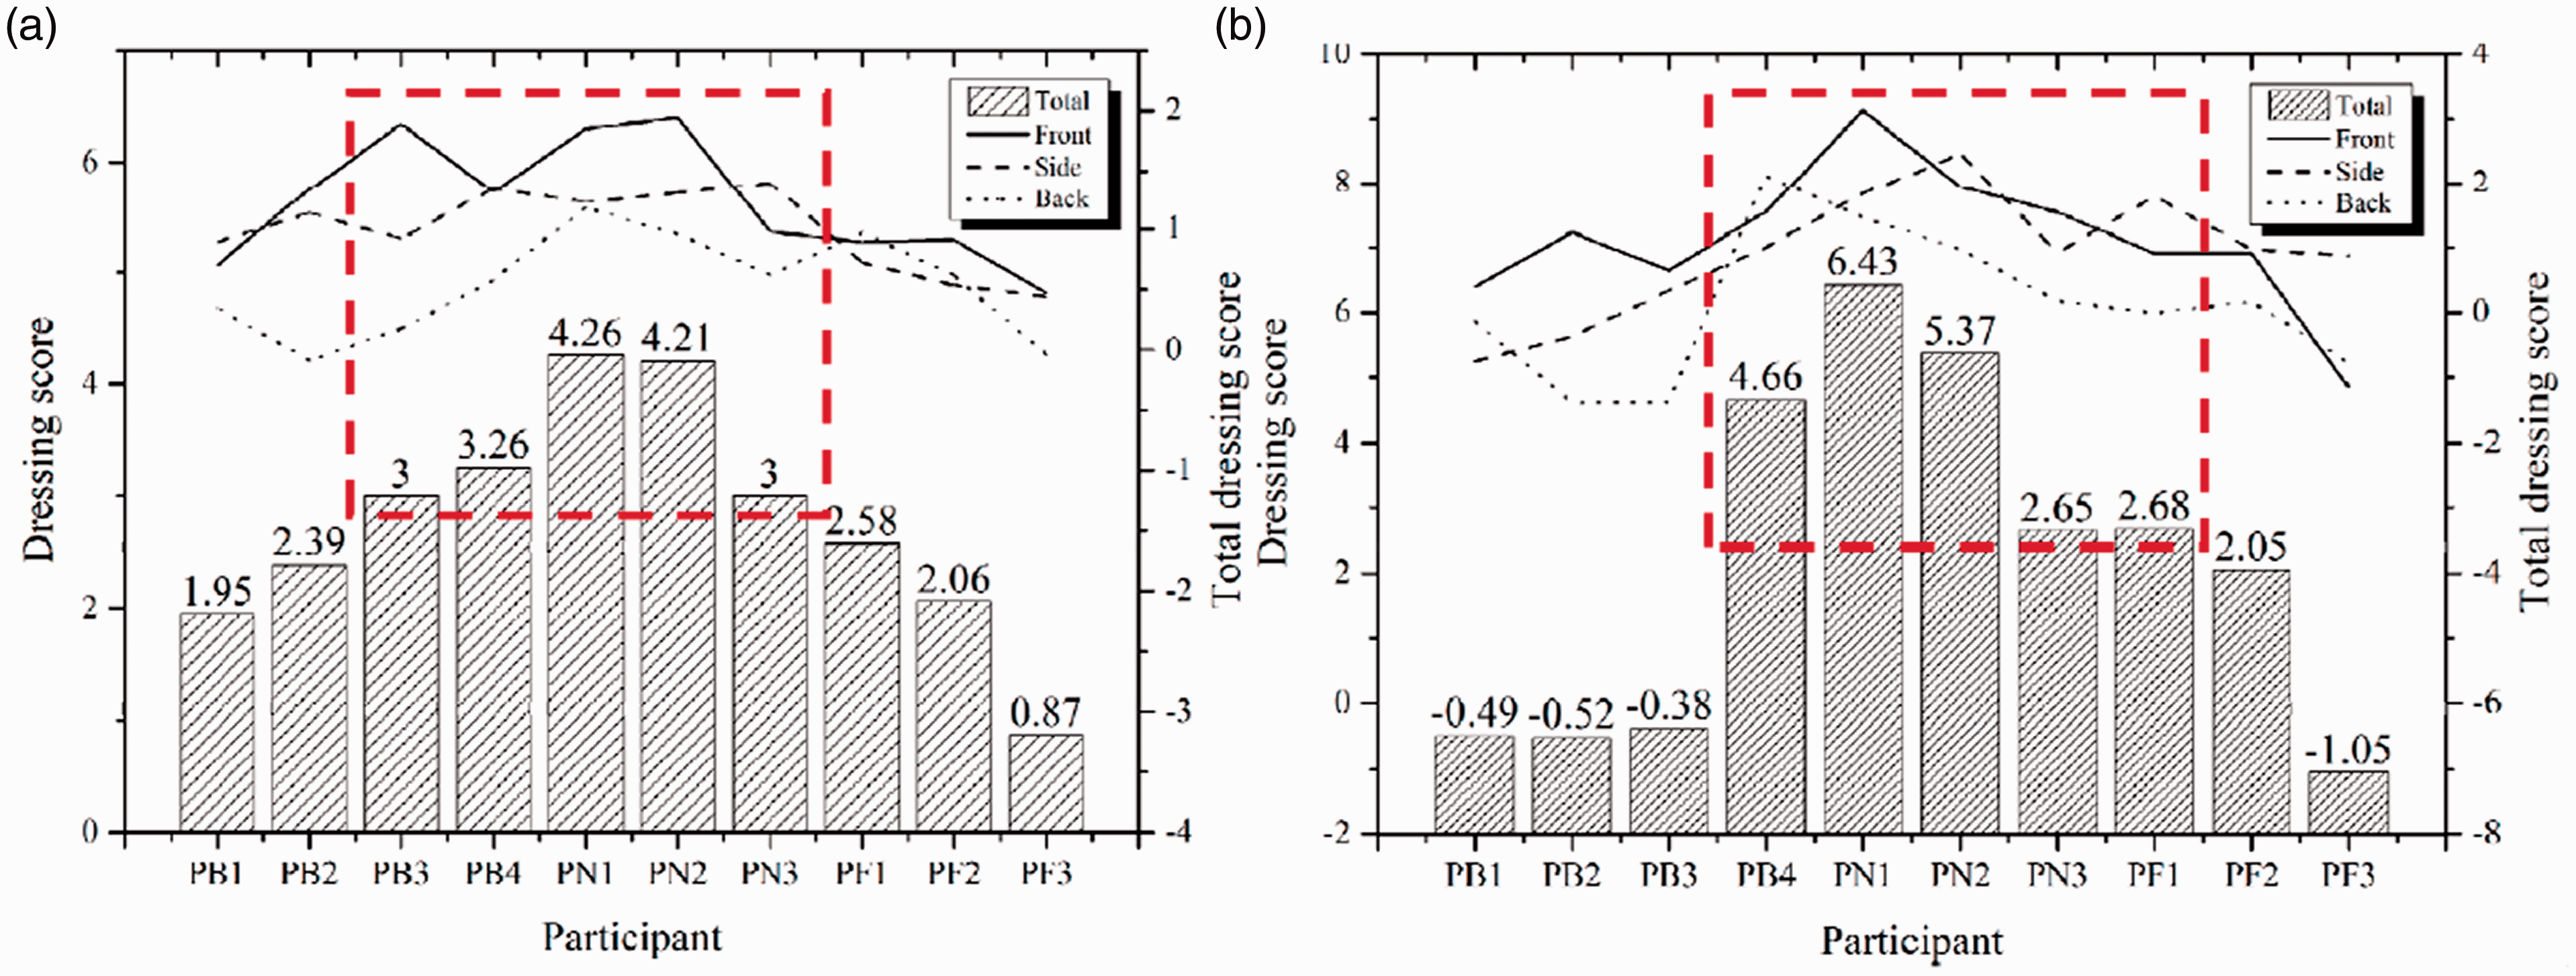
Averaged dressing scores of 10 participants. (a) dressing scores of sample garments with different dart locations; (b) dressing scores of sample garments with different dart proportions.
As show in Figure 8(a), the round body shape had higher STotal when wearing L2 and L3, and a lower score when wearing L4 and L5, with the differences mainly on the side and back. In Figure 8(b), the normal shape had the best score when wearing sample L1 and the lowest when wearing L2 and L3. L4 and L5 were better on the front and L1 better on the side. The flat shape had the best score when wearing L4 and L5, as shown in Figure 8(c).
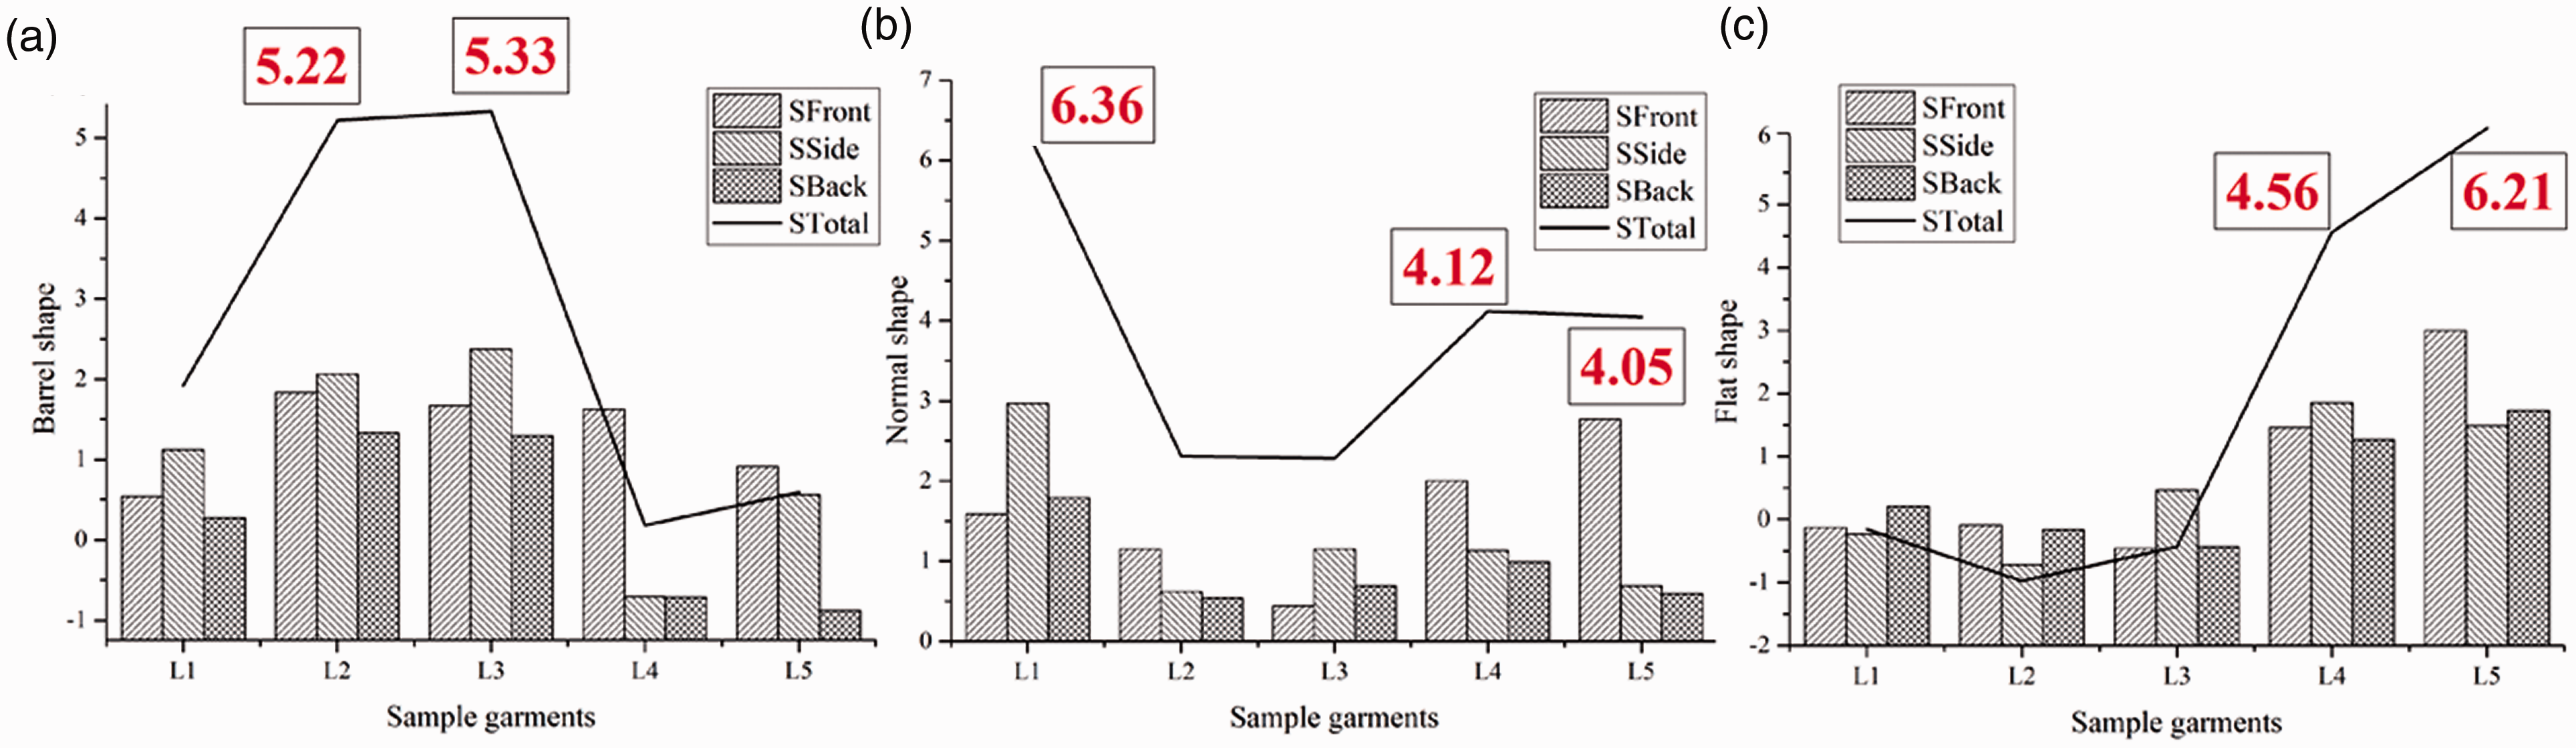
Dressing of sample garments with different DL in different body types: (a) barrel shape; (b) normal shape; (c) flat shape.
This can be explained by the fact that the narrower and more rounded bust of the round shape did not have enough ease in the front bust area when DL was shifted to the side, resulting in an overall upward shift of the front piece and longer oblique folds under the bust in the front and side angles. The back piece had more ease in the back middle and cannot fit the waist arc with less curvature of the round shape, resulting in the back piece piling up into small folds, which affects the appearance. Therefore, when DL was close to the side seam, the round shape scored poorly.
When DL was close to the front middle and back middle, the flat shape had a wider bust width. There was a larger curvature of the bust section curve, and the curve was flatter, which could not meet the support of the bust space, resulting in oblique folds on both sides of the bust. At the side, subjects with a larger Hrv were often accompanied by a wider pelvis, thus propping up the fabric on both sides, resulting in the sides of the waist being concave inward, showing a more obvious “X” shape. The front and back middle of the fabric extend to the front and back, so there was a slight hanging at the front middle when observed from the side angle, which affected the aesthetic fit. Therefore, when DL was close to the front and back middle, all the scores of flat shapes were poor.
As shown in Figure 9(a), the difference between the scores of the round shape in P2 and P5 was mainly due to the more balanced dressing effect of P2 at all angles. In Figure 9(b), the normal shape had the best score when wearing samples P1 and P3. There was little difference in the front and back angle, while the main difference was in the side. In Figure 9(c), the flat shape had a better score when wearing sample P5, with balanced scores in all three angles. Sample P1 had the lowest scores. Even though it had higher scores in the front and side angle, it had poorer results in the back angle.

Dressing of sample garments with different DP in different body types: (a) barrel shape; (b) normal shape; (c) flat shape.
This can be explained by the fact that, during the course of sample garments P1 to P5, the back middle dart (Dbm) and front waist dart (Df) increased, but the back waist dart (Db) and side dart (Ds) decreased. With smaller Dbm and Df and larger Db and Ds, the amount of ease was distributed less at the side and more in the front and back areas, which fits the body surface curve of the round shape and the dressing fabric structure was complete. Therefore, the round shape had a better effect when wearing sample garment P1. When Dbm and Df are large and Db and Ds are small, the ease in the front and back shifted to both sides. The flat shape tends to have a flatter body section with the increase of Hrv, which is consistent with the trend of ease shifting. It can be observed that the flat shape has the best dressing effect in sample P5.
In Chinami et al.’s 10 research on the combination of the appearance of the dressing platform and pattern making method, it was pointed out that the location and the height of darts had a great impact on the appearance of the side waist. This paper proves this finding on the barrel shape and flat shape. The ease distribution is affected by DL and DP and samples with poor fitting with body shape have wrinkles on the sides.
Air gap thickness
When exploring the distribution of THA, the sample garments with different DL and DP showed similar results. As shown in Figures 10 and 11, the round shape had a flatter sectional curve and the flat shape had a rounder sectional curve. The correlation analysis was performed on Hrv, DL, and DP (independent variables) and THA in the bust and waist sections (dependent variables). The results show the following.
For sample garments with different DL (Figure 11), HrvB had a significantly positive relationship with the average THA (ATHA) in the front area (132–228°; p < 0.05). The ATHA in the side to front area became larger as HrvB increased. In the front area, the fluctuations of the ATHA (σ) of the flat shape had a higher value, with the ATHA ranging from 6.67 to 14.01 mm and a maximum difference of 7.09 mm. In the side area, σ of the round shape was larger, with the ATHA ranging from 4.74 to 19.21 mm, of which the maximum difference was 12.59 mm. This indicates that the difference of ATHA between the round shape and the flat shape in the bust section is mainly reflected in the front and side areas, where the shape difference is obvious due to bust projection, and DL has some influence on the uniformity of ATHA distribution in dressing.
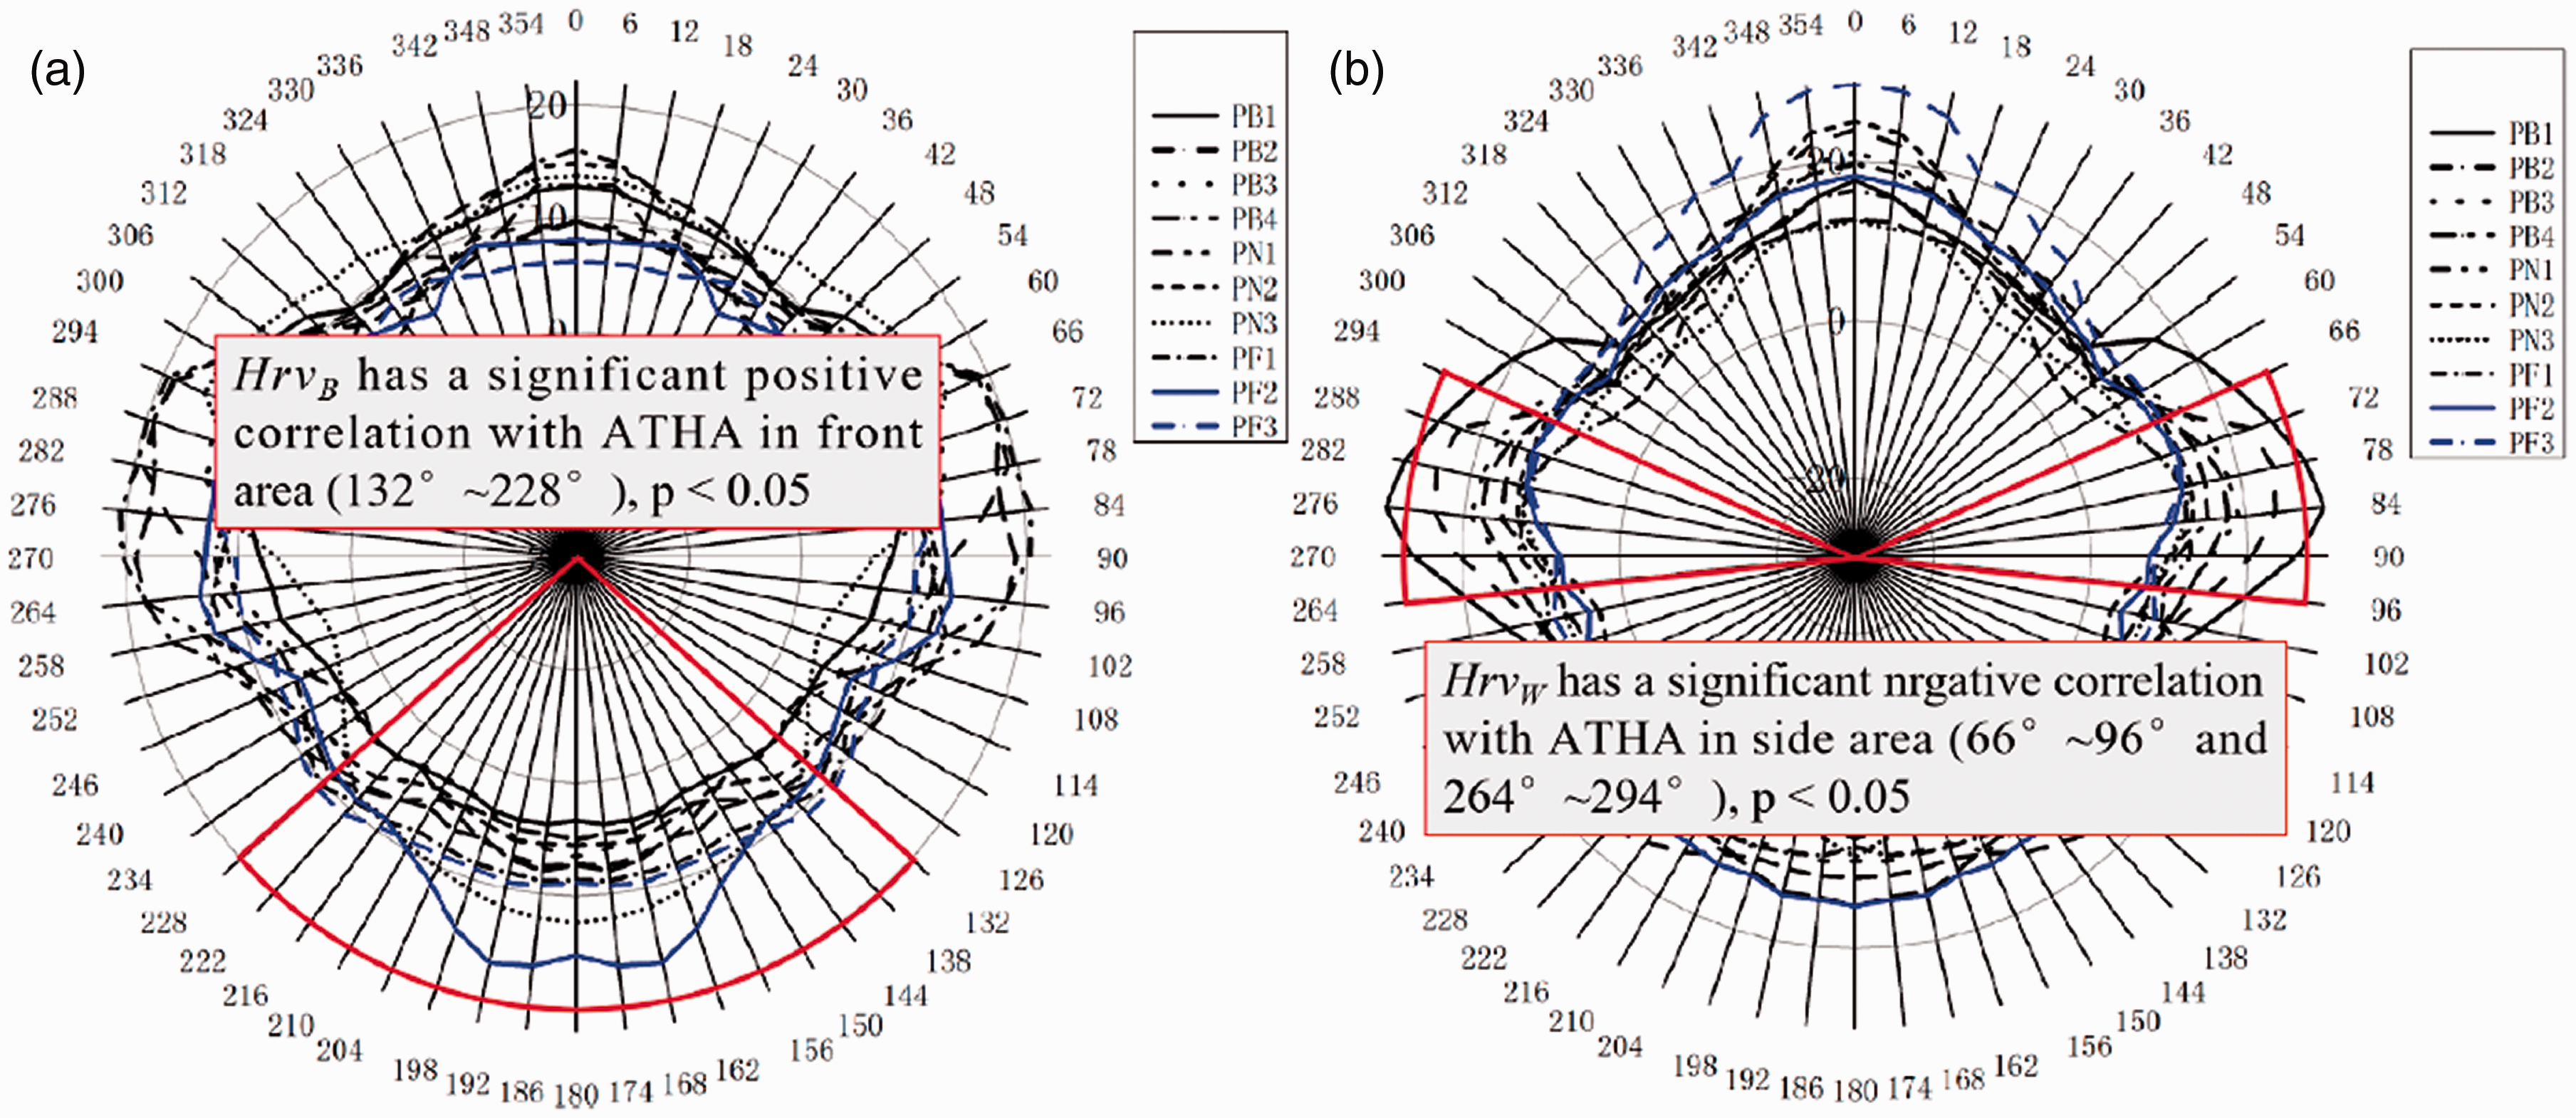
The distribution of average air gap thickness (ATHA) in the bust and waist sections of sample garments with different DL: (a) bust section; (b)waist section.
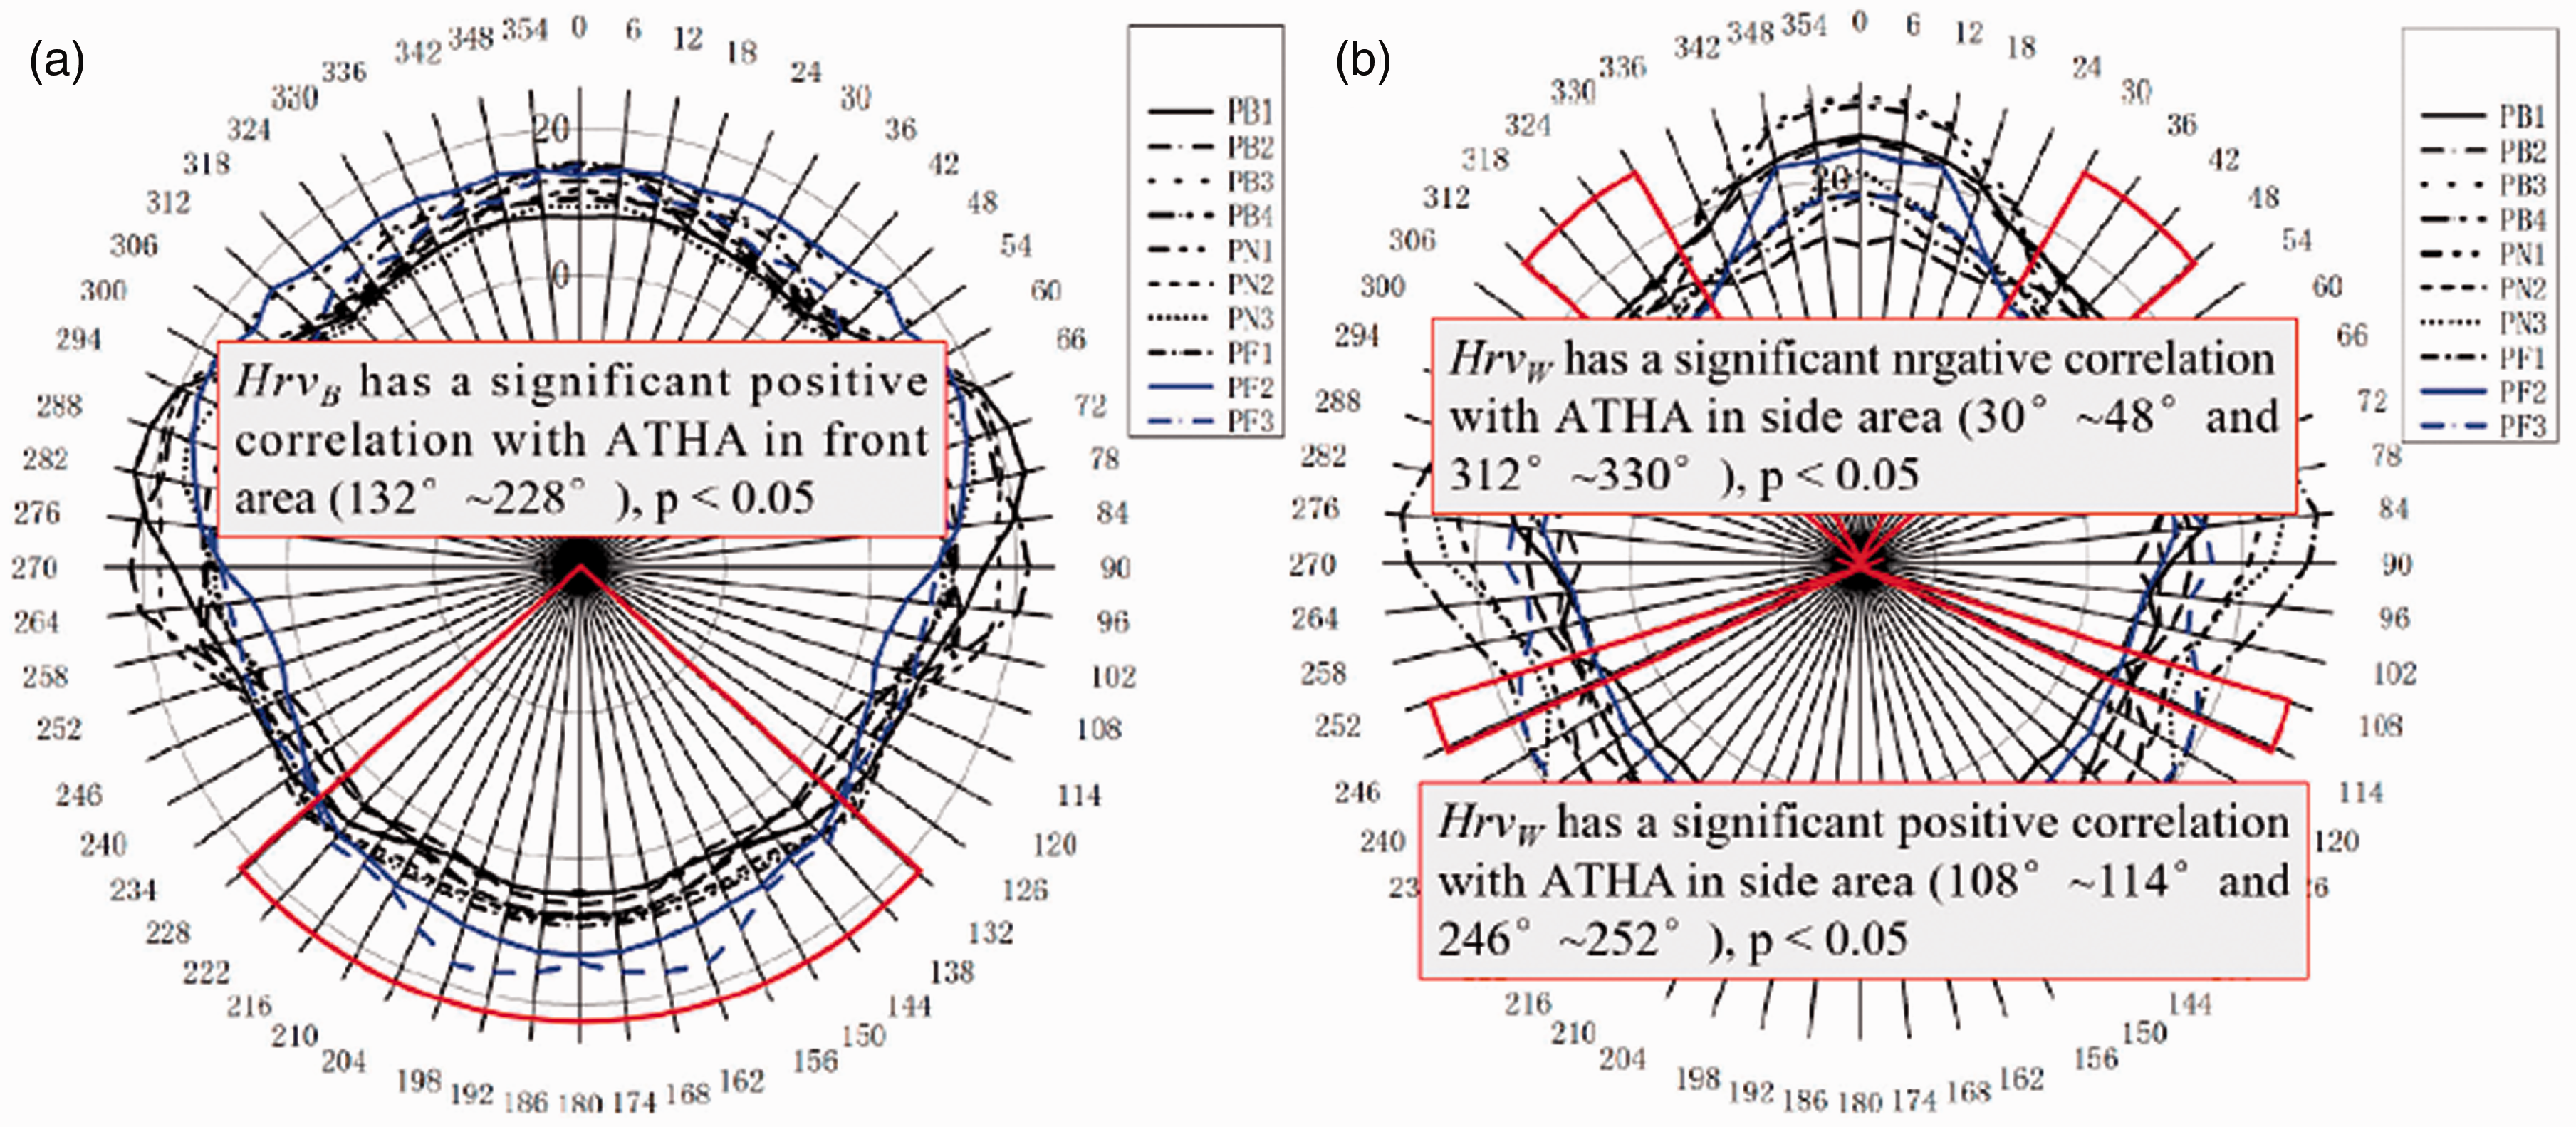
Distribution of average air gap thickness (ATHA) in the bust and waist sections of sample garments with different DP: (a) bust section; (b) waist section.
Here, HrvW was significantly and negatively correlated with ATHA in the side area (66–96° and 264–294°; r > 0.7). This means that the ATHA on the waist section in the side area becomes smaller as HrvW increases. In the front area, σ of the round shape was larger, with the THA fluctuating between 3.12 and 11.63 mm, of which the maximum difference was 7.32 mm, with the most uniform distribution when wearing sample L1. In the side area, σ of the flat shape was larger, and the fluctuation of THA ranges from 4.66 to 21.97 mm. This indicates that the difference of the ATHA between the round shape and flat shape in the waist section is mainly reflected also in the front and side areas.
2. For sample garments with different DP (Figure 11), HrvB was significantly and positively correlated with the ATHA in the front area (132–180°), and the correlation coefficients were all above 0.6. The ATHA in the front area became larger as HrvB increased. In the front area, σ of the flat shape was larger, with the ATHA ranging from 6.68 to 12.81 mm and a maximum difference of 5.21 mm. In the back area, σ of the flat shape was the largest, with the ATHA ranging from 5.58 to 14.64 mm and a maximum difference of 8.51 mm. The great difference in σ between the round shape and flat shape in the bust section can be explained by the chest projection resulting in stylistic differences. Here, DP had a greater effect on σ in the front and back areas.
The HrvW was significantly negatively correlated with the ATHA in the back side area (30–48°), and significantly positively correlated with the ATHA in the front side area (108–114°; r > 0.6). The ATHA in the back side area became smaller and the front side area larger with the increase of HrvW. In the side area, σ of the flat shape was larger, with fluctuation of the ATHA ranging from 6.74 to 21.97 mm. In the back area, the σ was the largest for the round shape, with the ATHA fluctuating between 10.55 and 29.76 mm, where the maximum difference was 16.84 mm. Here, σ differences were mainly reflected in the side and back areas.
Comparative analysis
The experiments were further analyzed by combining the effect of dressing appearance and internal structure on the effect of DL and DP on dressing style.
Samples with different DL
Taking PB4 as an example (shown in Figures 12(a) and (b)), it is known that the round shape has a better dressing effect in sample L3 and a worse effect in L5. In the front angle, the round bust held the fabric up and the front piece moved up, resulting in oblique folds on both sides. The DL of sample L5 was close to the side seam, the fabric structure at the waist was flat even though there are slight recessed spaces on the upper side of the bust, and it scored better. In back angle, DL of sample L5 collects off the ease near the side seam, while the remaining ease at the back middle accumulates and has nowhere to transfer, forming a large number of folds with a lower score.
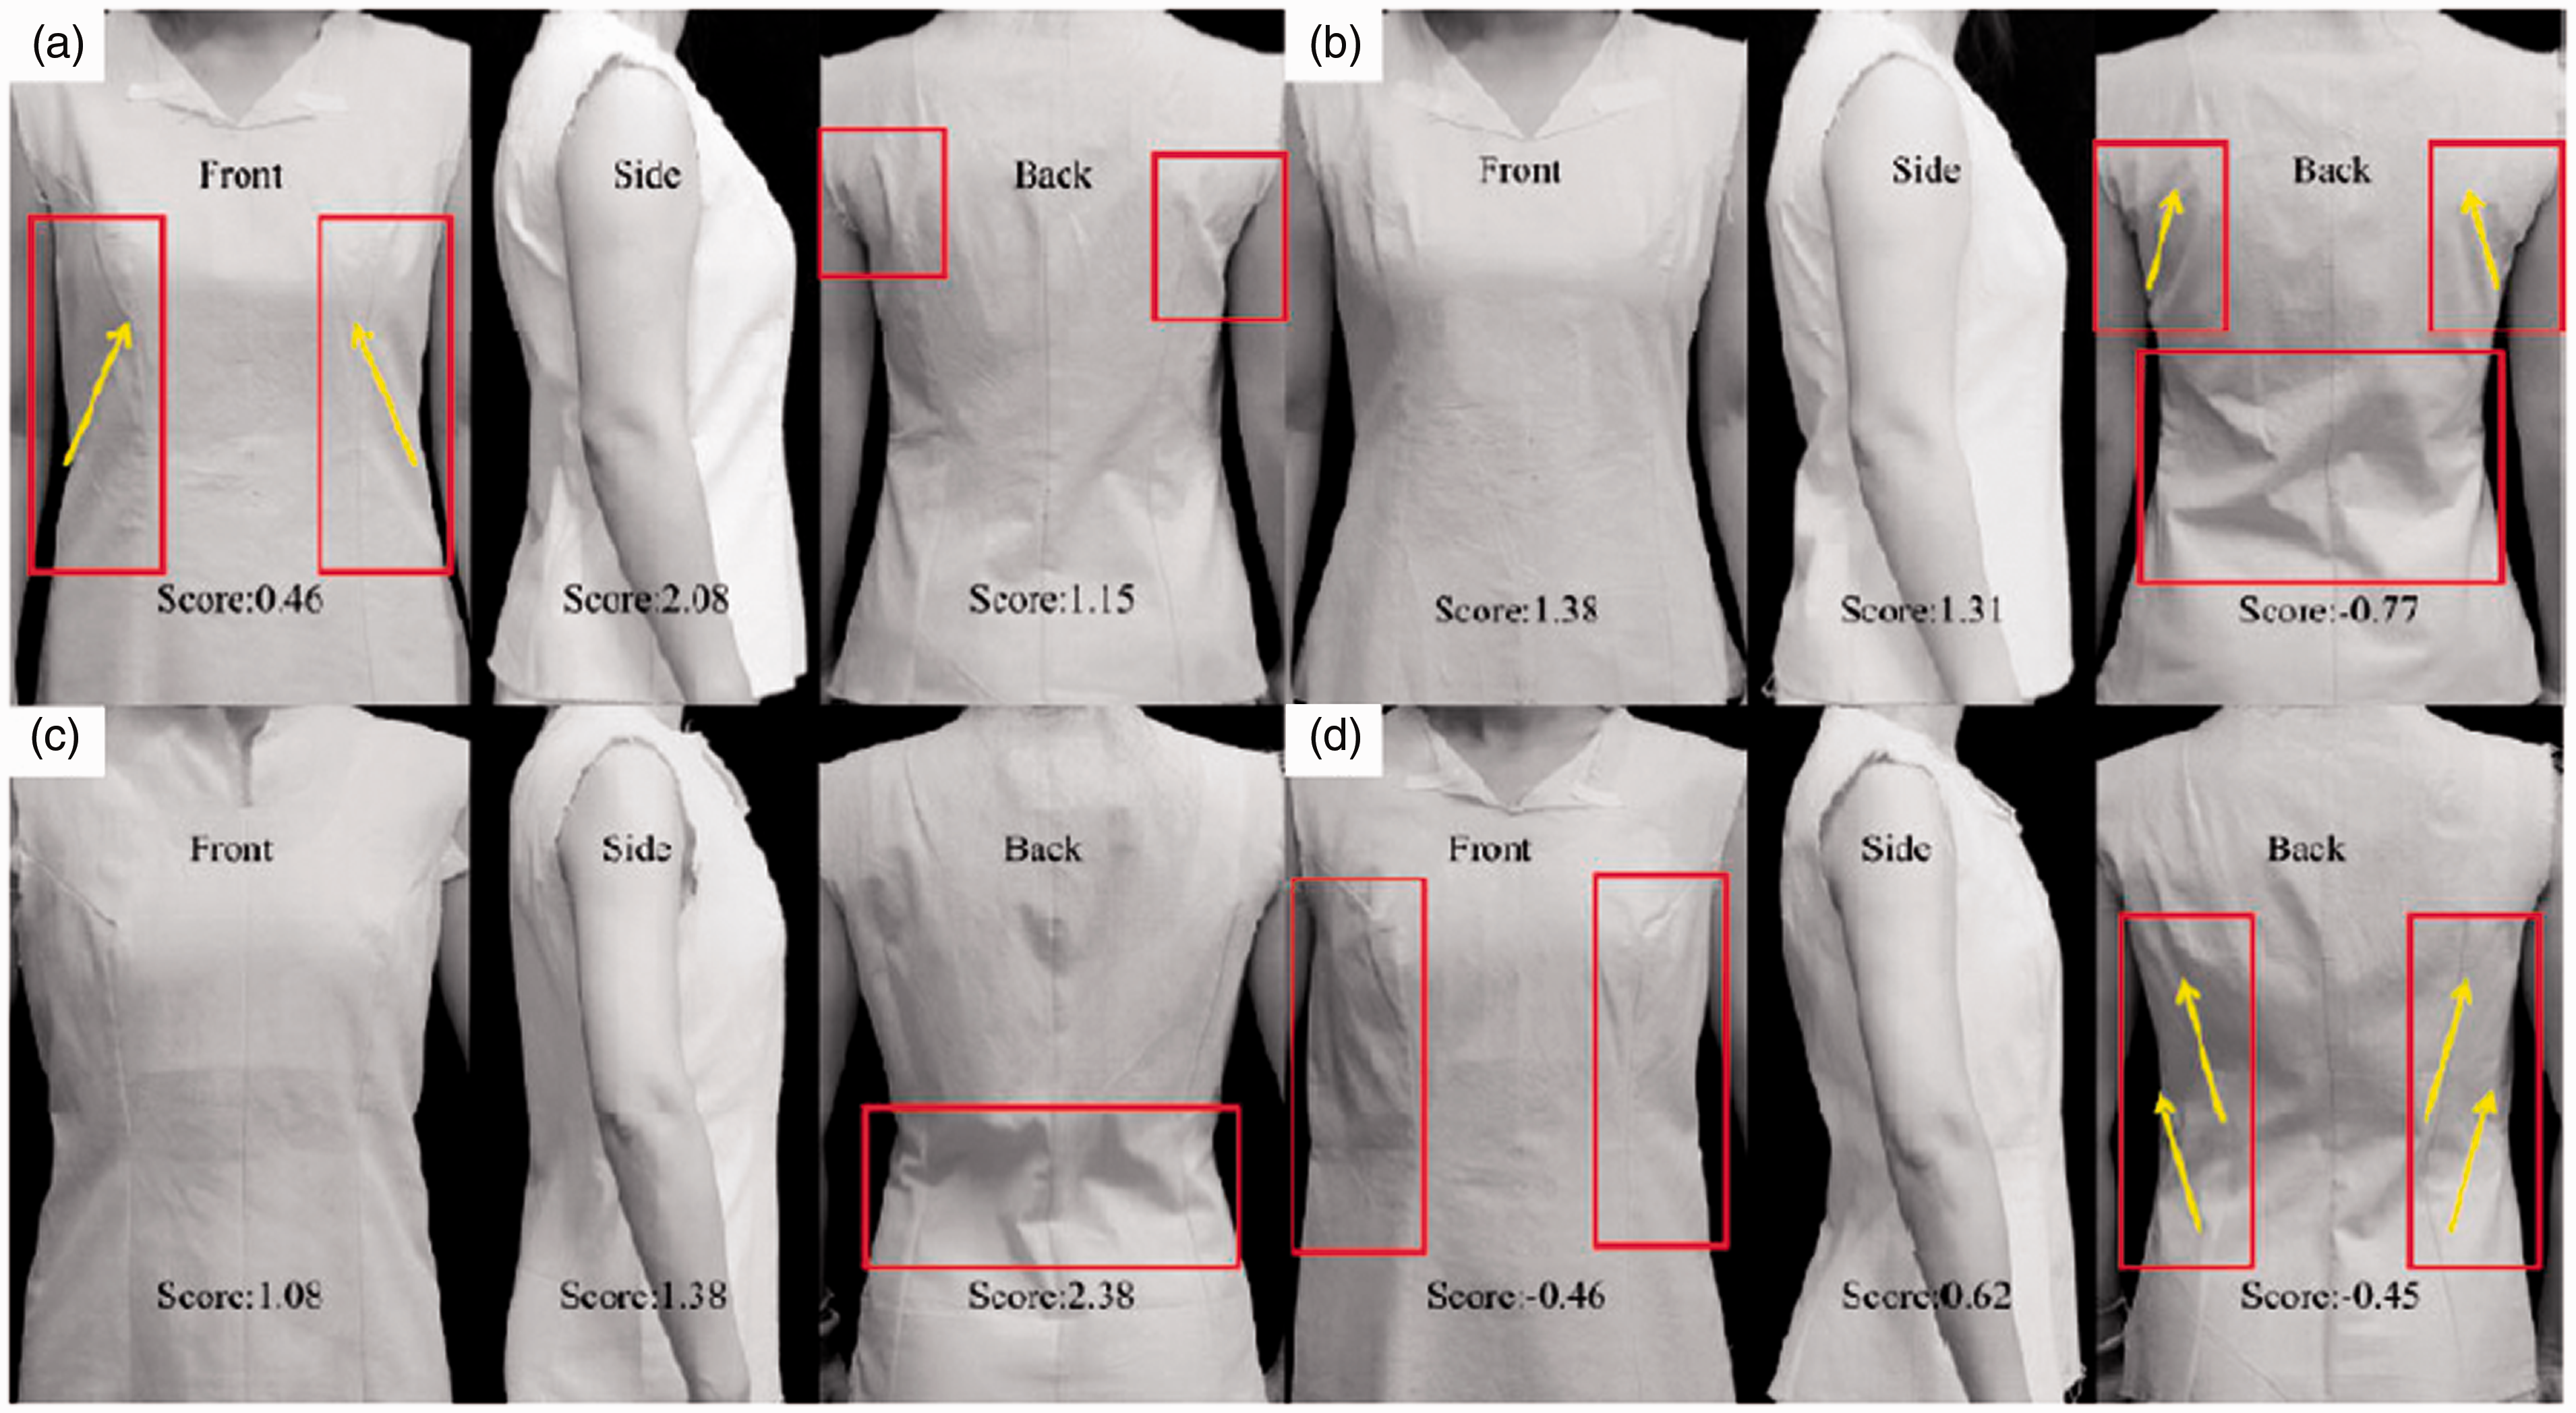
Dressing effect comparison of sample garments with different DL: (a) PB4 in L3; (b) PB4 in L5; (c) PF2 in L4; (d) PF2 in L3.
It is known that the flattened subjects had a better dressing effect when wearing sample L4 and a worse in L3, as shown in PF2 as an example (shown in Figures 12(c) and (d)). The dressing effect varies greatly in the back angle. The Db of L4 is close to the side seam, and the section shape of the garment fits better with the body shape after taking away the remaining ease. The Db of L3 is close to the back middle line and the back piece is concave and folded inward to ensure the structure has stability after taking away the ease in the back center, forming a large area of folds, resulting in a lower score.
The air gap distribution is shown in Figure 13(a). In bust section of PB4, the THA of sample L3 is smaller than that of L5 in the back area (0–36°), which fits the body surface more closely. In the side area (78–117°), the distribution of the THA of L3 is larger than that of L5. As for the dressing effect, sample L5 has more small broken folds under the armpits in the back view. In the waist section, the THA of L3 is larger than that of L5 in the back area (15–54°), and L5 is sunken inward due to insufficient ease distribution. The fabric structure is destroyed, forming larger pleats. In the front area (108–156°), the THA of L3 is larger than that of L5, which is caused by the upward movement of the front piece, resulting in oblique folds, which lowers the dressing score.
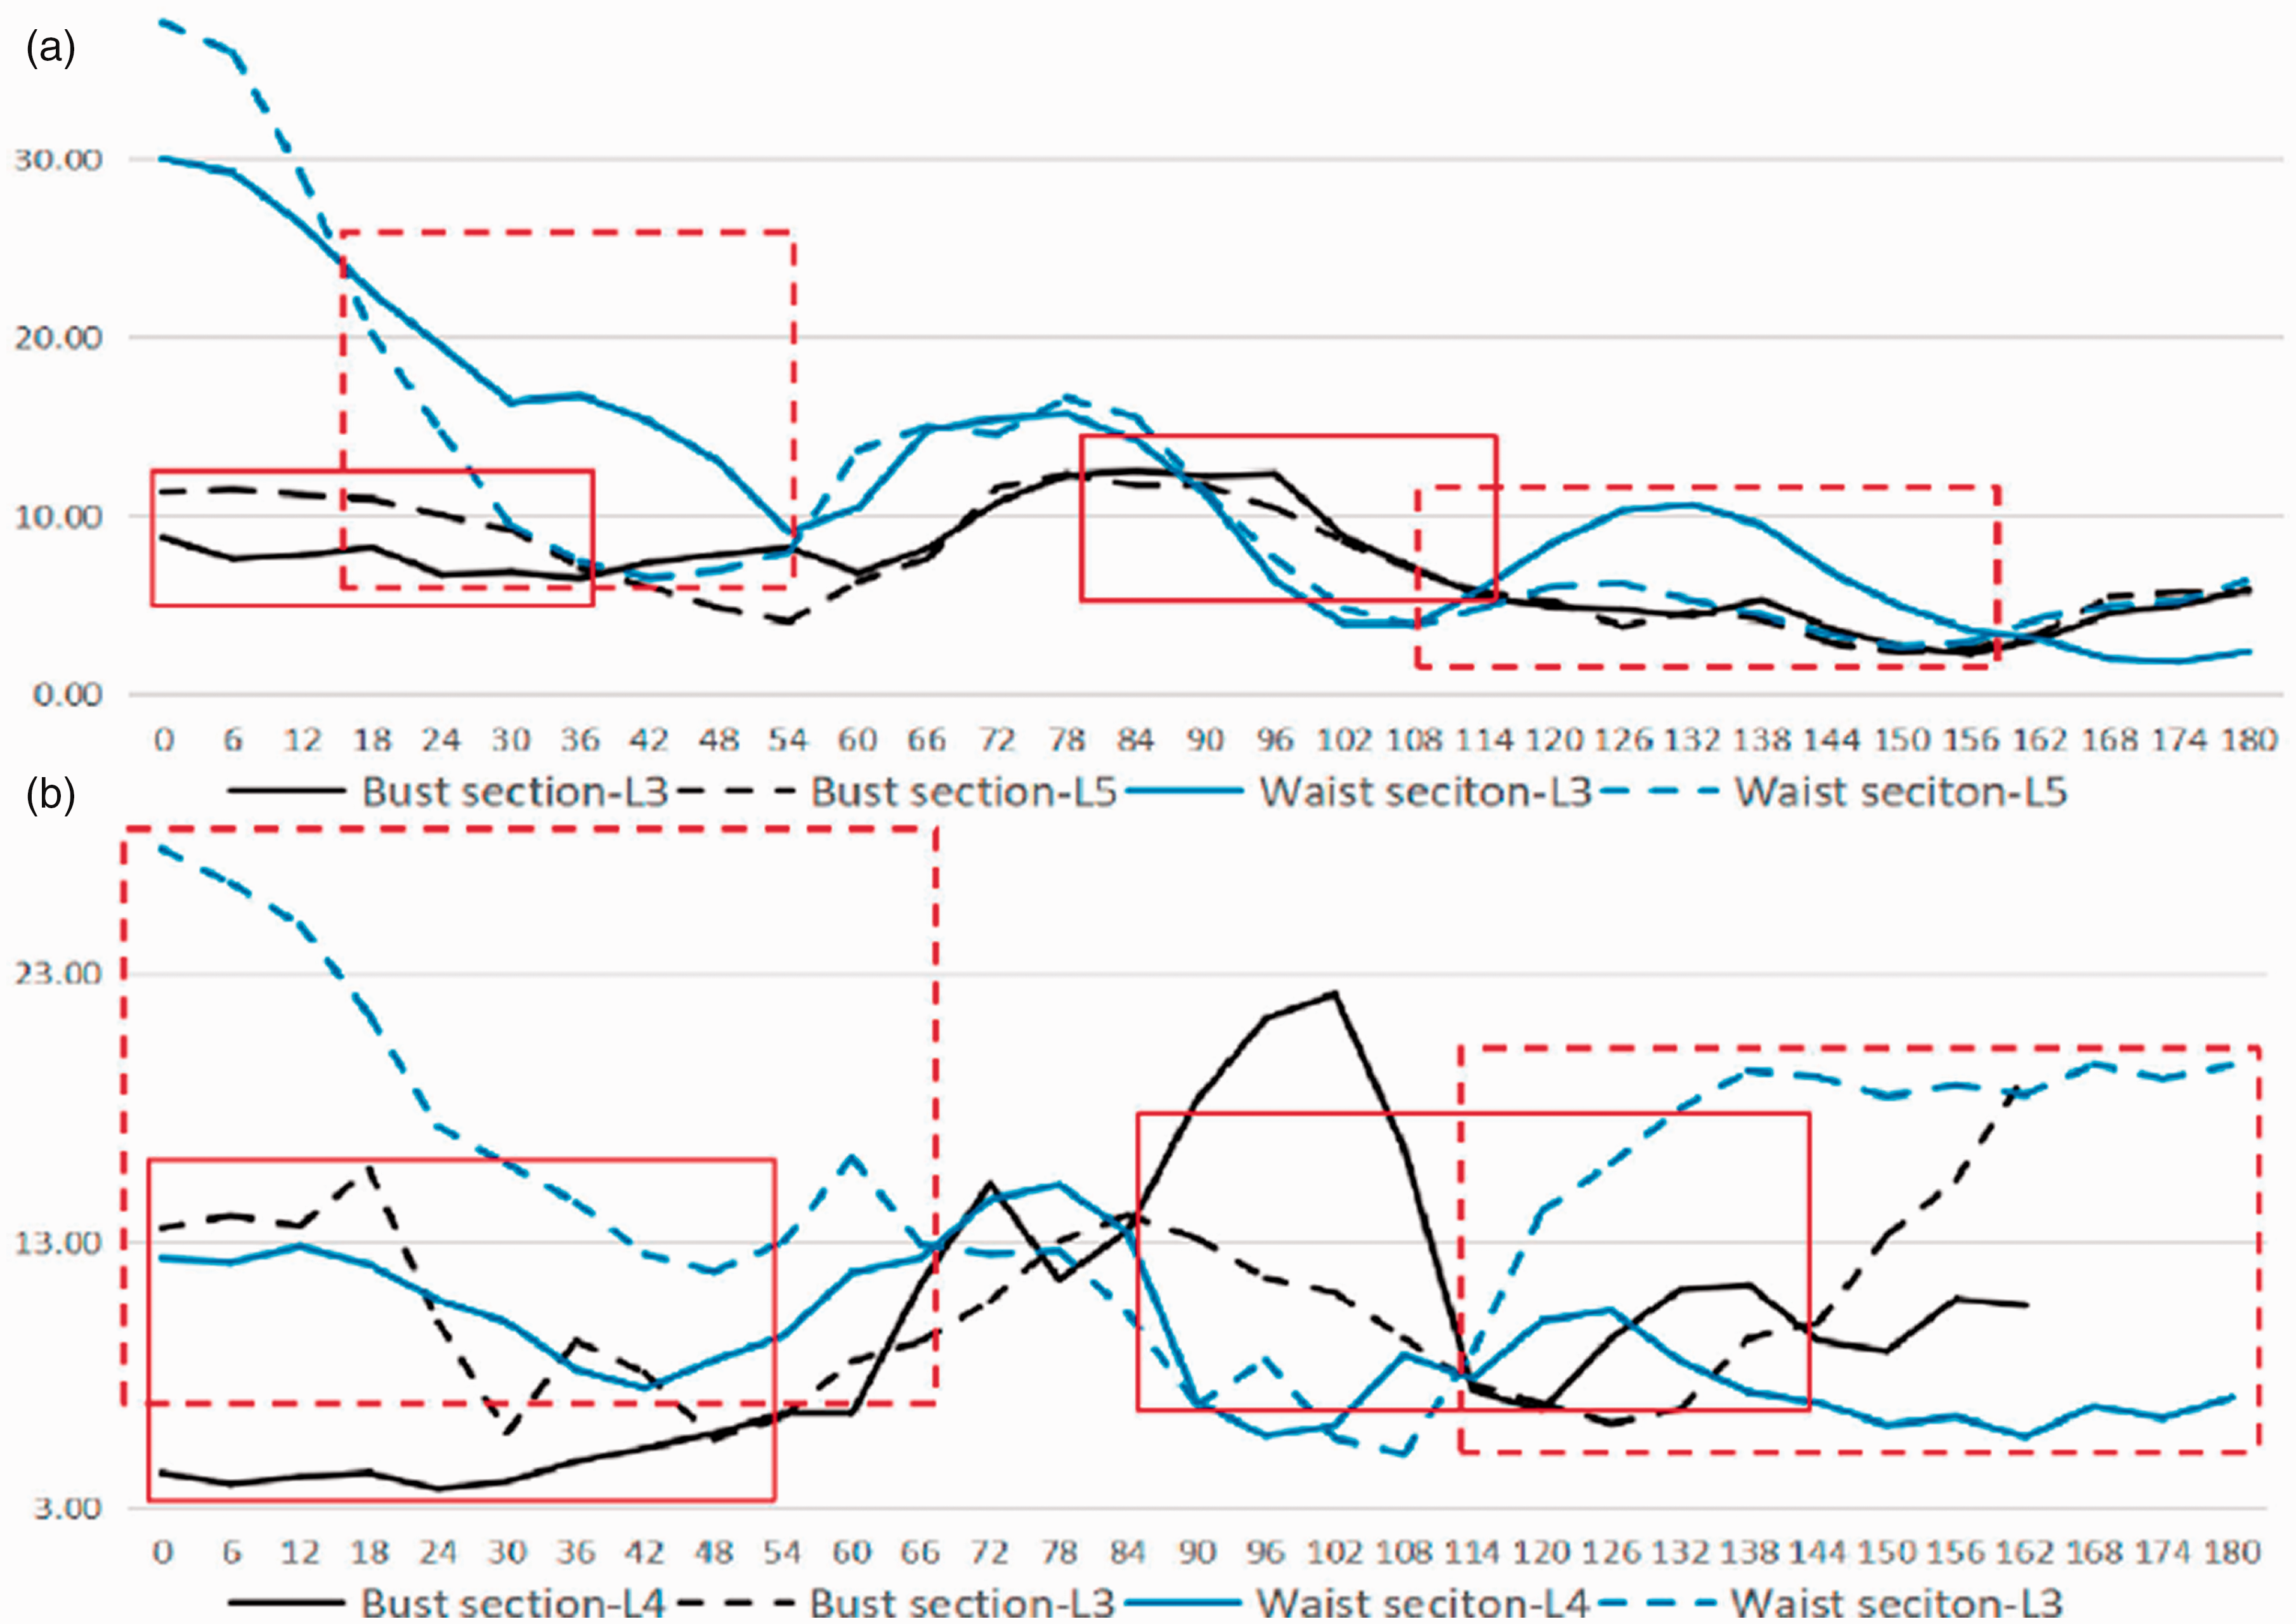
Air gap thickness distribution of sample garments with different DL: (a) PB4 in L3 and L5; (b) PF2 in L4 and L3.
As shown in Figure 13(b), in the bust section of PF2, the THA of sample L4 in the back area (0–54°) is smaller than that in L3, which fits the body surface more closely. In the front side area (84–144°), the THA of sample L4 is larger than that in L3. In the dressing effect, L3 has more tiny crushed pleats in the underarms in the back view. In the waist section, the THA of sample L3 in the back area (0–66°) is larger than that in L4. Due to the lack of ease, the fabric structure is destroyed and large pleats are formed. In the front area (114–180°), the THA of L3 is larger than that of L4. This is due to the lack of ease in the front middle and the forward shifting of the garment space, and the oblique pleats in the front waist make the score lower.
Samples with different DP
In the above analysis, it is known that the round shape is more effective when wearing sample P1 and less effective when wearing P5. Taking PB2 as an example (shown in Figures 14(a) and (b)), the overall scores of round shapes were relatively low, and the differences were in the side and back angles. Here, Dbm and Df were smaller and Db and Ds were larger for P1. Ease distribution in the front and back areas was slightly larger, and P1 had a better effect. P5 has more pronounced oblique folds on both sides due to the lack of slack in the front middle.
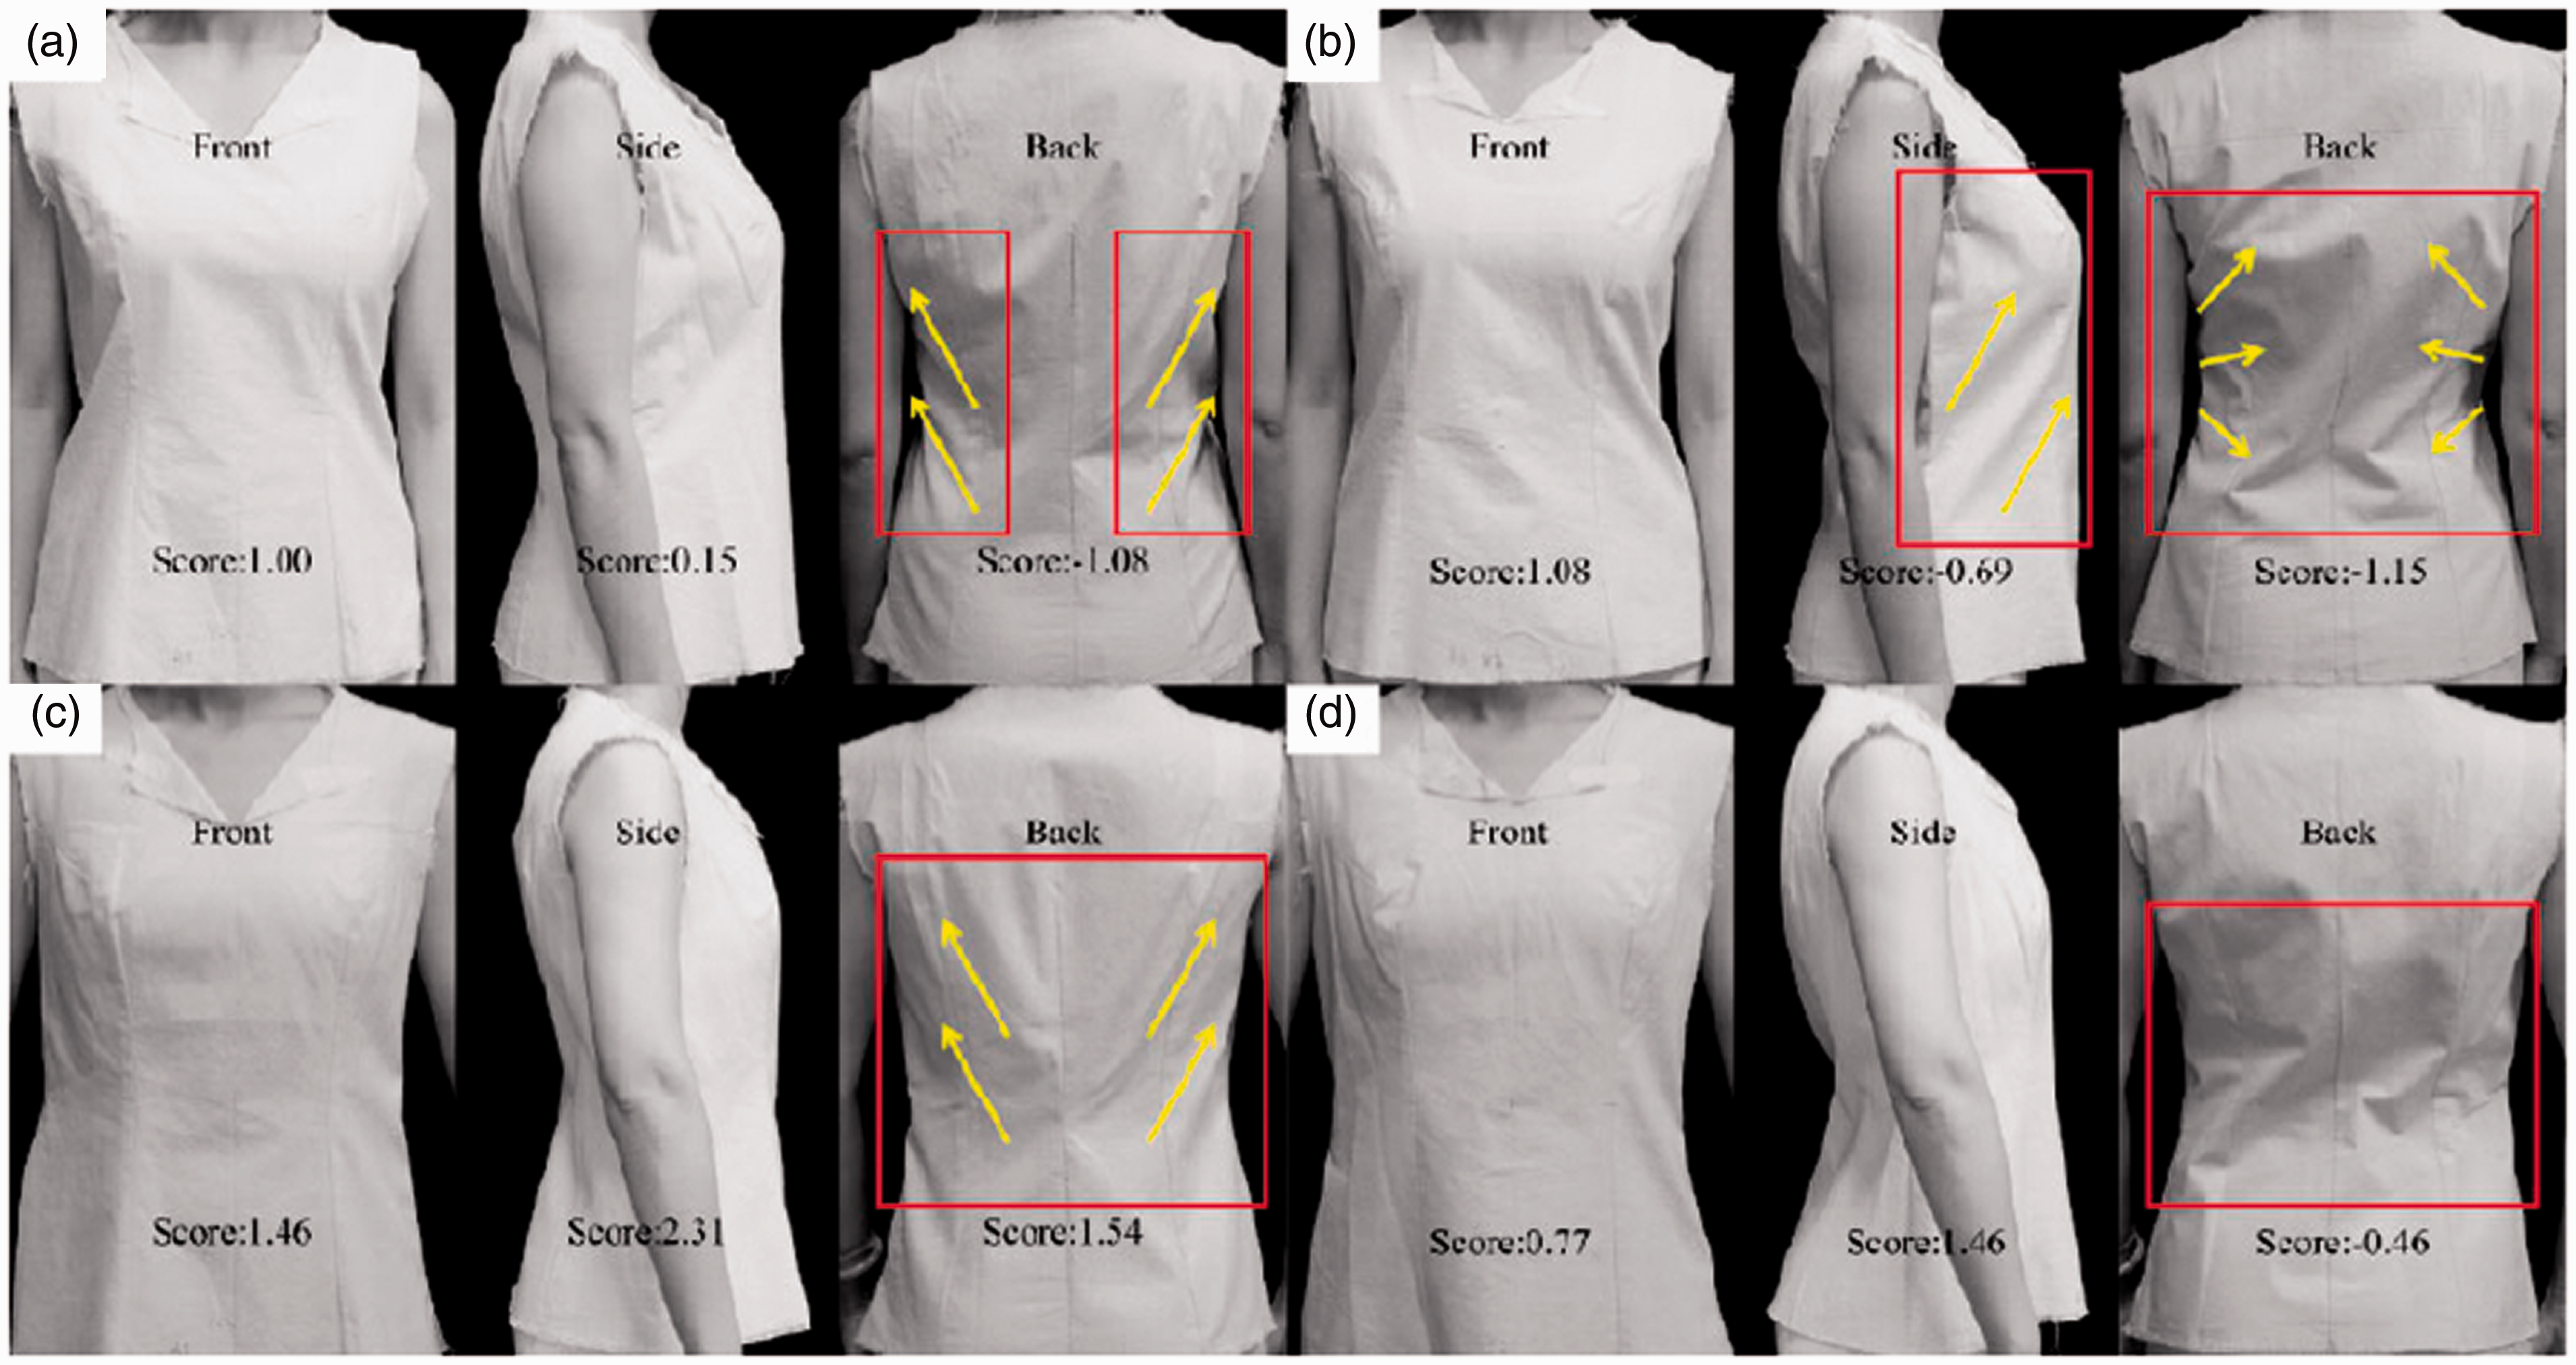
Dressing effect comparison of sample garments with different DP: (a) PB2 in P1; (b) PB2 in P5; (c) PF2 in P5; (d) PF2 in P1.
The flat shape is more effective in sample P5 and less effective in P1. Taking subject PN2 as an example (shown in Figures 14(c) and (d)), the difference mainly lies on the side and back. Due to the wider bust width, ease in the side area increases, giving room for morphological transfer to the increase of Hrv when PN2 is wearing P5, whose Db and Ds are smaller. Therefore, the dressing effect in the front and back is relatively good.
The distribution of THA is shown in Figure 15(a). In the bust section of PB2, the THA of P1 was larger than that of P5 in the back area (0–64°). The lack of ease was the main reason for more folds. In the side area (66–114°), the THA of P5 was slightly larger than that of P1, and there are more eases, causing shift due to the lack of ease in the front and back. In the dressing effect, P5 has more tiny shredded pleats in the underarm in the back view. In the waist section, the THA of P5 is smaller than that of P1 in the front area (150–180°) and larger than that of P1 in the back area (0–60°), which can be explained by the fact that the lack of ease in the bust section causes the front piece to hang up and more ease is transferred forward, so the THA is larger here.
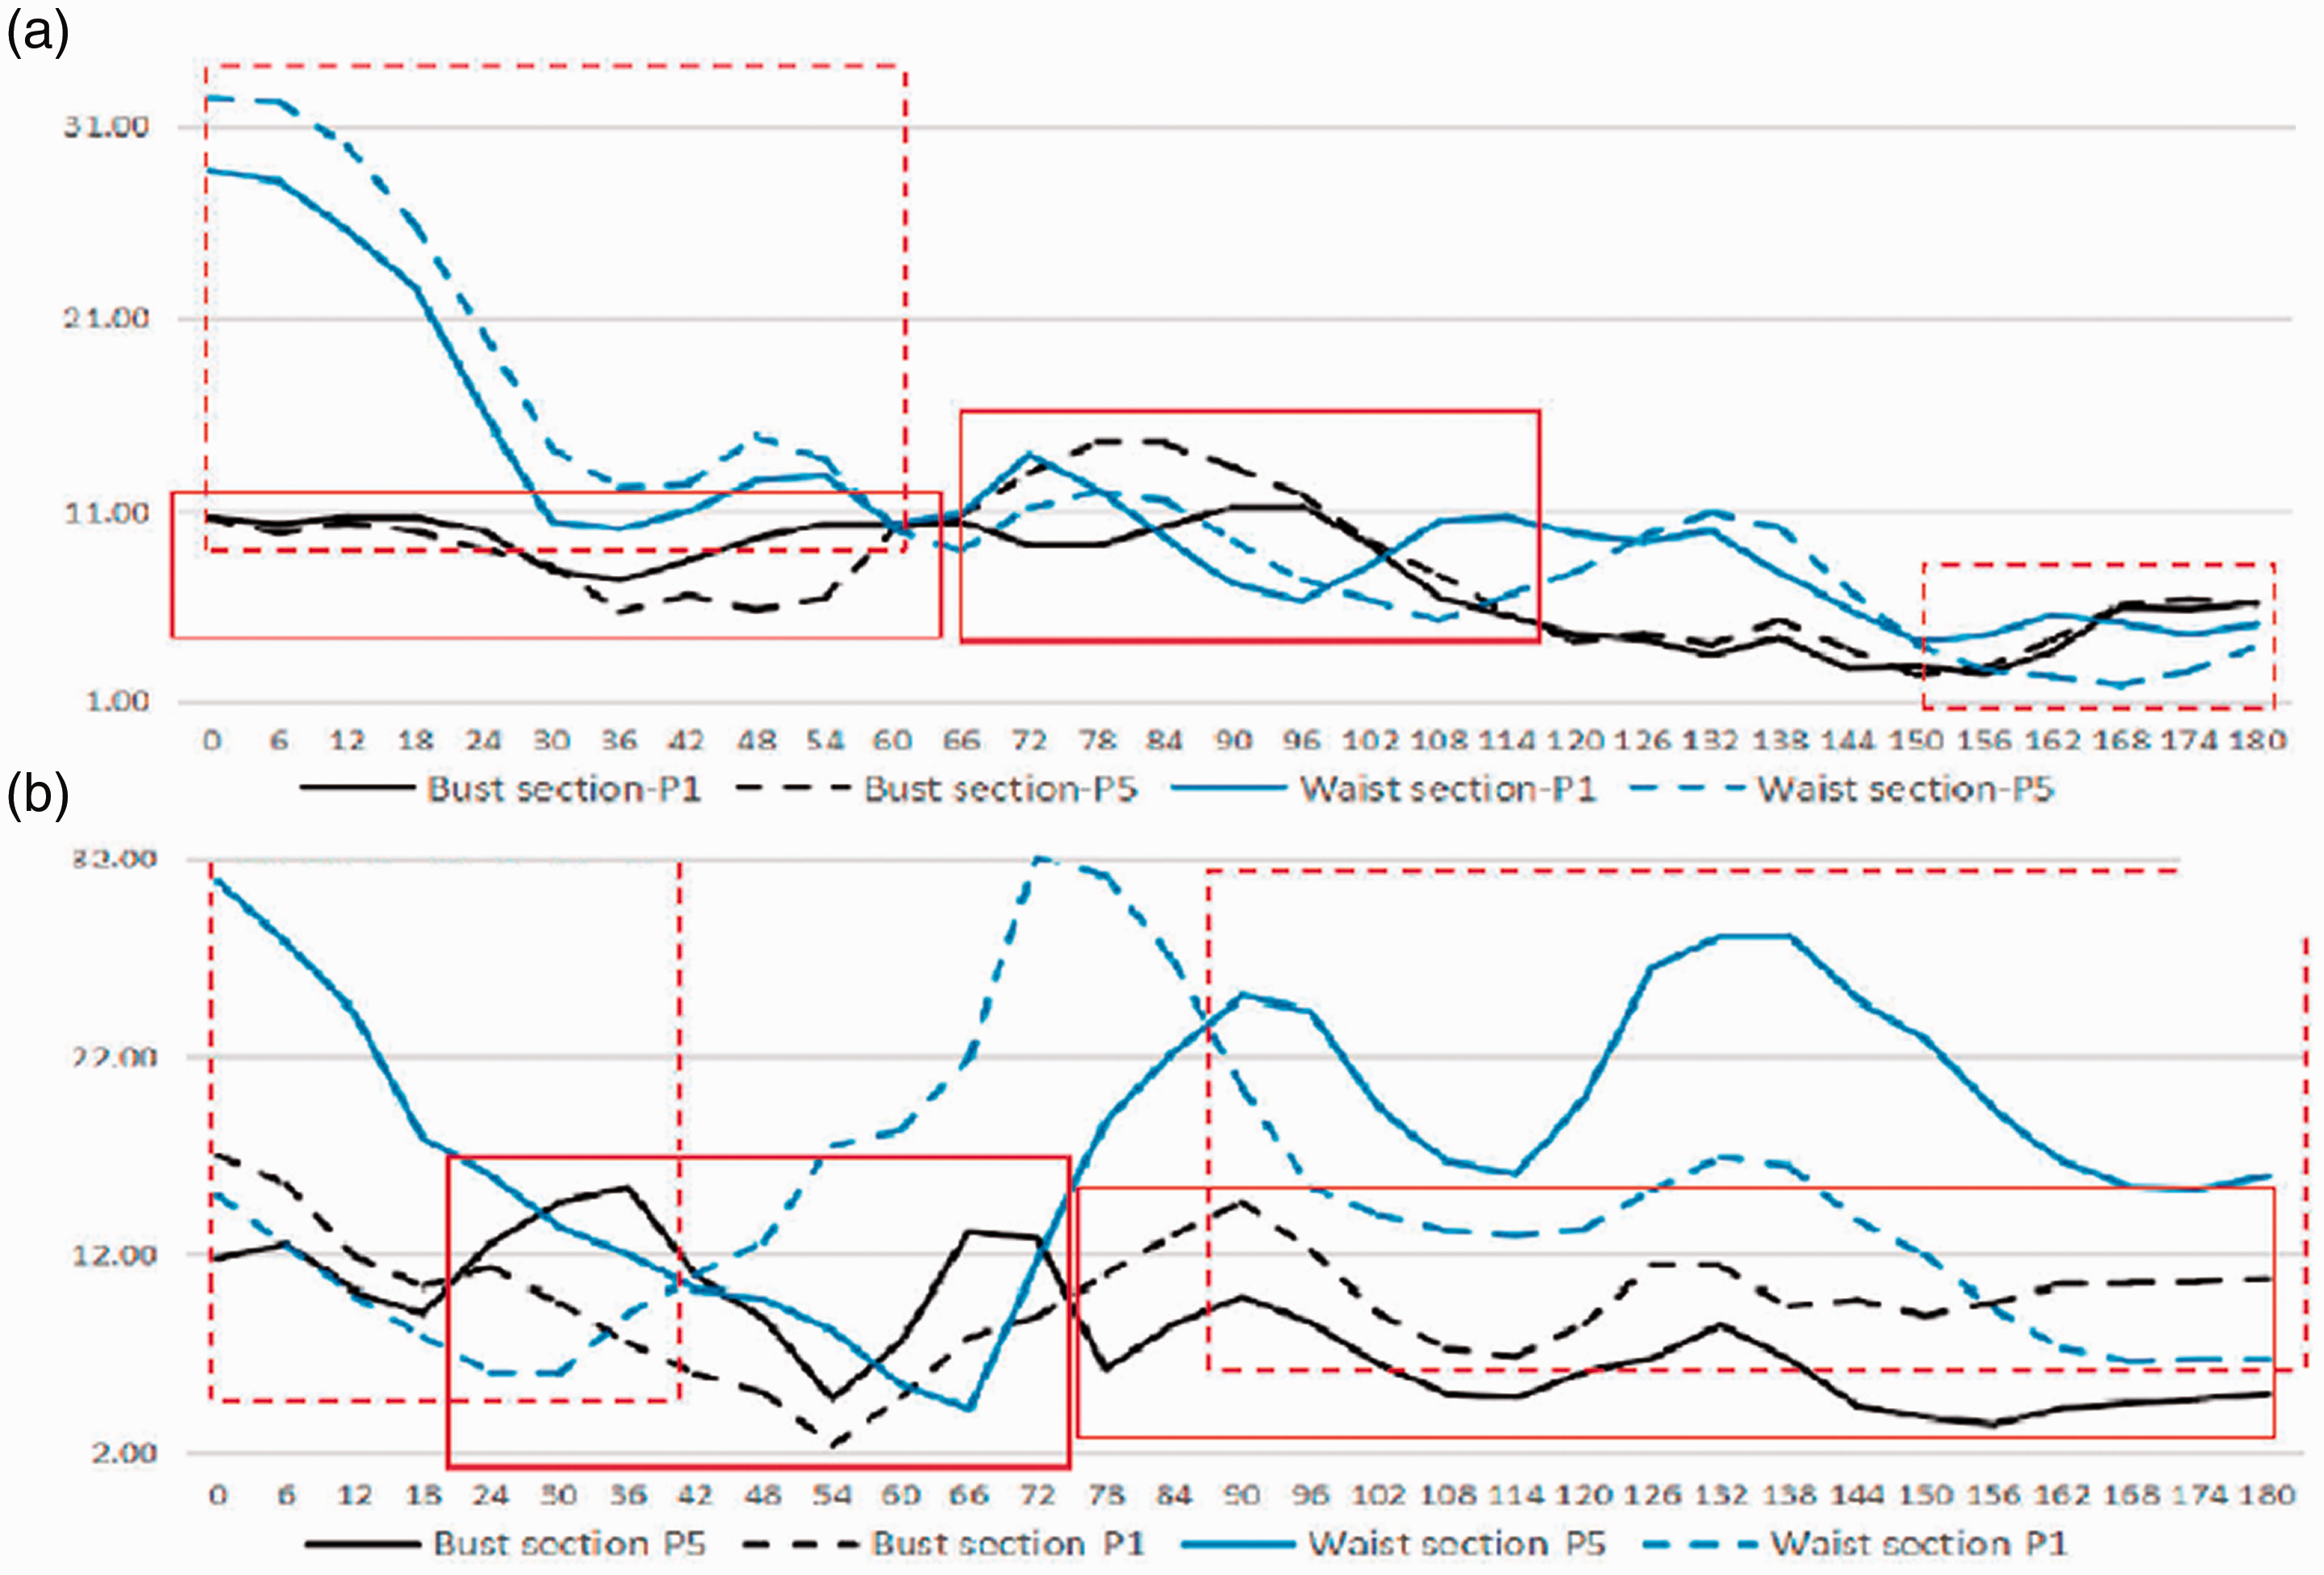
Air gap thickness distribution of sample garments with different DP: (a) PB2 in P1 and P5; (b) PF2 in P5 and P1.
The fluctuation of THA in the bust section of PF2 is more stable, and the difference in the waist section is larger. In the bust section, the THA of sample P5 is greater in the front area (20–74°) than in P1, which fits the body surface more closely. In the side to front area (75–180°), the THA of P5 is smaller than that of P1. In the dressing effect, the fabric structure is complete and the effect is better. In the waist section, the THA of sample P5 was greater than that of P1 in the back area (0–42°). In the side to front area (86–180°), the THA of P5 was greater than that of P1, with an overall distribution of greater THA in the front and back area and less THA in the side area. This can be explained by the wider bust width of the flat shape holding the fabric open laterally. When Df increases, ease in the front-mid area decreases, shifting the side margin partially, resulting in a upward shift of the front-mid and larger THA here.
The research conducted by Kim and Nozawa, 40 Kim and Sonehara, 41 and Monobe et al.40–42 about the aesthetic fit of a jacket mentioned that, with the increase of the girth of the bust, waist, and hip, the ease distribution had an important influence on the generation of folds and the appearance of clothing. This paper shows that DL and DP play an important role in the changing of THA, thus having significant effects on the formation of folds in the same individual with fixed Hrv.
The result shows that, in different scenarios of DL and DP, a small value of σ in the bust and waist section can improve the score of the dressing effect. It indicates that the stability of air gap distribution in the experimentally delineated area has a positive correlation with aesthetic fit.
Conclusion
This paper studied the relationship among aesthetic fit, air gap distribution of the bust and waist sections, and the factors of Hrv, DL, and DP. The result shows the following.
The influence of DL on the dressing effect: (i) HrvB was positively correlated with the THA in the front area (132–180°) and HrvW was negatively correlated with the THA in the side area (66–96°); (ii) the best effect was achieved when the round shape wore the sample garment with DL close to the front and back middle (L2, L3); (iii) the best effect was achieved when the flat shape wore the sample garment with DL close to the side seam (L5). The influence of DP on the dressing effect: (i) HrvB has a significantly negative correlation with the dressing score of the side view and a significantly positive correlation with the THA of the front area (132–180°); (ii) HrvW has a significantly negative relationship with the THA of the back side area (30–48°); (iii) the best effect occurred when the round shape wore sample garments with smaller Dbm and Df (P1, P2); (iv) the best effect was when the flattened body wore sample garments with smaller Db and Ds (P5). Suggestions for pattern design: the experiment proved that the uniform distribution of THA (smaller σ) was more likely to present an aesthetic and fit dressing appearance. In order to improve the dressing changes brought by the flatness of the human body, pattern design for the round shape can place a waist dart closer to the front and back middle and reduce Dbm and Df. In the pattern design for flat shape, the design should be the opposite.
This paper can provide a theoretical basis for the pattern design of aesthetic fit garments with different body shapes and optimizes the visual effect of dressing. However, the samples of the experiment are based on a prototype and the dart setting is limited. In addition, there are only 10 participants in the experiment. In order to explore the variation regularity of ease distribution caused by patterns under different body types, samples and participants need to be expanded in subsequent experiments.
Footnotes
Declaration of conflicting interests
The author(s) declared no potential conflicts of interest with respect to the research, authorship, and/or publication of this article.
Funding
The author(s) received no financial support for the research, authorship, and/or publication of this article.
