
Abstract
Supplier evaluation, including supplier selection and performance evaluation, has become a critical issue for apparel retailers within the apparel supply chain dealing with severe competition in the global market. An effective evaluation of suppliers requires considering both the quantitative and qualitative performance aspects and integrating the efficiency measurement. In an attempt to address this issue, this study proposes an integrated framework that can handle supplier selection and overall performance evaluation in a comprehensive but feasible manner. The proposed integrated framework customized for apparel retailers combines the current techniques having specific capabilities: data envelopment analysis (DEA), analytical hierarchy process (AHP), and the technique for order preference by similarity to ideal solution (TOPSIS). DEA has been used to make the overall performance evaluation, whereas AHP and TOPSIS have been used in combination to provide the quantitative data required by DEA. The proposed integrated framework was implemented and verified using numerical data gathered from a global apparel retailer. The findings revealed that suppliers can be more successful when they put a balanced effort into improving their performance in regards to the important criteria instead of concentrating on only the most important criterion. Moreover, the overall performance evaluation can be much more convenient and rewarding for apparel retailers in terms of finding out the true potential of suppliers when quantitative and qualitative data and efficiency measurements are taken into account at the same time.
Keywords
Apparel retailers have the major aim of offering high-quality products and services to satisfy their consumers and to gain competitive advantage. Since the competition for providing high-quality products increasingly occurs at the supply chain level rather than the company level, apparel retailers should continuously improve their supply chains and optimize their decision-making processes in the selection and performance evaluation of their suppliers. Specifically, it is crucial for apparel retailers to work with the most appropriate suppliers which have good professional capabilities, meet the required criteria, and provide the necessary outcomes. The outcomes expected from suppliers are mostly associated with tangible outputs, which are assessed quantitatively, such as the type and the number of products. But they also include some qualitative outputs, such as providing consistent quality, using technical abilities, and working transparently. Nonetheless, evaluating the performance of suppliers regarding these outcomes is not sufficient for building long-term relationships. 1 Even though the suppliers satisfy the necessary outcomes in the short run, this situation cannot be maintained in the long run without effective use of resources. Actually, considering also efficiency in the performance evaluation enables potential improvement areas to be discovered. This strengthens and prolongs the business relationship by increasing the mutual benefits obtained by both retailers and suppliers. Thus, building reliable collaborations with mutual benefits and long-term success can only be possible with the selection of the right suppliers and continuously checking their performance and considering their efficiencies. To achieve this aim, retailers should establish a framework that employs convenient decision-making tools in supplier selection and performance evaluation. The purpose of this study is to propose a framework for apparel retailers to assist their decision-making processes in supplier evaluation, which includes supplier selection and performance evaluation.
Decision-making for supplier evaluation is a vital and complex topic. Supplier evaluation should be established to satisfy many objectives and meet many criteria. It requires several qualitative and quantitative data to be systematically evaluated. All objectives, criteria, and assessment parameters should be selected specific to the industry concerned. The specification of parameters is especially important as industries differ from each other in terms of the expectations of consumers and the relevant requirements necessary to meet these expectations. Because of these complexities, many techniques, approaches, and procedures have been proposed by researchers. Techniques ranging from simple scoring methods to complex mathematical programming techniques, statistical methods, and artificial intelligence have been used for supplier selection, and simple ratios and parametric and non-parametric methods have been proposed for performance evaluation. 2 –4 Some techniques have been found to be satisfactory for both supplier selection and performance evaluation. However, it has also been stated that techniques should be combined to resolve complex decision-making problems. A number of studies employing the combined use of different techniques have confirmed that there is a consensus among researchers that each technique has its own strengths and weaknesses, and it has been much more beneficial to employ more than one technique at the same time. Integrating different techniques eliminates the inherent insufficiencies of the techniques and the possible biases in the interpretation of the results, and provides multiple perspectives with greater insights. 5 –6
As stated previously, performance evaluation has been practiced using various techniques. Among them, data envelopment analysis (DEA) has received special attention because of its ability to measure the relative efficiencies of decision-making units (DMUs) based on multiple inputs and outputs. 7 The capability of DEA to work with multiple outputs allows the consideration of more than one objective, and the capability of it to work with input and output parameters in performance evaluation allows us to check whether the objectives were met with fewer resources—or efficiently. These capabilities have been said to be the strength of DEA over single ratio analysis. 8 Also, DEA is easy to apply since the relative efficiencies are determined by identifying a frontier on a set of DMUs and no priorities or weights for inputs and outputs are to be determined, and no functional relationships between them need to be identified before the analyses, as in the case of regression analysis, which is an alternative performance evaluation technique. 9 –10 Finally, DEA has the ability to determine the reasons for inefficiency and suggest directions for improvement, which is a necessity in long-term relationships. 11 Therefore, it is accepted to be a simple but powerful method for efficiency measurement and performance evaluation. On the other hand, DEA is heavily criticized for being based on quantitative data and not being capable of working with qualitative data. 12 Because of this deficiency, it has usually been suggested that DEA is integrated with multi-criteria decision-making (MCDM) techniques.
Among the MCDM techniques, the analytical hierarchy process (AHP) has been widely used because of its capability of solving complex problems by decomposing them into a hierarchical structure and finding out the relative importance weights of a set of criteria via pairwise comparisons. This allows decision-making with the main objective of selecting suppliers and/or ranking them by evaluating each supplier against multiple criteria, which can be qualitative and quantitative in nature. 13 The AHP structure provides flexibility when determining priority weights for the criteria to improve the convenience of the selection. Moreover, it provides a measure for consistency within the judgments of the decision-makers. 14 Specifically, the strength of AHP compared to DEA is that AHP allows working with both qualitative and quantitative data. On the other hand, AHP is not effective when there is more than one objective that should be met at the same time, which is critical in performance evaluation. Moreover, the primary aim of AHP is to reach one objective or one type of output without considering the use of resources or inputs. Therefore, AHP is considered to be more of a supplier-evaluation technique rather than a performance evaluation technique, although it has been said to be suitable for making supplier evaluations. Finally, AHP has been criticized for its ineffectiveness in ranking alternative suppliers because of the cumbersome pairwise comparison requirements. 15 Therefore, it has usually been combined with other techniques. In fact, the technique for order preference by similarity to ideal solution (TOPSIS), which is another MCDM technique, is used to rank the alternatives according to a set of criteria, as in the case of AHP. 14 The alternatives are ranked simultaneously to have the shortest distance from the positive-ideal solution, in which the benefits are maximized, and the furthest distance from the negative-ideal solution, in which the costs are minimized. TOPSIS has similar deficiencies to AHP in performance evaluation. Despite the fact that it is an alternative to AHP, TOPSIS lacks the detail level in terms of building a hierarchical structure of criteria when compared to AHP. Moreover, the weights of the criteria are determined more subjectively in TOPSIS. Nonetheless, it has superiority over AHP in terms of ranking the alternatives, since TOPSIS has the strength of simplicity and ease of calculation, especially in the selection of alternatives. 13 , 16 –17
When the literature was reviewed for the application of these techniques in combination, it was observed that the mentioned techniques were used individually, in pairs, or in combination with other techniques for different purposes. Nonetheless, it was observed that there is no study in the literature that has combined these three techniques to build an integrated framework customized for the use of apparel retailers. The available ones either have combined a pair of these techniques or have not made the performance evaluation considering both input and output parameters. Moreover, they have not defined industry-specific criteria for the input and output parameters. With an attempt to overcome these research gaps and to make contributions to both the literature and industrial applications, a comprehensive and customized integrated framework for retailers has been proposed for decision-making processes in the selection of suppliers and measurement of their performance, which is capable of working with both qualitative and quantitative data in specified input and output parameters.
The study begins with a literature review about the combined use of the mentioned techniques to reveal the research gaps and form a base for the proposed integrated framework. It continues with a literature review to ascertain the mostly frequently used input and output parameters and crucial criteria/subcriteria in supplier selection and performance evaluation. In order to customize the framework for apparel retailers, the studies reviewed in this section are limited to only those established in textile, apparel, and apparel retail industries. The presentation of the study continues with the introduction of the proposed integrated framework by giving details about the selected parameters as a part of the framework, its application procedure, and the necessary calculations. This section is followed by the implementation of the proposed integrated framework on a real case. The study ends with the section of theoretical and practical contributions of the study, where the originality and the capability of the proposed integrated framework are discussed.
Literature review
Literature review on the integrated use of DEA, AHP, and TOPSIS
This section is dedicated to the combined use of DEA, AHP, and TOPSIS. DEA, AHP, and TOPSIS are well-known techniques that have been intensively used by researchers. While some of these studies were related to the mathematical modification of these techniques, most of the studies were concentrated on increasing the benefits gained from their use. The latter type of studies mostly suggested the integrated use of these techniques to exploit their strengths and to eliminate their weaknesses.
DEA has been commonly applied in performance evaluations of the production and service industries. It was used with either AHP or TOPSIS because it was criticized for working with only quantitative data. In some of the studies that employed DEA and AHP, AHP was subsequently used after DEA without any integration. For instance, Mahapatra et al. suggested using DEA to calculate the relative efficiency of DMUs, which were then ranked in terms of their performances with AHP. 18 Some researchers applied AHP and DEA in combination in such a way that the input and output parameters in DEA were determined and weighted with AHP, but the efficiency of DMUs was determined with DEA. Using assurance region DEA in conjunction with AHP, Lai et al. incorporated the weights of the criteria in AHP as the coefficients of the input and output parameters in DEA. 19 Similarly, Falsini et al. brought AHP, DEA, and linear programming together in the evaluation and selection of logistics providers, where AHP was utilized in the definition of the constraints and DEA was utilized to formulate the coefficients of the objective function in the linear programming model for supplier performance. 20 Other than these studies, in which the weights of the input and output parameters were determined with AHP, AHP was also used to provide the quantitative data for all the input and output parameters in DEA analysis. In a study establishing the performance evaluation of territorial units in Turkey, Calik et al. employed AHP and DEA techniques in two stages. In the first stage, the decision-makers’ opinions, expressed in linguistic terms, were converted into a quantitative form with AHP. In the second stage, DEA was used to obtain the relative efficiencies of the sub-regions. 21 Accordingly, in a recent study, Ersoy and Dogan employed AHP to determine the weights of the criteria that were regarded as the input and output parameters in DEA for the evaluation of suppliers. 22 The studies established in the textile, apparel, and apparel retail industries did not have a high level of integration, however. AHP was usually employed after performance analysis with DEA. Zhao et al. established a study on the Chinese textile industry in which the hierarchical structure of AHP was used to rank the efficiency of DMUs determined with DEA. 23 Jatuphatwarodom et al. proposed a decision-support model consisting of DEA, AHP, and goal programming. In this model, DEA was used to categorize a set of DMUs as efficient and inefficient. AHP and goal programming were used to determine the importance of the criteria in efficiency levels. 14
The studies combining DEA and TOPSIS are similar to the studies combining DEA and AHP, since AHP and TOPSIS are two techniques that might be substituted for one another. Nonetheless, the use of TOPSIS for ranking the efficiency of units determined with DEA was much more common compared to studies combining DEA and AHP. In this respect, Bhattacharyya and Chakraborty evaluated the performance of Indian technical industries with DEA to find out which were the efficient ones, and then ranked them using TOPSIS. 24 Venkata Subbaiah et al. used DEA followed by TOPSIS for the evaluation and ranking of institutions in engineering education. The factors that affect the ranking of educational institutions were categorized as the input and output parameters, and then TOPSIS was used to assess the effectiveness of the institutes in regards to them. 25 Hemmati et al. measured the relative efficiencies of private and governmental banks, where DEA was used to find out the efficient units and TOPSIS was used to rank these units in terms of five criteria. 26 Mehta et al. assessed the efficiency of DMUs in regards to carbon emission controls using DEA, followed by TOPSIS. 27 In a recent study, Ersoy evaluated the performance of distance education by using DEA followed by TOPSIS. 28 Other studies employed these two techniques simultaneously for verification purposes. Wang et al. implemented a model including DEA and TOPSIS for the evaluation of reverse logistic companies. The findings of DEA in terms of slack inputs and outputs were verified using TOPSIS. 29 Chitnis and Vaidya suggested an efficiency ranking model for financial banks. DEA was used to find out which were the efficient banks, which were then ranked according to the input and output parameters with TOPSIS by computing the Euclidean distances from the positive-ideal and negative-ideal solutions. 30 Other than these, some studies in the literature used DEA and TOPSIS techniques in a somewhat integrated manner. As in the case of the studies integrating DEA and AHP techniques, this integration was achieved by either weighting the input and output parameters or providing the quantitative data required for DEA calculations with TOPSIS. Chen et al. constructed a hybrid model in which the weights of the criteria were determined by TOPSIS and the performance of the alternatives were evaluated with DEA by using two optimization models according to the distances from positive- and negative-ideal solutions. 31 Rouyendegh et al. integrated TOPSIS and DEA to assess retail industry performance, where all the input and output parameters for the evaluation of the retail stores with DEA were provided using TOPSIS. 32 Zeydan and Colpan developed a decision-support system for performance measurement of manufacturing/maintenance jobshops by integrating TOPSIS and DEA. These researchers used the results of TOPSIS to provide qualitative data for output parameters and used DEA to measure the final quantitative performance. 33 Although many studies have been established in different fields, a limited number of studies have been established in textile, apparel, and apparel retail industries. Chen applied DEA, TOPSIS, and SWOT (strengths, weakness, opportunities, and threats) analysis for supplier selection and evaluation, where he used DEA to assess the suppliers, SWOT analysis to determine the criteria for supplier selection, and TOPSIS to evaluate the suppliers’ performances in these criteria. 34 Similarly, Jing integrated four methods: SWOT for strategic analysis, DEA for selecting the candidate suppliers, TOPSIS for evaluating suppliers, and finally the Delphi method for assessing the suppliers’ performance. 12 In these latter two studies in the textile, apparel, and apparel retail industries, the two techniques were employed in a subsequent manner without direct integration.
Other than these studies implementing DEA in conjunction with either AHP and TOPSIS, there are numerous studies in the literature that combined AHP and TOPSIS. Although these techniques are interchangeable because they provide the same type of outcomes, the researchers suggested using AHP and TOPSIS methods in combination in order to have the advantage of the detailed, hierarchical structure of AHP and the ease of calculation of TOPSIS in selecting the alternative suppliers. 16 Having specific criteria and subcriteria, these studies were established for numerous purposes, including supplier selection, facility location, marketing management, knowledge management, human resource management, and performance measurement in regards to sustainability, and in a broad range of application fields, including manufacturing, construction, logistics, and health. 35 –46 There are also some examples of the combined use of AHP and TOPSIS in the textile, apparel, and apparel retail industries. Mishra et al. proposed an integrated approach of AHP and TOPSIS in prioritizing and evaluating manufacturing flexibility of Indian apparel companies in cases of uncertainty. 47 Concentrating on a specific case in the fashion industry, Lin and Twu suggested using AHP and TOPSIS together in the selection of fashion design schemes. 48 However, there is no study involving the combined use of these techniques established in the retail industry for the selection and performance evaluation of suppliers.
The number of studies establishing these three techniques in combination have been quite limited. Duman et al. implemented a performance evaluation model using quantitative and qualitative data in the food industry with the integration of these three techniques. 49 These researchers used TOPSIS to rank alternative suppliers using the results of DEA and AHP calculations, where DEA was used to assess quantitative performance in regards to the quantitative data and AHP was used to determine the qualitative performance in regards to the qualitative criteria. Assessing the performance of electricity distribution utilities, Celen and Yalcin also suggested integrating AHP, TOPSIS, and DEA. 50 These researchers obtained the qualitative output, “quality of service.” Then, they utilized DEA to determine the efficient DMUs on two more output parameters, “quantity of electricity derived” and “number of customers” and three input parameters, “number of employees,” “length of distribution,” and “transformer capacity.” Zeydan et al. used AHP and TOPSIS to transform qualitative data into quantitative data by developing the parameter “quality management system audit.” 51 Then, the performances of the suppliers were assessed with DEA analysis, in which the input parameter was selected as a dummy variable with a value of 1. The performance evaluation was based on only output parameters, which were “quality management system audit,” “warranty cost ratio,” “defect ratio,” and “quality management.” In the only study in the literature established in the textile industry, these three techniques were used in a somewhat integrated manner. Ulutas et al. proposed a supplier selection model and showed the applicability of these methods on a real case. 52 In the model, the qualitative performance evaluation was made using AHP and TOPSIS techniques, where the weights of the qualitative criteria were calculated with AHP and the rankings of suppliers were obtained with TOPSIS. The quantitative type of data obtained from this treatment was defined as “qualitative performance value” and used as an output parameter with another output parameter called “quantitative performance value” in DEA analysis. Similar to the study by Zeydan et al., 51 Ulutas et al. used a dummy input variable within the performance calculations.
When the overall assessment is made on the studies presenting the combined use of any two of the mentioned techniques, it can be stated that these studies differ in terms of the techniques used in combination, the sequence of the application of these techniques, the type and level of integration of the techniques, and finally the application fields. Specifically, it can be revealed that the studies that used DEA followed by MCDM techniques benefited from further understanding the situation by concentrating on only the efficient DMUs. Nonetheless, the studies having the main purpose of performance evaluation usually applied DEA as the main technique of the integrated applications. Within the studies established for performance evaluation, AHP, TOPSIS, or both either provided the weights of input and output parameters or transformed the qualitative type of data into the quantitative type of data to be used in DEA calculations. That kind of integrated framework, having the capability of working with both the quantitative and qualitative type of data, was stated to eliminate the drawbacks of using a single method and to create a synergy by intensifying the strengths of the mentioned techniques. Nonetheless, it was observed that the number of studies integrating these three techniques together was limited. 49 , 51 –52 Among these three, two used dummy variables as input parameters in DEA calculations, which enabled the efficiency frontier to depend only on the output parameters instead of multiple input and output parameters. In fact, the only study established in the textile industry adopted that kind of performance evaluation, which was based on only output parameters. Last but not least, no specific criteria in AHP and TOPSIS analysis and no specific input and output parameters in DEA analysis were identified for the apparel retail industry in any of the studies.
The parameters in DEA, AHP, and TOPSIS for supplier selection and performance evaluation
DEA, AHP, and TOPSIS techniques have been employed individually, in pairs, and in combinations for different purposes and in different fields of applications. Although all of these studies in different fields are valuable, these cases cannot be adopted by a specific industry without modifying the parameters, the criteria, and subcriteria in AHP and TOPSIS applications, and input and output parameters in DEA applications. Having the specific purpose of developing a customized framework for the use of apparel retailers, in this section the previous studies established in textile, apparel, and apparel retail industries are reviewed to establish the input and output parameters in DEA analyses and the selected criteria and subcriteria in TOPSIS and AHP analyses to extract the required parameters in the integrated framework to overcome the research gaps.
In the studies using DEA, which were mainly concentrated on the performance evaluation of textile, apparel, and apparel retail companies, the efficiencies were usually calculated by using some financial ratios or default parameters such as “capital” and “amount of sales” as the input and output parameters respectively. 10 , 53 –56 The other studies investigating specific issues, such as the efficiencies of production, operational practices, and marketing activities, involved parameters that were purposefully selected to have tangible aspects. 9 , 12 , 34 , 57 Among a diverse set of quantitative input and output parameters, the ones regarding the assets of the suppliers, such as “number of employees,” “total intangibles,” and “total inventory” became the most preferred input parameters. 9 –10, 57 Parameters such as “productivity,” “service level,” and “quality” became the most favored output parameters. 6 , 12 , 34 , 53 There were also a few studies considering the quality and related qualitative criteria as output. 6 , 51 , 52 On the other hand, in none of these studies is the design capability of the apparel suppliers identified as an input or output parameter. Also, the amount of capacity allocated by the suppliers to the retailer, which might be regarded as the dominance and power of the retailer over suppliers, was usually ignored.
Apart from the parameters in DEA, various criteria and subcriteria and the hierarchical structures at different detail levels were employed in AHP analyses. Hence, they had some criteria in common. The majority of the studies covered issues related to the characteristics of providing products and services in their criteria/subcriteria. Specifically, the first-level criteria were usually determined to be “delivery,” “flexibility,” “cost,” “quality,” and “reliability,” as in the case of the study by Teng and Jaramillo. 58 Other researchers extended these criteria to include “service,” “trust,” “technology,” “innovation,” or others (for instance, including “delivery time” and “payment terms” in the criteria related to delivery). 1 , 59 –61 In addition to the issues related to providing products and services, managerial parameters and related issues were also considered in other studies. Chan and Chan proposed an AHP model consisting of a main criterion called “company background/business structure” in the first level of their hierarchy. 13 In more recent studies, specific criteria such as “strategic alliance,” “financial position,” “logistic position management systems,” and “technical capability” were integrated in the AHP structure. 62 , 63 Focusing specifically on quality management, criteria such as “quality assurance,” “process improvement,” “quality-related certificates,” and “quality management” were proposed. 64 Thus, the major classification of the criteria used in previous studies covered issues pertaining to products, services, and management, including organizational characteristics, but the criteria were not determined to cover these three issues with the exact terms in any other study. Even though the individual use of TOPSIS is limited compared to AHP, the selected criteria were very much in common with those in AHP. The criteria selected in previous studies covered “quality,” “cost,” “delivery performance,” “lead time,” “geographical location,” “flexibility,” and “capacity”. 65 , 66
The proposed integrated framework
The proposed integrated framework for supplier selection and performance evaluation is composed of three techniques: DEA, AHP, and TOPSIS. DEA has taken place in the center of the proposed integrated framework. It has been used to provide overall performance evaluation scores of DMUs or suppliers and divide them into two categories, efficient ones and inefficient ones, using quantitative data. AHP and TOPSIS have been used to treat the qualitative criteria and to transform the data from these criteria into quantitative data to be used for performance evaluations in DEA. Specifically, AHP has been used to build a hierarchical structure of qualitative criteria and evaluate the priority weights of each criterion by calculating their local and global weights. TOPSIS has been integrated to provide the quantitative data required by DEA by determining the qualitative performance score of each DMU in terms of the qualitative criteria described in AHP.
The customization of the proposed integrated framework has been established with the selection of the convenient input/output parameters and criteria/subcriteria considering the lack in the literature. Although the determination of the criteria and subcriteria was also confirmed by experts during the implementation of the proposed integrated framework on a real case, the parameters and the reasons underlying the selection are described below as they are an inseparable part of the customized integrated framework.
The selection of input and output parameters is based on previous studies, with an additional purpose of eliminating the gaps in the literature. The parameters “number of employees” and “annual production capacity” were selected as the quantitative input parameters; “number of different product styles” and “business volume ratio” were selected as the quantitative output parameters. “Supplier overall quality score” was selected as the qualitative output parameter, derived from the treatment of the qualitative criteria by the integrated use of AHP and TOPSIS. The expressions about the parameters and the basis for selection are explained in detail below.
In the proposed integrated framework, the AHP structure proposed by Kilincci and Onal is used based on the literature review and the negotiated belief among the experts, who have confirmed that classifying the criteria in terms of product, service, and managerial concepts of suppliers has facilitated systematic thinking. 71 Although, the hierarchical structure was given previously for another industry, it has been found to be satisfactory in terms of covering the criteria required by apparel retailers. Nonetheless, some minor modifications have been made to this hierarchical structure according to the requirements of the apparel retail industry. The parameters in the first level of the hierarchy have been kept the same, but the number of subcriteria has been reduced from seven to four for the first level of the criteria, based on the discussions among experts. Being similar to the parameters in DEA, the subcriteria “capacity” and “financial status” have been eliminated. The two subcriteria “working with Kanban approach” and “quality systems” have been merged into a single subcriterion and renamed as “quality systems and certification.” The subcriteria “management” and “handling” have been rephrased as “management and organization” to express broader perspective in management and “seamless production” to express fast and problem-free production operations. The final two-level hierarchy of AHP structure is given in Figure 1. Integrating the techniques in the way described and involving the parameters identified, the final framework customized for apparel retail industry is given in Figure 2.

Two-level hierarchy of analytical hierarchy process (AHP) structure, the criteria, and subcriteria.
Figure 2. Integrated framework for the case study.

As seen in Figure 2, DEA has taken place at the center of the proposed integrated framework, but it requires the treatment of some data with the combined use of AHP and TOPSIS. Therefore, the application procedure begins with the treatment of the qualitative data and continues with the application of DEA. The calculations required for the proposed integrated framework are given below in this order.
The calculations for treating the data for qualitative criteria using AHP and TOPSIS
AHP and TOPSIS are used in combination to provide data for the DEA model. AHP is used to assign the weights of the qualitative criteria, while TOPSIS is used to rank the suppliers and get an overall score—“supplier overall quality score”—with respect to the criteria.
The calculations in AHP are established according to the procedures suggested by Saaty.
72
The weights of the criteria are estimated by finding the principal eigenvector w of the pairwise comparison matrix A using equation (1):

The consistency of the evaluations is assessed using the consistency ratio (CR) and consistency index (CI), which are calculated using equations (2) and (3), and the random index (RI), whose values are proposed by Saaty according to the size of the matrix n:


The evaluations are stated to be reliable when the value of CR is lower than 0.1. After calculating all the local priority weights in one level and satisfying consistency, the global priority weights of the criteria are calculated by multiplying the weights at different levels of the hierarchy.
To obtain “supplier overall quality score,” the calculations are made using TOPSIS according to the procedure described by Ghosh et al.
73
A decision matrix D, which has the alternative suppliers in rows and the subcriteria in columns, is developed. Then the decision matrix is normalized and weighted by multiplying the elements of the normalized decision matrix rij

The positive-ideal A* and negative-ideal A– solution are determined using the formulas in equations (5) and (6):


Then, the qualitative output “supplier overall quality score” for the alternative suppliers is calculated as the relative closeness to the ideal solution, which is derived from separation measures of each supplier from the positive-ideal and negative-ideal solutions.
Required calculations in integrated framework for performance evaluation using DEA
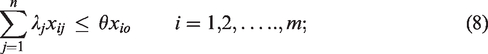
In the proposed integrated framework, the DEA method is employed to establish primarily the performance evaluation. It is used to evaluate the performance score of each supplier with the Charnes, Chopper, and Rodes (CCR) model based on a constant returns to scale assumption, and the Banker, Charnes, and Chopper (BCC) model based on a variable return to scale assumption. Checking the availability of the prerequisite for using the DEA model regarding the minimum number of DMUs, the efficiency score of each supplier is calculated by solving the mathematical model composed of equations (7)–(10). 74 , 75 Since the proposed integrated framework includes five parameters (two inputs and three outputs), it requires using a data set consisting of the data from at least 15 suppliers as the number of DMUs should be at least three times the total number of input and output parameters to apply DEA. 74
The mathematical programming problems composed of the Equations 7-9 are solved in order to obtain efficiency score under the assumption of constant return to scale:


The constraint in Equation 10 is added to obtain efficiency score under the assumption of variable return to scale:
A DMU having an efficiency score equal to 1 is defined as relatively efficient; otherwise it is relatively inefficient. The “overall performance evaluation score” is obtained in terms of “technical efficiency,” “pure technical efficiency,” and “scale efficiency.” The efficiency scores calculated with the assumptions of CCR and BCC are called “technical efficiency” (TE) and “pure technical efficiency” (PTE), respectively. The “scale efficiency” (SE) is calculated using equation (11).
76


Implementation of integrated framework on a real case
To depict the application procedure and the interpretation of the findings of the integrated framework, it was implemented on a real case, an international apparel retailer based in the UK. The retailer has more than 460,000 employees and 7000 supermarkets in the UK, Europe, and Far East. Among various merchandise, it sells low- to medium-priced knitted apparel products such as casual wear, underwear, and hosiery under its own private label. The retailer makes its apparel procurement via eight liaison offices in different countries. The implementation of the integrated framework was done in the liaison office in Turkey, which was founded in 2003 and has been procuring £70 million of products annually from more than 15 suppliers and 34 subcontractors. The suppliers selected for analysis were 23 subcontractors (SC i ) of 6 main suppliers (S i ), which were producing knitted products. The main suppliers and the associated subcontractors are listed in Table 1.
Suppliers and subcontractors

The quantitative data for performance evaluation were gathered from past records about the suppliers covering the time period between February 2016 and February 2017, because of privacy concerns. The data needed for AHP and TOPSIS were obtained from a group of experts consisting of 11 staff working in the liaison office. The experts had 2–13 years of experience. Seven of them worked as merchandisers; the others were working as fabric manager, technical manager, product technician, and planning manager. They have been educated in the field of textile engineering and know the selected suppliers well. Data were gathered in two meetings established with the expert group in which mainly brainstorming and group conciliation were used to confirm the criteria/subcriteria, and Delphi principles were employed for the determination of the priority weights and the evaluation of the suppliers using these criteria. These meetings were co-chaired by the researchers, who were responsible for preparing the forms needed, recording the data, making calculations (development of aggregated matrices using geometrical means and checking the consistency), and providing feedback during the meetings. In the first meeting, various criteria from the literature were discussed by the experts using brainstorming. In the second meeting, the final hierarchical structure presented was confirmed with a consensus. Then, the expert group evaluated the criteria and the suppliers’ performances according to these criteria quantitatively, using the scales in Table 2 for AHP and Table 3 for TOPSIS. The experts were required to reevaluate their ratings when their results did not satisfy the criteria for consistency in AHP.
The fundamental scale for pairwise comparison for AHP72

The scale used by the experts in TOPSIS calculations

The priority weights of the selected criteria were evaluated using the mathematical calculations proposed by AHP. The local priority weights for the first and second levels of the hierarchy and the results for consistency evaluations are given in Tables 4 and 5, respectively.
Pairwise comparison judgment matrices of criteria for the first level of the hierarchy

CI, consistency index; CR, consistency ratio; RI, random index.
Pairwise comparison judgment matrices of criteria for the second level of the hierarchy

CI, consistency index; CR, consistency ratio; RI, random index.
In the first level of the hierarchy, “product performance” criteria got the local priority weight of 0.655, which was followed by the criteria “service performance” and “suppliers’ managerial characteristics,” having priority weights of 0.187 and 0.158, respectively.
Considering the results obtained in the second level of the hierarchy, the most important subcriteria became “quality system and certification” under the “suppliers’ managerial characteristics” criterion and “product price” and “product quality” under the “product performance” criterion. Other than the “follow up,” all three other subcriteria—“lead time,” “technical capability,” and “accuracy and reliability”—were assessed identically to have highest local priority weights in the “service performance” criterion.
The local and global priority weights and ranks are given in Table 6. The two most important subcriteria became “product price” and “product quality.” Although the subcriterion “seamless production” got a lower rank under the criterion “product performance,” its ranking improved after determination of the global priority weights for all subcriteria. Other than this subcriterion, the subcriteria mostly preserved their previous rankings.
Local and global priority weights and rankings

The qualitative type of output parameter “supplier overall quality score” of each supplier in regards to the qualitative criteria was calculated using TOPSIS. Since the 23 subcontractors belonged to 6 main suppliers, the performance evaluation scores were carried out only for those main suppliers. The decision matrix based on expert opinion was built as in Table 7. In the decision matrix, the highest scores were assigned to S3, followed by S1 and S5. The suppliers S2, S3, S4, S5, and S6 showed the highest performance values in the criteria B1 (product price) and B3 (product quality), having the highest global priority weights. Suppliers S3, S4, S5, and S6 got exactly the same scores in B1 and B3.
Decision matrix by the experts group

The weighted normalized decision matrix was built, the positive-ideal, A*, and the negative-ideal solutions, A–, were calculated as given in Table 8 using the normalized form of the decision matrix and the priority weights derived in AHP. The highest difference between the positive- and negative-ideal solutions were observed in the subcriteria B1 (product price) and B2 (seamless production) because of the differences in performance levels of S1 and S2, where S1 showed far better performance in both subcriteria.
Weighted normalized decision matrix with the ideal positive and negative solutions

The relative closeness of the “supplier overall quality scores” was calculated for each supplier using the separation measures of positive and negative solutions as seen in Table 9. Supplier S6 got the highest score in terms of relative closeness, the supplier quality score, which was followed by S5, S4, S3, S2, and S1. Even though S3 and S1 got the highest total scores in the decision matrix in Table 7, their “supplier overall quality scores” lay beyond those of others. This was because the other suppliers were more successful in the criteria of having higher priority weights. Nonetheless, it was not sufficient to concentrate on only the most important criteria. Four of the six main suppliers had got the same score in the most important criteria, but they had different “supplier overall quality scores” in the end. Thus, the suppliers were revealed to present a more balanced approach to improve their performance in qualitative criteria by focusing on as many criteria as possible.
The suppliers’ separation measures (Si* and Si–), relative closeness, and rankings

The overall performances of the 23 suppliers were calculated using input-oriented DEA models under the CCR and BCC assumptions. Despite the fact that the output-oriented models are more convenient for performance evaluation, the input-oriented models approach was used in DEA calculations because the improvement ratios could be misleading as the same qualitative output values were used for all subcontractors of the main suppliers. The values of input and output parameters for the suppliers used in DEA calculations are given in Table 10.
The input and output parameters of the suppliers

The “overall performance score” in terms of “technical efficiency,” “pure technical efficiency,” and “scale efficiency” values were calculated as given in Table 11. Suppliers that scored 1 were stated to be efficient according to CCR and BCC assumptions. Thus, it was observed that three subcontractors (SC3, SC16, and SC17) were efficient in terms of “technical efficiency,” eight subcontractors (SC3, SC6, SC7, SC9, SC19, SC17, SC11, and SC14) were efficient in terms of “pure technical efficiency,” and three subcontractors (SC2, SC17, and SC23) were efficient in terms of “scale efficiency.” PTE scores of subcontractors were generally better than their TE and SE scores, which meant that most of the subcontractors were not producing at the appropriate scale since PTE is the efficiency type ignoring the scale of the DMU. 29 Only two subcontractors (SC3 and SC17) were found to be efficient in all three efficiency types. In regards to the subcontractors, it was interesting to see that SC3, which belonged to the first supplier, S1, had the lowest value in regards to the “supplier overall quality score.” Since all the inputs and outputs were handled at the same time in DEA, SC3 was found to be among the best subcontractors. On the other hand, some of the other subcontractors had above-average outputs and below-average inputs; 11 subcontractors were found to be inefficient in all three efficiency types, putting forward the capability of DEA to consider both the inputs and outputs at the same time.
Overall performance evaluation score in terms technical efficiency, pure technical efficiency, and scale efficiency scores

Since input-oriented DEA was used in the calculation of DEA scores, the subcontractors were advised to make some adjustments to their input levels to become efficient. In order to determine the fields of improvement, the reference set for each subcontractor was also carried out using the values of efficient subcontractors in the efficiency frontier, as seen in the last two columns of Table 10. In this regard, the subcontractors SC3, SC16, and SC17 and their combinations were given as references for TE. Similarly, the subcontractors SC3 and SC17 and their combinations were given as references for PTE. Using the reference sets, the improvement ratios for each subcontractor in terms of input parameters were calculated as given in Table 12.
The improvement ratios for overall technical efficiency and pure technical efficiency

The negative values in the improvement ratios indicated that the inputs should be reduced in that amount, and the opposite for the positive values. For instance, SC6 was found to be PTE but not TE. This supplier should decrease the number of employees by 57% in order to be TE. The subcontractors that had to make major improvements in terms of their inputs were SC2, SC22, and SC23, which were TE, and SC8, SC22, and SC23, which were PTE. The reason for this was that, there were big differences in the scales of the subcontractors.
Evaluating the results of AHP and TOPSIS and the results of DEA, the framework confirmed the importance of integrating these three methods. It was observed that although supplier S6 (with subcontractors SC22 and SC23) got the best and supplier S1 (with subcontractors SC1, SC2, SC3, SC4, and SC5) got the worst “supplier overall quality score” according to the results of AHP and TOPSIS, both of these suppliers and their subcontractors showed an average performance beyond that of S2, since the “overall performance scores” in DEA were based on four more input and output parameters.
The sensitivity of the integrated framework for qualitative data as an output parameter was checked with further analysis in which the qualitative type of output “supplier overall quality score” was excluded and DEA analyses were performed for the remaining two input parameters and two output parameters. It was seen that SC16 and SC19 were no longer found to be technical efficient and pure technical efficient respectively. This confirmed that the integrated framework has considered the qualitative type of data derived from combined use of AHP and TOPSIS. Moreover, in order to confirm that the integrated framework has considered both input and output parameters, the sensitivity of the integrated framework to the specified input and output parameters was checked. As in the case of the only study established in the textile and apparel industry, 52 the analyses in the study were re-established for a second situation in which one dummy variable was selected as an output parameter. It was observed that subcontractors SC11 and SC17, which had the lowest values in the input parameters, were found to be TE and PTE.
Theoretical and practical contributions
The theoretical contribution of the study is related to the originality of the proposed integrated framework in terms of its capabilities and its customization.
The integrated framework is composed of three available techniques, which were integrated in a manner to benefit their inherent strengths and eliminate their deficiencies. In the framework, the strength of DEA for making performance evaluations on multiple inputs and outputs and the capability of determining possible areas of improvement were improved. The weakness of DEA, only working with quantitative data, was eliminated with the combined use of MCDM techniques. The strengths of AHP—build a consistent hierarchical structure of qualitative criteria and determining the priority weights for them—were utilized. The deficiency of AHP in evaluating the suppliers using complicated pairwise comparison was eliminated with the integration of TOPSIS.
The sensitivity of the integrated framework to the qualitative data and the input and output parameters confirmed the advantages of the integration of these techniques. Integrating the qualitative aspects ensured the overall performance of the suppliers was reflected. Assessing the performances by using both the input and output parameters enabled deducing the true potential of the suppliers, using efficiency measurement to find out potential directions for improvement.
Apart from these, the main originality of the integrated framework is the customization of it for apparel retailers. All the parameters in the integrated framework have been selected considering the requirements of the apparel retail industry. To the best of our knowledge, no framework with the properties described above has been established before, which is customized for the apparel retail industry. Specifically, the hierarchical structure of the qualitative criteria in the integrated framework has been specialized for apparel retailers. Two new output parameters, “number of product style” and “business volume ratio,” have been included in the framework for the performance evaluation of suppliers.
Practically, the integrated framework provides a tool for apparel retailers to optimize their decision-making processes in the supply chain. Retailers can adopt these parameters, criteria, and even the priority weights of the criteria. They can use this tool after making some minor modifications according to their own situations.
Some inferences were derived from the implementation of the integrated framework on the case in this study which might be generalized for the apparel retail supply chain, regardless of the fact that the case study revealed specific results in TOPSIS and DEA analysis for the retailer in question. In this regard, the results of AHP analysis put forward that the most important subcriteria for suppliers producing low- to medium-priced goods were “product price” and “product quality.” The subcriteria “quality system and certification,” “lead time,” “technical capability,” and “accuracy and reliability” were given higher priority weights in parallel with previous studies. 14 , 54 , 64 , 79 , 80 Furthermore, the subcriterion “lead time” has had a higher priority weight than “geographical location,” which emphasizes the significance of being on time. The other finding of the implementation of the case study having a broader perspective is that the suppliers might improve their performance scores in qualitative criteria if they put a balanced effort into not only the most important criteria, but all important criteria.
Conclusion
This study has proposed an integrated framework for supplier selection and performance evaluation, customized for apparel retailers and the apparel supply chain. DEA has been used to make the efficiency measurements, and AHP and TOPSIS have been combined to provide quantitative data from qualitative criteria. The proposed integrated framework calculates the “overall performance score” for suppliers. The application procedures and the implementation of the proposed framework have been demonstrated on a case study within the Turkish suppliers of a global apparel retailer.
A synergistic effect was obtained with the integration of the three methods since the strengths of each method were applied. The hierarchical structure of qualitative criteria and the introduction of the parameters “number of product styles” and “business volume ratio” improved the specification of the integrated framework for the apparel retailers. Thus, a contribution was made to the literature to eliminate research gaps.
Researchers might use the criteria, the hierarchical structure, and the newly introduced parameters in DEA analysis to enrich their knowledge, and retailers can adopt these parameters, criteria, and even the priority weights of the criteria for their own cases. Moreover, this framework can be approved by retailers as a decision-making tool for supplier selection and performance evaluation. In these respects, the integrated framework and the findings derived from the implementation of it present a contribution to both academic and industrial knowledge.
As a future research direction, the proposed integrated framework can be applied by apparel retailers with different characteristics to make comparisons about the priorities of the criteria. Considering that the case in concern was a global retailer that works with small-scale suppliers in emerging markets, a longitudinal study could be designed by keeping the parameters the same to see how the weights of the criteria change over time. Finally, the framework can be applied in different fields or can be extended with additional criteria and subcriteria or input and output parameters.
Footnotes
Declaration of conflicting interests
The author(s) declared no potential conflicts of interest with respect to the research, authorship, and/or publication of this article.
Funding
The author(s) received no financial support for the research, authorship, and/or publication of this article.