
Abstract
In digital printing, the fabric print quality can only be evaluated through the color and pattern of printed fabric after printing. The influence of the physical properties of fabric on the printing effect remains unclear. In this paper, the digital print suitability of cotton fabric was defined, and 14 samples of plain cotton fabrics were taken as research objects. In addition, 11 evaluation indexes of cotton fabrics were selected. The evaluation and prediction model of cotton fabric printability was established by principal component analysis. Furthermore, the prediction results of the model were verified by analyzing the colorimetric data of cotton fabric after printing. The result demonstrated that the evaluation model of printing suitability was applicable and can be used to quickly evaluate the printability of cotton fabrics. Particularly, fabric thickness had the greatest influence on printing permeability. In the case of moderate wicking, the higher the whiteness of cotton fabric, the better the color reproducibility after printing. Additionally, the wicking effect also had a great influence on color performance.
Keywords
Traditional textile printing uses rotary screen printing for mass production. However, traditional printing has some limitations such as long production process, high labor cost, large storage space, and environmental pollution. 1 , 2 In recent decades, digital printing technology for textiles has become popular, and it uses inkjet print heads to deliver an accurate volume of ink droplets onto textile substrates. 3 Compared with traditional screen printing, digital printing significantly reduces water pollution and energy consumption, and increases production flexibility and diversity, especially for small batch production and multi-color designs. 4
However, many technical limitations remain in the further development of this technology. With the change in the printing environment, including fabric substrate, ink set, print head, pre- and post-treatment, the color information transformation process is affected, causing color differences on the final prints. Considering the effects of fabric, the yarn content, yarn structure, and fabric structure would result in different color reproduction effects, even though the same ink recipe is applied. Wang et al. 5 revealed that cotton yarn with low yarn count, high fabric density, and good impermeability provided deeper color. Yang et al. 6 demonstrated that with the increase in the warp and weft roughness and porosity of the fabric, the spreading area of the ink drops increased, the K/S value of the ink drops on the fabric decreased, and the color measurement on the surface turned out lighter. Mhetre et al. 7 proposed that the quality of inkjet printing depended largely on the spreading behavior of ink droplets. Bae et al. 8 made it clearer that the fabric structure has a measurable effect on the inkjet printing effect. Briggs-Goode 9 put forward that the diffusion effect is different due to the different surface roughness of the fabric, leading to color differences of the same pattern.
Digital printing technology came from paper printing technology. In paper printing, the “printing suitability” of printing substrate material affects the quality of printed products. According to GL Rade of the United Kingdom in Wang et al., 10 the printability of paper refers to all the physical, chemical, and optical properties that the paper needs to have in order to obtain a better printing effect. Kost Carlson of Sweden in Wang et al. 10 proposes that the printability of paper indicates all the qualitative and quantitative indicators of paper that affect the final printing effect under fixed equipment. China’s paper printing industry experts in Yan et al. 11 pointed out that in the paper printing, paper, ink, printing conditions, and printing workshop environment must have the relevant properties to obtain the best printing effect. This paper defines printing suitability of digital printing, that is, the definition of paper printability. In digital printing, the fabric is used as a carrier of pattern information, and different fabric structures result in different color reproduction effects. The fabric that meets the needs of ink, printing equipment, and printing process parameters and finally obtains printed textiles that meet the print quality requirements could be considered to provide good print suitability. The printing suitability of the fabric can be revealed only after the printing is completed, that is, “it is known only after use.”
In this paper, a cotton fabric printing suitability evaluation model for color rendering properties was established through principal component analysis (PCA), and actual printing experiments for colorimetric analysis were conducted. In addition, the evaluation model of cotton fabric printing suitability was verified by exploring the suitability of cotton fabric printing and the color rendering results. How the main parameters of fabrics affect color performance was described in detail. A relationship between fabric parameters and color rendering properties was proposed and could be used for substrate recommendation by digital printing.
Experimental methods
Materials and instruments
To control the structure of the fabric, the experiment selected 14 different plain cotton fabrics (Expe Textile Inc., Nanjing, China) as the research object, numbered #1, #2, #3, …, #13, #14. These fabrics are not pre-treated.
See Table 1 for the experimental equipment.
Main test instruments and equipment

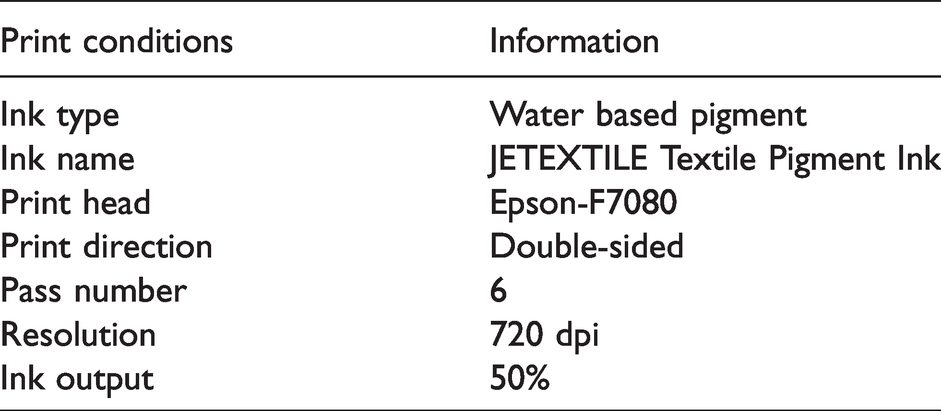
Table 2 shows the printing conditions.
Digital printing process conditions
Photoshop CC 2019 was used to make a single-channel printing machine to print the color block design and the printer was equipped with UltraPrint RIP software for control; SPSS 24 was used to analyze the experimental data.
Experimental procedure
PCA
A research object is often a complex system with multiple factors. Too many variables will increase the difficulty and complexity of the analysis. When information overlap and correlation between variables appear, PCA uses the correlation between the original variables, uses fewer new variables to replace the original variables, and makes these few variables retain the original variables as much as possible. It is a dimension reduction in processing technology. However, the meaning of the new variable (principal component) is generally fuzzy, and not as exact as the original variable. This is the cost of the process of variable dimension reduction. Therefore, the number of extracted principal components is usually significantly less than the number of original variables. 12
Selection of evaluation indexes for digital cotton fabric printing
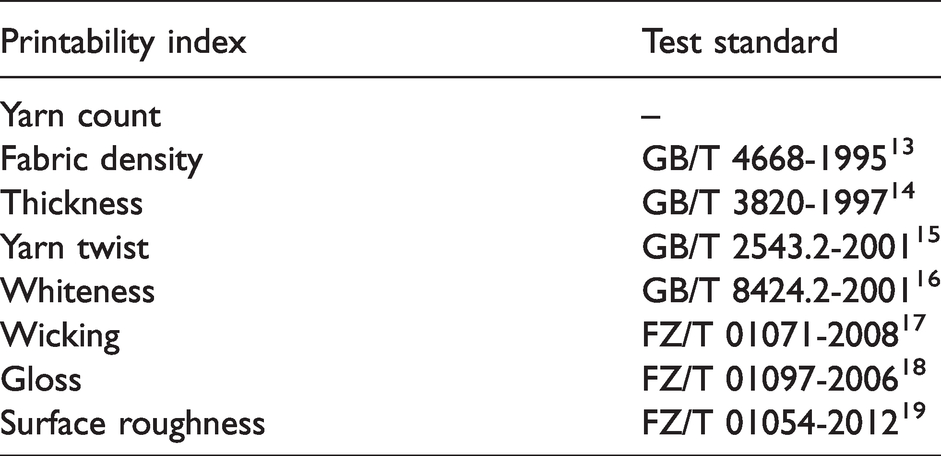
Eleven printability indexes of cotton fabrics were tested and used as evaluation indexes in this experiment as follows: yarn count, warp and weft density, thickness, yarn twist, whiteness, warp and weft capillary effect, gloss, and warp and weft surface roughness. Table 3 presents the test standards used.
Test standards for printability index of fabrics
Fabric printing and color rendering performance test
A single-channel solid color was printed by HJ-RCT8460 digital direct printing machine. The four-color ink-set included cyan (C), magenta (M), yellow (Y), and black (K).
An ironing machine was used to flatten the fabric before printing, with hot pressing temperature of 165°C (330°F) and duration of 120 s. After printing, the thermosetting temperature was 165°C (330°F) and the duration was 120 s. The printed color pattern is illustrated in Figure 1.

Cyan-magenta-yellow-black single-channel solid color.
After completing printing, the Datacolor850 spectrometer was used for color measurement. The color measuring aperture was 30 mm, D 65 was 10°, and ultraviolet filter was excluded. The instrument was calibrated. Each sample was measured three times and then averaged. The K/S values of the printed color area and the white cloth before printing were measured using a Datacolor850 spectrometer, and the printing permeability was calculated as follows
20

The test standard is GB/T 8424.1-2001. 21
Results and discussion
Analysis of test results of evaluation indexes of fabric printing suitability
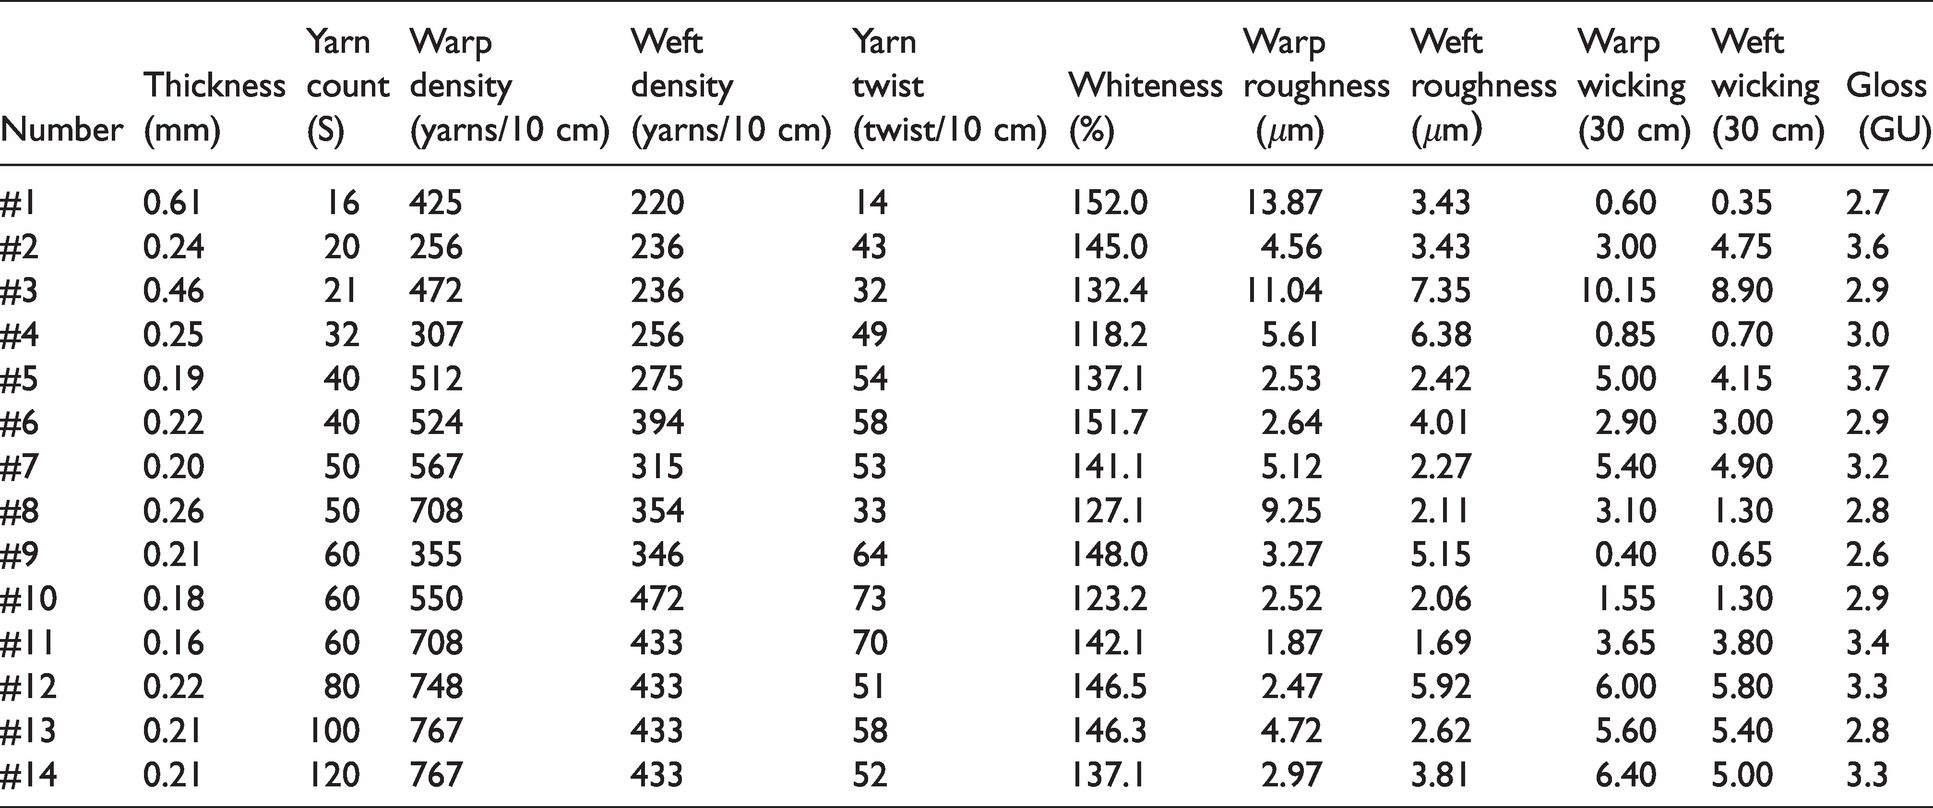
According to the indexes and test standards used by the experiment, the test results are shown in Table 4.
Evaluation indexes of cotton fabric printing suitability
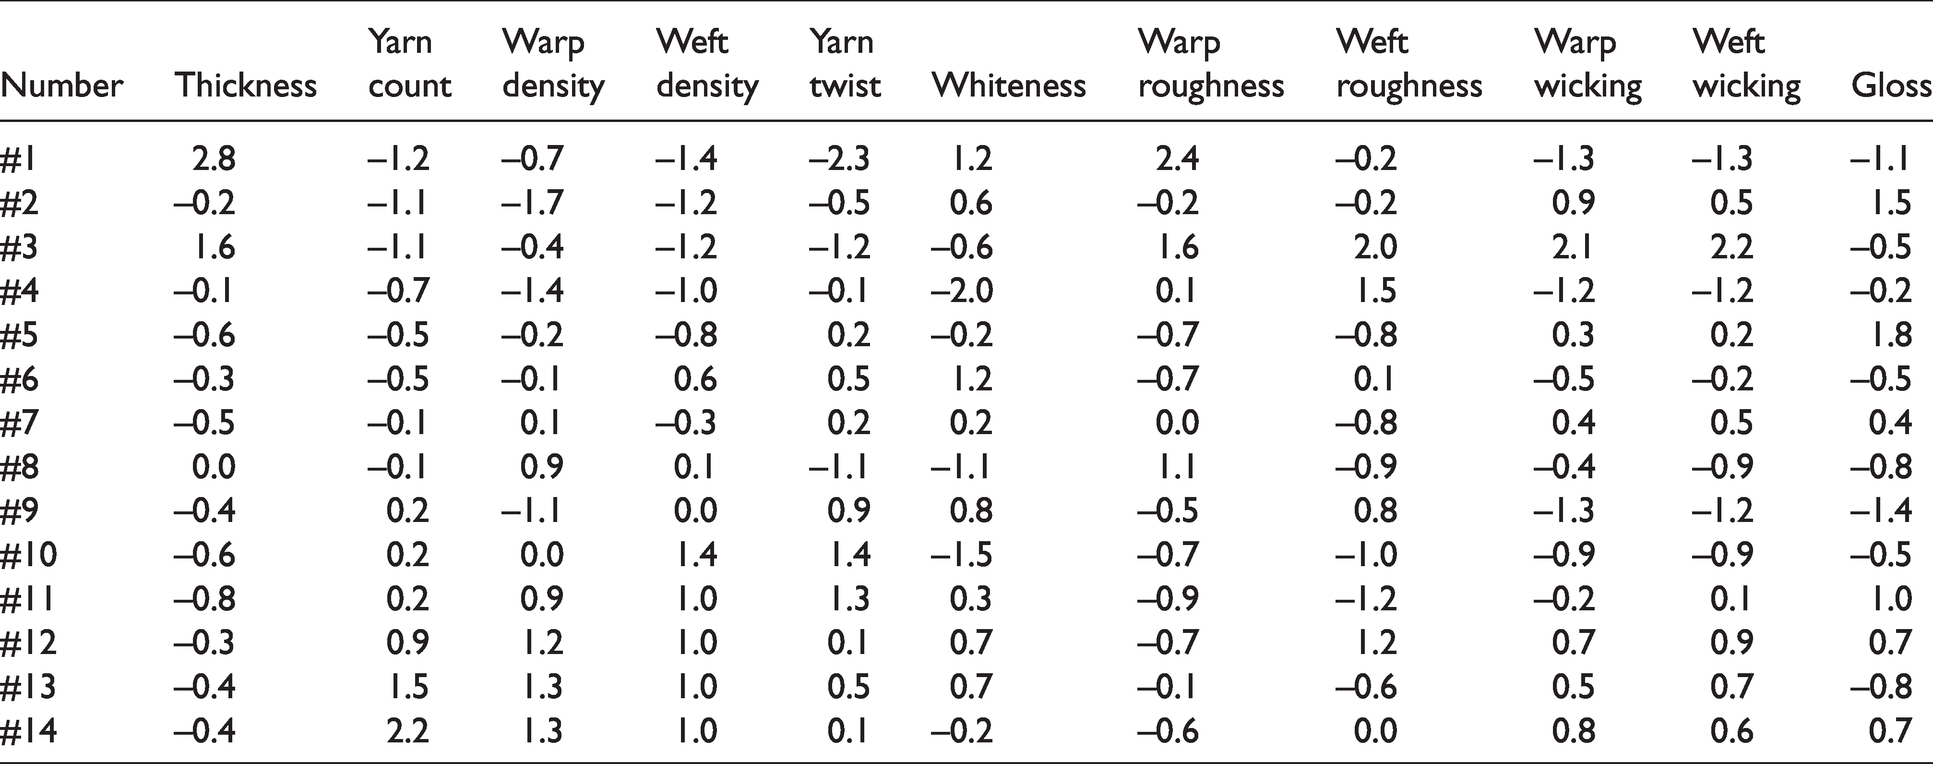
In SPSS software, the PCA algorithm was executed on the evaluation index of cotton fabric printing suitability. In addition, the data in Table 4 were standardized to eliminate the influence of different dimensions. The operation results are presented in Table 5.
Standardized data for evaluation indexes of cotton fabric printing suitability
The correlation coefficient matrix is shown in Table 6.
Correlation matrix of the evaluation indexes
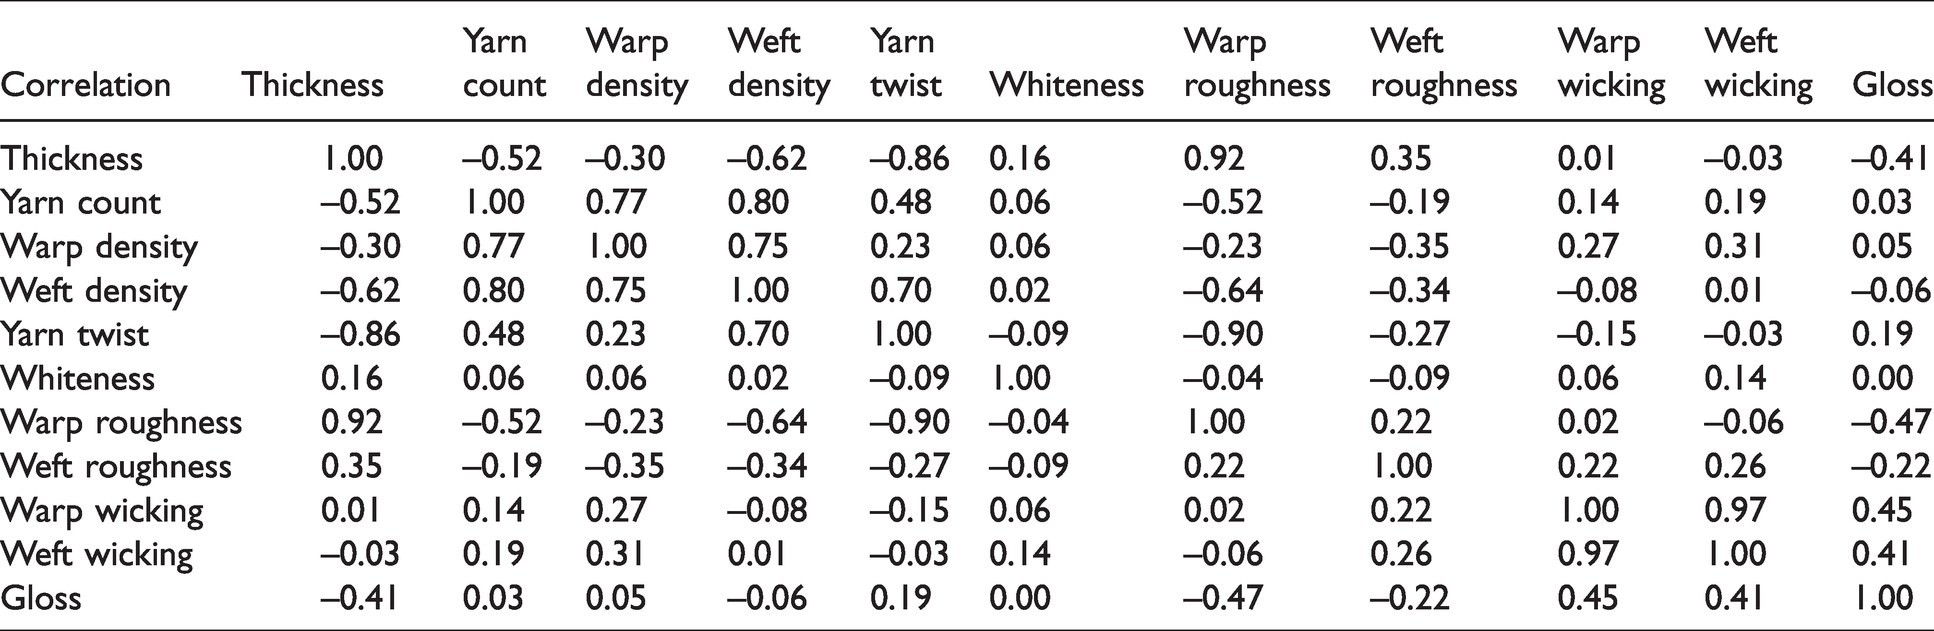
It can be observed from Table 6 that some indexes have correlation coefficients over 0.7, and there is a clear correlation, indicating overlapping information; some indexes have correlation coefficients below 0.6, indicating weak correlation. PCA could eliminate the correlation between the evaluation indexes and reflect the performance of cotton fabrics in unrelated principal components. 12
The eigenvalue, eigenvector, contribution rate, and cumulative contribution rate of the correlation coefficient matrix were calculated and are listed in Table 7.
Variance decomposition principal component extraction
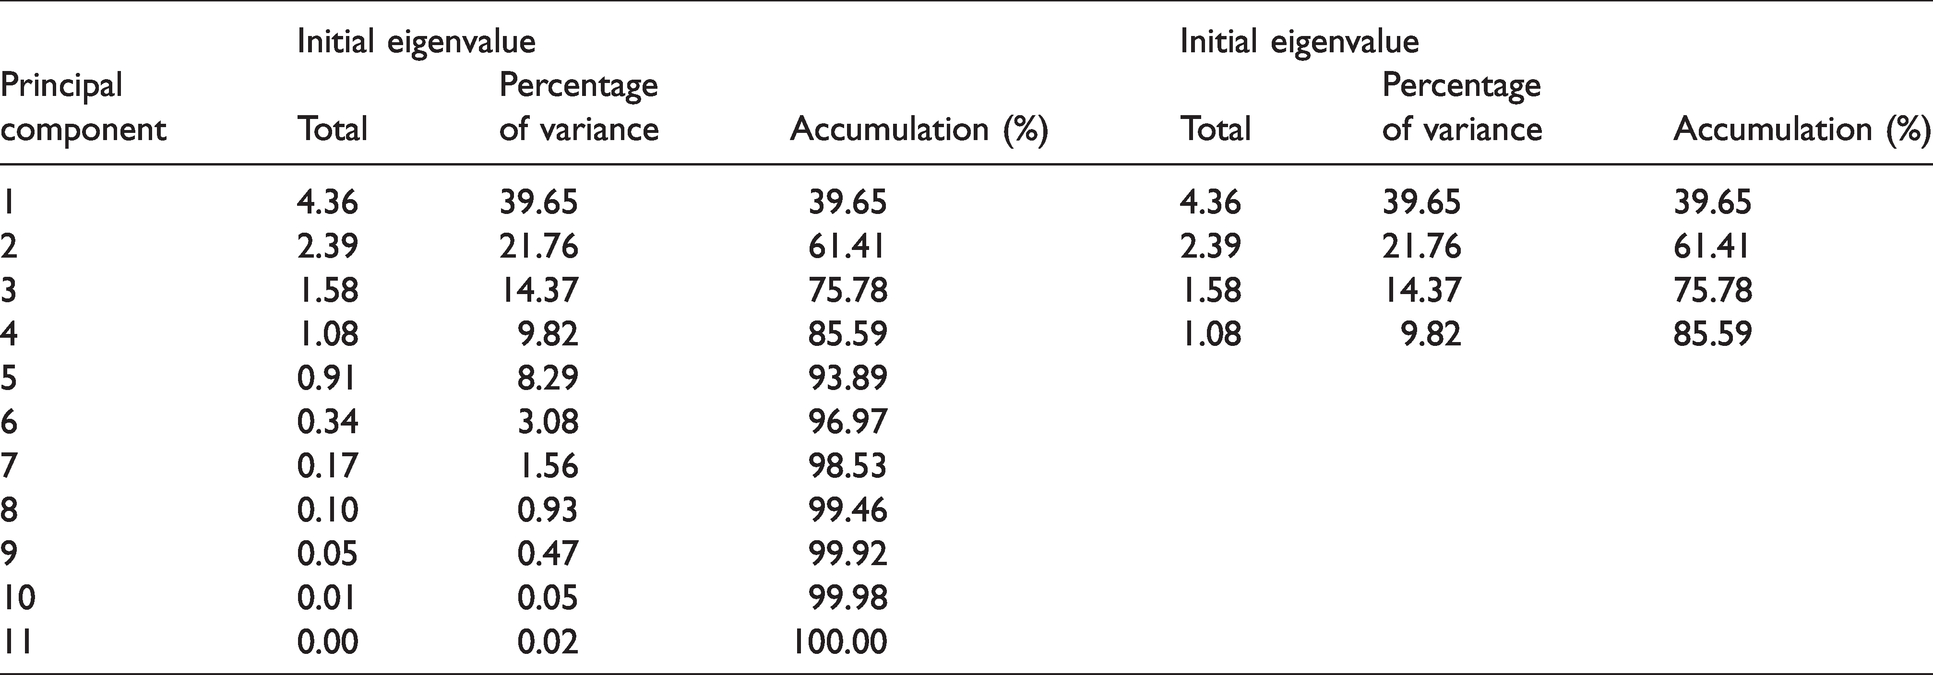
The principal component interprets the total variance of the original variables in Table 7. Specifically, four principal components are retained for the physical properties of the fabric. The interpretation rate of the total variance of the original variables is also called the cumulative contribution rate. According to the selection criteria of principal components, the principal components with a cumulative contribution rate of more than 85% are usually extracted. 12 Thus, it was appropriate to extract four principal components because the cumulative contribution rate of these four principal components reached 85.59%.
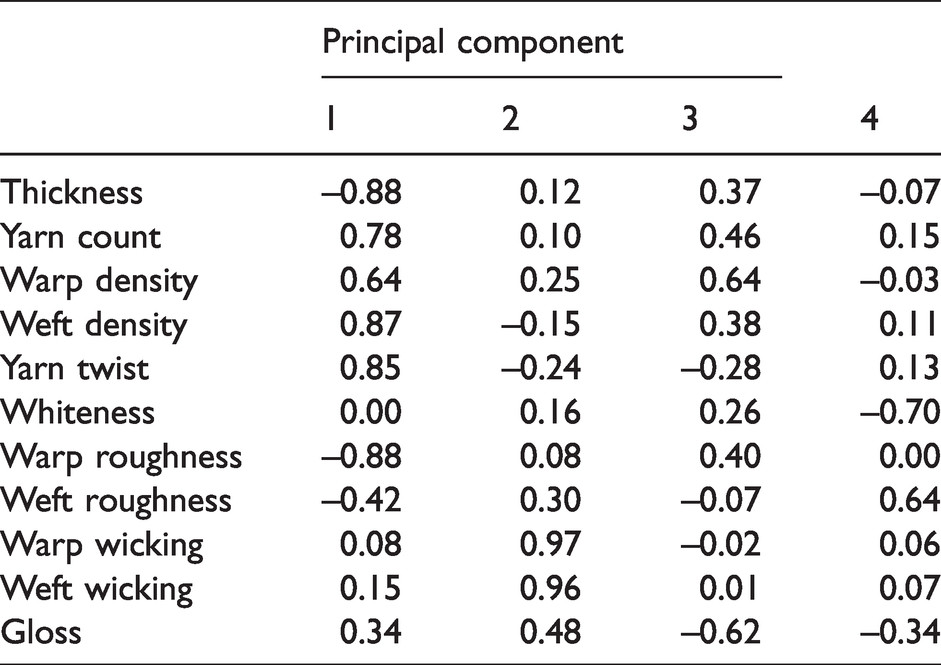
As illustrated in Table 8, the thickness, yarn count, warp density, weft density, yarn twist, and warp roughness have a higher load on the first principal component, indicating that the first principal component basically reflects the information of these indexes. 22 Wicking has a higher load on the second principal component. The gloss has a higher load on the third principal component. Whiteness and weft roughness have a higher load on the fourth principal component. Eleven physical properties are reflected. Thus, the four principal components extracted can basically reflect all indexes, and it was decided to replace the original 11 variables with four new variables. 22
Component matrix
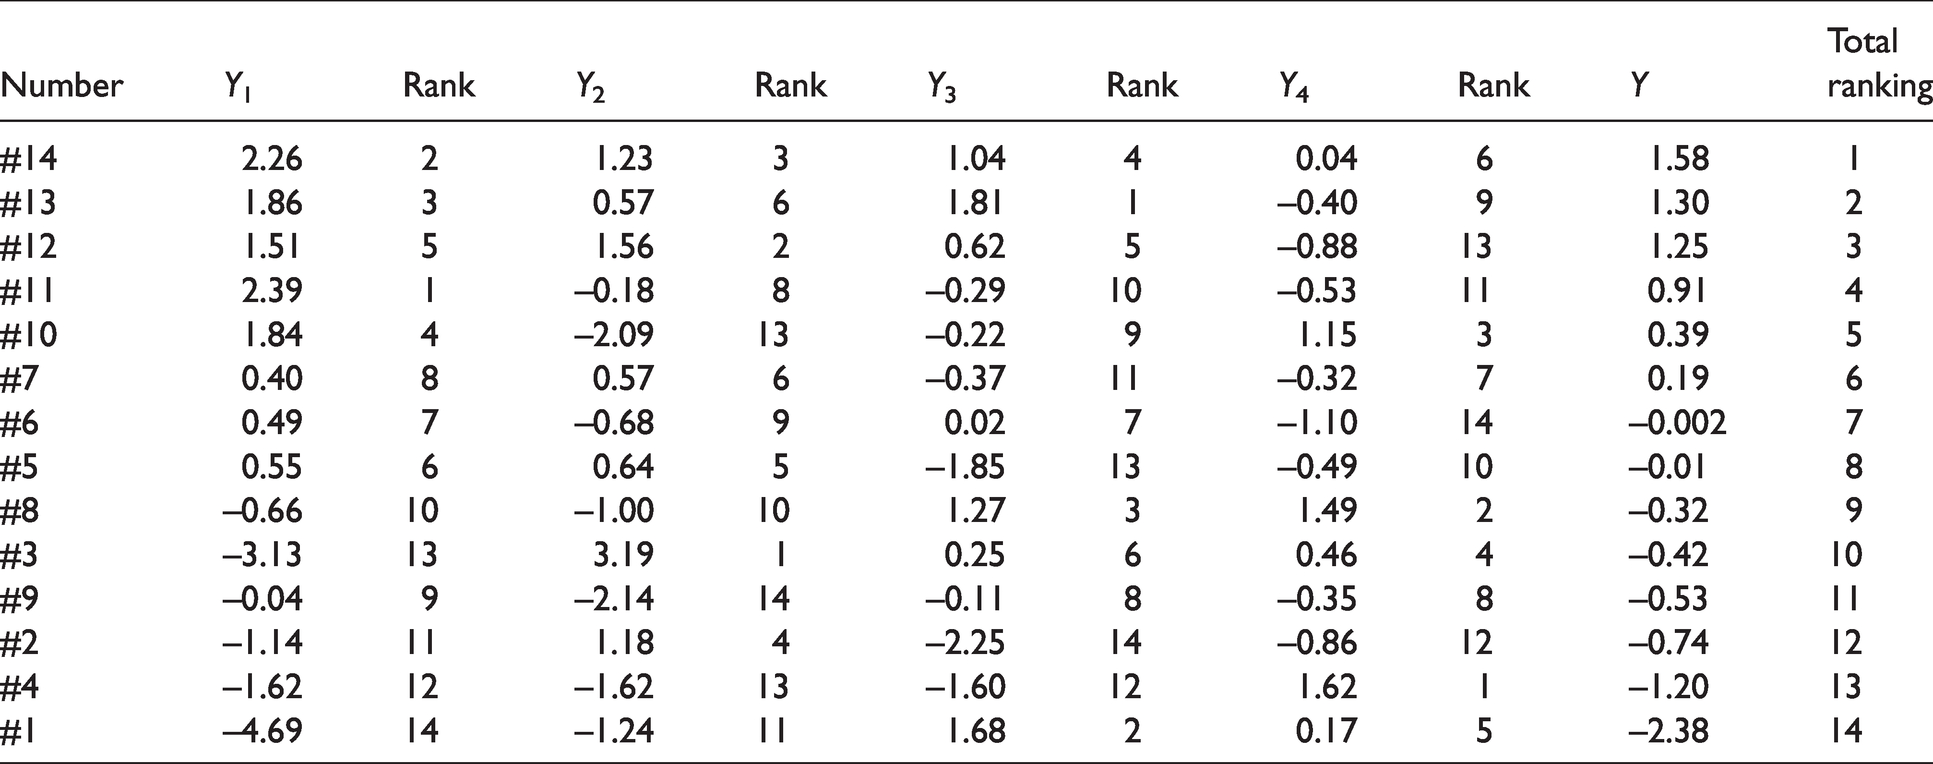
The principal component coefficients are calculated to acquire each principal component expression. Taking these 11 indexes as independent variables and multiplying their respective weights, a comprehensive expression for evaluating the suitability of cotton fabric printing is obtained. The expressions of the principal components are as follows

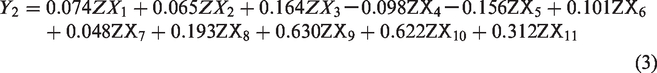
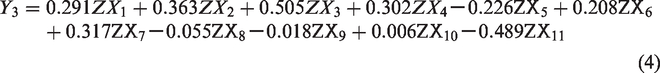
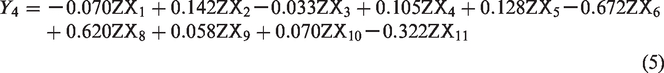
Y1, Y2, Y3 and Y4 represent four principal components, each of which contains different variables: Y1 contains the thickness, yarn count, warp density, weft density, yarn twist, and warp roughness; and Y2 contains wicking. In order to get the comprehensive score, it is necessary to calculate Y by the variance ratio of each principal component. However, a single principal component cannot represent all the variables. Only by obtaining Y can we comprehensively evaluate the printability of cotton fabric. Y value is related to 11 independent variables, which represents the printability of cotton fabric.
X1, X2, …, X11 indicate the number of the thickness, yarn count, warp density, …, gloss, respectively.
ZXj denotes standardized data of the thickness, yarn count, warp density, …, gloss, j=1, 2, …, 11.
Y represents the comprehensive value of cotton fabric printing suitability.
Comprehensive score and ranking
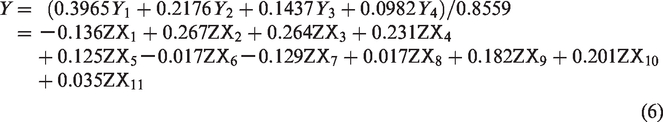
The comprehensive score of the main component is used to calculate equations (2) to (6). The results are provided in Table 9. From the comprehensive evaluation results of the suitability of fabric printing, the rankings of #10, #11, #12, #13, and #14 are at the top, which are consistent with their comprehensive rankings on the first and second principal components. Therefore, the comprehensive evaluation model of fabric quality can better reflect each principal component. The comprehensive model obtained by PCA can be employed to quickly evaluate the suitability of fabric printing.
Main composition and comprehensive ranking of each cotton fabric
Verification of the comprehensive model of fabric printing suitability
In this part, actual printing experiments were conducted on the 14 fabrics to obtain experimental color data, verify the accuracy of the comprehensive model of fabric printing suitability, and clarify the printing suitability of cotton fabrics and the color rendering rules of printing. Three printed fabric pictures are presented in Figure 2.
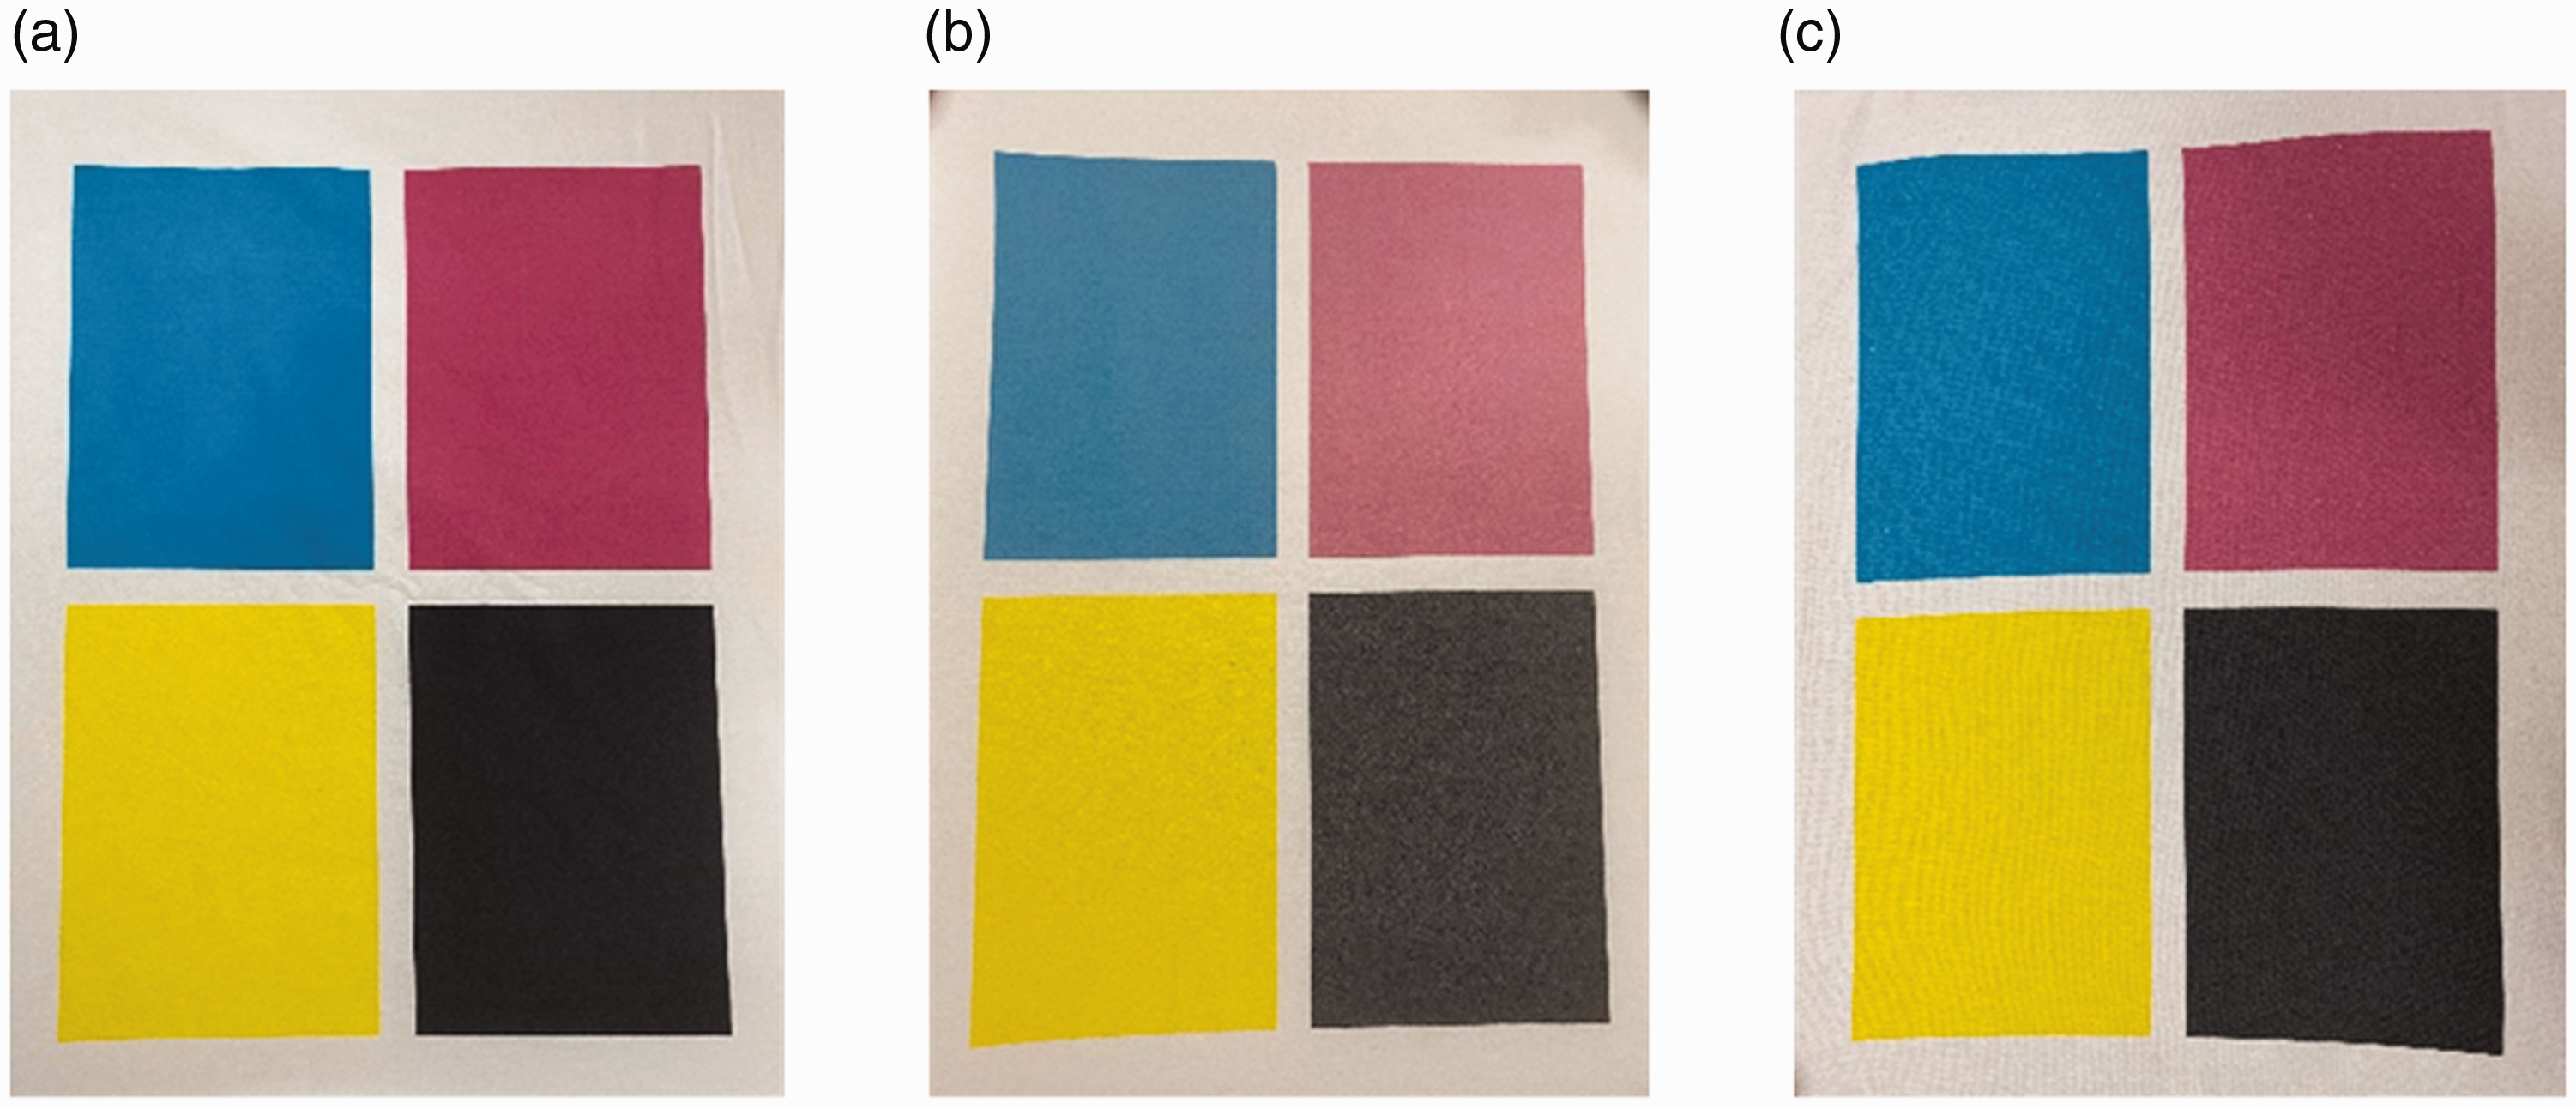
Three physical pictures of printed fabrics: (a) #1 fabric; (b) #14 fabric; (c) #10 fabric.
In this paper, the printing color rendering performance indicators were divided into CIE a*, CIE b*, CIE C*, CIE L*, K/S value, and printing permeability, to measure the suitability of fabric printing from the perspective of color representation.
According to the indexes and test standards determined by the experiment, the test results and analysis of the color rendering properties of the fabrics are exhibited in Tables 10 to 14.
Color data of inkjet printing color block (magenta)
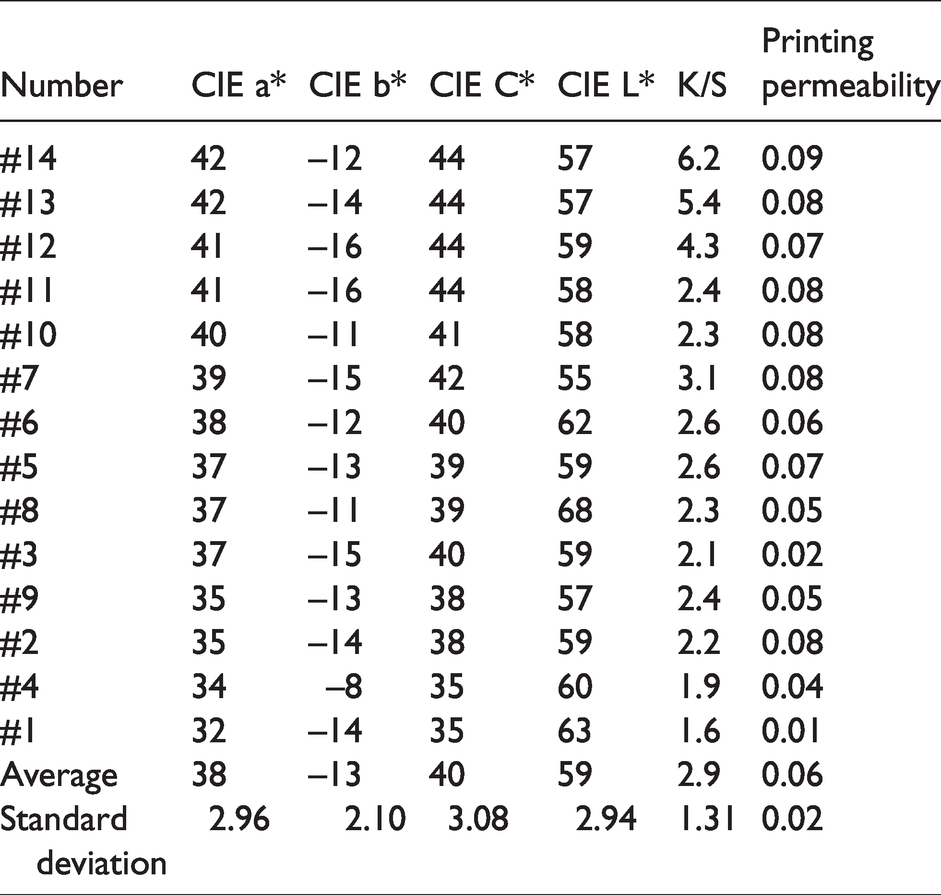
When printing magenta, with the increase in the fabric printing suitability, the colorimetric value of CIE a* of the 14 fabrics increases, and the red shade in the color increases. The average value of CIE a* is 38, and the standard deviation is 2.96, increasing from 32 in #1 fabric to 42 in #14 fabric. The red component in the color gradually increases. The value of CIE b* is negative, indicating that the magenta printed on the fabric contains a small amount of green. 23 CIE C* represents the color chroma, suggesting that the color chroma increases as the fabric’s printing suitability increases. The lowest chromas are #4 fabric and #1 fabric (35), and the highest chroma is #11 to #14 fabrics (44). The magenta brightness of the 14 fabrics is represented by CIE L*, and the standard deviation of the CIE L* is 2.94. The average value is 59, and the brightness of #7, #9, #13, and #14 are low. The brightness is mainly determined by the level of the object reflectivity, demonstrating that the fabric gloss and whiteness have a greater impact on the printing brightness. 24 Because the whiteness and gloss of these four fabrics are low, the gloss and whiteness of the fabric significantly affect the brightness of the printing. The average value of K/S of the 14 fabrics is 2.9. According to the calculation formula of K/S value, the decrease of the reflectance would cause the apparent color of the fabric to become darker; 24 specifically, the smaller the thickness of the fabric, the higher the wicking. The ink droplets under the action of the capillary tube and hydrogen bond, and they easily permeate into the fabric through the pores of the fiber. Consequently, more pigments are fixed on the fabric. 25 Additionally, the absorption rate of #13 and #14 fabrics to light increases, and the degree of reflection of light decreases. Therefore, the magenta of the two fabrics is the deepest. In addition, the permeability of the magenta printing of the 14 fabrics was also calculated. The fluctuation of the permeability is small; the lowest permeability is #1 fabric, and the highest is #14. The thickness of #1 fabric is the largest compared with the other fabrics, indicating that the thickness has a greater influence on the printing permeability, and wicking also has a certain effect on the permeability of printing. The wicking of textiles mainly manifests in the absorption capacity and uniformity of ink regarding wicking. The amount of ink droplets is conducted more through yarns and fibers. The impermeability is weakened, and the fabric printing penetration rate also becomes larger. 26
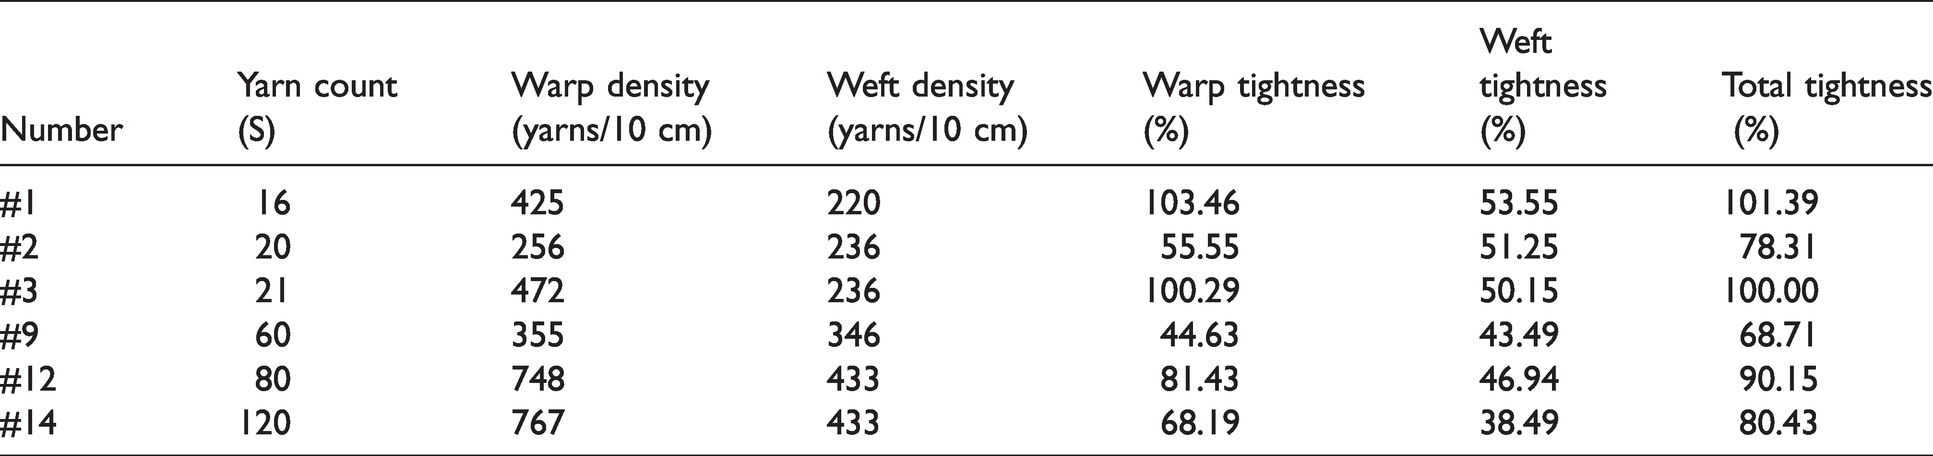
Six typical fabrics were selected and photographed under 50× magnification (see Figure 3); the fabric tightness (warp tightness, weft tightness, and total tightness) of the six fabrics was then calculated (see Table 11).
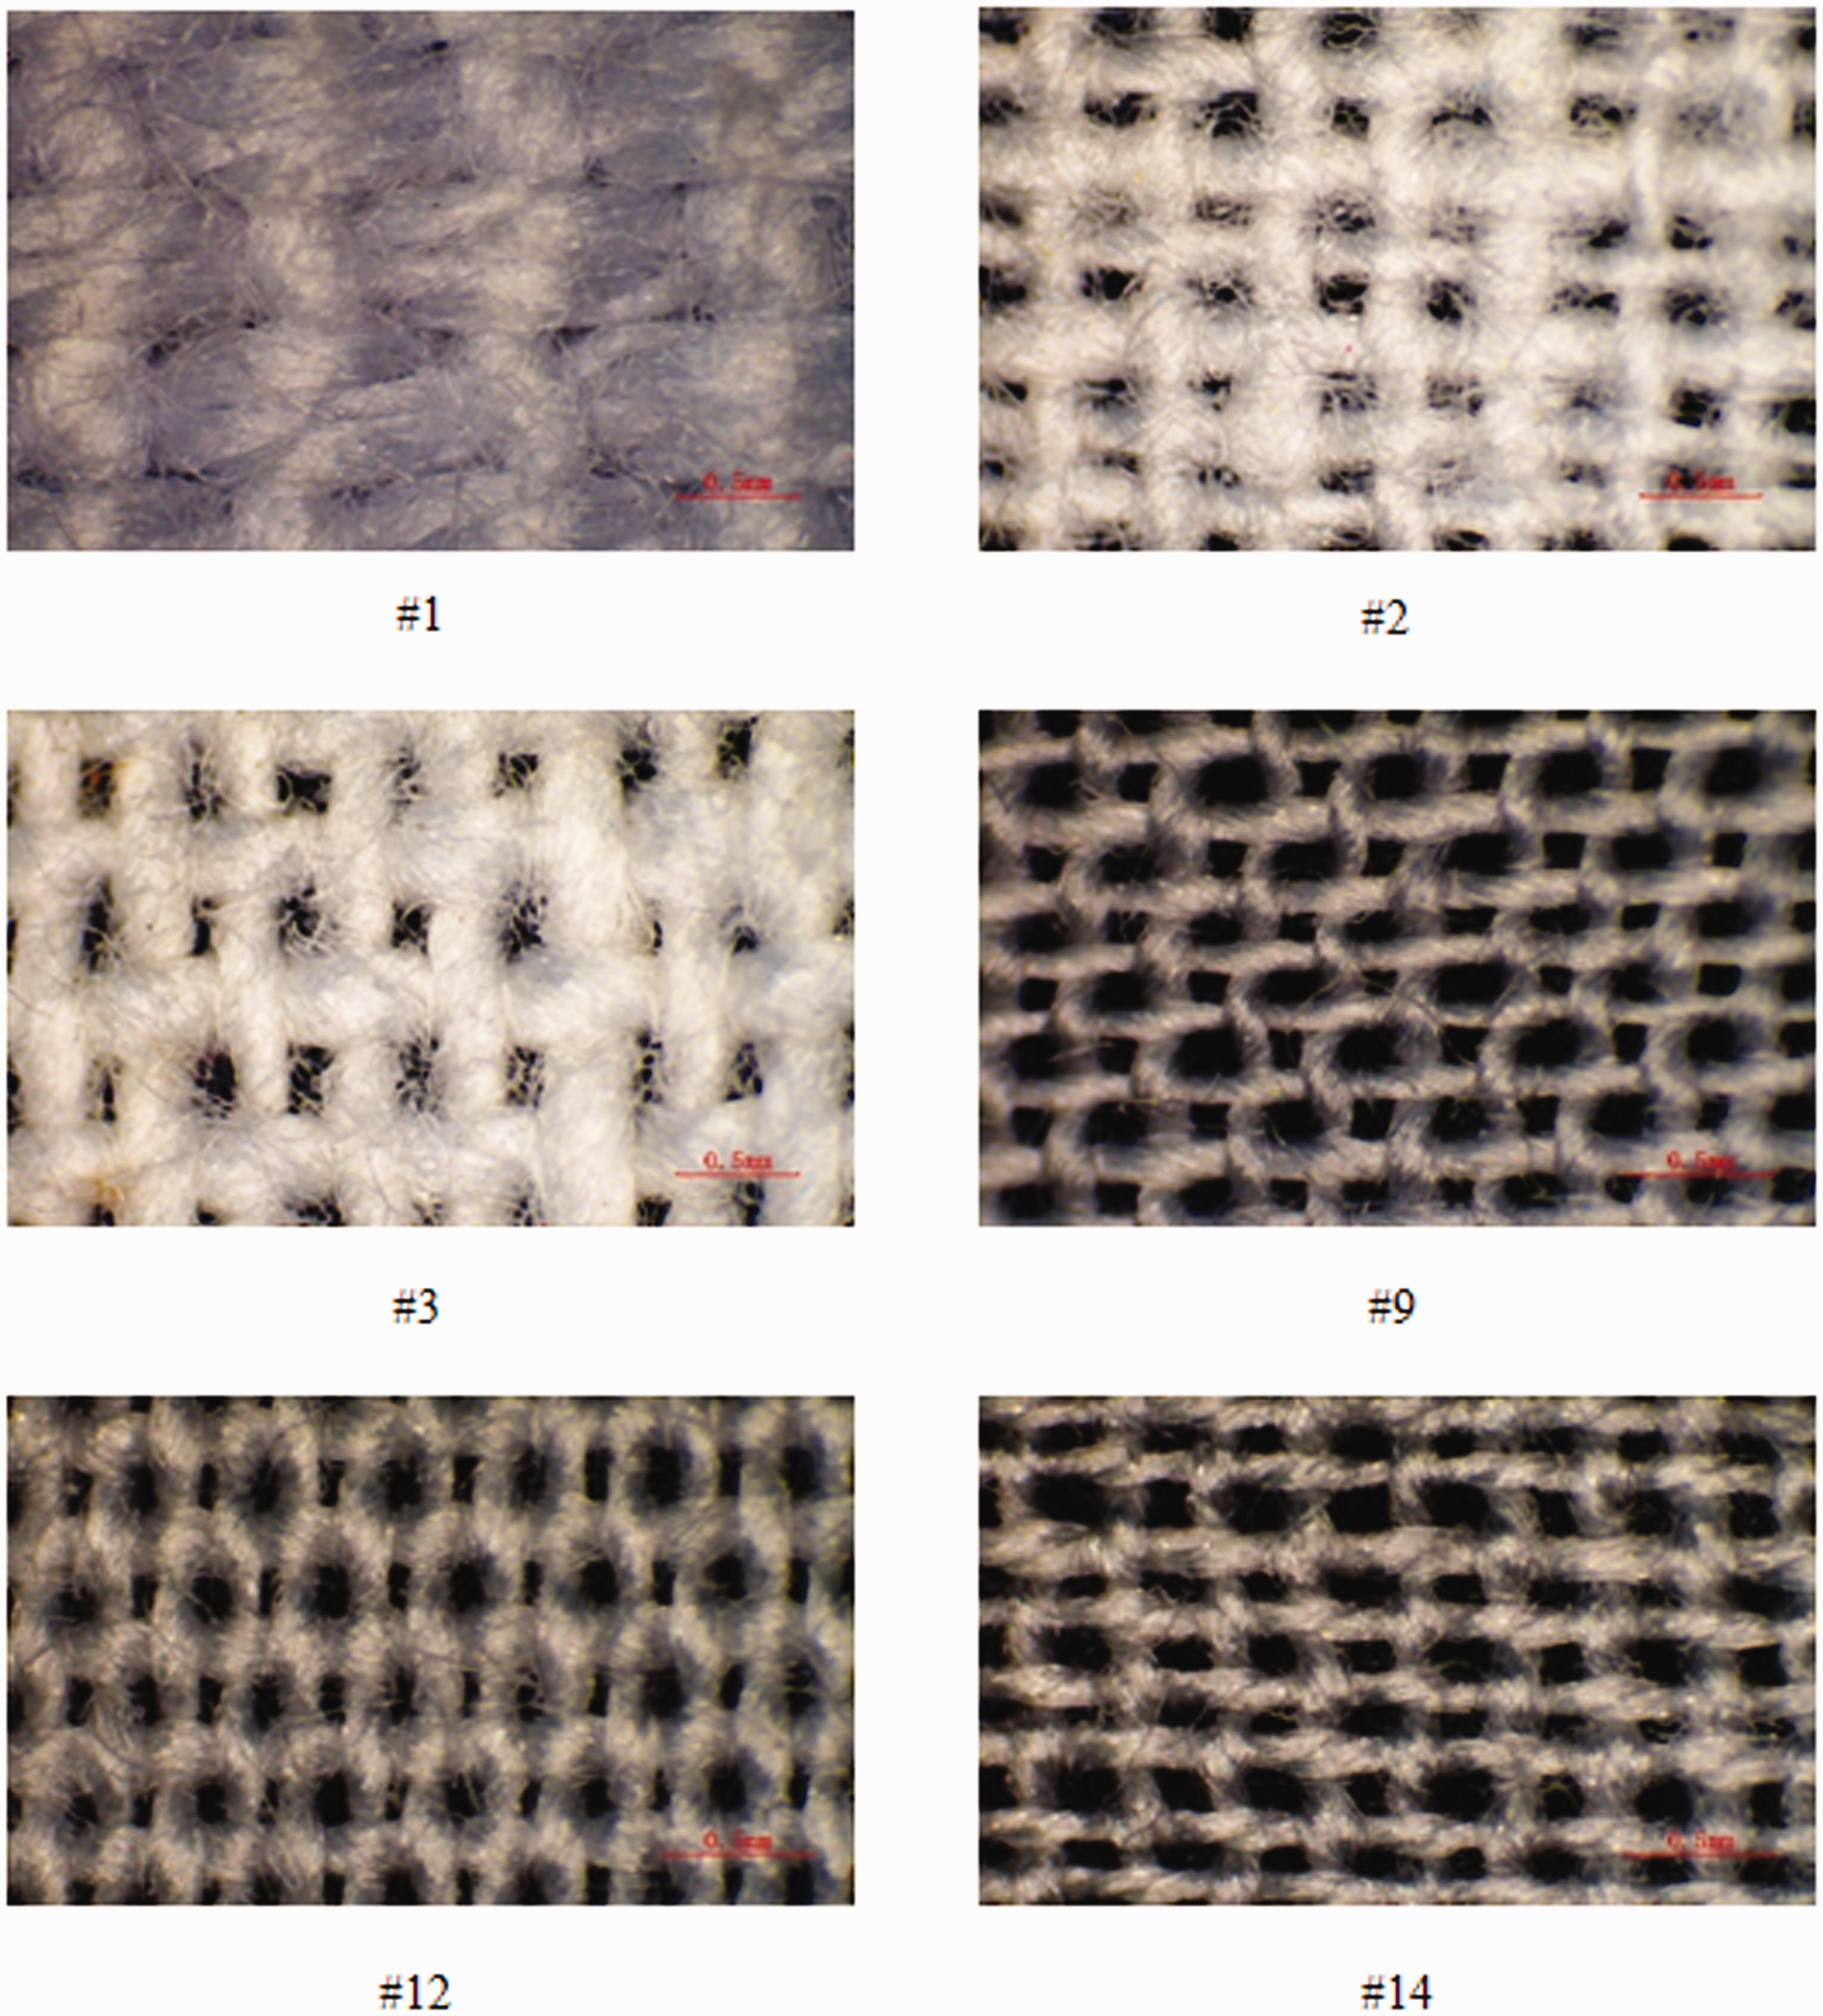
Observation picture of six pieces of fabric under 50× magnification.
Fabric specification parameter table
Color data of inkjet printing color block (cyan)
Color data of inkjet printing color block (yellow)
Color data of inkjet printing color block (black)
From Table 10, #11, #12, #13, and #14 fabrics perform the best in terms of chroma, consistent with the results predicted by the comprehensive model of fabric printing suitability. The characteristics of these fabrics include moderate fabric tightness, moderate wicking, good surface roughness, and whiteness. From Table 11, compared with the #3 fabric, #3 has great fabric tightness, large surface roughness (warp roughness: 11.04 μm, weft roughness: 7.35 μm) and a small gap between the fibers of the fabric (see Figure 3, #3). It is difficult for ink to flow along with the gaps between fibers, resulting in poorer color development compared with the other fabrics. 6 As illustrated, the tightness of #2 fabric is low (see Figure 3, #2), and the phenomenon of ink droplet diffusion is severe. Therefore, moderate wicking and moderate fabric tightness of the fabric can promote the color development of printing. In addition, #1, #4, and #9 fabrics are ranked lower in print suitability. This is because these three fabrics have the worst wicking, the tightness of #1 fabric is too large, and the progress of #9 fabric is too small, affecting the diffusion of ink droplets. Among them, #4 fabric has the lowest whiteness; the superposition of fabric background color and ink color has a greater impact on color rendering.
Among the 14 fabrics, #1 fabric has the smallest printing penetration rate and the lowest printability. As illustrated in Table 4, #1 fabric has a lower yarn count (16S), the lowest wicking (warp wicking: 0.60 cm, weft wicking: 0.35 cm), and closely arranged yarns and small fabric porosity (see Figure 3, #1). Therefore, it is difficult for the ink to penetrate the surface of the fabric. Besides, #3 fabric has low permeability and the highest wicking, as well as a better ink penetration performance; however, the thickness of #3 fabric is lower than that of #1 fabric due to the lower yarn count (21S), improving the printing penetration rate and printing suitability. Similarly, when the fabric wicking level is similar and the warp and weft density are close, as the thickness of #1 and #9 fabrics decreases, the printing permeability and printing suitability are improved.
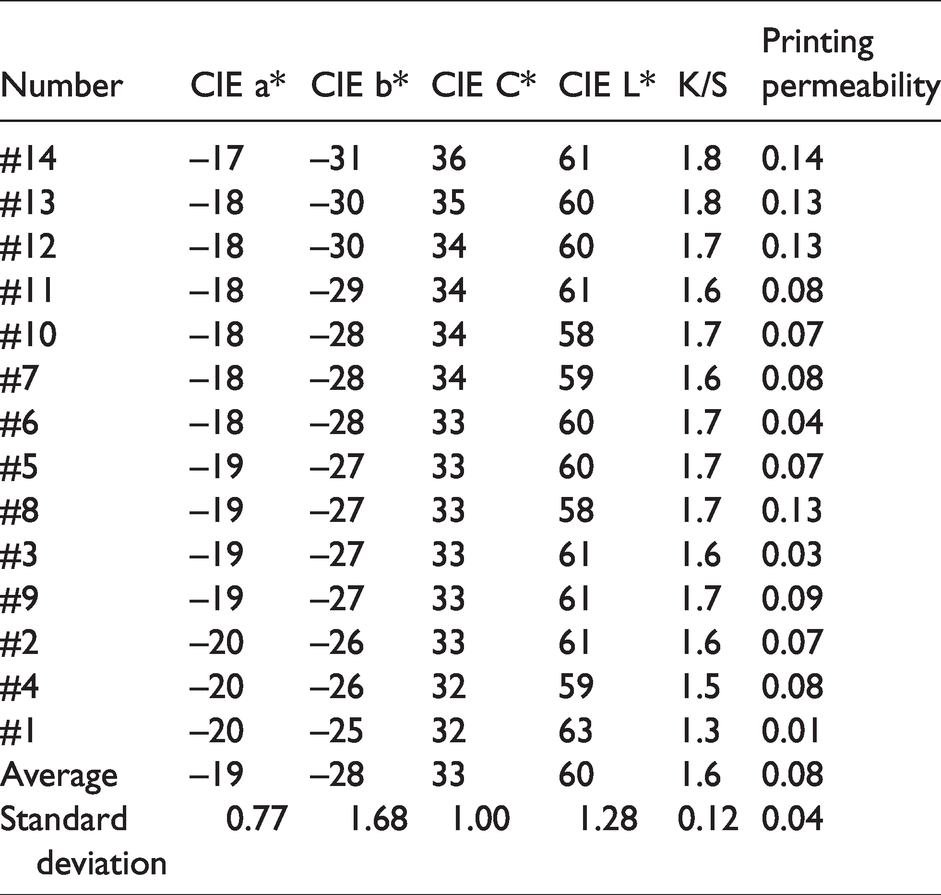
When printing cyan, the value of CIE a* of the 14 fabrics increases with the increasing printing suitability of the fabric; meanwhile, the green component in the color decreases. The value of CIE b* is negative and decreases as the printing suitability of the fabric increases, indicating that the blue component of the cyan printed on the fabric increases. 23 The average value is –28 and the standard deviation is 1.68, indicating that the cyan displayed by the fabric has a certain fluctuation, greater than the value of CIE a*. The specific performance of the blue light on the fabric surface is enhanced with the increase in the printing suitability of the fabric, and the cyan reproducibility is enhanced simultaneously. In addition, the CIE C* increases with the increase in the printing suitability of the fabric. The lowest chromas are #1 fabric and #4 fabric (32), and the highest is #14 fabric (36). The chroma gradually increases. The average value of the CIE L* is 60 for the 14 fabrics. The brightness of #4, #8, and #10 fabrics is low. These three fabrics have low whiteness and gloss. The average value of K/S of the 14 fabrics is 1.6, and the cyan color of #13 and #14 fabrics is the darkest. Moreover, the printing permeability of the fabric is 0.08 on average; the standard deviation is 0.04; the fluctuation of the penetration rate is small; the penetration rate of #1 fabric is the lowest; #14 fabric has the highest permeability; #1 fabric has the largest thickness and the smallest wicking; #14 fabric has the smallest thickness and a good wicking effect; thus, the thickness and wicking have a greater impact on the printing permeability.
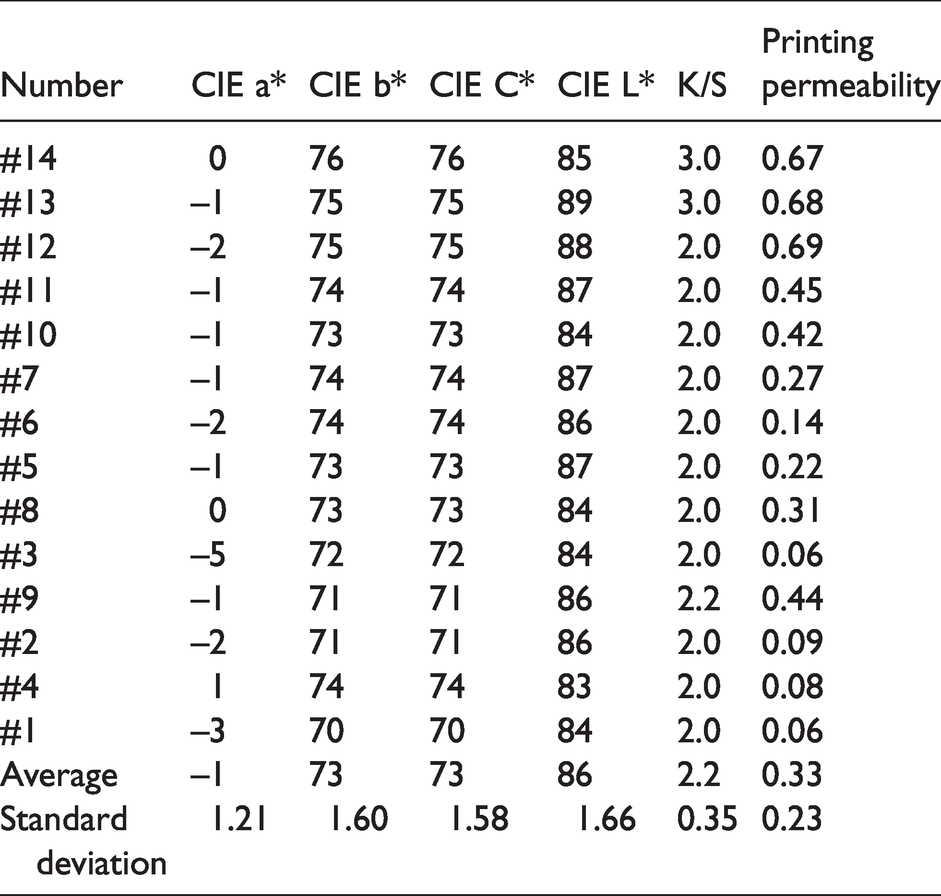
When printing yellow, the average value of CIE a* is –1, the standard deviation is 1.21, the red light in the yellow printing of the 14 fabrics is basically the same, and all tend to 0. As the value of CIE b* increases, the yellow tone increases, from 70 in #1 fabric to 76 in #14 fabric, with a standard deviation of 1.60, indicating that the color development difference of each fabric is small when printing yellow. The CIE C* increases with the increase in the printing suitability of the fabric. The lowest chroma is #1 fabric (70), and the highest is #14 fabric (76). CIE C* standard deviation is 1.58, and the average is 73, indicating that in the yellow area, there is a certain gap between the color chroma after printing in the evaluation of the poorly printed fabrics and better fabrics. The yellow ink used in this experiment can achieve high chroma yellow on fabrics with high printing suitability whereas the chroma of magenta and cyan on the same fabric is relatively significantly reduced. The standard deviation of the yellow lightness CIE L* value of the 14 fabrics is 1.66, and the fluctuation of the brightness of the yellow on each fabric surface is small among them; the lightness of #12 and #13 fabrics is relatively high, and the lightness of #4 fabric is the lowest. The same reason verifies that the gloss and whiteness of the fabrics have a greater impact on the printing brightness. The K/S standard deviation of the 14 fabrics is 0.35. The average value is 2.2. The deepest yellow appears in #13 fabric and #14 fabric. As the printing suitability of the fabric increases, the apparent yellow of the fabric deepens. When printing yellow, the average printing permeability of the fabric is 0.33, and the standard deviation is 0.23; the penetration rate of yellow ink on the fabrics is higher than that of cyan and magenta. The difference in the printing permeability between #1 fabric and #14 fabric is large. In the same way, it is demonstrated that thickness and wicking have a greater impact on printing penetration.
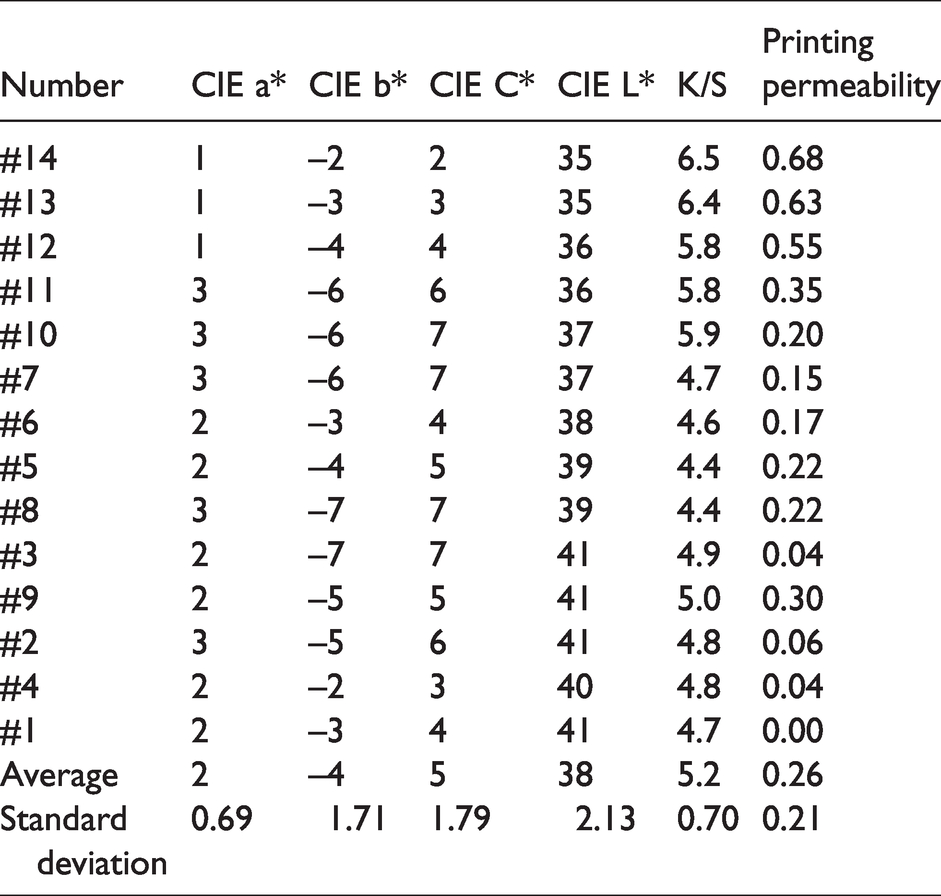
Theoretically, when printing pure black, the value of CIE a* and CIE b* should tend to zero. 24 It can be observed from Table 14 that the average value of the CIE a* is 2, the standard deviation is 0.69, the average value of the CIE b* is –4, and the standard deviation of the CIE b* value is 1.71. The black ink used in this experiment appears slightly red and blue. The standard deviation of the CIE C* is 1.79. The chroma of each fabric is basically the same when printing black. Besides, black is achromatic. The closer the value of CIE C* is to 0, the purer the color is. 27 Additionally, from the value of CIE L* data in the table, the lightness decreases with the increase in the suitability of the fabric printing, demonstrating the darker color. The standard deviation of the CIE L* is 2.13, from 41 for #1, #2, #3 and #9 fabrics to 35 for #13 and #14 fabrics, indicating that the brightness of each fabric is different when printing black, and the printed black is closer to the ideal black. The average K/S of the 14 fabrics is 5.2, and the darkest black appears in #13 fabric and #14 fabric with the increase in the suitability of fabric printing. The penetration rate of #12, #13, and #14 fabrics is the highest, exceeding 50%, and the color penetration can be clearly observed from the back of the fabric.
Conclusions and future works
The evaluation indexes of cotton fabric printability were analyzed by SPSS. Considering that the principal component can reflect more than 85% of the original variables, the number of principal components was 4; the contribution rates were 39.65%, 21.76%, 14.37%, and 9.82%, respectively; the cumulative contribution rate was 85.59%. The four principal components selected can basically reflect the original index information. In addition, the principal component expression and comprehensive expression of cotton fabric printability were obtained through further calculation. Through the test of the printing effect of cotton fabric, the color data after printing was obtained, consistent with the evaluation result of the comprehensive evaluation model of cotton fabric printing suitability. Therefore, the comprehensive evaluation model of cotton fabric printability can be used to predict the quality after printing, providing convenience for rapid prediction of printing color and creating certain practical significance. It can be revealed from the color rendering of #1, #4, and #9 fabrics that wicking has a greater impact on the color development of fabrics. Wicking directly affects the penetration of ink. As indicated in #1, #3, #11, and #14 fabrics, the thickness has the greatest influence on the permeability of fabric printing. In addition, #3 fabric has too strong a wicking effect, too large a surface roughness, and the severe phenomenon of ink droplet diffusion, generating a great impact on the color development. Furthermore, the whiteness of #4 fabric also has a great influence on the color rendering of the printing. If the whiteness is low, the color cast phenomenon will occur. The coloring method of pigment digital printing is to attach pigment particles on the surface of the fiber. The application of pre-treatment could improve the color rendering properties by reducing the ink bleeding, enhancing the binding between fibers and pigment particles. This is the first part of a whole research project. First, how the fabric properties influence the ink absorbing behavior and color rendering properties was investigated. Then, 14 cotton fabrics without using pre-treatment were selected. Next, the analysis was conducted from the perspective of the physical structure of the fabric and the color rendering. Afterward, the effect of pre-treatment on the permeability of the fabric was explored, providing a clearer mechanism of how the pre-treatment helps to improve color rendering properties.
Footnotes
Declaration of conflicting interests
The authors declared no potential conflicts of interest with respect to the research, authorship, and/or publication of this article.
Funding
The authors disclosed receipt of the following financial support for the research, authorship, and/or publication of this article: This work was supported by the National Natural Science Foundation of China (Grant Number 11804049) and the Fundamental Research Funds for the Central Universities (Grant Number 2232019D3-14).