



Abstract
Its extraordinary chemical and physical properties have made silk one of the most versatile and comfortable fiber fabrics for a multiplicity of customers and industrial applications. However, this development has led to fraud and adulteration attempts for a multitude of consumer goods. In these respects, the potential and increasing affordability of handheld near-infrared (NIR) spectrometers makes them an attractive tool for customers to fight these evils efficiently. In this work, the rapid quantitative analysis of the purity level of silk adulterated with cotton by four different handheld NIR instruments, the NeoSpectra Scanner, Viavi MicroNIR 1700, Spectral Engines NR 2.0-W, and SenoCorder Solid, and their detection performances were compared with a benchtop NIR instrument (Thermo Antaris II). With these instruments, samples with 0–100% (w/w) cotton content were measured, spectral pretreatment methods were performed, and partial least squares calibration models were developed. The results showed that while the root mean square error values of approximately 1.9%(w/w) cotton were obtained with the benchtop instrument, the corresponding values for the handheld instruments varied in the range from 2.5% to 4.0%(w/w) cotton. Generally, a large signal-to-noise ratio and an extended available wavelength/wavenumber range had a beneficial effect on the prediction performance of the developed calibration model. Notwithstanding the diversity of instrumental parameters of the tested instruments, it can be concluded that all handheld spectrometers under investigation qualified as suitable tools for the detection of cotton adulterations in silk materials.
Keywords
Near-infrared (NIR) spectroscopy is primarily based on absorption bands of overtone and combination vibrations of C-H, O-H, N-H, C=O, and C=C functionalities 1 and, in combination with chemometric evaluation methods, has proven to be an excellent tool for qualitative and quantitative analysis. 2 Due to the comparable chemical specificity and simplicity of sample measurements, NIR spectroscopy has overtaken the other vibrational spectroscopic techniques of Raman and mid-infrared (MIR) as a handheld device through its progress in miniaturization and affordability.3 –5 While the weight and cost of handheld Raman and MIR instruments (with few exceptions) are still greater than 1 kg and 10 k US$, respectively, most commercially available handheld NIR spectrometers are lighter than 100 g with price levels of less than 1 k US$, and developments for their integration in mobile phones have been reported.6,7 This trend is additionally fueled by the optimistic forecasts of marketing companies about the growth of this device segment in the next few years. These tendencies have also launched the idea of making handheld NIR spectrometers in the near future available to the non-expert user community for private use in everyday life (e.g., quality control and detection of counterfeits in food and materials).8,9
Generally, recent progress in NIR spectrometer miniaturization has taken advantage of new micro-technologies, such as micro-electro-mechanical systems (MEMSs) and micro-opto-electro-mechanical systems (MOEMSs).10 –12 Despite the drastic reduction of spectrometer size and weight, good qualitative and quantitative calibration results have been achieved for a broad range of applications. 13
Based on the type of detector, handheld NIR spectrometers can be classified into two categories: array-detector and single-detector instruments. 14 Probably the first commercial, real light-weight, handheld (less than 100 g) NIR spectrometer (VIAVI (formerly JDSU) MicroNIR 1700, Santa Rosa, CA, USA) has an array detector that covers the wavelength range from 908 to 1676 nm and uses a linear variable filter (LVF) as a monochromator. It has so far been used for many applications, ranging from the authentication of seafood and determination of food nutrients to the analysis of hydrocarbon contaminants in soil and authentication and quantitative determination of pharmaceutical drugs.4,8,15 –17 However, in the NIR wavelength range where indium-gallium-arsenide (InGaAs) is the preferred detector material, the price for a single detector is much lower compared to an array detector. Therefore, in an attempt to further reduce the hardware costs, new developments have focused on systems with single detectors. Thus, the digital light processing NIRscan Nano evaluation module (DLP NIRscan Nano EVM, Dallas, TX, USA), for example, is based on Texas Instruments’ digital micro-mirror device (DMD™) in combination with a grating and a single-element detector, and also covers the wavelength range from 900 to 1701 nm. 18 Recently, a MEMS-based Fourier-transform-NIR (FT-NIR) instrument containing a single-chip Michelson interferometer with a monolithic opto-electro-mechanical structure has been introduced by Si-Ware Systems (Cairo, Egypt). Contrary to most other handheld spectrometers, this FT-NIR instrument can scan spectra over the large wavelength range from 1298 to 2606 nm.3,19,20 Finally, Spectral Engines (Helsinki, Finland) have developed miniaturized NIR spectrometers that are based on a Fabry–Pérot etalon, which acts as a tunable wavelength filter with a narrow wavelength range. In order to cover the full wavelength region between 1350 and 2450 nm, however, four spectrometers with different wavelength ranges are required.3,20
Presently, a new kind of handheld NIR scanner – the SenoCorder Solid (Senorics GmbH, Dresden, Germany) – with unique detectors made of organic solar cells has been introduced on to the market. In this device, each of the 16 detectors with active areas of 6.25 mm2 absorbs only a limited wavelength range within 400–1800 nm, and therefore no monochromator is required. For the present work, a scanner operating in the wavelength range of 1170–1675 nm was used.
Textiles are essential materials for everyday life with a broad range of applications and properties. They have been extended from simple body coverage and maintenance of body temperature to beauty features and decoration articles. Due to the large variations in quality, on the one hand, and the increasing quality awareness and price consciousness of customers, on the other hand, the availability of a simple tool for a rapid test of the correct identity of the purchased textile article would be a significant progress in customer protection.
Silk is a popular material for clothes, quilts, and carpets. As pointed out in a well-known Chinese trade internet portal, quilts are often adulterated with cotton, polyester, or other materials, which can lead to large price fluctuations. 21 This situation is regularly misused in popular tourist centers or online sales. In addition, silk will be blended with cotton to weave fabrics with different appearances and body feelings. However, the rapid identification of the silk (or non-silk) content in clothes, quilts, or carpets is difficult for ordinary customers.22,23
NIR spectroscopy has proved a suitable tool for identifying textile materials 21 with not only laboratory benchtop instruments but also handheld NIR spectrometers. 24 However, no quantitative NIR analysis of cotton/silk blends for the rapid detection of adulteration has been so far reported in the literature. In the present work, four different handheld NIR spectrometers were used for this purpose and tested for their performance to determine the cotton content in silk textiles in comparison to a laboratory spectrometer as a benchmark instrument.
Materials and methods
Sample preparation
Pure silk threads were purchased from Zhejiang Hangzhou satin company (Hangzhou, Zhejiang, China), and pure cotton threads were supplied by Hebei Sanli Wool Textile Co., Ltd (Baoding, Hebei, China). Each thread was cut into a very short length of about 0.5 mm so that the final material looked like a powder. After shear mixing of different weights of silk and cotton, 101 blend samples were prepared, in which the cotton content varied from 0% to 100.00% (w/w) with concentration intervals of 1.00% (w/w). Hand feel and physicochemical properties of the samples are very similar to the fabric form so that calibrations based on this sample morphology can readily be extended for industrial use.
Definition of calibration and test sets
Twenty samples with cotton content between 3.00% and 98.00% (w/w) were selected in intervals of 5.00% (w/w) as the test set, and the residual 81 samples were used as the calibration set to develop partial least squares (PLS) models. The test set was used as unknown external samples to validate the performance of the PLS models.
Spectra recording
In order to relate the performance of the handheld NIR spectrometers to a standard laboratory instrument, a benchtop FT-NIR spectrometer was used as a benchmark instrument. In what follows, the measurement parameters and sample presentation for the different instruments are summarized (Table 1).
(1) Thermo Antaris II (Thermo Scientific, Madison, WI, USA)
Measurement parameters of the instruments under investigation

aNo scan numbers are provided/recommended by the vendor.
This spectrometer is a benchtop FT-NIR instrument with an integrating sphere. As shown in Figure 1(a), the blend samples were loaded in a small rotating quartz cup, and the spectra were recorded in diffuse reflection through the bottom of the cup with the following measurement parameters: wavenumber range 10,000–4000 cm−1, spectral resolution 8 cm−1, accumulation of 32 scans, and signal-to-noise (S/N) ratio of 8147:1 at 6452 cm−1. The final spectrum was the average of three replicate spectra.
(2) NeoSpectra Scanner (Si-Ware Ltd, Cairo, Egypt)

Sample presentation for spectra recording with different near-infrared (NIR) spectrometers: Thermo Antaris II (a); NeoSpectra Scanner (b); Viavi MicroNIR 1700 (c); Spectral Engines NR 2.0-W (d); SenoCorder Solid (e). Spectra of pure cotton (blue) and pure silk (red) recorded by the different NIR instruments: Thermo Antaris II (f); NeoSpectra Scanner (g); Viavi MicroNIR 1700 (h); Spectral Engines NR 2.0-W (i); SenoCorder Solid (j). (Color online only.)
This instrument is an ergonomically comfortable, handheld, and MEMS-based FT-NIR spectrometer. As shown in Figure 1(b), each sample was arranged as a layer of approximately 3 mm on top of the sapphire window of the instrument and covered by a 99% Spectralon™ reflection standard (Labsphere Inc., North Sutton, USA). The diffuse reflection spectra were recorded bottom-up in the wavelength range of 1347–2543 nm (7423–3932 cm−1), with 10 s measurement time, Happ-Genzel apodization, and 32 K fast Fourier transform (FFT) points. The spectral resolution of this instrument was 8 nm (at 1550 nm), and the S/N ratio was 2100:1. Taking into account the heterogeneity of the investigated samples, triplicates (repacks) of each sample were measured and stored via Bluetooth on a Samsung tablet and finally averaged before further processing.
(3) Viavi MicroNIR 1700 (Santa Rosa, CA, USA)
The measurement of the sample by Viavi MicroNIR 1700 is shown in Figure 1(c). Triplicate spectra were recorded with an integration time of 12 ms by averaging 50 scans in the wavelength range of 908–1676 nm (11,013–5967 cm−1) with 125 variables and a spectral resolution of 12.5 nm. The S/N ratio was 5067:1 as calculated from the 100% line by measuring the diffuse reflection background spectra of the 99% reflection standard.
(4) Spectral Engines NR 2.0-W (Helsinki, Finland)
As shown in Figure 1(d), the sample was recorded in triplicate in a top-down sample presentation mode in the wavelength range of 1550–1950 nm (6452–5128 cm−1) with 41 variables, a spectral resolution of 18 nm, and with PointAvg 100 and ScanAvg 150 parameters. The S/N ratio of this instrument was determined as 8908:1.
(5) SenoCorder Solid (Dresden, Germany)
Samples were positioned on the window of the instrument, as shown in Figure 1(e), and covered with the reflection reference mounted in the instrument's lid. Triplicate measurements were performed with the wavelength range from 1170 to 1675 nm (8547–5970 cm−1) with 16 variables and a spectral resolution of 67 nm (averaged). The S/N ratio of this instrument was about 1038:1.
Spectral pretreatment
For an easier assignment of the absorption bands to chemical functionalities, the wavelength scales of the spectra measured with instruments (2)–(5) were transformed to wavenumbers. Spectral preprocessing can significantly improve the calibration model performance because NIR spectra frequently contain background information, drift, and noise. Thus, in order to obtain reliable, accurate, and stable calibration models, it is recommended to preprocess spectral data before modeling. 25 In the present investigation, the first derivative and standard normal variate (SNV) were applied and were compared to obtain the optimal pretreatment method.
Calibration model development and test set prediction
After data pretreatment, PLS calibration models were developed for the cotton content of the blend samples with the 81 spectra of the calibration set using Unscrambler® software (version 10.X, CAMO Software AS, Oslo, Norway). Internal cross-validation (CV) was applied to select the optimal number of factors. 26 This validation procedure estimated the prediction error by splitting all samples into 20 segments, of which one segment was retained for validation and the remaining 19 segments were used for calibration. This process was repeated until all segments were used for validation once. 27 Finally, the 20 test set samples, which were not included in the calibration procedure, were used to demonstrate the predictive capability for the cotton content of unknown samples. The calibration statistics output includes the root mean square error of calibration (RMSEC), root mean square error of cross-validation (RMSECV), root mean square error of prediction (RMSEP), and the R2 of the calibration, CV, and prediction sets. The residual predictive deviation for cross-validation (RPDcv) was calculated as the ratio of the standard deviation (std.) of the reference data to the RMSECV. The higher the RPDcv value, the better the prediction performance of the model.28,29
Results and discussion
Reference values
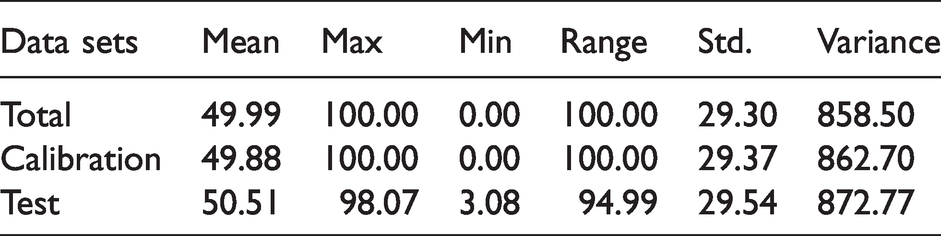
The statistics of the reference values of the total sample set, and the calibration and test sets, respectively, are summarized in Table 2. The similarity of the mean, maximum, and minimum values and the range, standard deviation, and variances demonstrated that the data sets provided a reasonable basis for evaluating the calibration performance of the different instruments.
Statistics of the cotton content values (% (w/w)) of the different sample sets
NIR raw spectral data
The primary chemical structures of cotton (cellulose) and silk (fibroin protein) are significantly different. Thus, the raw NIR spectra of cotton and silk recorded with the five different NIR spectrometers were also very different (Figures 1(f) and (g)). 30 Specifically, the instruments with long-wavelength (short-wavenumber) extensions (Thermo Antaris II and NeoSpectra Scanner), as shown in Figures 2(a) and (b), reflected significant differences of the pure cotton and silk spectra in the 5500–4000 cm−1 range of the ν(OH)+δ(OH), ν(NH)+δ(NH), ν(NH)+Amide I, ν(NH)+Amide II, ν(CH2)+δ(CH2) and ν(CH3)+δ(CH3) combination bands. Some variations – although less characteristic – can also be observed in the 7500–6000 cm−1 wavenumber range, where the absorption bands of the first overtones 2xν(OH) and 2xν(NH) and the combination vibrations 2xν(CH2)+δ(CH2) and 2xν(CH3)+δ(CH3) were located. Similarly, minor changes between the pure cotton and silk spectra were detected in the 6000–5000 cm−1 region of the 2xν(CH), 2xν(CH2), and 2xν(CH3) overtones. Due to their narrow wavenumber/wavelength ranges, the smallest qualitative differences between pure cotton and silk spectra were certainly reflected by the Spectral Engines NR 2.0-W (Figure 1(i)) and SenoCorder Solid (Figure 1(j)) spectrometers.

Raw and pretreated near-infrared spectra of cotton/silk mixtures recorded by different instruments: Thermo Antaris II (a), (f); NeoSpectra Scanner (b), (g); Viavi MicroNIR 1700 (c), (h); Spectral Engines NR 2.0-W (d), (i); SenoCorder Solid (e), (j). The pretreatment methods are the standard normal variate, extended multiplicative scatter correction, SNV, first derivative, and first derivative, respectively. (Color online only.)
The raw spectra of the calibration set are shown in Figures 2(a)–(e). In the spectra recorded with the Thermo Antaris II benchtop FT-NIR spectrometer (Figure 2(a)), the change in silk/cotton concentration induced significant intensity changes in the 7000–6000 and 5100–4000 cm−1 wavenumber ranges. The arrows in Figures 2(a) and (f) mark the wavenumber ranges with the most significant intensity changes due to the silk/cotton variation. Similar effects can also be observed in the raw and pretreated spectra recorded with the NeoSpectra Scanner (Figures 2(b) and (g)). In contrast, the raw and first derivative NIR spectra recorded with the SenoCorder Solid (Figures 2(e) and (j)) not only reflect a much lower S/N ratio but also the low number (16) of available wavelength variables; the concentration variation of silk/cotton is much less represented in the spectra compared to the spectra of the benchtop FT-NIR spectrometer.
NIR spectra pretreatment
A multiplicity of different pretreatment methods was tested, and the optimum methods were obtained based on the calibration results. The pretreated spectra are shown in Figures 2(f)–(j). Baseline shifts and slope differences were corrected by the first derivative for the raw spectra recorded with Spectral Engines NR 2.0-W and SenoCorder Solid, whereas the raw spectra measured with the Thermo Antaris II and Viavi MicroNIR 1700 were scatter corrected by the SNV, and the spectra measured with the NeoSpectra Scanner were corrected by extended multiplicative scatter correction (EMSC). In Figures 2(a) and (f), the black and red arrows indicate the trend of increasing silk content.
Analysis of the calibration data
As far as the calibration performance is concerned, it can be evaluated based on the calibration statistic parameters R2cal, R2CV, RMSEC, RMSECV, and RPDCV.
Another parameter that has a significant effect on the performance of the developed calibration model is the number of factors. 26 Fewer factors lead to lower accuracy because less information is applied. On the other hand, too many factors frequently induce overfitting with only an apparent improvement of predictive ability for the calibration set, whereas the calibration model will have a lower prediction performance when applied to unknown samples. In the present work, the optimal factor number has been derived from the change of RMSECV as a function of the factor number and the difference between the RMSEC and RMSECV. The optimal number of factors was chosen when the RMSECV changed least with a further increase of the number of factors and when the difference between RMSEC and RMSECV was the lowest. The optimal numbers of factors for the PLS calibrations derived with the spectra of the different instruments are summarized in Table 3. Only two factors were required for the PLS calibrations developed with the spectra of the Thermo Antaris II and the NeoSpectra Scanner spectrometers, whereas four, five, and five factors were necessary for the calibrations with spectra measured with the Viavi MicroNIR 1700, Spectral Engines NR 2.0-W, and SenoCorder Solid instruments, respectively. The difference in the required number of factors mainly depended on the available wavelength ranges, which provided more or less information on chemical functionalities.
Comparison of the calibration and prediction performance for the cotton content in silk/cotton blends based on the near-infrared spectra of the benchtop and the four handheld instruments
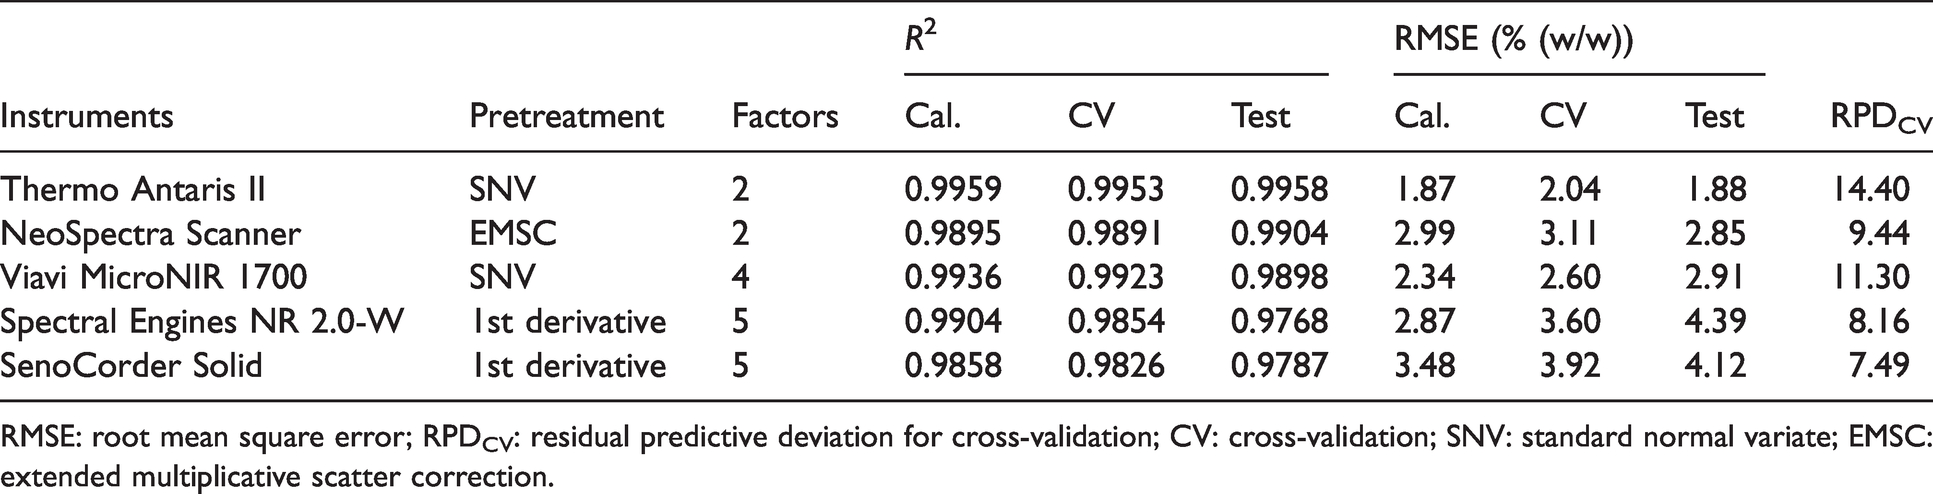
RMSE: root mean square error; RPDCV: residual predictive deviation for cross-validation; CV: cross-validation; SNV: standard normal variate; EMSC: extended multiplicative scatter correction.
For the RPDs, the rankings from high to low were the Thermo Antaris II, Viavi MicroNIR 1700, NeoSpectra Scanner, Spectral Engines NR 2.0-W, and SenoCorder Solid. Obviously, the benchtop NIR instrument has a high performance for determining cotton content in cotton/silk blends. The Thermo Antaris II instrument has the highest RPDcv value of 14.4, which means that it can accurately determine the cotton content in the range of 0–100% (w/w). For the four handheld NIR instruments, the Viavi MicroNIR 1700 has the highest and the Senorics the lowest prediction capability in the cotton content range of 0–100% (w/w).
Generally, based on the calibration statistics results, the performance of the individual instruments can be comparatively categorized as follows.
(a) The Thermo Antaris II spectrometer has a higher performance than the handheld NIR instruments because the benchtop instrument covers the largest wavelength/wavenumber range and has a high S/N ratio. (b) The handheld instruments NeoSpectra Scanner and Viavi MicroNIR 1700 have higher performance than the Spectral Engines NR 2.0-W and the SenoCorder Solid NIR Scanner, which is certainly due to the narrow wavelength/wavenumber ranges of the Spectral Engines NR 2.0-W and SenoCorder Solid spectrometers. (c) Nevertheless, a larger wavelength/wavenumber range is not necessarily an automatic criterion for higher performance. In this work, the statistic parameters of the NeoSpectra Scanner were similar to those of the Viavi MicroNIR 1700 instrument, although its wavelength range (1357–2458 nm) was much larger than that of the Viavi MicroNIR 1700 (897–1619 nm). In this specific case, the lower S/N ratio of the NeoSpectra Scanner minimized the advantages of the larger wavelength/wavenumber range. The low performance of the SenoCorder solid can readily be traced back to the low S/N ratio in combination with a very narrow available wavelength range.
Conclusions
The present work demonstrated the feasibility of determining cotton content in silk/cotton blends by handheld NIR spectroscopy, thereby enabling customers to protect themselves against adulteration. The PLS calibration models developed with the spectra of the miniaturized spectrometers were compared among each other and with the results achieved with a benchtop laboratory spectrometer. While the laboratory spectrometer obtained a root mean square error (RMSE) value of approximately 1.9% (w/w) cotton, the corresponding values for the handheld instruments varied in the range from 2.5% to 4.0% (w/w) cotton. Nevertheless, all the handheld spectrometers in this comparative study qualified as suitable tools for detecting deliberate fraud in silk/cotton materials. Regarding the performance of the different handheld instruments, generally, a large S/N ratio and an extended available wavelength/wavenumber range had a beneficial effect on the prediction performance. In the case of trade-offs, a high S/N ratio always compensated for the disadvantage of a narrow wavelength range.
Footnotes
Declaration of conflicting interests
The author(s) declared no potential conflicts of interest with respect to the research, authorship, and/or publication of this article.
Funding
The author(s) disclosed receipt of the following financial support for the research, authorship, and/or publication of this article: This work was supported by the Key R & D Program (Modern Agriculture) of Jiangsu Province, China (Grant No. BE2020331) and the opening project of the Key Laboratory for Genetic Improvement of Sericulture, Ministry of Agriculture and Village, China (Grant No. KL201906).
