



Abstract
The braiding quality of composite preforms has a significant influence on their mechanical properties. To address the difficulties in the design of the processing technology and the stability of the surface quality of the fabric during the braiding process of the spatial special-shaped mandrel, a robot control method was proposed for prefabrication. Regarding branding of the formed body and inspection of the braiding angle of the fabric by machine vision for quality control, in this study the spatial special-shaped mandrel was discretized, the position and attitude of the tool center point were calculated, and the robot pulling speed was calculated. The calculation was performed to realize the automatic compensation of the braiding angle and, finally, the braiding angle of the fabric surface was detected by machine vision. The experimental results showed that the control method could effectively reduce the braiding angle error of the preform within ±2° through the detection of the visual inspection algorithm and could improve the quality of the preform and the detection speed of the braiding angle in actual production.
In recent years, owing to their good specific strength and specific stiffness, high-temperature resistance, corrosion resistance, and light weight, composite materials have widely replaced traditional metals in the fields of aerospace, automobile manufacturing, and medical equipment. 1
Braiding is an important process in composite material preforms. Braiding errors, such as the braiding angle and coverage errors during the braiding process, directly affect the mechanical properties of composite materials. The braiding angle is the angle formed by the fiber yarn and axis of the mandrel and is usually caused by the fluctuation of the braiding speed or traction speed, contact and friction between yarns, 2 and change in the mandrel section. Whether the composite material can have the desired mechanical properties, such as tensile strength and compressive strength, depends on the size of the braiding angle error 3 and the surface coverage. 4 The production of braided composites is a multi-step manufacturing process. Production efficiency and part quality can be improved by improving the manufacturing process and detection methods, and the need for labor can be reduced. 5
The following is a study on the braiding process of a spatially curved special-shaped mandrel; the braiding angle on the surface of the preform after braiding is completed is also detected. Previous research has focused on the direction of the cored imitation surface shape. Monnot et al. 6 established a braiding model suitable for a mandrel with a centrally curved rectangular cross-section and used an industrial manipulator to pull the mandrel to complete the braiding of the preform; however, this braiding model was not suitable for a mandrel with a circular cross-section. Du et al. 7 developed a theoretical mathematical model to describe the braiding process of a circular section mandrel and related the mandrel pulling speed to the surface braiding angle of the part. The mathematical model could be used to predict the braiding angle but was only suitable for straight-line mandrels with an axisymmetric cross-section. Other scholars used the finite element method to analyze the forces in a braiding process. Zhuo et al. 8 highlighted that a three-dimensional braiding product has better mechanical properties than those of the two-dimensional circular braiding, analyzed the displacement of the core mold caused by the yarn tension disturbance during the braiding process through finite element technology, and then compensated for the end of the traction robot. However, it is difficult to perform offset compensation based on coordinate system transformation for spatially curved, special-shaped structure mandrels. Gondran et al. 9 proposed discretizing the mandrel by changing the cross-section into multi-segment cylinders and using iterative feedback through the forward and inverse kinematics solution to obtain a better robot traction speed but did not consider the changes in the yarn collection area. Martinec et al. 10 analyzed the process of robot-end clamping the mandrel through a braiding machine during the fiber braking process and obtained the trajectory of the robot during operation through theoretical calculations; however, they did not consider the constant change in the mandrel section and the three-dimensional space of the centerline of the mandrel. Hans et al. 11 used a finite element software program to model the two-dimensional overlapping braiding process of an industrial robot holding a mandrel to simulate the entire process of braiding. Spatially shaped mandrels are widely used for braiding products with complex geometries, such as robotic arms, prosthetics, and hockey sticks. 12 However, there are few studies in the literature on the braiding process of a mandrel with a changing cross-section and spatial special shape; therefore, this article mainly focuses on the research on the processing of the special-shaped braid structure.
Boisse et al. 13 proposed a Carrier delay-based method for development of the tracks for the transitions between patterns on 3D braiding machines with continuous rotating horn gears. Kamble and Behera 14 have reported the geometric model of a four-directional 3D braided preform developed on a four-step 3D braiding machine which consists of even and an equal number of yarn carriers in the rows and columns, respectively, on machine bed. Huber et al. 15 have proposed a 3D rotary braiding process that can be successful fully applied to man-made cellulose fibers. without causing significant damage to the fibers. In Bilisik’s study, 16 3D braided fabrics, methods and techniques were reviewed. Biaxial and triaxial 2D braided fabrics have been widely used as simple and complex shaped structural composite parts in various technical areas.
Hajrasouliha et al. 17 proposed a model to predict the braid angle on an arbitrary, constant cross-section and used image processing to detect the braid angle. Hunt and Carey 5 obtained dynamic and static preform surface images, cropped the region of interest, and then performed a frequency domain analysis to obtain specific braiding angles. Some studies have proposed measuring the surface braiding angle of composite material preforms based on the Hough transform; however, only a single braiding angle could be obtained, which does not represent the braid quality of the entire fabric. Lian et al. 18 developed a fully automated machine vision system, identified the necessary image-processing steps, and successfully implemented a scanning algorithm for braiding angle extraction. Wan et al. 19 applied spectroscopic analyses to three-dimensional (3D) braided composite preform surface images. This method has been shown to be suitable for measuring the surface braiding angle of 3D composites. In this study, a new braiding angle algorithm is proposed based on machine vision and image processing technology to improve detection accuracy.
In this article, a method for controlling the traction trajectory and speed of a space-curved-shaped mandrel and an algorithm for discrete angle mean grayscale visual inspection are proposed to measure the braiding angle on the surface of the preform. This trajectory and speed control method uses a plane perpendicular to the fixed braiding point when calculating the trajectory of the traction robot and does not need to consider the change in the convergence length. By compensating for the braiding angle error caused by the change in the section, the method can effectively reduce the error when braiding the core mold of the special-shaped structure thereby improving the mechanical properties of the preform. After the preform was braided, a surface image was collected, and the discrete angle mean grayscale algorithm was used to detect the surface braiding angle to evaluate the mechanical properties of the preform.
Aiming at this type of mandrel traction problem, this article proposes a method for traction trajectory and speed control of a space-curved-shaped mandrel. This trajectory and speed control method uses a plane perpendicular to the fixed braiding point when calculating the trajectory of the traction robot and does not need to consider the convergence length changes. Furthermore, it establishes a mathematical model of the pulling speed during the braiding process, and then controls the pulling speed to compensate for the braiding angle error caused by the section change. After the preform was braided, a surface image was collected, and the discrete angle mean grayscale algorithm was used to detect the surface braid angle to evaluate the mechanical properties of the preform. To address the problem of braiding angle measurement, a method to measure the surface braid angle of a braided composite material preform is proposed. The method includes image preprocessing, image binarization, edge detection, two-dimensional discrete Fourier transformation, and a discrete angle mean grayscale braiding angle detection algorithm, which is proposed and applied to calculate the preform surface braiding angle.
Trajectory planning and speed control of traction robot in braiding process
Figure 1 shows the braiding preform of a robot pulling a mandrel. The coordinate system where the robot base is located is usually called the base coordinate system or world coordinate system. The external conditions, such as the position of the braiding machine and braiding ring, are described in the base coordinate system, and the shape of the mandrel is described in the tool coordinate system. After planning the trajectory and speed, inputting them into the command library to write the trajectory and speed enables the robot to pull the mandrel. 20
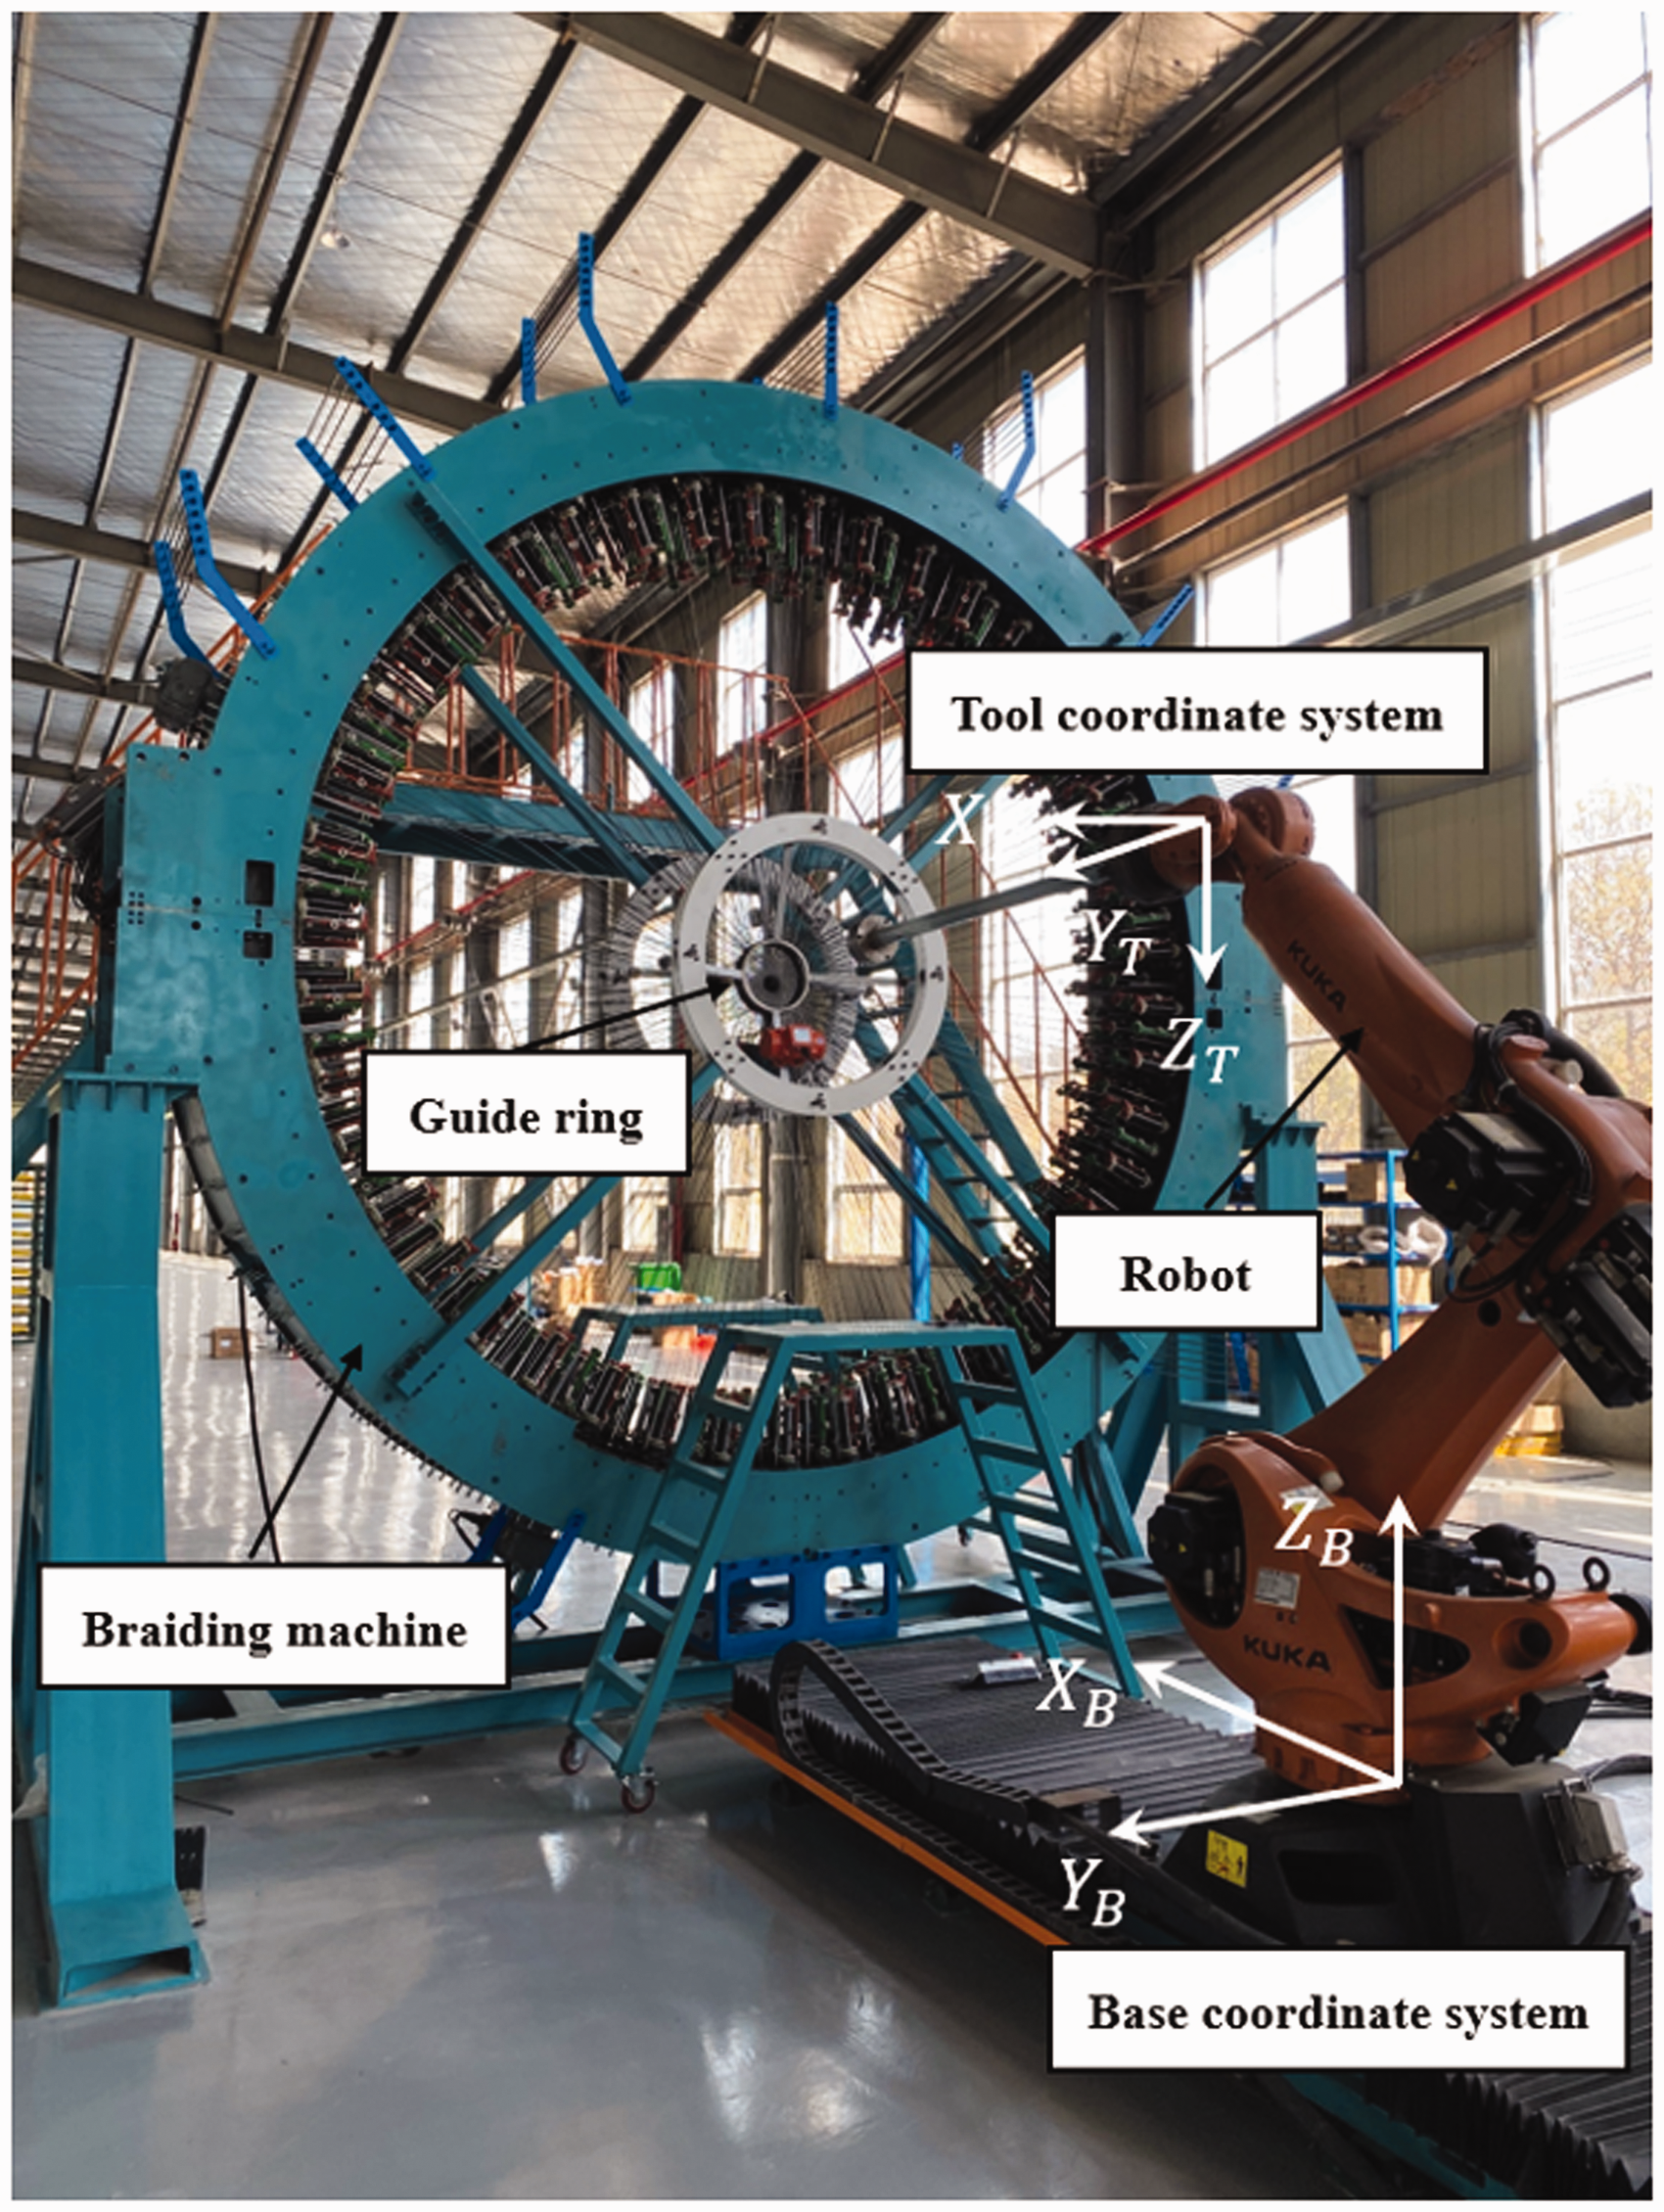
Braiding machine and traction robot.
Trajectory planning of traction robots
Simplified braiding model
The braiding process of a special-shaped space-bending mandrel is shown in Figure 2. The trajectory of the mandrel pulled by the robot must ensure that the mandrel always passes vertically through the plane where the braiding point is located. The coordinates of the center point of the braiding plane in the base coordinate system are S
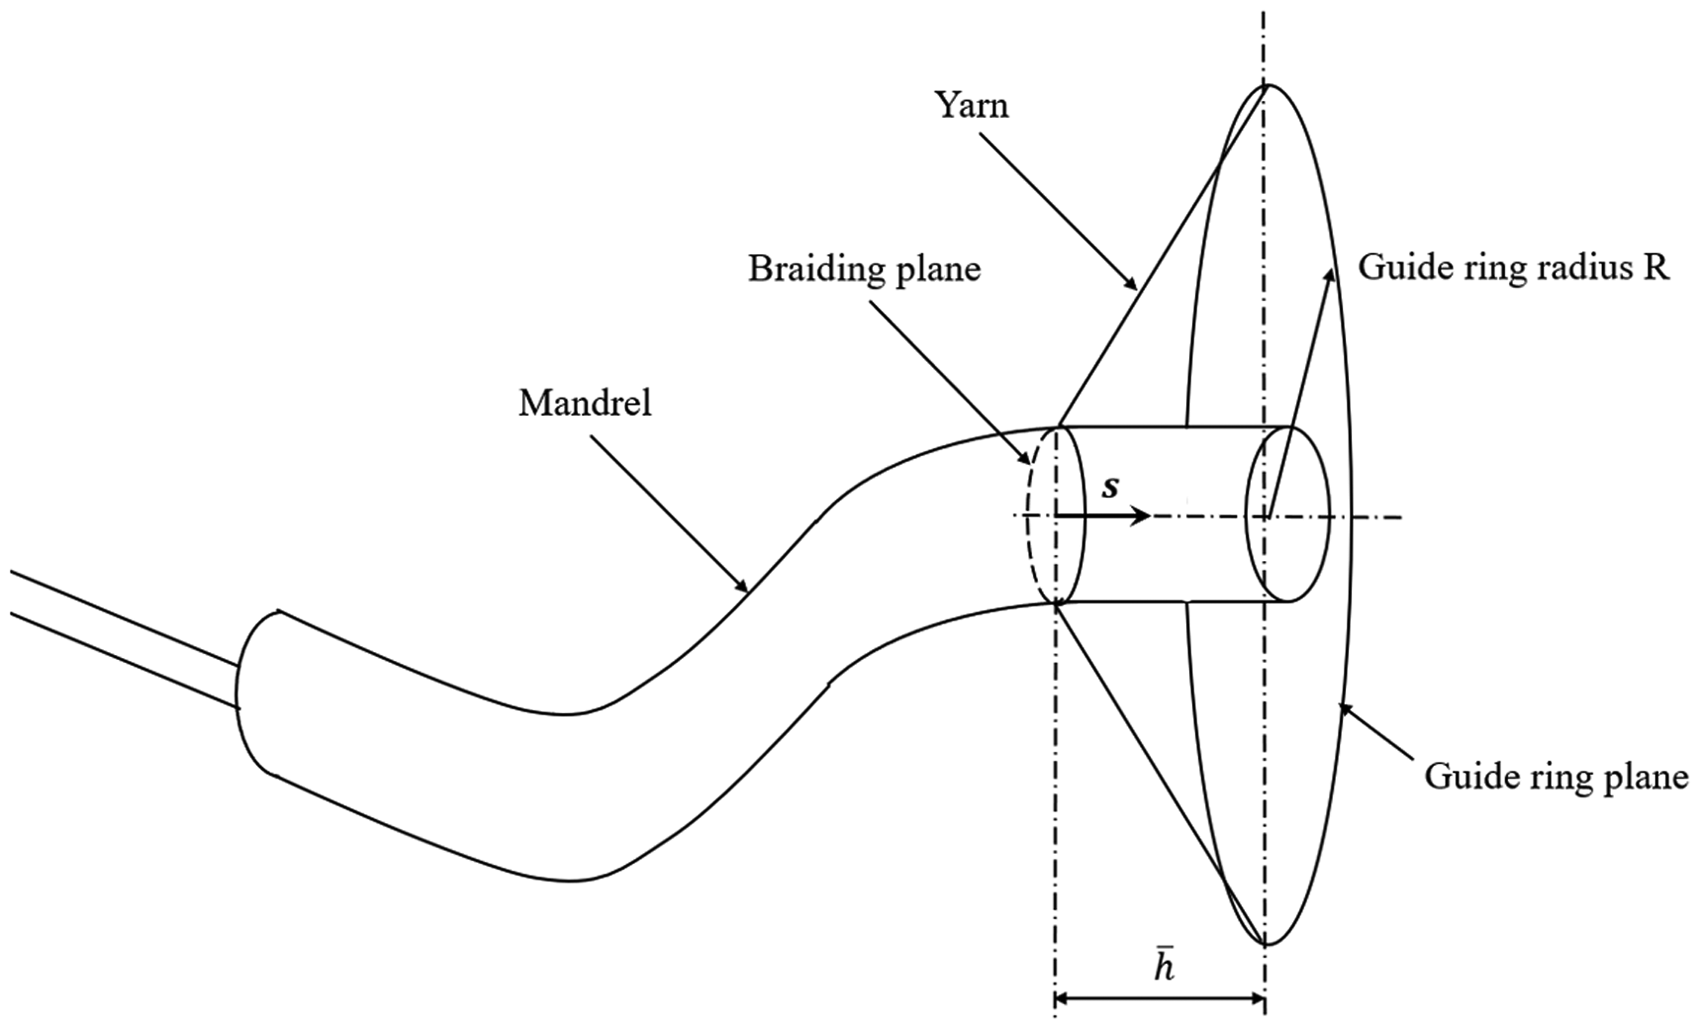
Schematic diagram of the braiding process.
The mandrel is represented by n discrete points

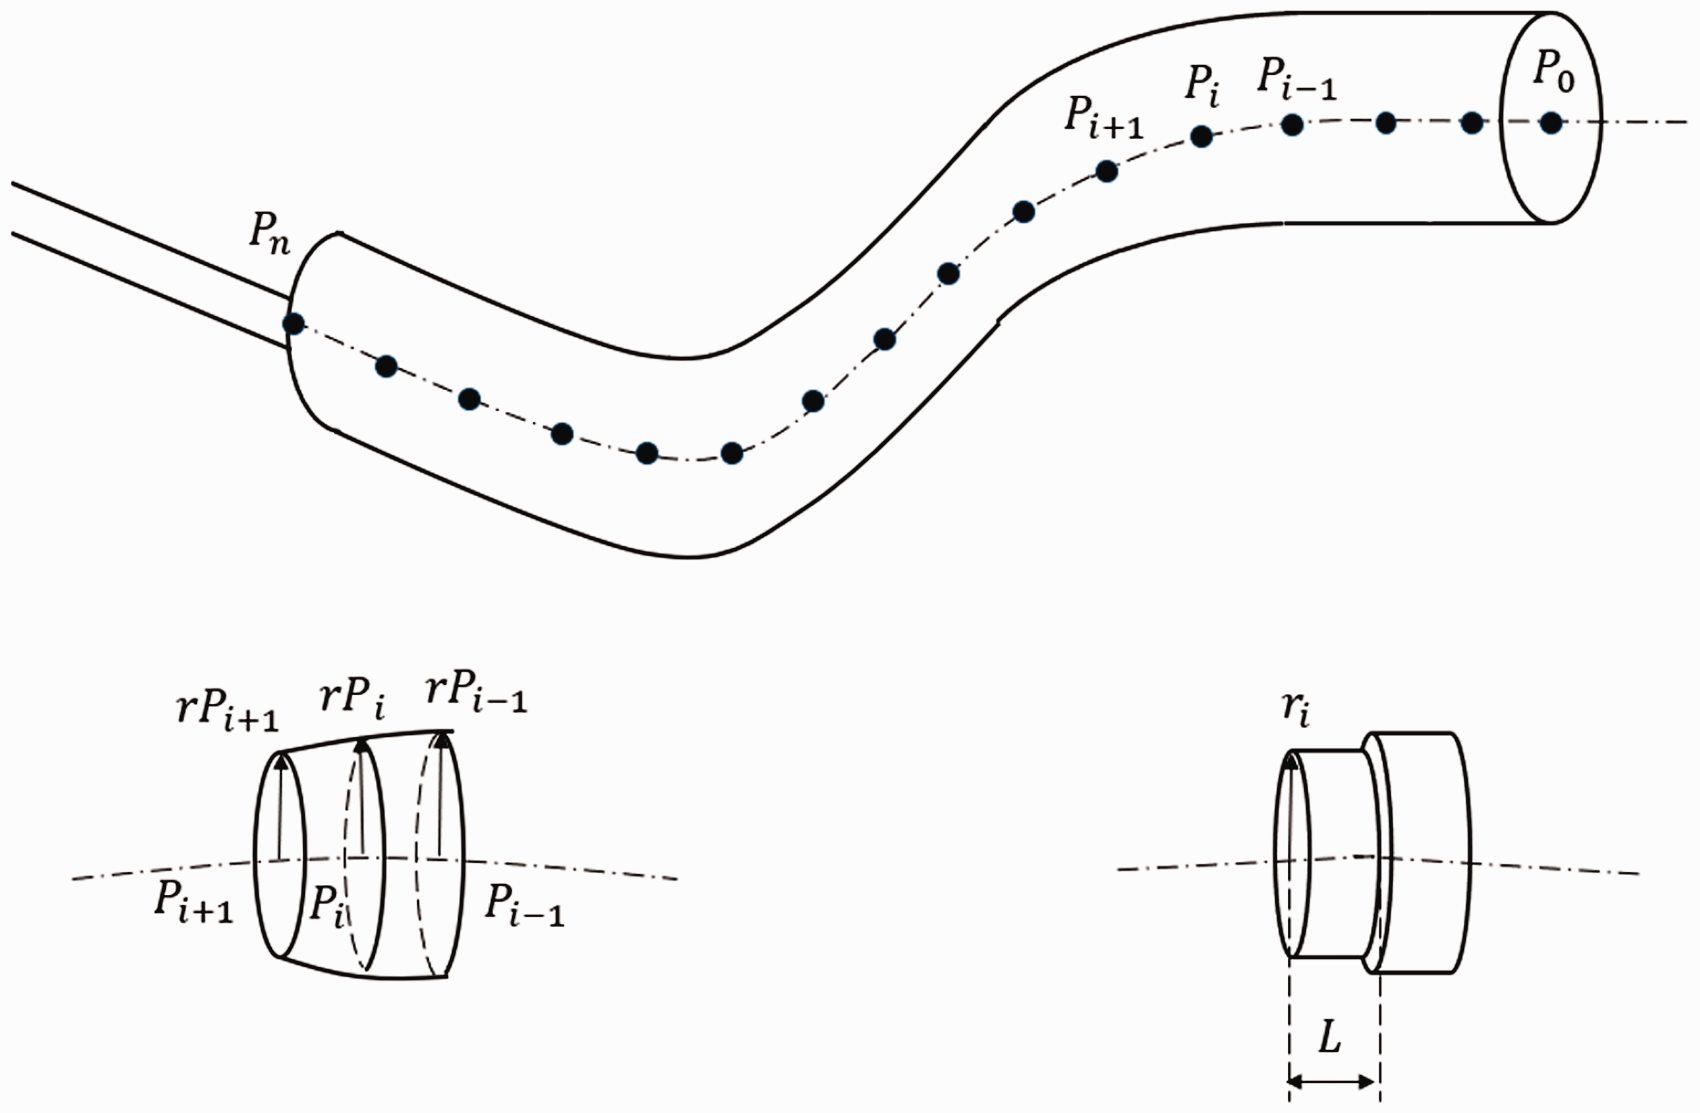
Mandrel discrete approximation process diagram.
The calculation of the average braid convergence length ( The relative coordinates between all discrete The number of discrete segments (n) should satisfy the accuracy requirements for describing the shape of the mandrel; The approximate length (L) of each segment of the cylinder after discretization should ensure that the robot satisfies the response of each segment.
Trajectory planning of the end of the traction robot
At present, the known manipulators pull the mandrel to assist the process of braiding the preform, most of which obtain the trajectory such that the robot moves through the plane of the braiding ring vertically and uniformly at all times. Bending the mandrel affects the braiding angle, resulting in a braiding angle error. The robot clamps the mandrel and passes through the braiding ring vertically. Owing to the convergence distance (h), the centerline of the mandrel at this moment cannot be perpendicular to the plane of the braiding point, as this causes unequal braiding angles on all sides of the mandrel. Therefore, for a special-shaped mandrel, in the braiding process, a mandrel perpendicular to the plane of the braiding point should be the basic theoretical model. Figure 4 is the flow chart of the robot terminal trajectory planning. The left side of the figure is the sequence structure. The sequence has little effect on the planning, and the sequence cannot be changed for the cyclic structure. If it is changed, the correct trajectory cannot be calculated.
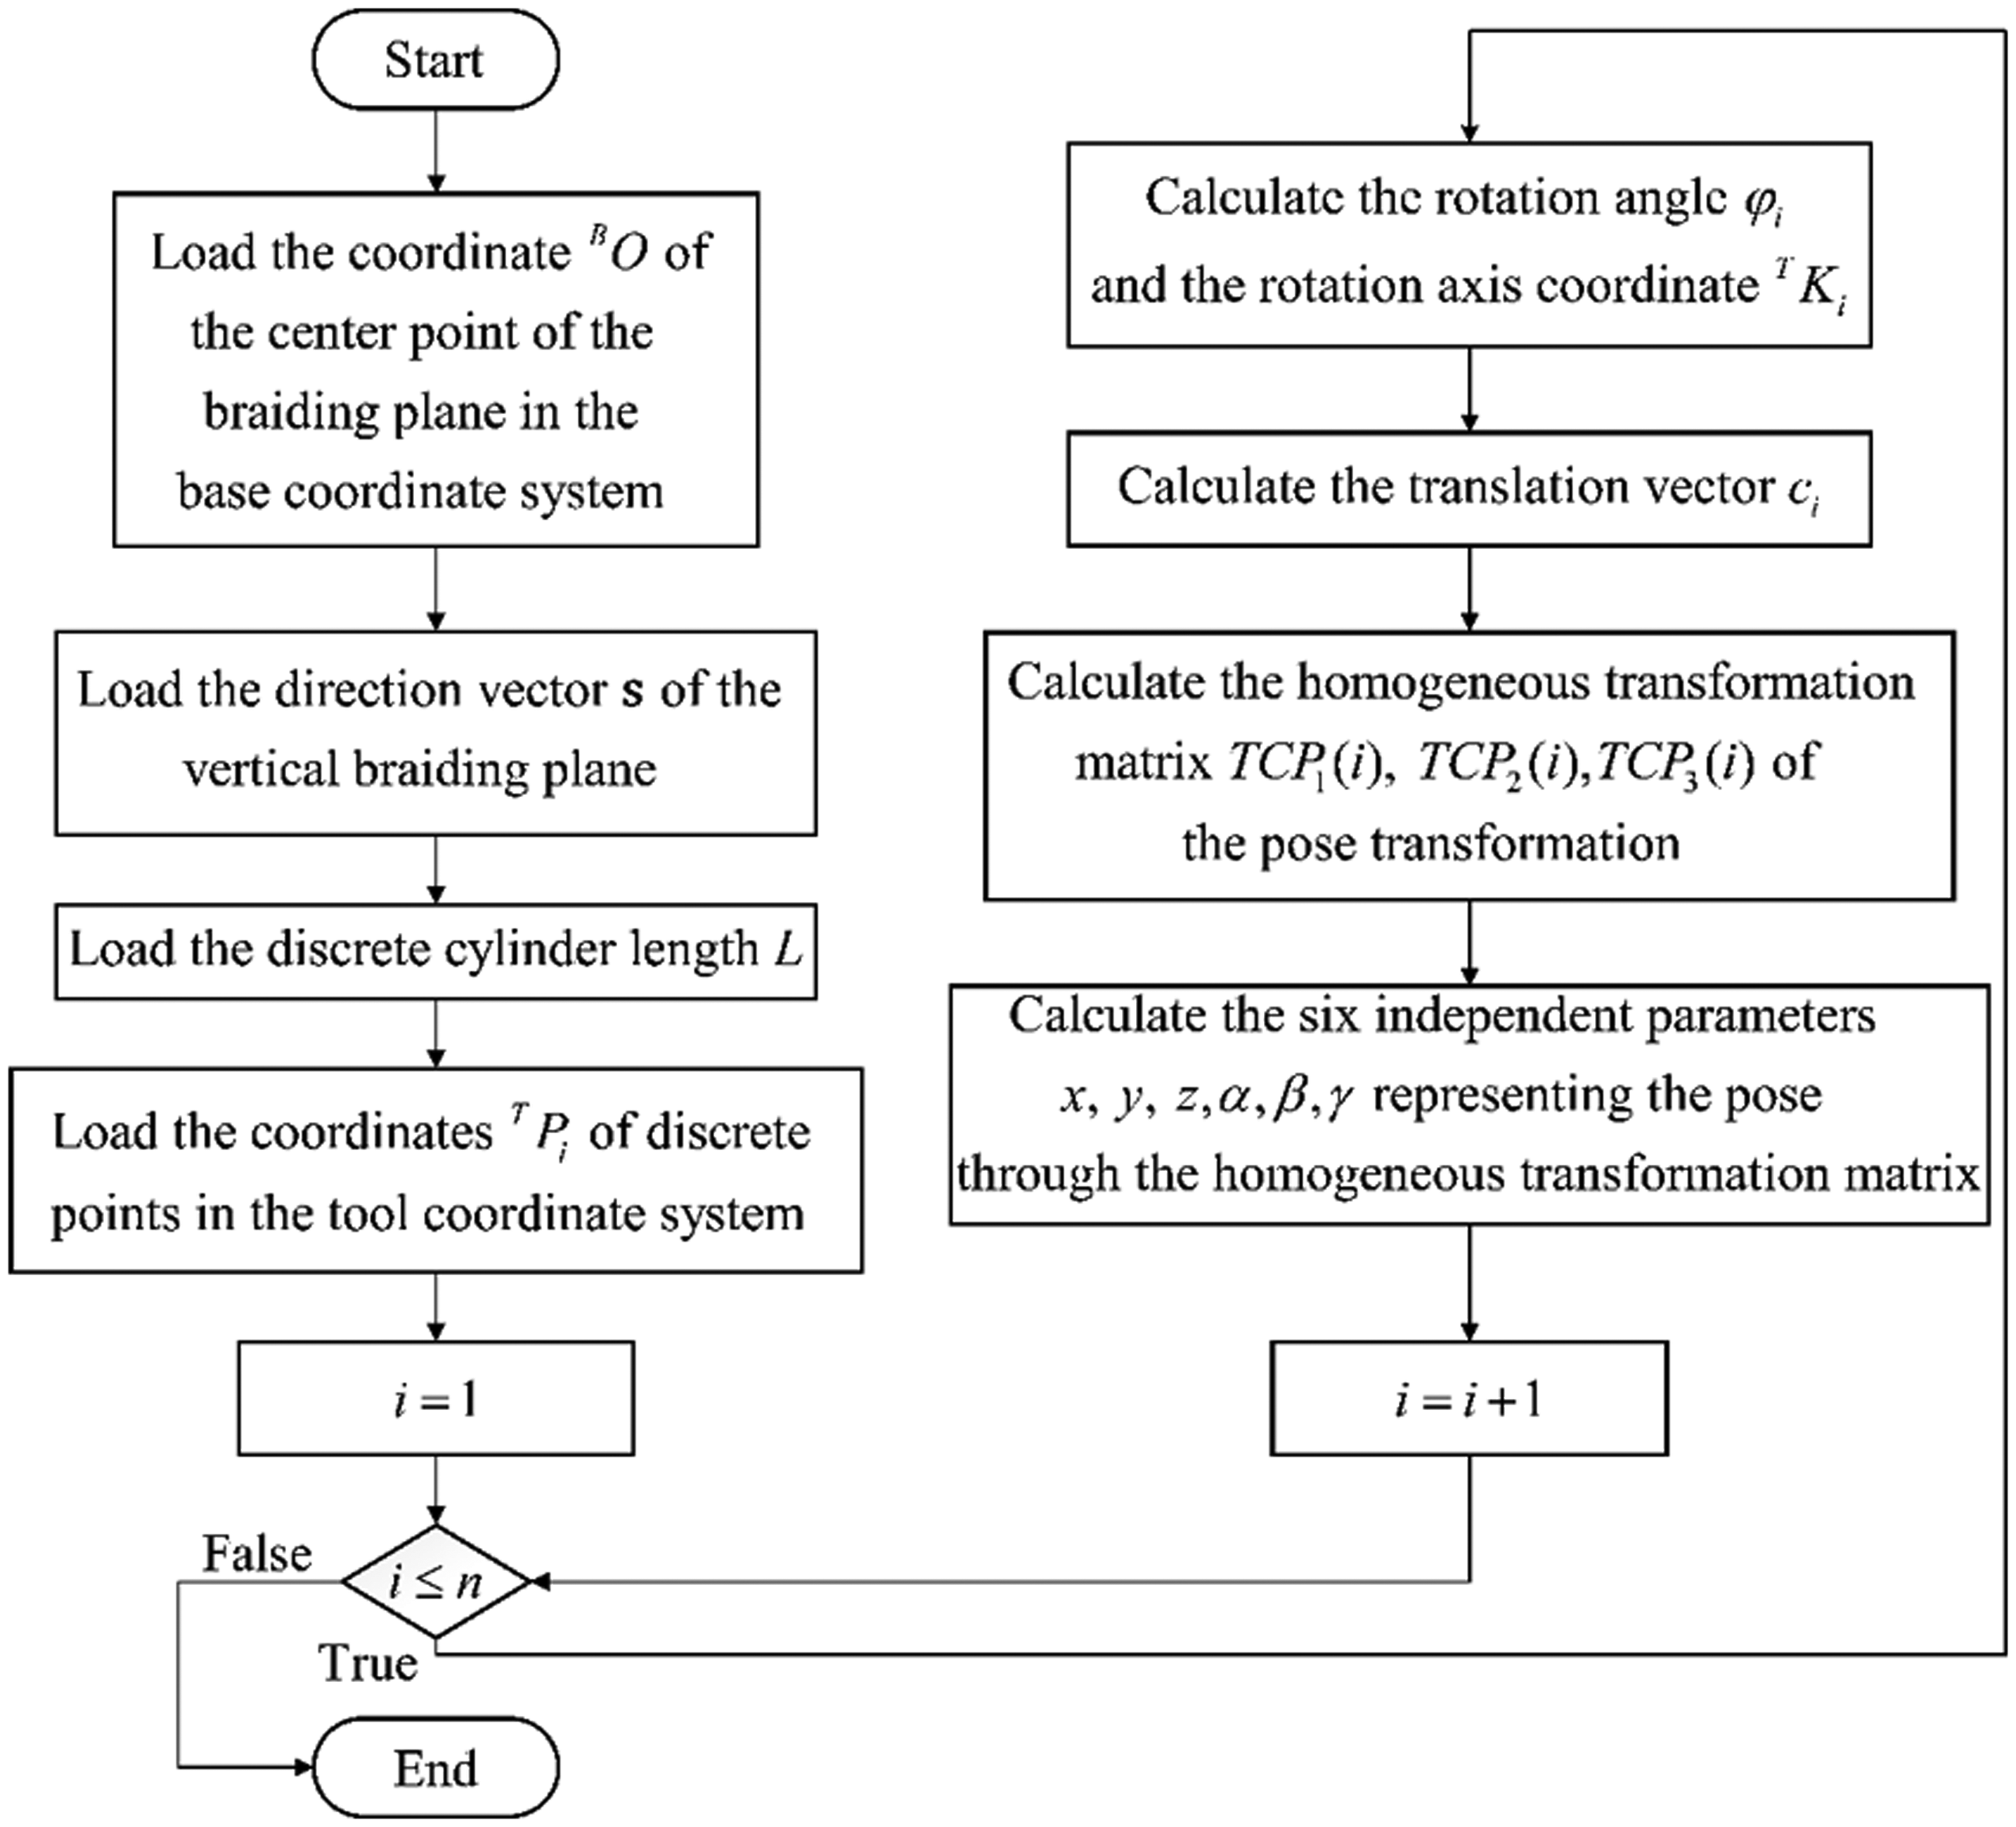
Traction planning flow chart of traction robot. TCP: tool center point.
The trajectory of the robot end is determined according to the pose data of the tool center point (TCP). In this study, the mandrel is divided into a total of
That is, point

Schematic diagram of discrete mandrel pose change. (a) TCP3(i−1); (b) TCP1(i); (c) TCP2(i) and (d) TCP3(i).
For the clamped mandrel, the relative position of the mandrel and the tool coordinate system are determined; that is,

As shown in Figure 6, the angle (φ) between vector


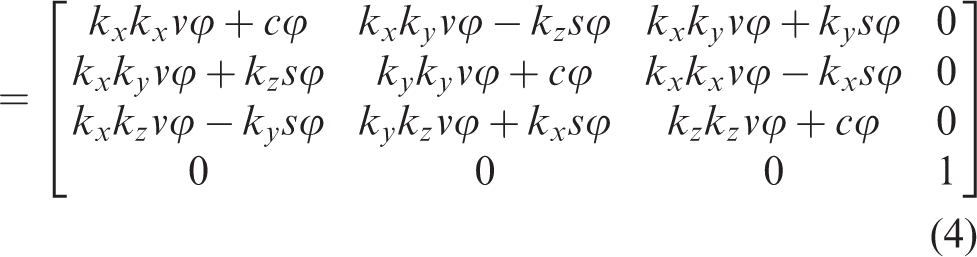
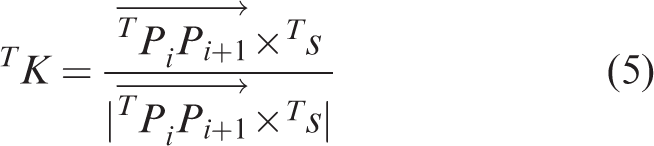
The rotation axis (K) is determined using Equation (5) and is relative to tool coordinate system {T}. The i-th mandrel is rotated around the
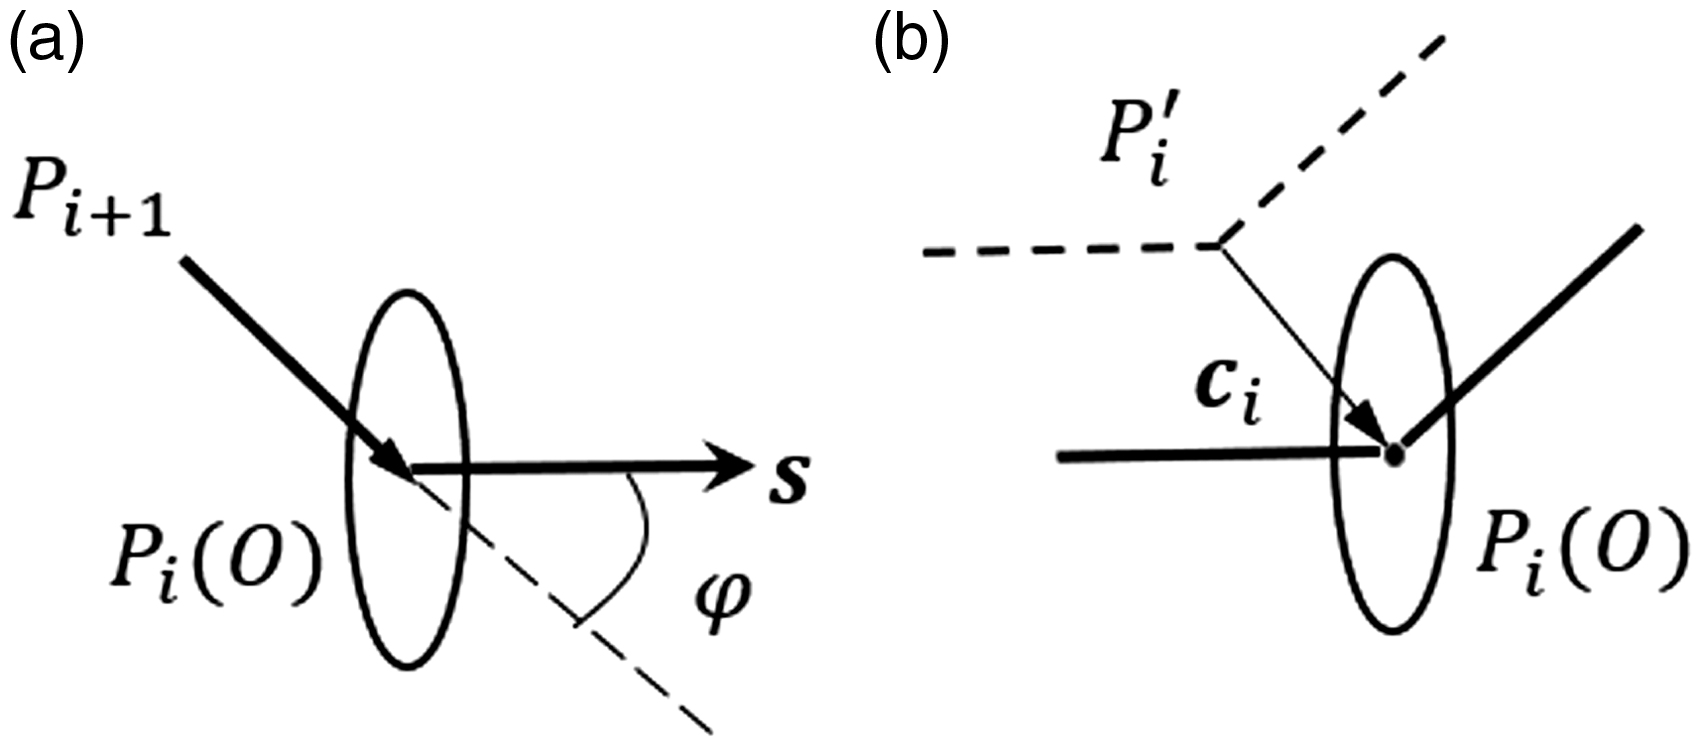
Schematic diagram of discrete mandrel angle change.
The derivation and calculation of vector

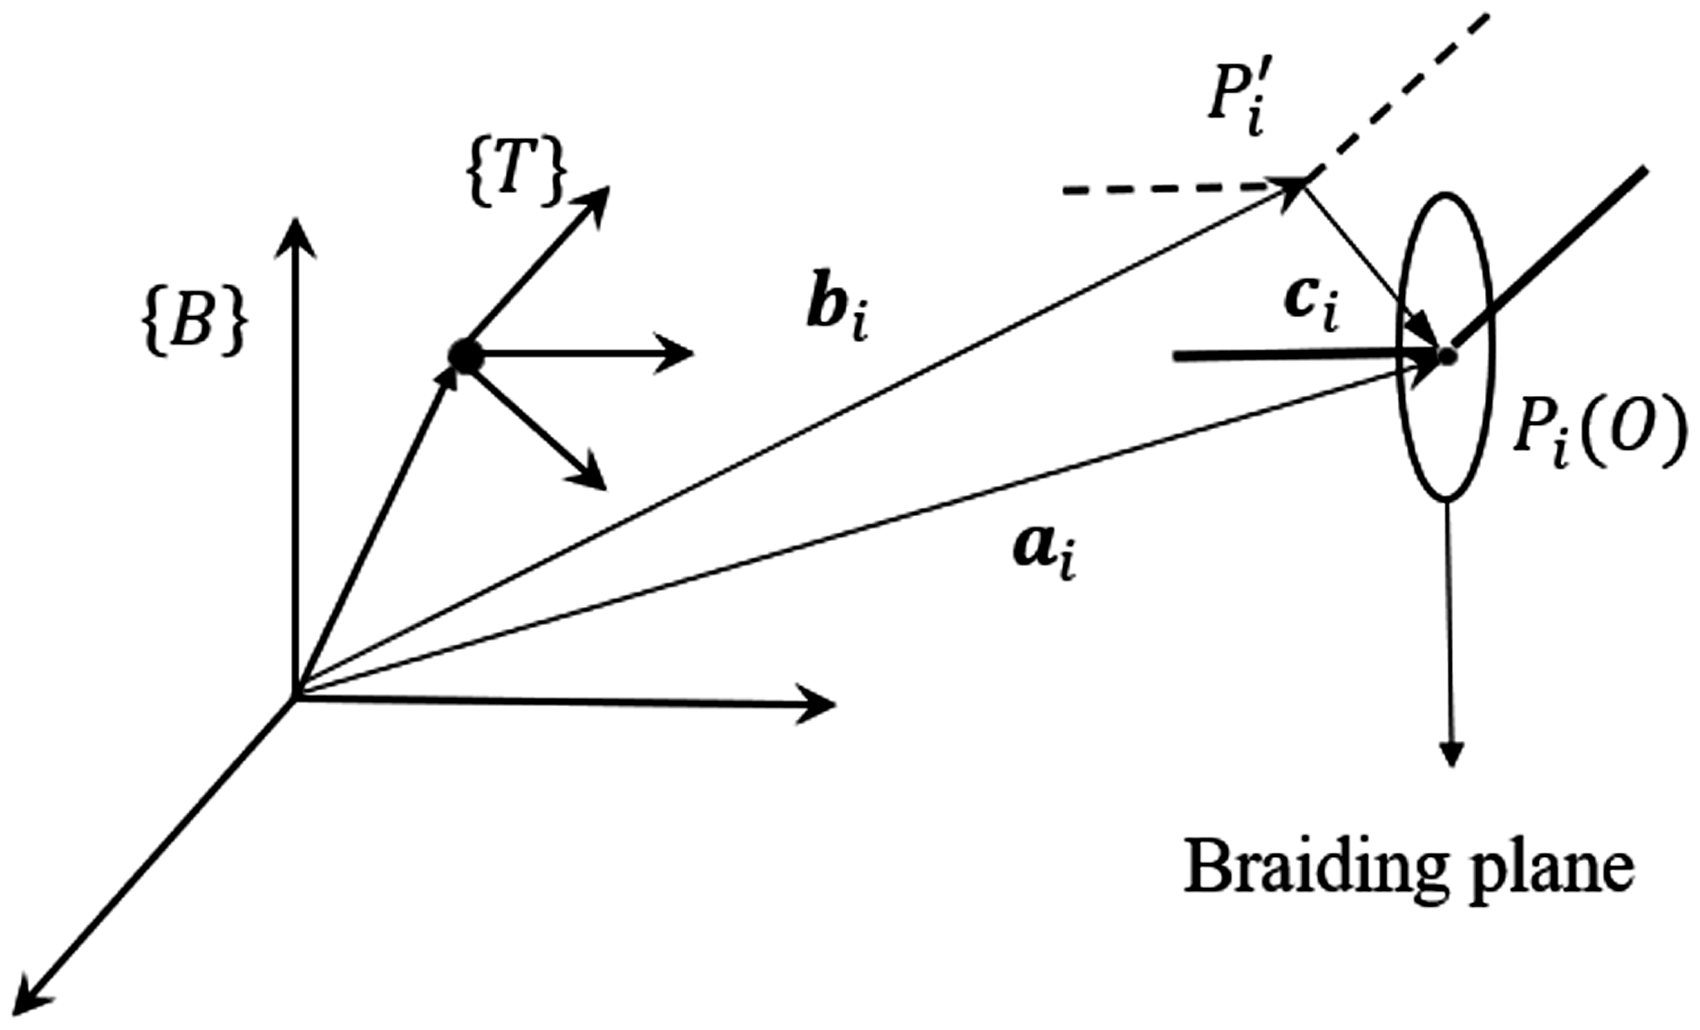
Schematic of compensation vector
According to the homogeneous transformation theory, the rotation around the tool coordinate system should be multiplied by the rotation transformation matrix to the right, and the movement along the base coordinate system should be multiplied by the transformation matrix to the left, as shown in Equation (7), where
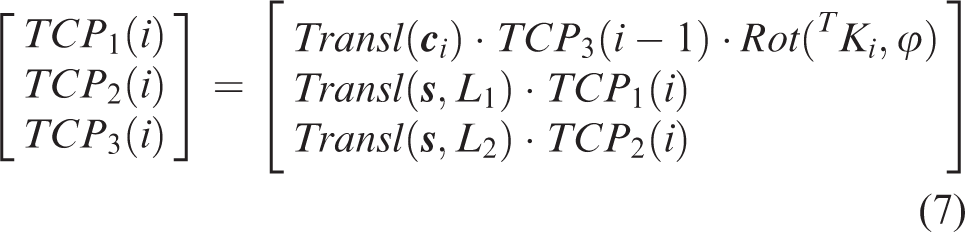
For any homogeneous transformation matrix T, the pose information can be obtained from Equations (8) and (9). The 3 × 1 vector (p) represents the position in the coordinate system, and the 3 × 3 rotation matrix (R) is an orthogonal matrix; therefore, although the rotation matrix (R) has nine elements, there are only three independent elements. Therefore, three parameters are usually used to represent an attitude, and the representation method usually uses fixed angles or Euler angles; these two methods correspond to each other, such as the XYZ fixed angle and the ZYX Euler angle, where α, β, and γ are calculated as shown in Equation (9).


It can be seen from the equations above that for an arbitrary pose homogeneous transformation matrix, the current position and attitude can be represented by six parameters:
Speed and time control during braiding
Ideal hypothesis and braiding theory
The proposed method is based on the following assumptions for the braiding model of a spatially curved profiled mandrel:
Since the thickness of the single-layer yarn is too small compared with the diameter of the mandrel, it is ignored. The effect of friction between the yarn and braided guide ring is ignored; therefore, the yarn is not bent in the convergence area. During the braiding process, the yarn and mandrel do not slide relative to each other, and the yarn and the surface of the mandrel are completely fitted. The effects of motor-induced vibrations during braiding are ignored.
It can be deduced from the two-dimensional braiding theory that the braiding process is controlled by the kinematic relationship,
12
and there is a mutual kinematic relationship among the rotation speed (ω) of the yarn carrier, steady-state pulling speed (V) of the mandrel, radius (r) of the mandrel, and steady-state braiding. Angle θ is related
7
to these parameters by Equations (10) and (11):

Equation (11) can be derived from Equation (10):

It can be seen from Equation (12) that there is a theoretical braiding distance (h), that is, the straight-line distance from the center point of the convergence area to the center point of the guide ring, in the braiding process of any segment of the mandrel. The theoretical value of the i-th segment is as follows. As shown in Equation (12), because it is inconvenient to adjust h by translation during the braiding process, it is very important to choose an appropriate actual braiding distance, and this is done using Equations (12) and (13), through which coordinates of


Adjust braiding speed to compensate braiding angle
The process of using a robot to adjust the convergence length in real time is complicated because the rotary motor of the braiding machine works continuously and cannot be interrupted during the braiding process; thus, the traction robot adjusts the braiding distance (h) by translation before braiding each section. Therefore, the braiding angle can only be compensated by changing the traction speed of the robot.
From Equation (11), it can be seen that the robot traction speed (


According to the braiding theory, the pulling speed can be decomposed into two speeds: the pulling speed of the ongoing yarn (

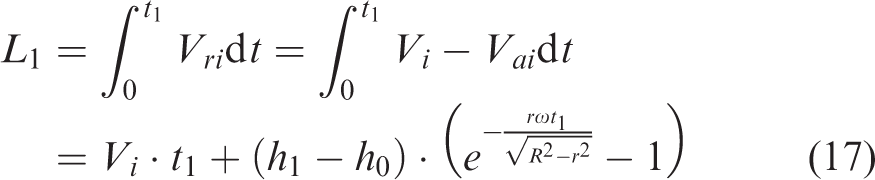
The derivation of in Equation (17) is too cumbersome and will not be presented in this article, similar to Equation (18).
The braiding process transitions from an unstable state to a stable state. Therefore, at this time,

Considering the assumptions for the previous model, this constraint is justified. However, when the actual situation does not fully meet the assumption, that is, when the condition of this segment of the mandrel does not satisfy constraint condition
Braiding angle detection of fabric surface based on machine vision
Braiding angle visual inspection process
For the collected fabric surface images, choosing an appropriate image processing method can reduce the measurement error of the braiding angle and improve detection accuracy. Figure 8 shows a flowchart of the visual inspection method for the braiding angle.

Braiding angle visual inspection flow chart.
Image interpolation expansion
Since composite braiding mandrels are tubular, the three-dimensional surface profile of these tubular braids must be considered when measuring braid angles from captured images. Because the distance between the camera acquisition plane (i.e. the imaging plane) and the outer surface of the cylinder is not constant, the fiber orientation in the image is distorted, resulting in projection errors.
To reduce the projection error, Hunt and Carey 5 performed a two-step reduction of the perspective error. The first step is to crop and remove the severely distorted area of the image and obtain the region of interest, and the second step is to interpolate the image of the region of interest to restore the image to a state close to the real state.
Perspective error increases significantly with distance from the centerline of the mandrel, and by removing these parts of the image, the accuracy of the braided angle in the image can be improved.
There are three main methods for image interpolation: nearest neighbor interpolation, bilinear interpolation, and bicubic interpolation. Bilinear interpolation is a commonly used method, in which the four nearest neighbor positions are used to estimate the gray level of a given position. Let

The four coefficients of the above equation can be determined by the unknown equation written using the four nearest neighbors of point
To complete the image unwrapping, the geometric relationship shown in Figure 9 was used, which relates the projected position of point d on the tubular surface and its unwrapped arc length (l) to the radius (r) and circumferential angle (α) of the tubular surface.
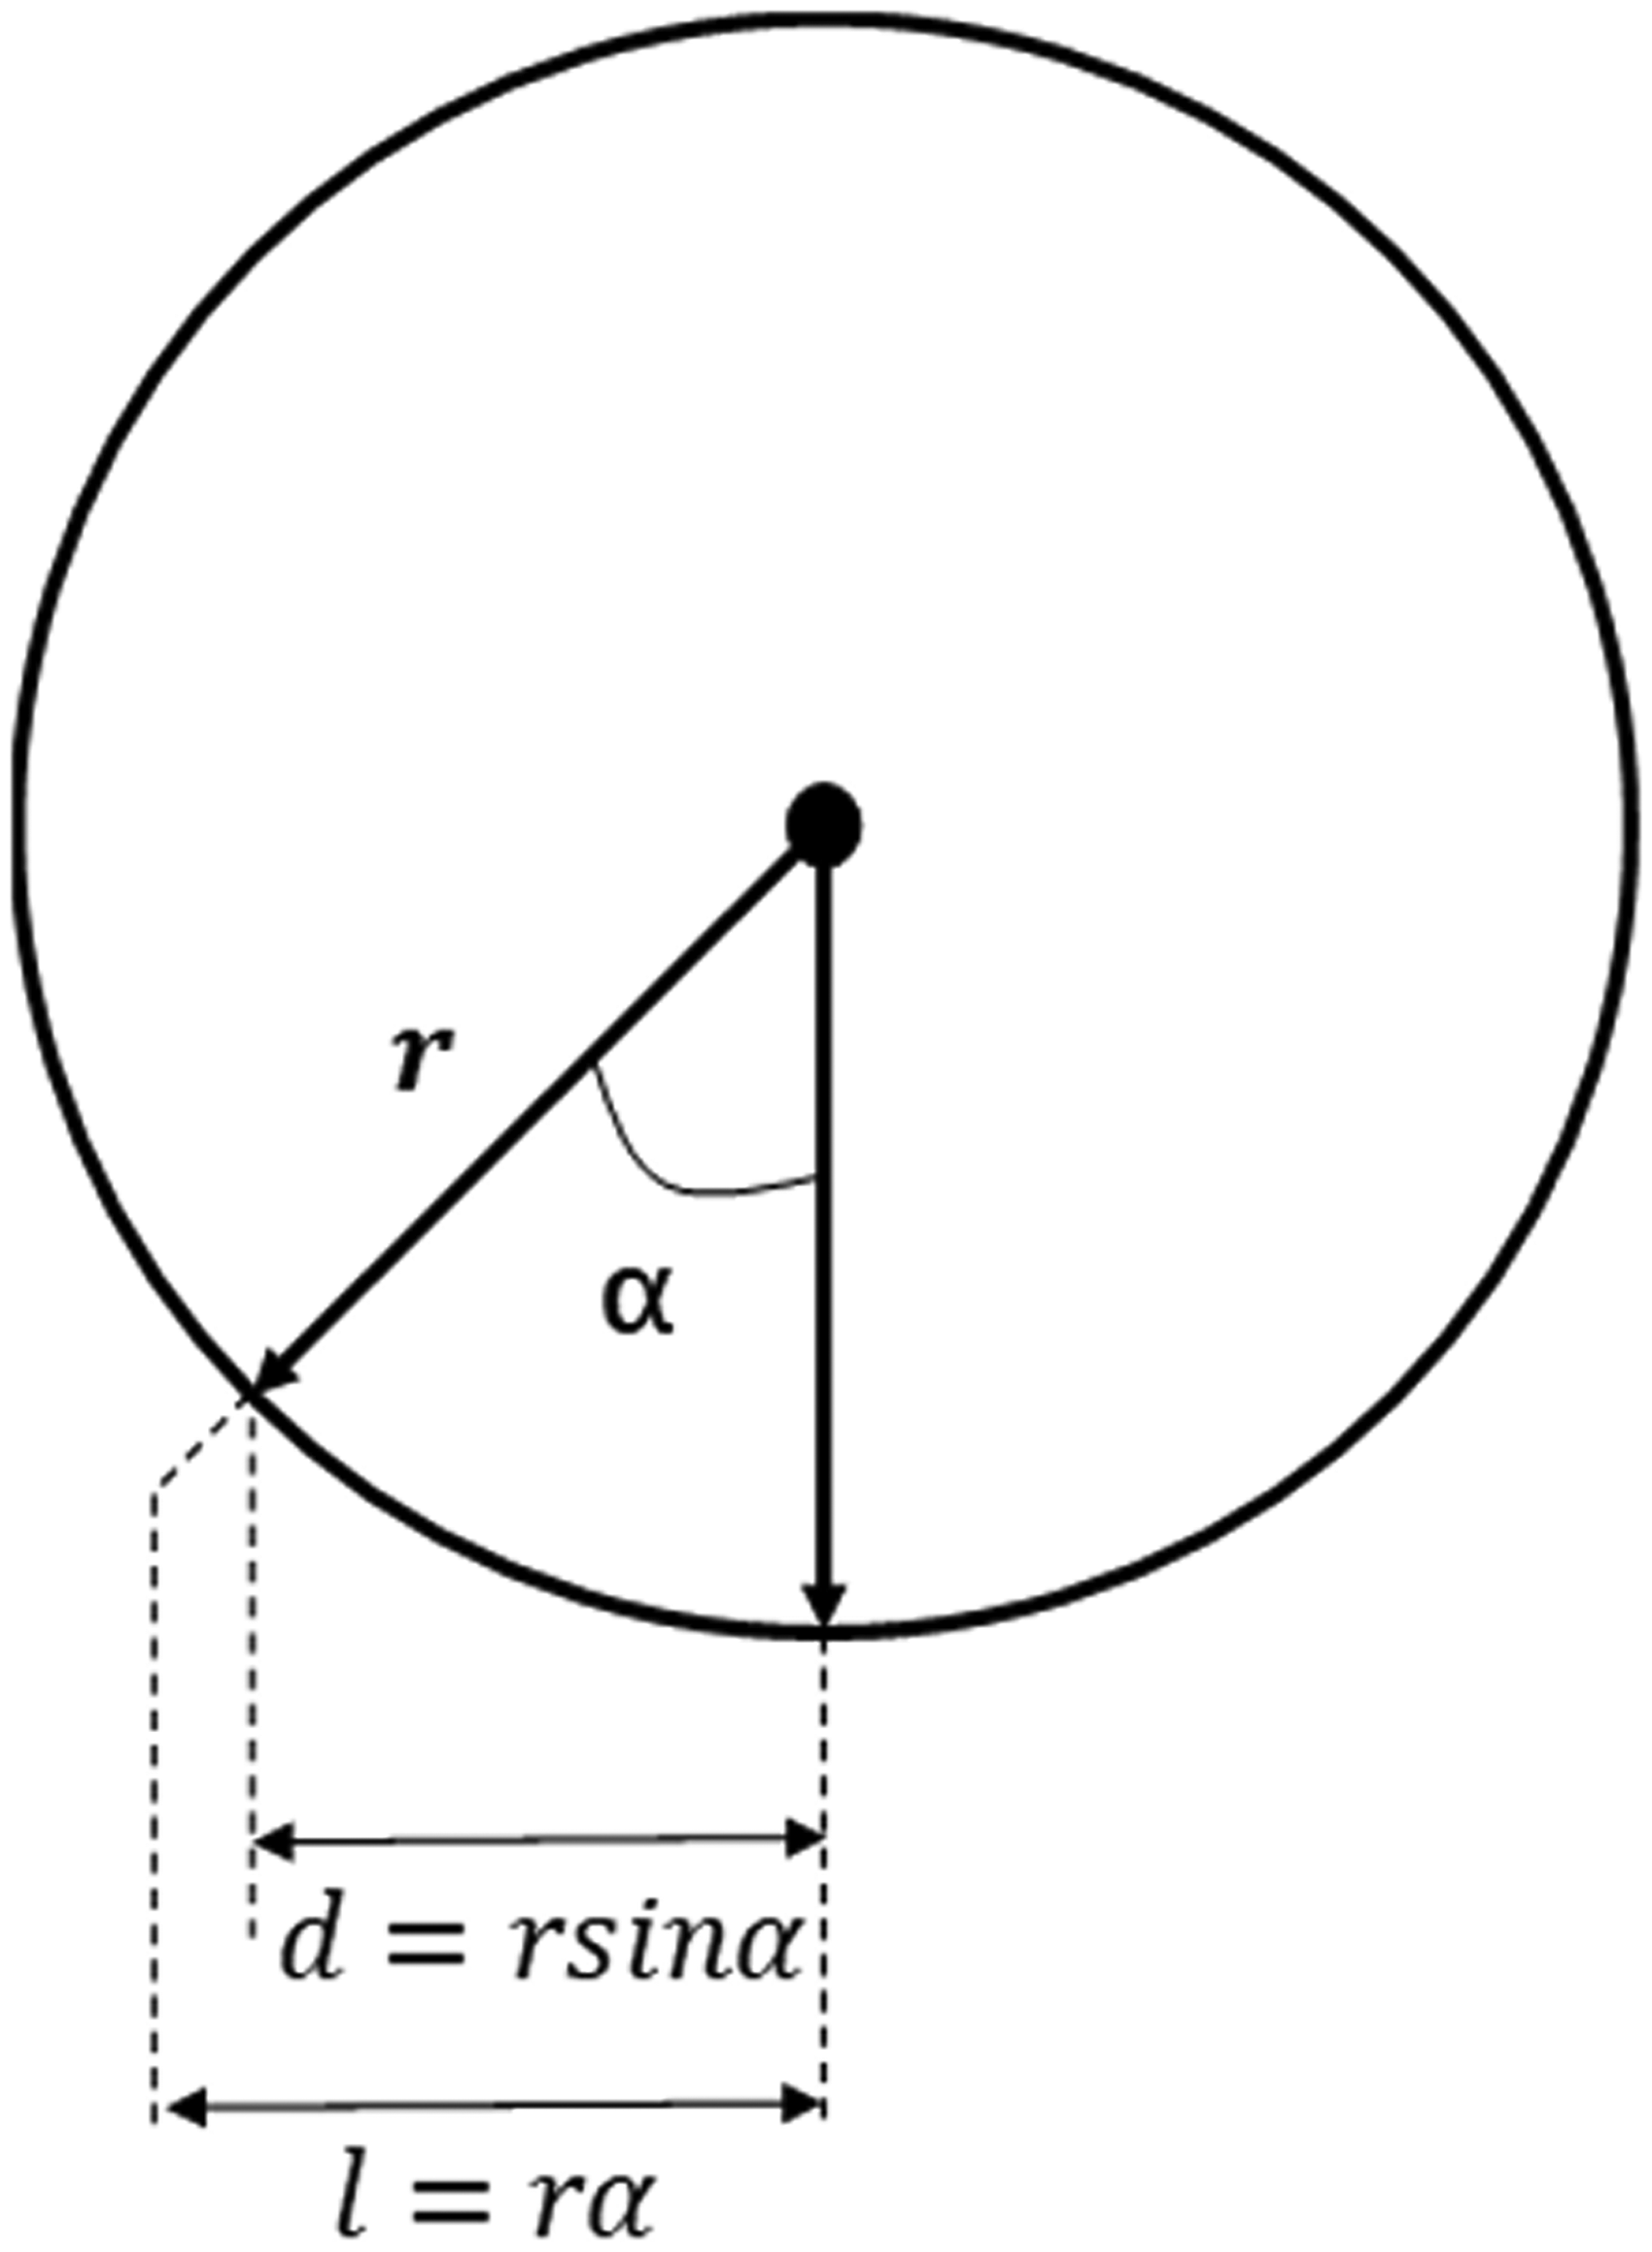
Tubular braid surface projection.
The key parameter in this method is the circumference angle of the tubular surface, which determines the number of unwrapped surfaces. As this angle increases, a large amount of data must be interpolated to smooth the sharp edges in the image. By comparing the distance between the projected position (d) and its corresponding unwrapped arc length (l), the pixel can be replaced with the difference between the projected and unwound lengths. This method provides better computational frequency-domain performance compared to nearest-neighbor interpolation and reduces the computational time compared to bicubic interpolation.

As shown in Figure 9, r is the radius of the mandrel and α is the included angle of the cropped region of interest. Equation (20) is the derivation of the horizontal interpolation multiple, (l) is the actual arc length, (d) is the image projection distance, and (n) is the horizontal interpolation multiple, which is the ratio of the actual arc length to the image projection distance.
Figure 10 shows the effect of selecting the region of interest from the braided picture and cropping it to 50% of the original width. Figure 10(a)–(c) images show the picture display of this step; Figure 10(d) passes the region of interest through the resulting plot after linear interpolation expansion.
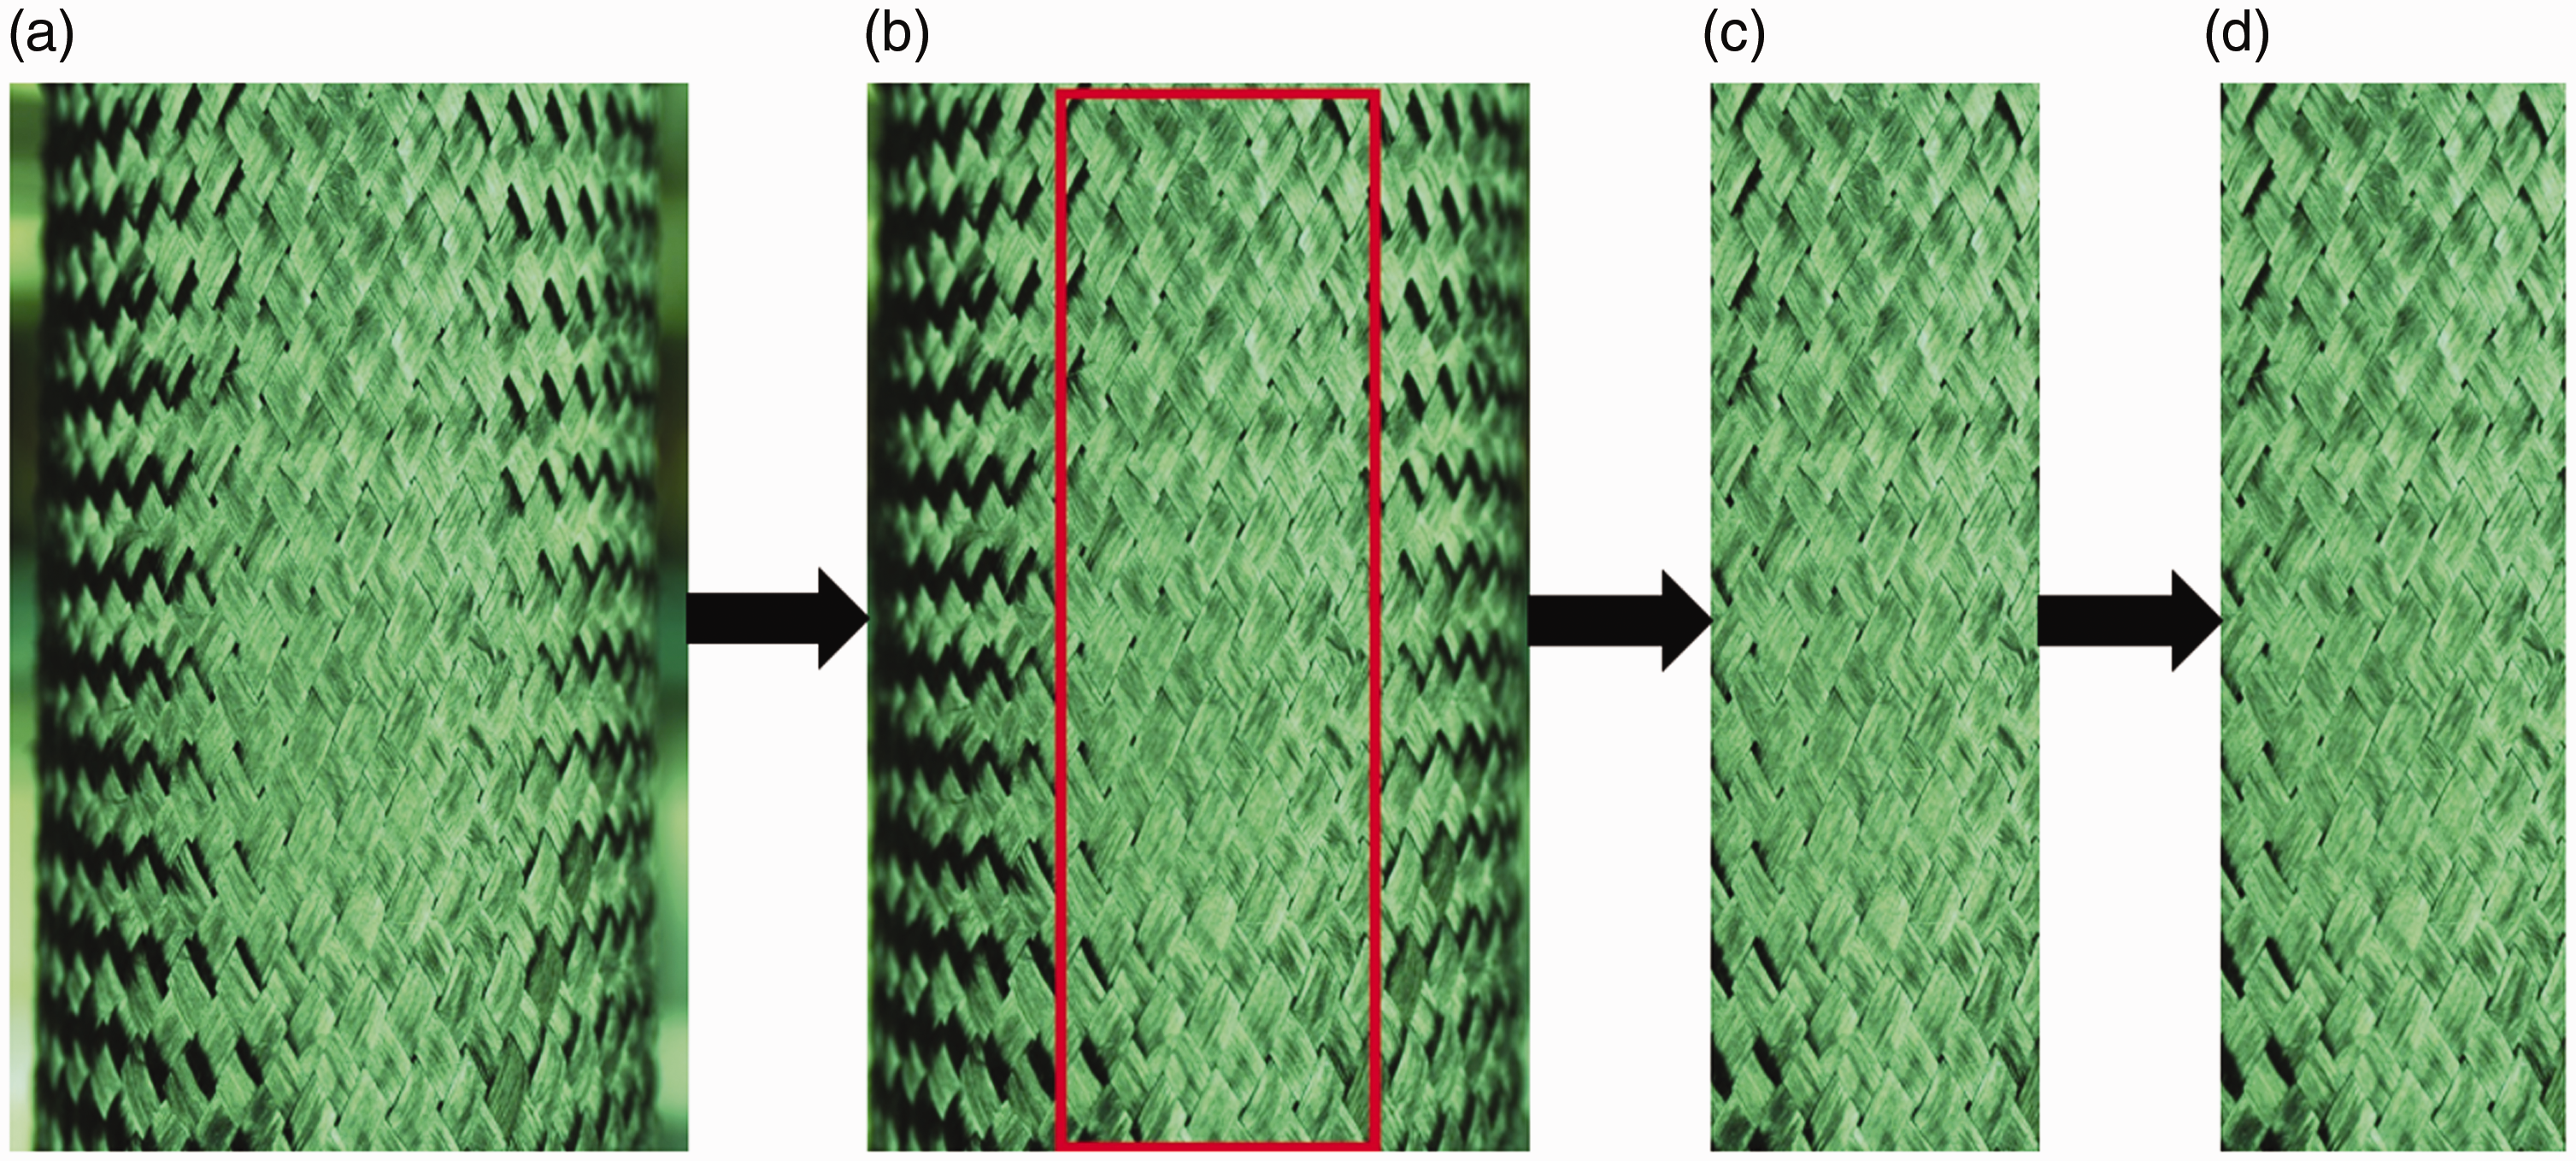
Interpolation method to expand the region of interest process. (a) Braid pictures; (b) region of interest; (c) crop region of interest and (d) interpolation expansion.
Edge detection
After practice and analysis, edge detection was chosen to remove the influence of interfering fibers. Edge detection is a common method used for segmenting images based on grayscale mutations.
The edge of the image is the most significant part of the local intensity change in the image, and it also refers to the set of pixels around the image that have a step-like change in the grayscale of the pixels. This feature reflects a discontinuity in the image characteristics. The key step in the image preprocessing step is edge detection, and the detection result directly affects the subsequent image feature extraction and image processing. Common edge detection operators are the Roberts, Sobel, Prewitt, log, and Canny operators.
Using the different operators of the above image edge detection, we used MATLAB to perform edge detection on the braided image in the spatial domain and to analyze the results. After observation and analysis, it was found that the results obtained by the Sobel, Roberts, and Prewitt operators as edge detection operators are more in line with the image required for measuring the braiding angle; the Canny, Gaussian Canny, and log operators were used as edge detection operators. The image obtained by the detection operator cannot highlight the edge lines required by the braided corner because of the large number of details. Because the Sobel, Roberts, and Prewitt operators are all judged and identified based on the first derivative, partial derivative, or gradient, while the Canny, Gaussian Canny, and Log operators are more advanced operators and are identified based on the second derivative and partial derivative. The above situation shows that edge detection that is too detailed for the detection of the braiding angle will lead to the failure to find the edge lines required for measuring the braiding angle, whereas the edge detection operator based on the first derivative can better find the edge lines required for measuring the braiding angle. Therefore, it is the area to be studied to propose a better edge detection operator suitable for braiding angle detection.
The calculation speeds of the Sobel, Roberts, and Prewitt operators are not significantly different, but the Sobel operator template can better suppress noise. Based on this characteristic, the Sobel operator was finally selected for edge detection. In order to make the image easier to observe, grayscale inversion transformation was performed on the grayscale image after edge detection, and the final grayscale transformation result is shown in Figure 11(a).
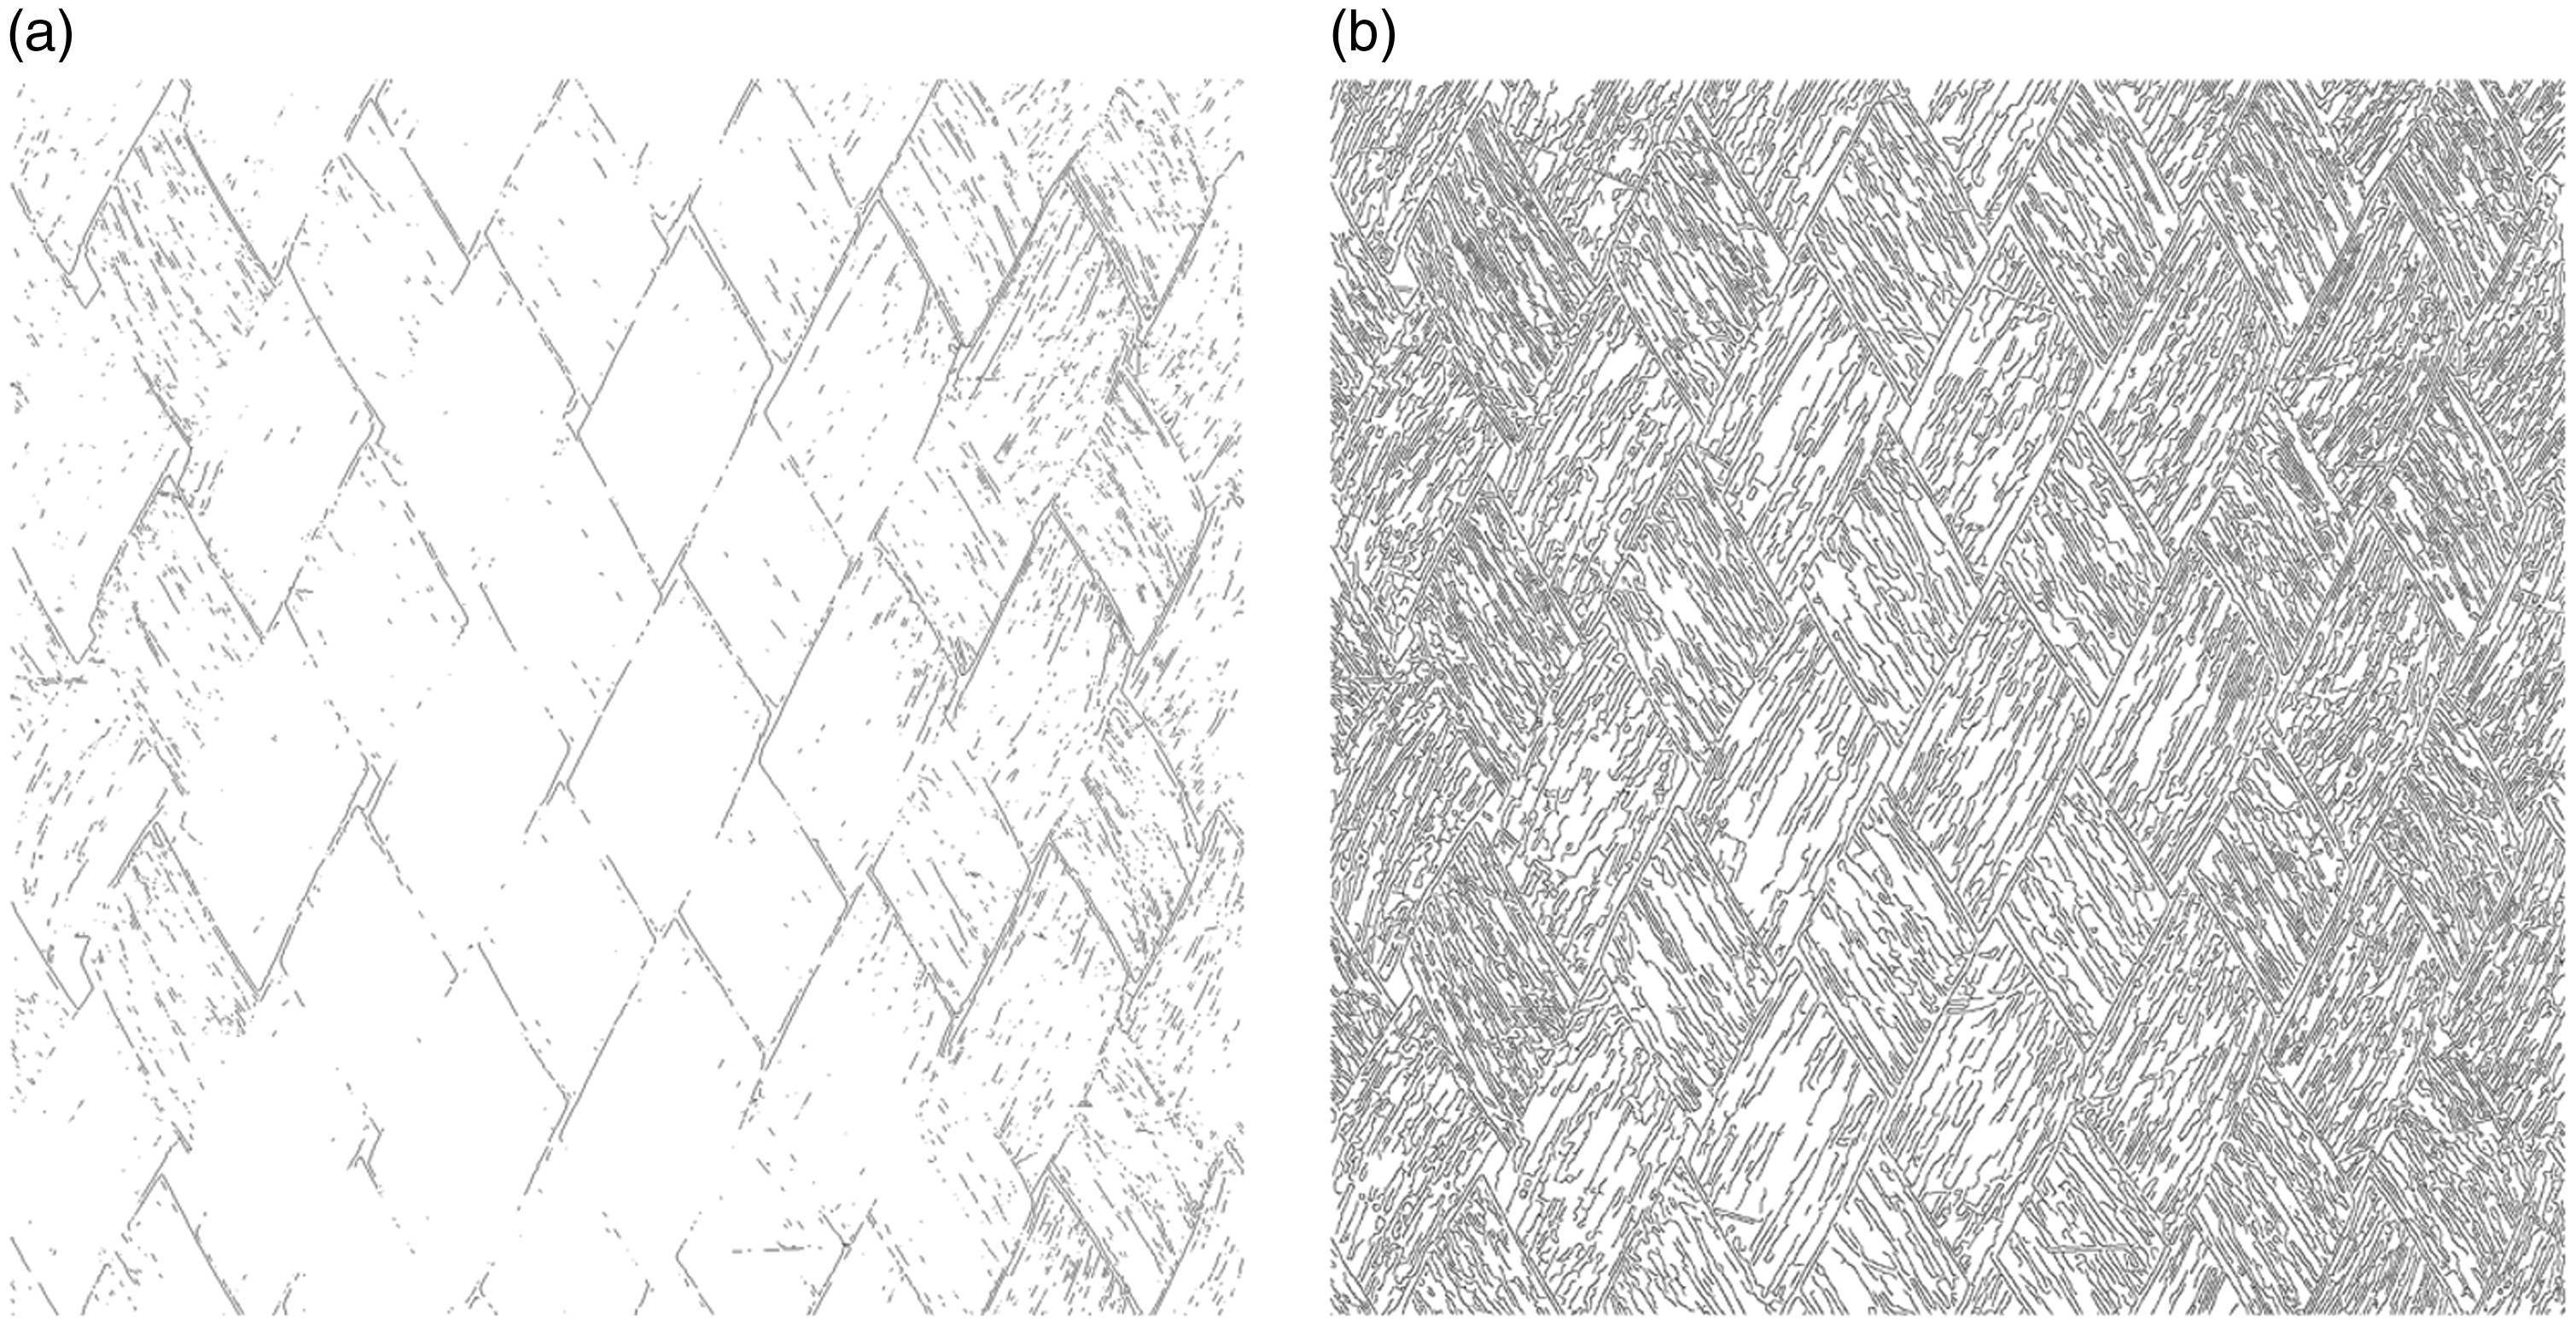
Comparison of edge detection using different edge detection operators. (a) First derivative operator and (b) second derivative operator.
Subsequently, a two-dimensional discrete Fourier transform (2D-DFT) transformation was performed on the spatial domain image after edge detection to obtain the corresponding frequency domain image. After the actual operation comparison, it was found that the operation effect significantly improved.
Fiber braiding angle detection method based on 2D-DFT
2D-DFT was used as the main image processing technique to extract the information of the fiber orientation angle from the acquired images. The physical meaning of the Fourier transform is to transform the gray distribution function of the fiber preform fabric image into the corresponding frequency distribution function. This function is transformed into a gray distribution function. The image frequency represents the gradient and direction of pixel changes in a spatial image; high frequencies represent sudden changes in pixel gray values, and low frequencies represent regions with constant gray values. For a square spectrogram, the angular orientation of the edges in the spatial-domain image corresponds to the angular orientation of the features in the frequency domain. Using this property of the 2D-DFT of image processing, the braiding angle can be measured.
Equations (21) and (22) the forward and inverse transform equations for discrete Fourier transforms that allow the transformation of an image of size M×N with pixel intensity values


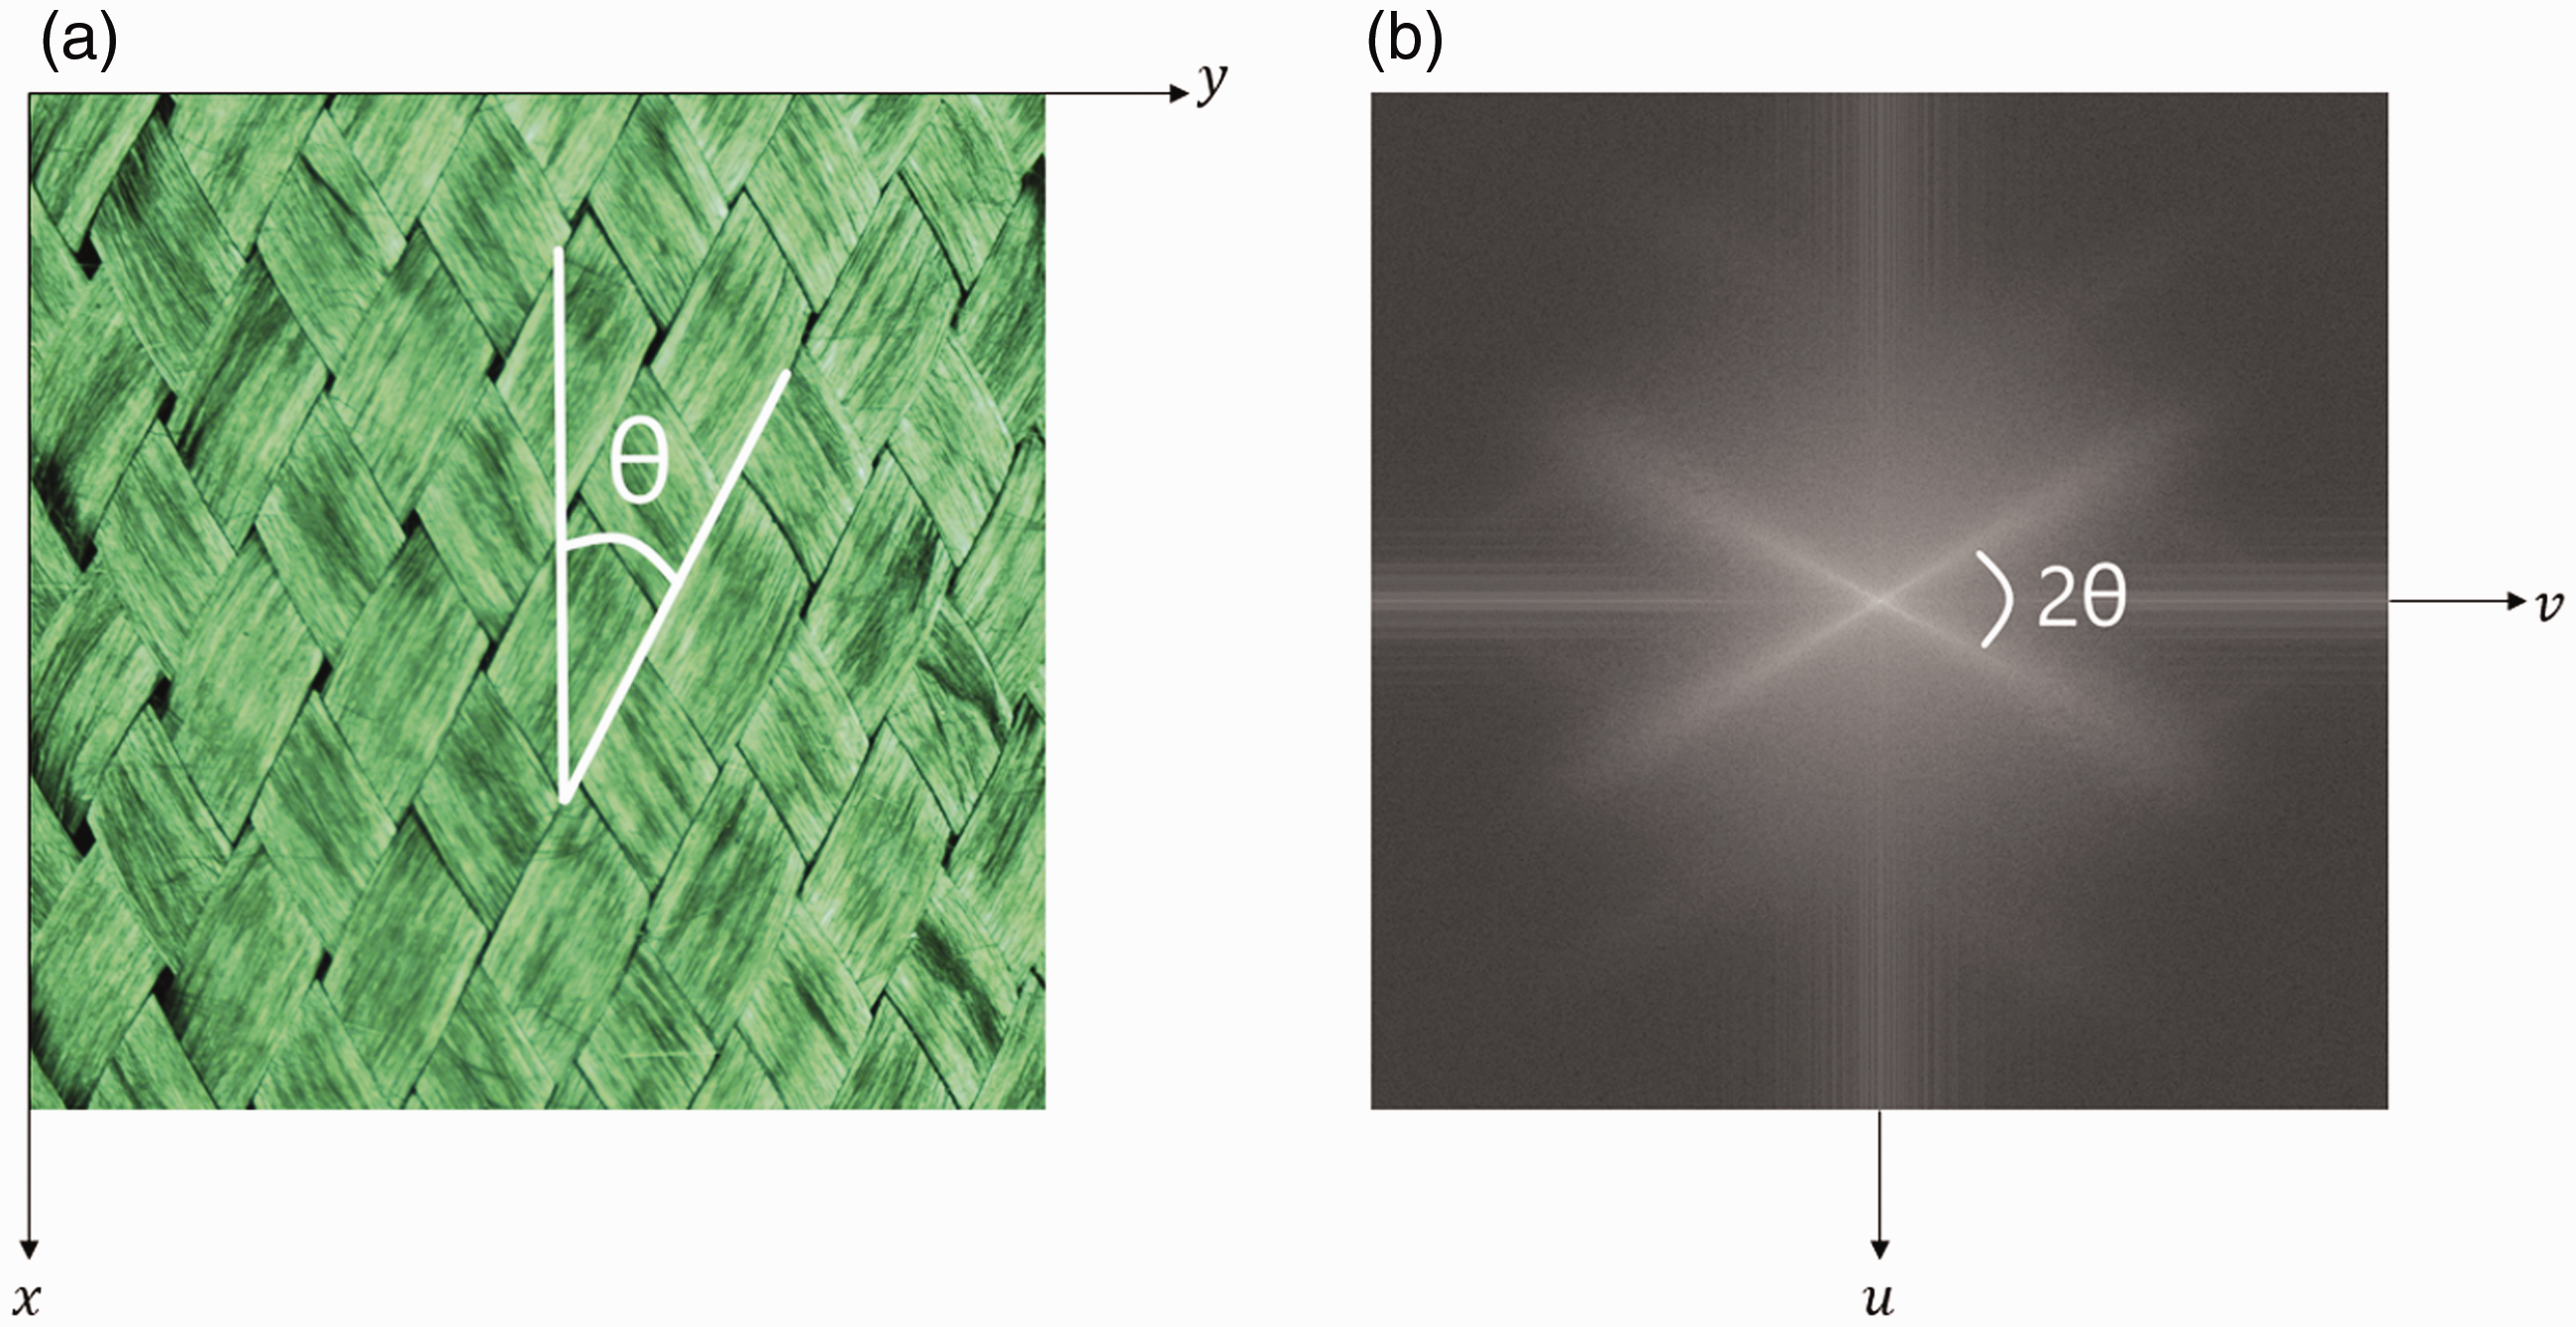
The relationship of the angle between the spatial domain (a) and frequency domain images (b).
It is a key step to intercept a square space domain image and perform a 2D-DFT transform to obtain a frequency-domain image. Figure 12(a) shows the spatial image and its braiding angle, and Figure 12(b) shows the frequency-domain image obtained after 2D-DFT of the image in the spatial domain and its annotated braiding angle.
As shown in Figure 12(b), the two optical fiber straight lines with a cross angle of 2θ are the key lines for calculating the braiding angle, whereas the horizontal and vertical optical fiber straight lines are the interference straight lines that affect the calculation of the braiding angle. The impact of the braid-angle calculation is critical.
Discrete angle mean grayscale braiding angle detection algorithm
Two lines in the same direction in real space coincide in the frequency domain image, regardless of how far apart they are. Because the fiber orientation is the only consideration in this algorithm, it is a critical feature.
Figure 12 shows a 2D-DFT image of the braided structure. As shown in the 2D-DFT image, the two main fiber bundle orientations in real space were transformed into two lines passing through the center of the frequency-domain image of the 2D-DFT, each perpendicular to the original corresponding fiber orientation. The lines are dispersed, which is related to the distribution of the fiber directions.
To solve these problems, this study combines the theory of Hunt and Carey5,21 to propose a straight-line average gray-level algorithm to obtain the discrete angle mean grayscale level distribution and then obtain the braiding angle. A line segment was drawn to connect the center pixel of the 2D-DFT image with one of its edge pixels, and the average pixel intensity was calculated for all the pixels touching this line segment. With one end of the line fixed at the center, the line segment was rotated and swept through 180° (as shown in Figure 13) until half a cycle was completed (owing to the symmetry of the 2D-DFT image, only half a cycle must be scanned). The angle between the maximum values of the two obtained average gray levels was twice the braiding angle, as shown in Figure 12(b).

Schematic diagram of discrete angle mean grayscale algorithm.
The maximum value in the gray distribution of the mean value of each angle corresponds to the pulling direction of the main fiber bundle in the actual space. The scanning line width and each scanning increment are two important parameters for representing the calculation accuracy of the braiding angle, while for the gray scale, the average value is the weighted average value of the gray values of the pixel points within the line segment where each angle is located. Because multiple fiber directions are associated with the braided structure, the rotation angle average grayscale algorithm searches for the specified direction and sequence. It searches for the discrete mean grayscale of all angles and repeats this process until all the specified fiber bundle directions are obtained, determines the two maxima (first and second maxima), and calculates the regional average braid angle. No human intervention is required in this image-processing step because of the use of the relative mean grayscale.
To calculate the average gray value in the straight-line area, it was necessary to traverse 180°, and the angle that increased each time the average gray value of the straight line was calculated is called the angular resolution. As shown by

Another important point to note is that the coordinate system in the image is not the same as that used to calculate the average grayscale of the line. The coordinate system of the image is shown in the
The Bresenham line-drawing algorithm is the most widely used line-generation algorithm in computer graphics. In the process of calculating the best compression point of the line, all integer operations are performed; thus, the calculation speed can be greatly improved. Assuming a straight line from the starting point
Taking quadrant 1a as an example, the remaining seven quadrants can be generated by centrosymmetric and axisymmetric methods on the straight line in quadrant 1a. As shown in Figure 14, when the line is rasterized, x is increased by one unit each time, that is,
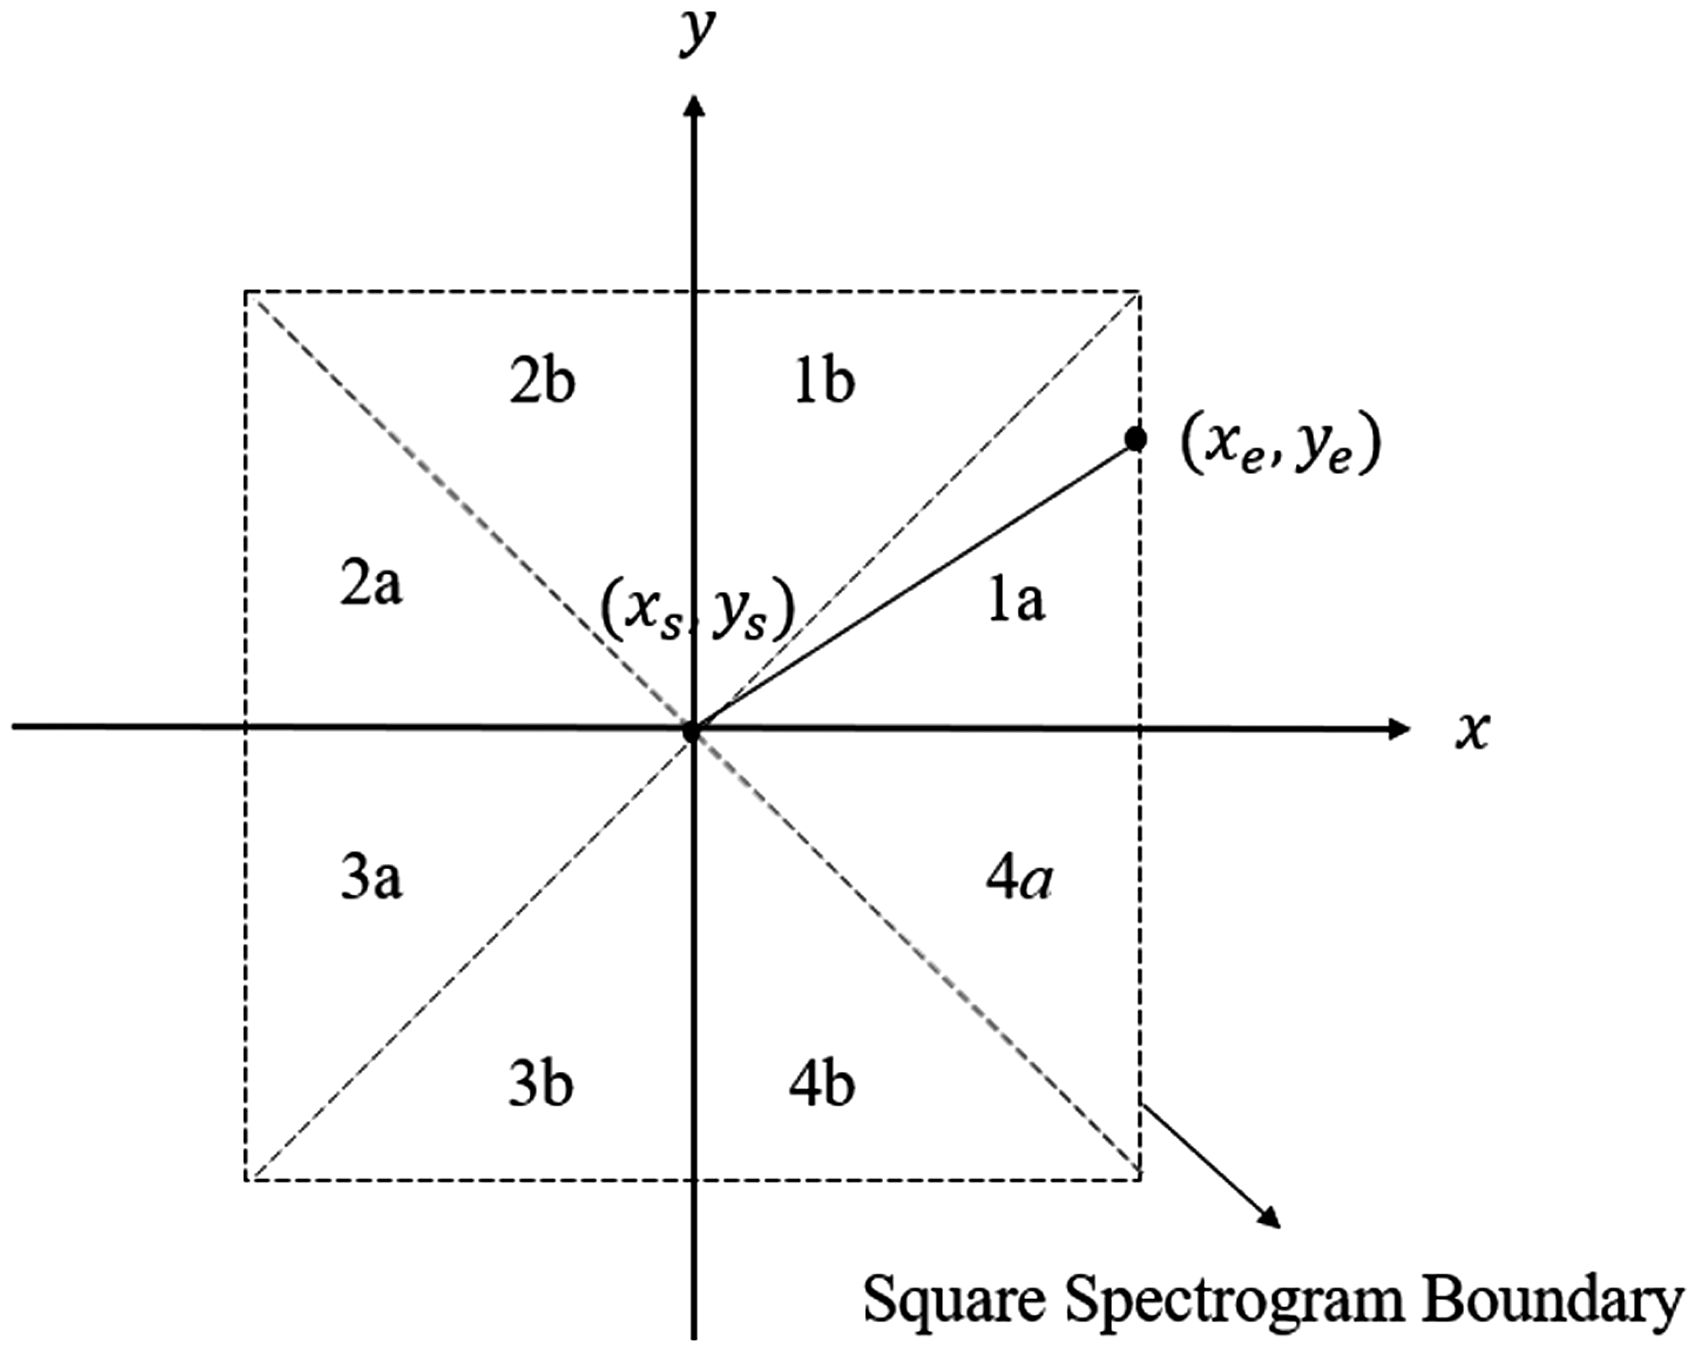
Eight quadrant distinction of square spectrogram.
The corresponding increase in y should be less than 1. As shown in Figure 15, to find the gray value of the pixel point closest to the straight line,

Step i + 1 error calculation and vertical coordinate selection.
The principle of selecting the pixel position is determined by the precise values of the distances among y and



If

For Equation (27), multiplying the left and right sides of the equation by


Substituting

Since the area represented by the pixels of a line found is too small, it is necessary to widen the width of the line segment, and the square brush method for generating the line width is selected to collect the average gray value of the line generated above and its surrounding area.
The concept of the average grayscale calculation algorithm in the 1a quadrant is shown in Figure 16.

Flowchart of discrete mean grayscale algorithm.
After the above process, the average gray value in the 1a quadrant can be obtained, and it should be noted that owing to the use of the square brush method, the boundary range of the scan must be limited, and the accumulation should be stopped when the x and y coordinates reach the boundary.
The braiding angle can be obtained by calculating the average gray value using linear scanning in the range of 180° and plotting this value with the corresponding angle, as shown in Figure 17. The braided angle can be calculated by determining the angle (in degrees) between the two maximum values. If the wire brush and angular frequency are not properly adjusted in the algorithm, the calculation accuracy may be affected or the braiding angle calculation will not be achieved.
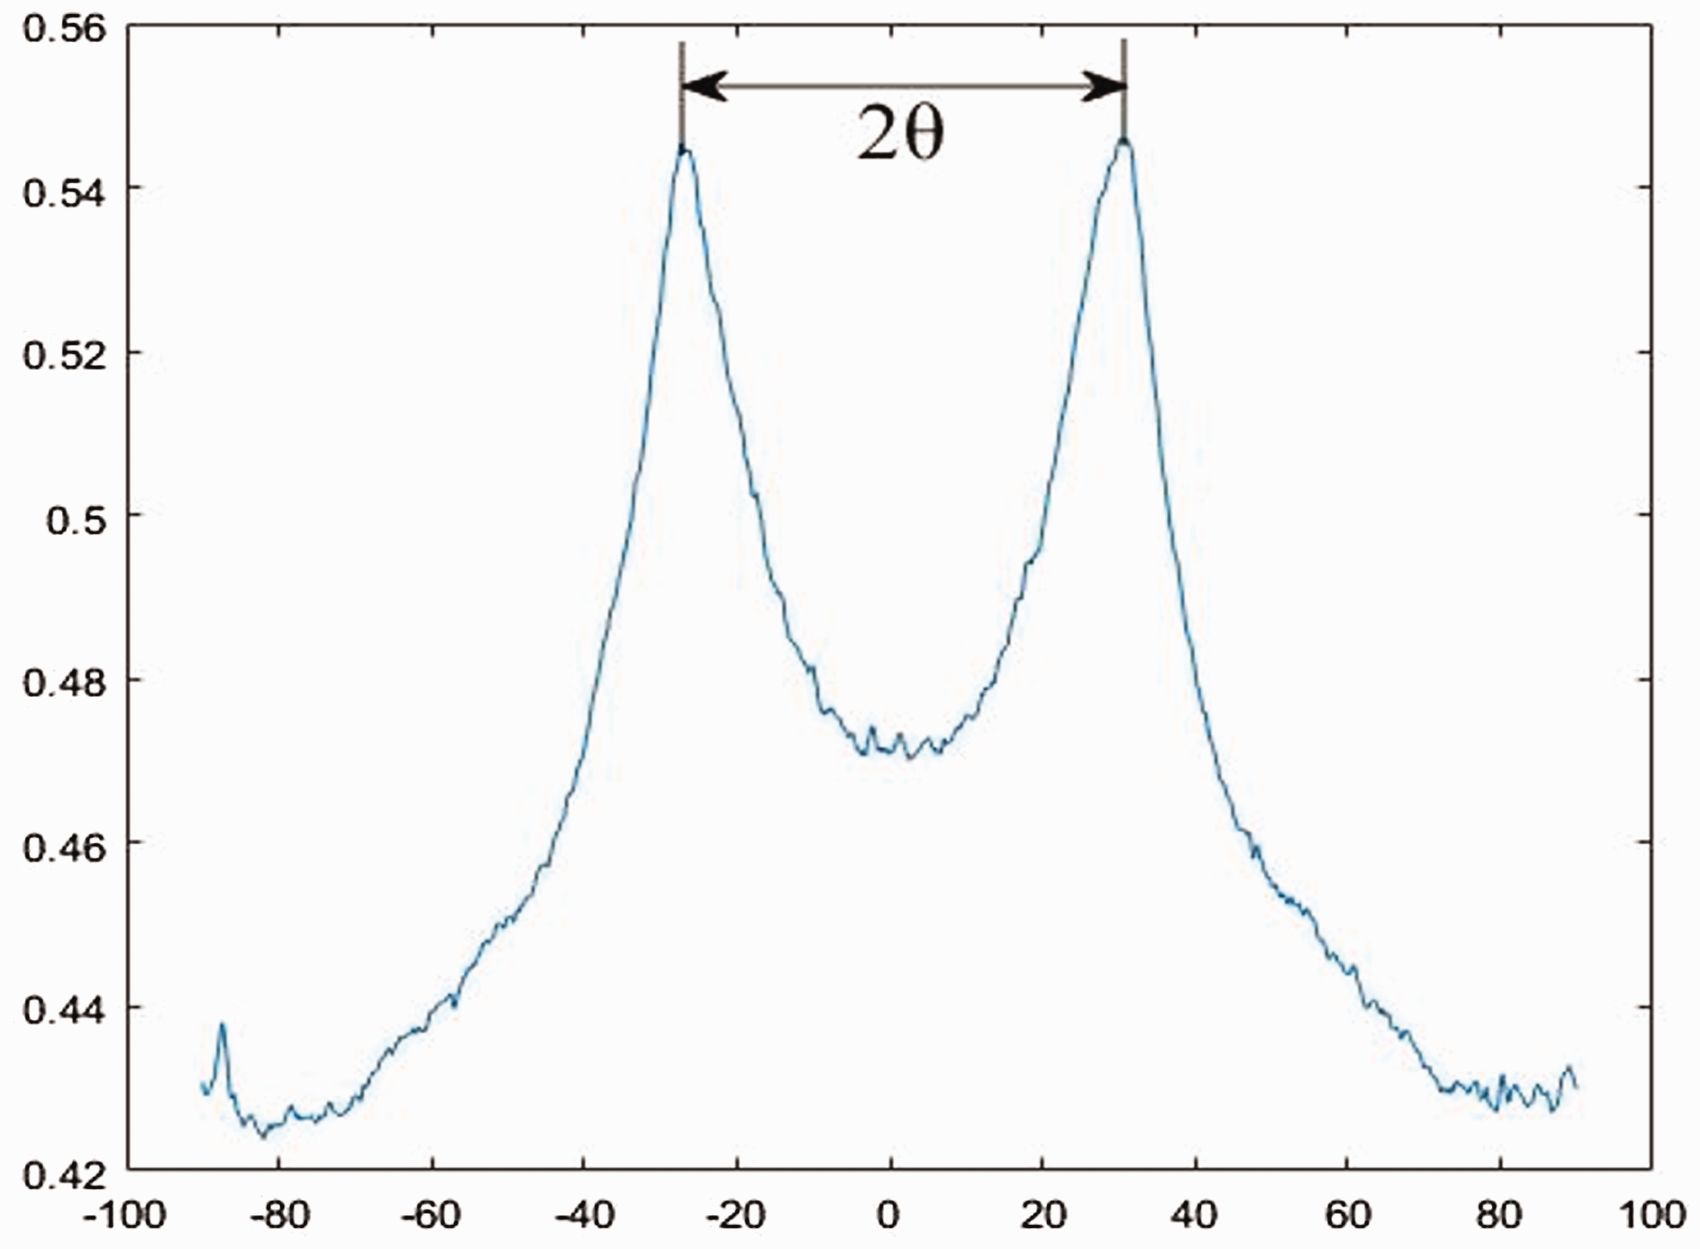
Average grayscale distribution after frequency domain map scanning.
Results and discussion
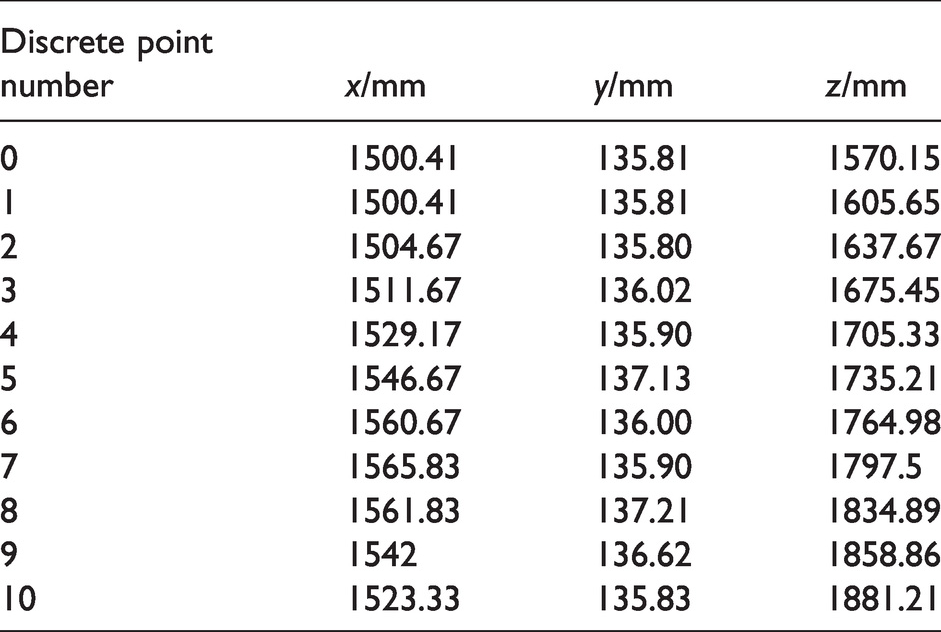
To verify the applicability of the method proposed in this study, taking a cylindrical mandrel of a special-shaped bending structure as an example, Table 1 shows the coordinates of the center points of each segment of the discrete mandrel in robot tool coordinate system {T}, where the mandrel is a variable cross-sectional elbow, the cross-sectional radius of the head end of the mandrel is 72.5 mm, and the cross-sectional radius of the tail end is 81.5 mm. The centerline of the mandrel is located in the same plane. The radius values are listed in Table 2. The equipment used in the experiment included a radial braiding machine, a six-degree-of-freedom industrial robot, and image-acquisition equipment. The radial braiding machine is an 88-gear single-ring braiding machine that includes 176 spindles, and each spindle carries a yarn bobbin for braiding. The motion system of the braiding machine included a servo motor, two vibration motors, and a controller. During the braiding process, the rotating speed of the host was 600 r/min, angular velocity (ω) of the spindle movement was 0.07 rad/s, frequency of the vibration motor was 46 Hz, image acquisition device was a CMOS sensor with a maximum exposure time of 3 ms, focal length of the lens was 50 mm, and pixels were 50 lp/mm. The on-site image-acquisition equipment is shown in Figure 18.
Discrete mandrel points in tool coordinates system
Radius size of each segment of discrete mandrel


Braiding site image acquisition equipment construction.
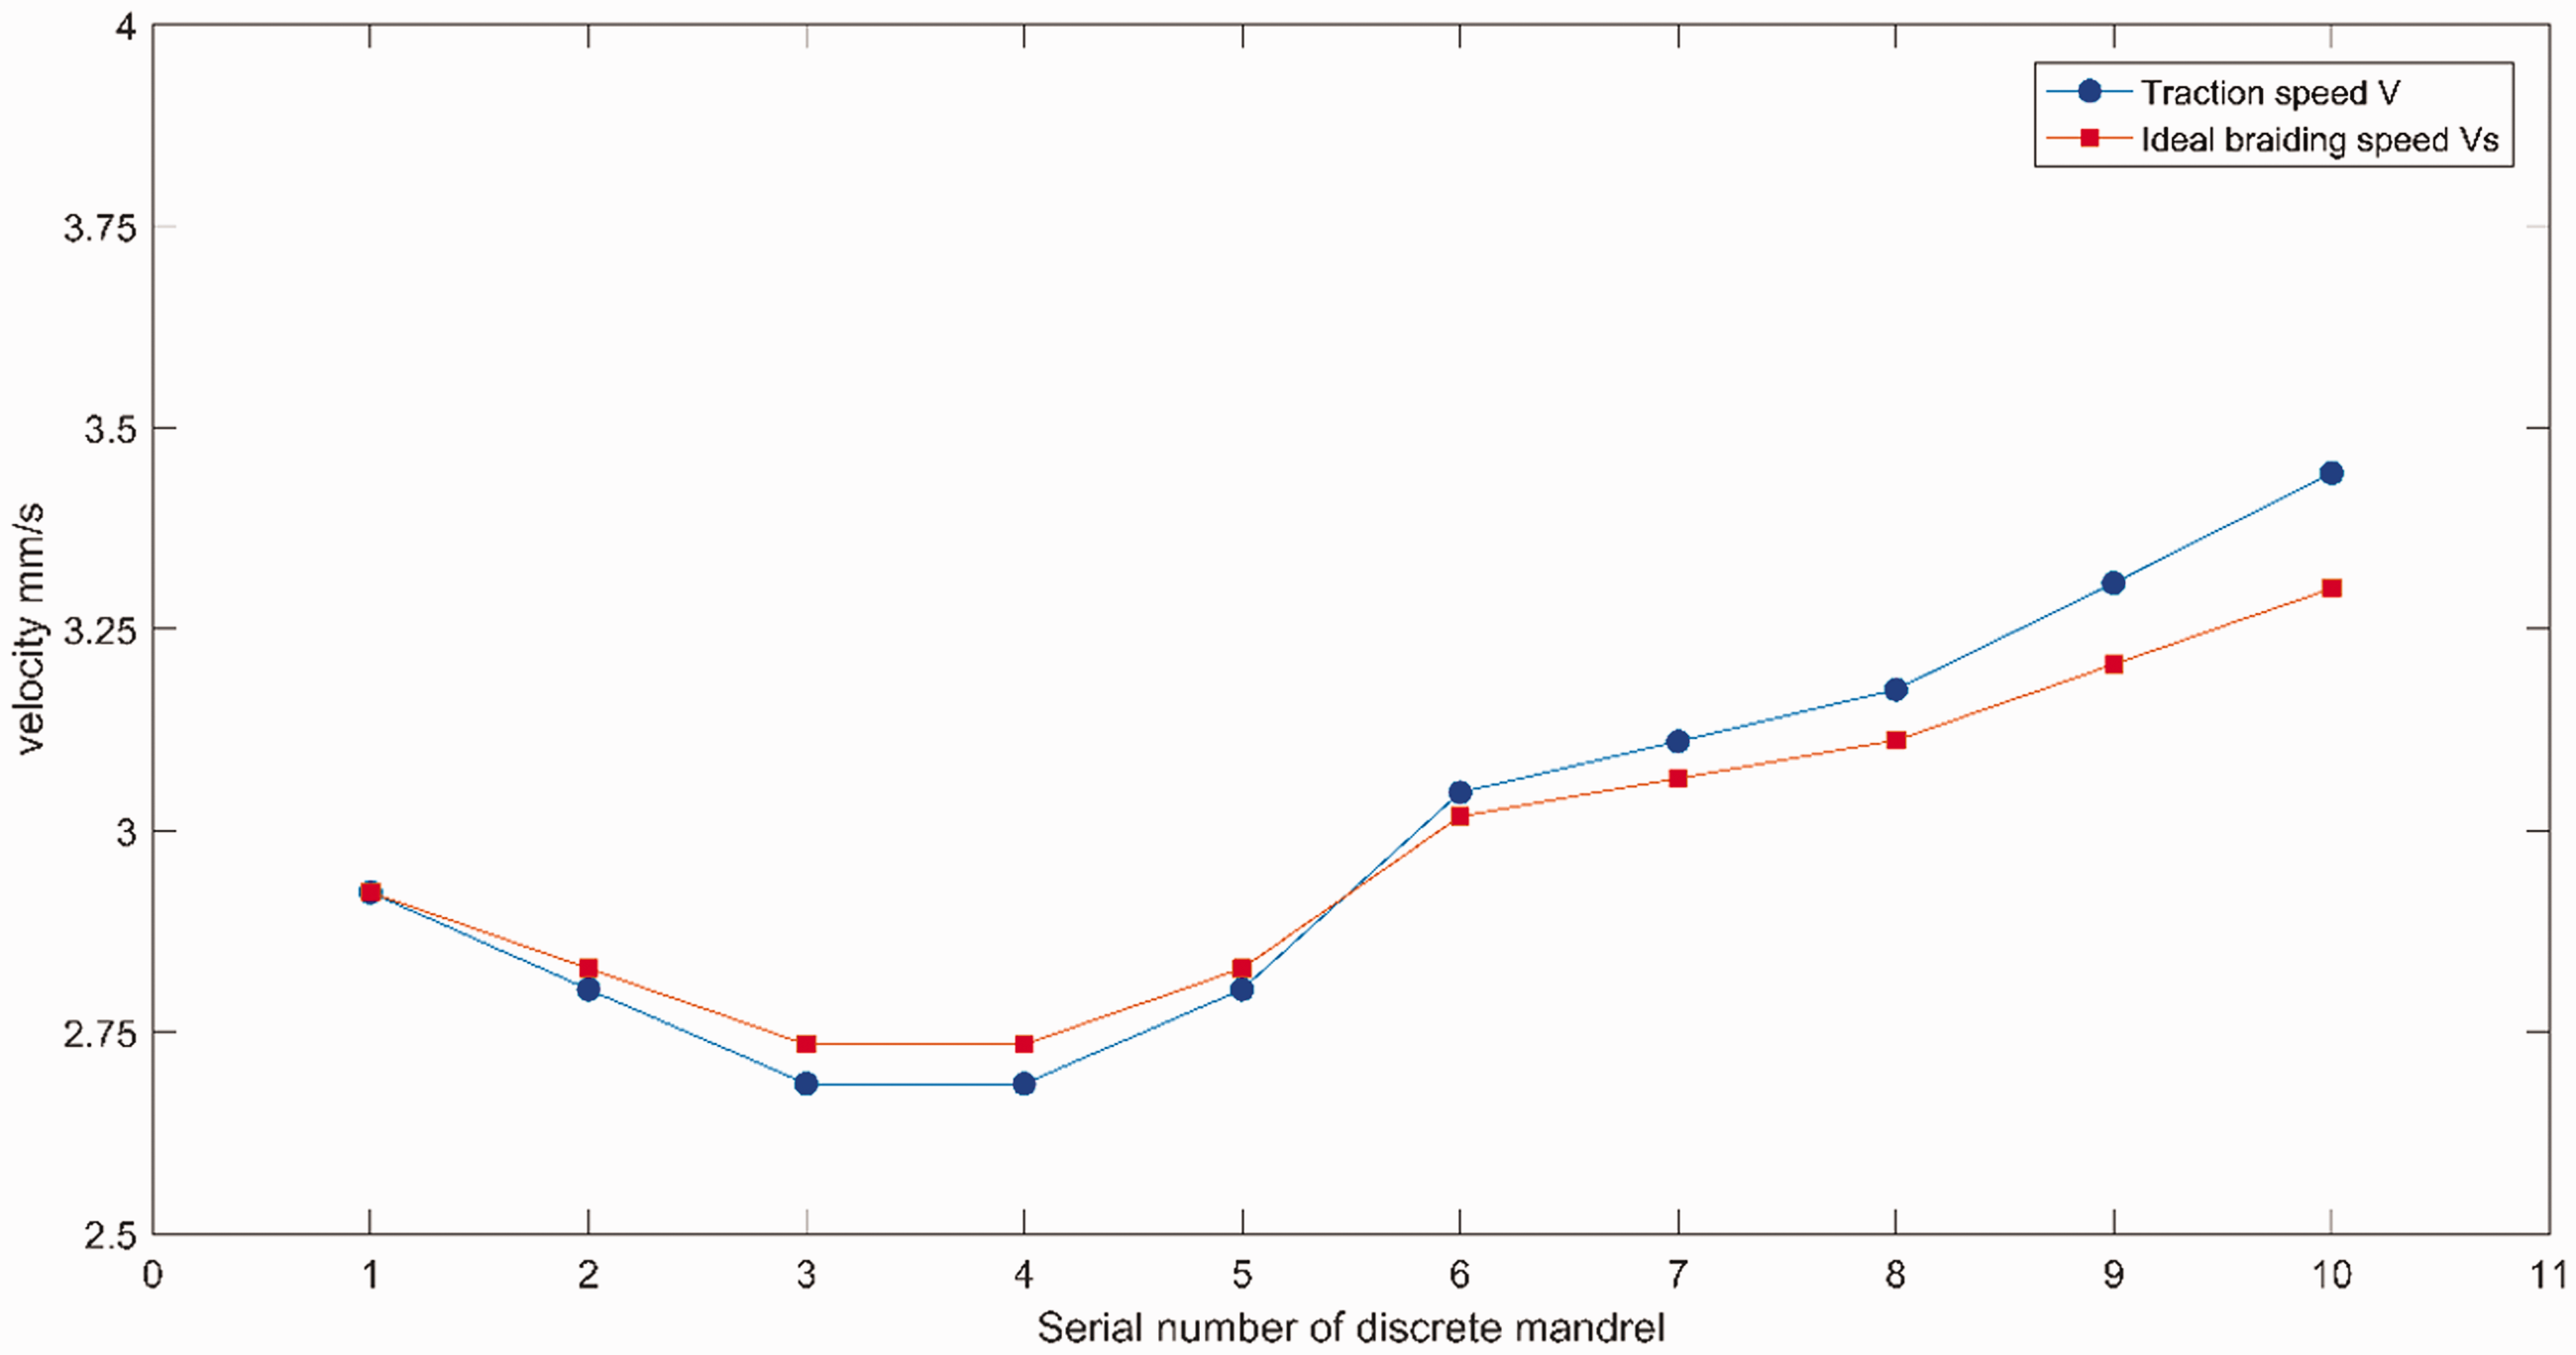
The traction trajectory and speed of the robot (
Comparison diagram of traction speed (V) and ideal braiding speed (Vs).
Traction time of each segment of the discrete mandrel

Table 1 lists the coordinates of the center point of the mandrel after the mandrel in the robot tool seat is discretized using the simplified braiding model introduced in the section on trajectory planning of the end of the traction robot. Table 2 lists the radius of each mandrel after discretizing 10 cylinders. Knowing the data of the discrete mandrel, the traction trajectory of the robot can be planned according to the traction robot trajectory planning algorithm proposed above. When the section size changes, the macroscopic geometric profile directly affects the offset or error between the braid angle of the machined surface and the target braid angle, which is caused by the change in the section radius. The size of the error is determined by the gradient of the section-size change. The larger the change rate, the larger the deviation; the smaller the size change, the smaller the error. After discretizing the core mold, the rate of change of the section radius was reduced, and within an acceptable range, the subsequent speed compensation was combined to meet the target requirements.
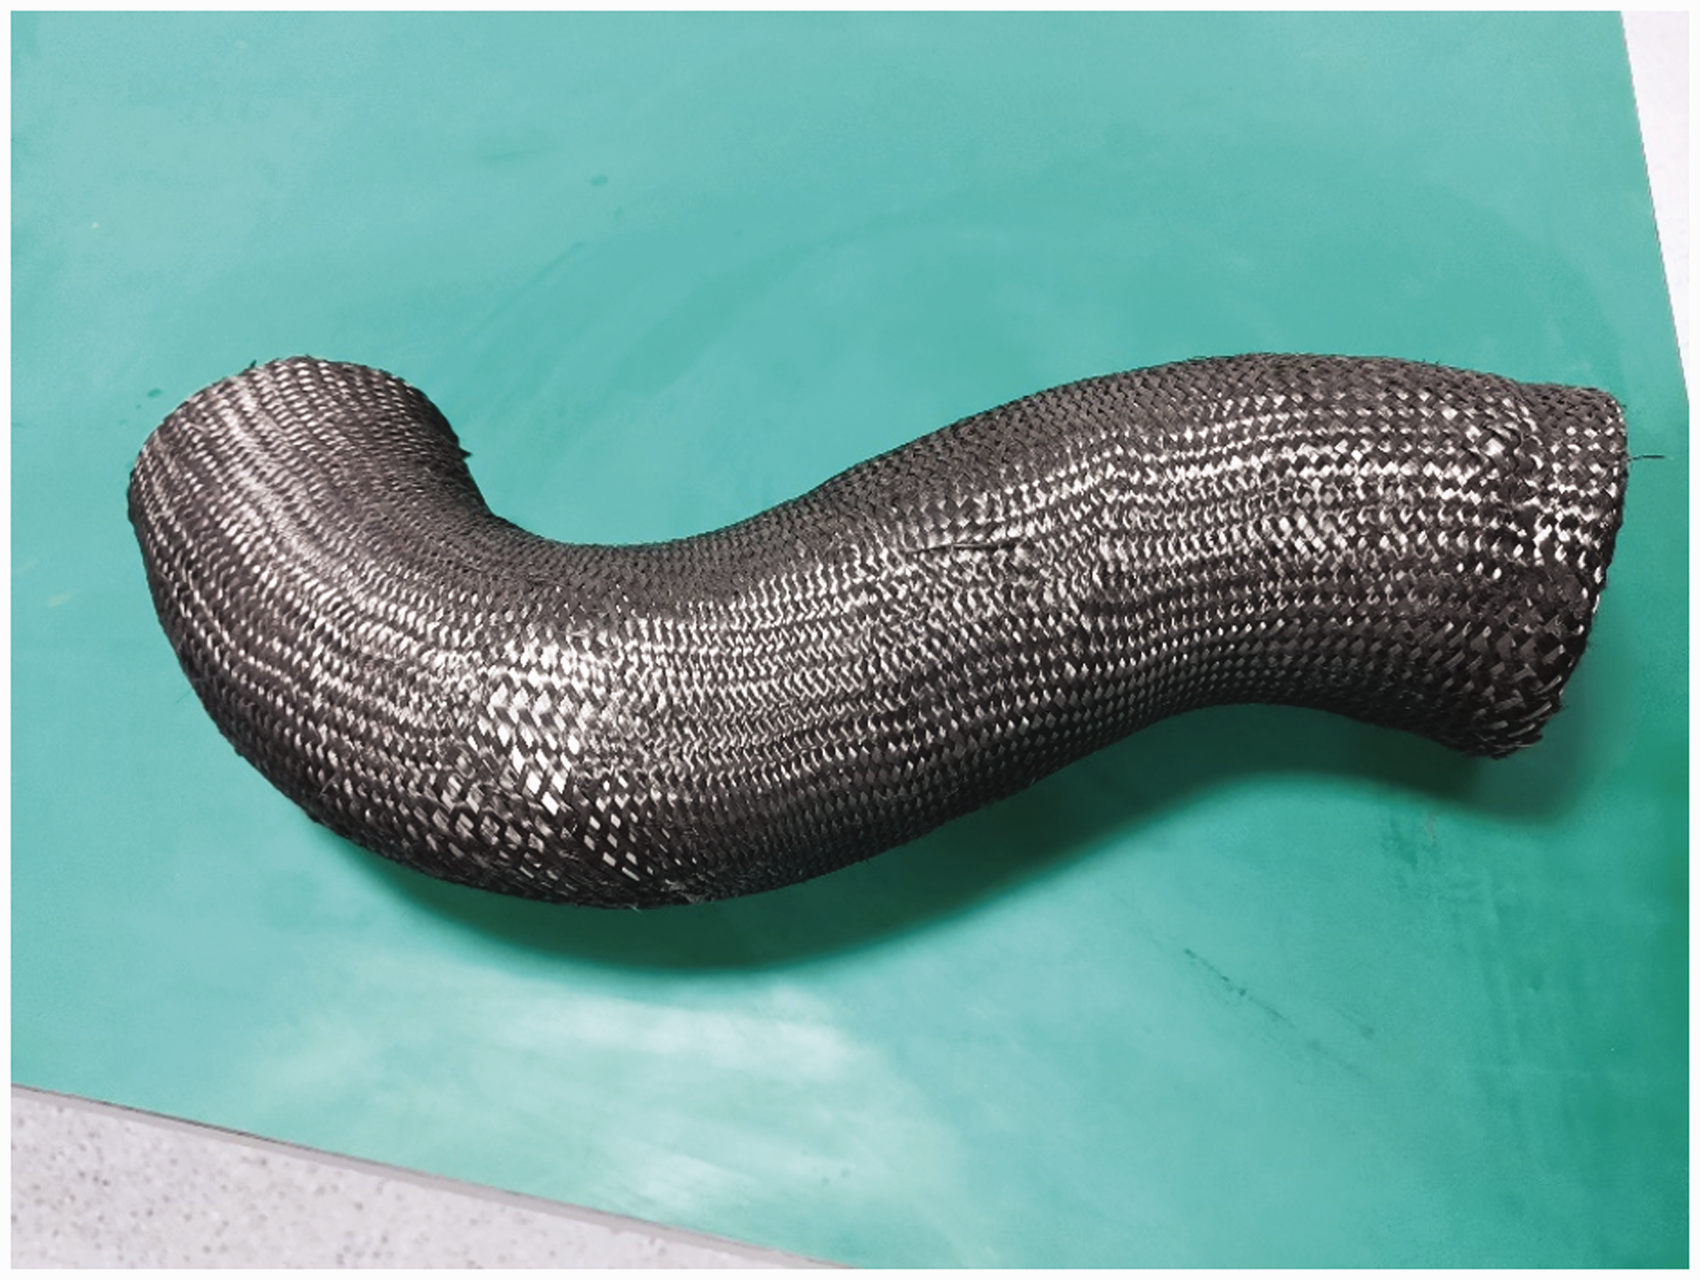
Figure 18 shows the pulling speed of each segment of the trajectory of the mandrel by the robot and compares it with the steady-state braiding speed of each segment of the mandrel. Table 3 lists the duration of the traction speed for each segment. The robot traction control is controlled by traction speed and time. First, the braiding speed was adjusted to the vicinity of the desired braiding speed, and then the distance was adjusted during the passing time. By calculating and controlling the pulling speed and pulling time, the braiding angle of the compensating fabric could be satisfied without affecting the braiding of the next mandrel, thereby obtaining a preform with a uniform braiding angle. Using the control method proposed in this study to braid the preform, the obtained product is shown in Figure 20. It can be observed that the yarn on the preform is relatively tight, and the braiding angle is constant.
Preforms braided using the control algorithm proposed in this paper.
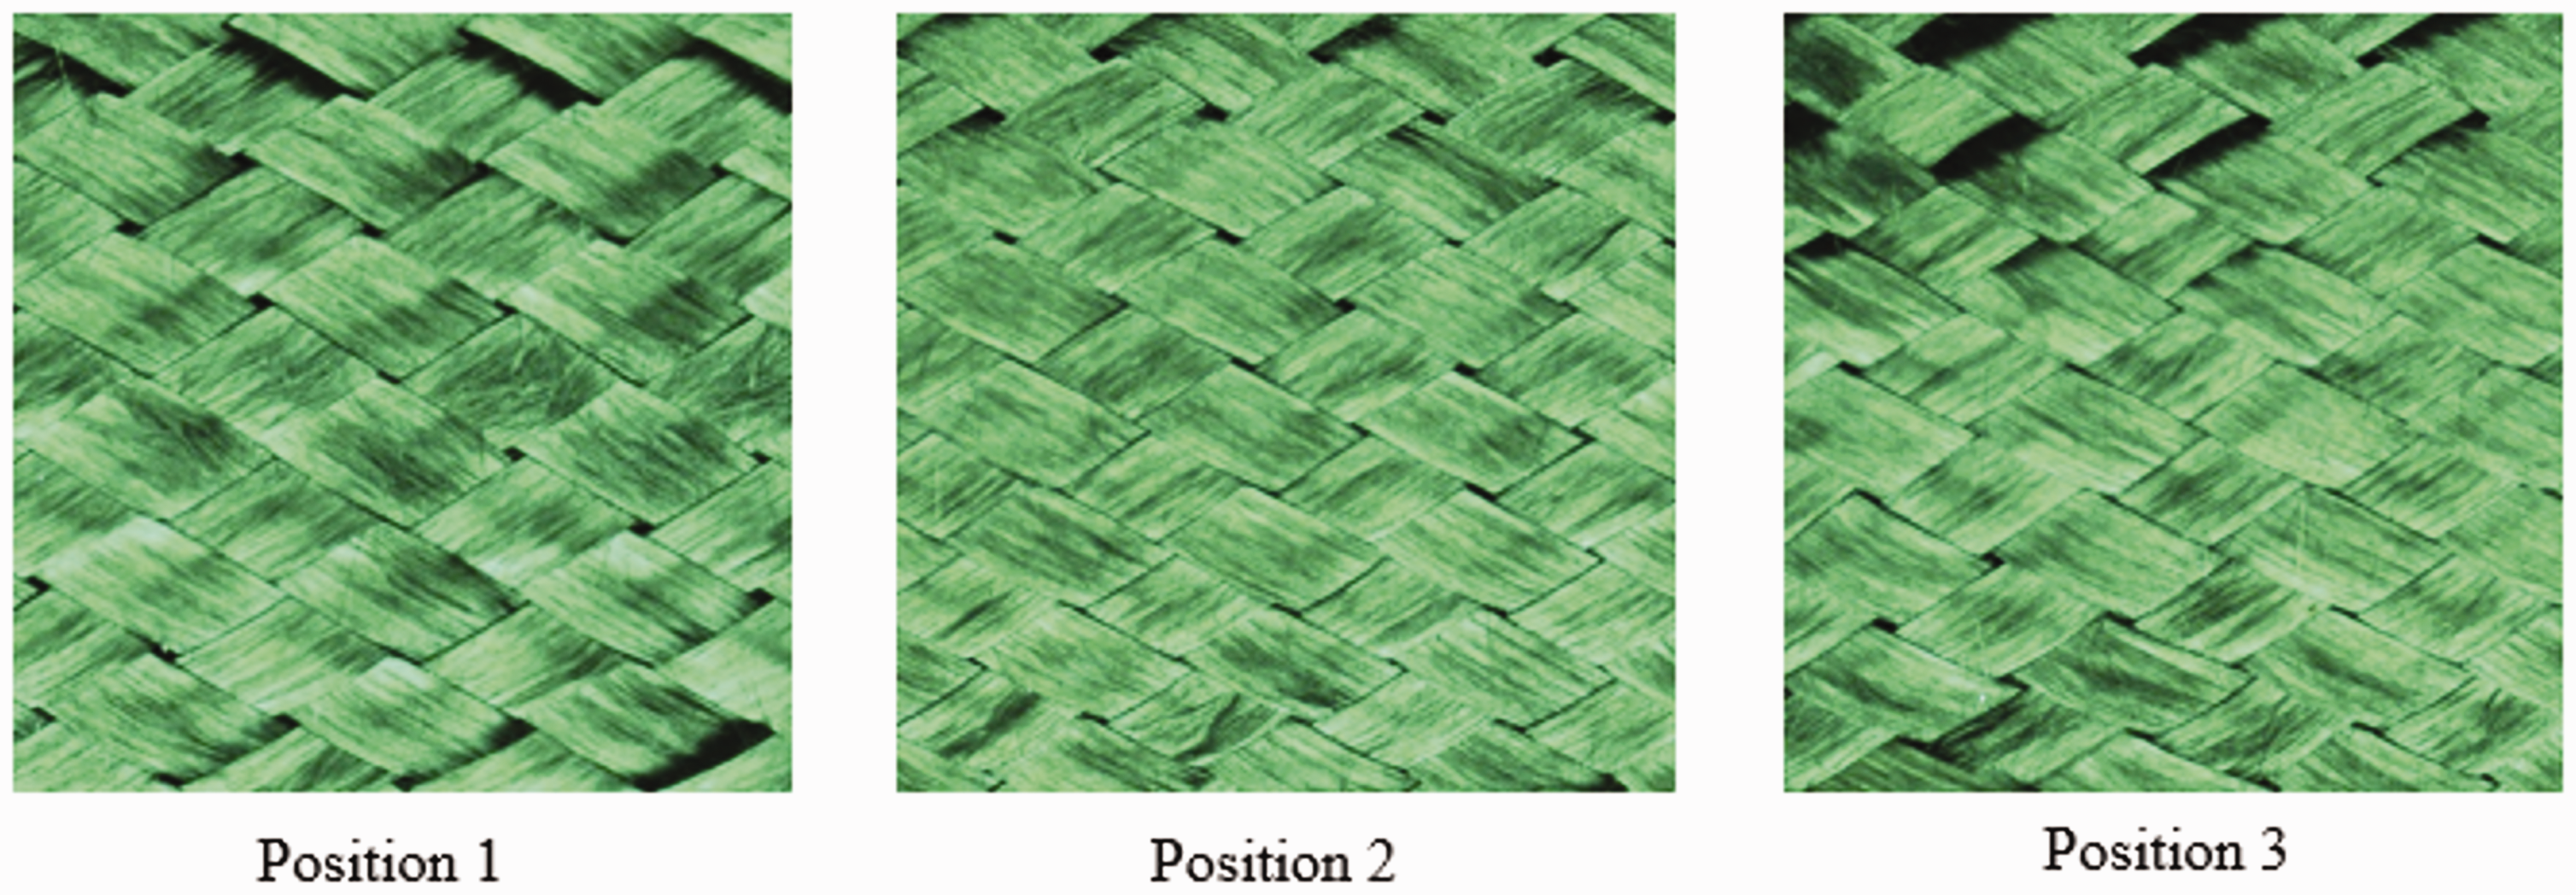
Figure 21 is a picture of the fabric surface of the same preform at three different positions, obtained using the braiding angle detection algorithm and process proposed above to measure the braiding angle. Figure 22 is the average grayscale comparison of the three positions; the braid at the three positions had angles of 60.044°, 61.124°, and 61.213°, respectively. For other measurement algorithms (Hough transform, etc.) or measurement methods (manual measurement, etc.), the error value is within the range of 2°–5°. After using the abovementioned control methods for speed and traction time to adjust the position, attitude, and the traction speed of the robot, the space curve variable cross-section mandrel was accurately braided, and the braiding angle of the special-shaped structure mandrel was 2° above and below the desired value. It floats inside to improve braiding efficiency, and under the same conditions, it can improve the mechanical properties of the composite material. In addition, for complex-shaped mandrels, the algorithm can still be used to obtain ideal results, as long as the acquired image is a proper Region of Interest(ROI).
Surface pictures of the same preform at three different positions.
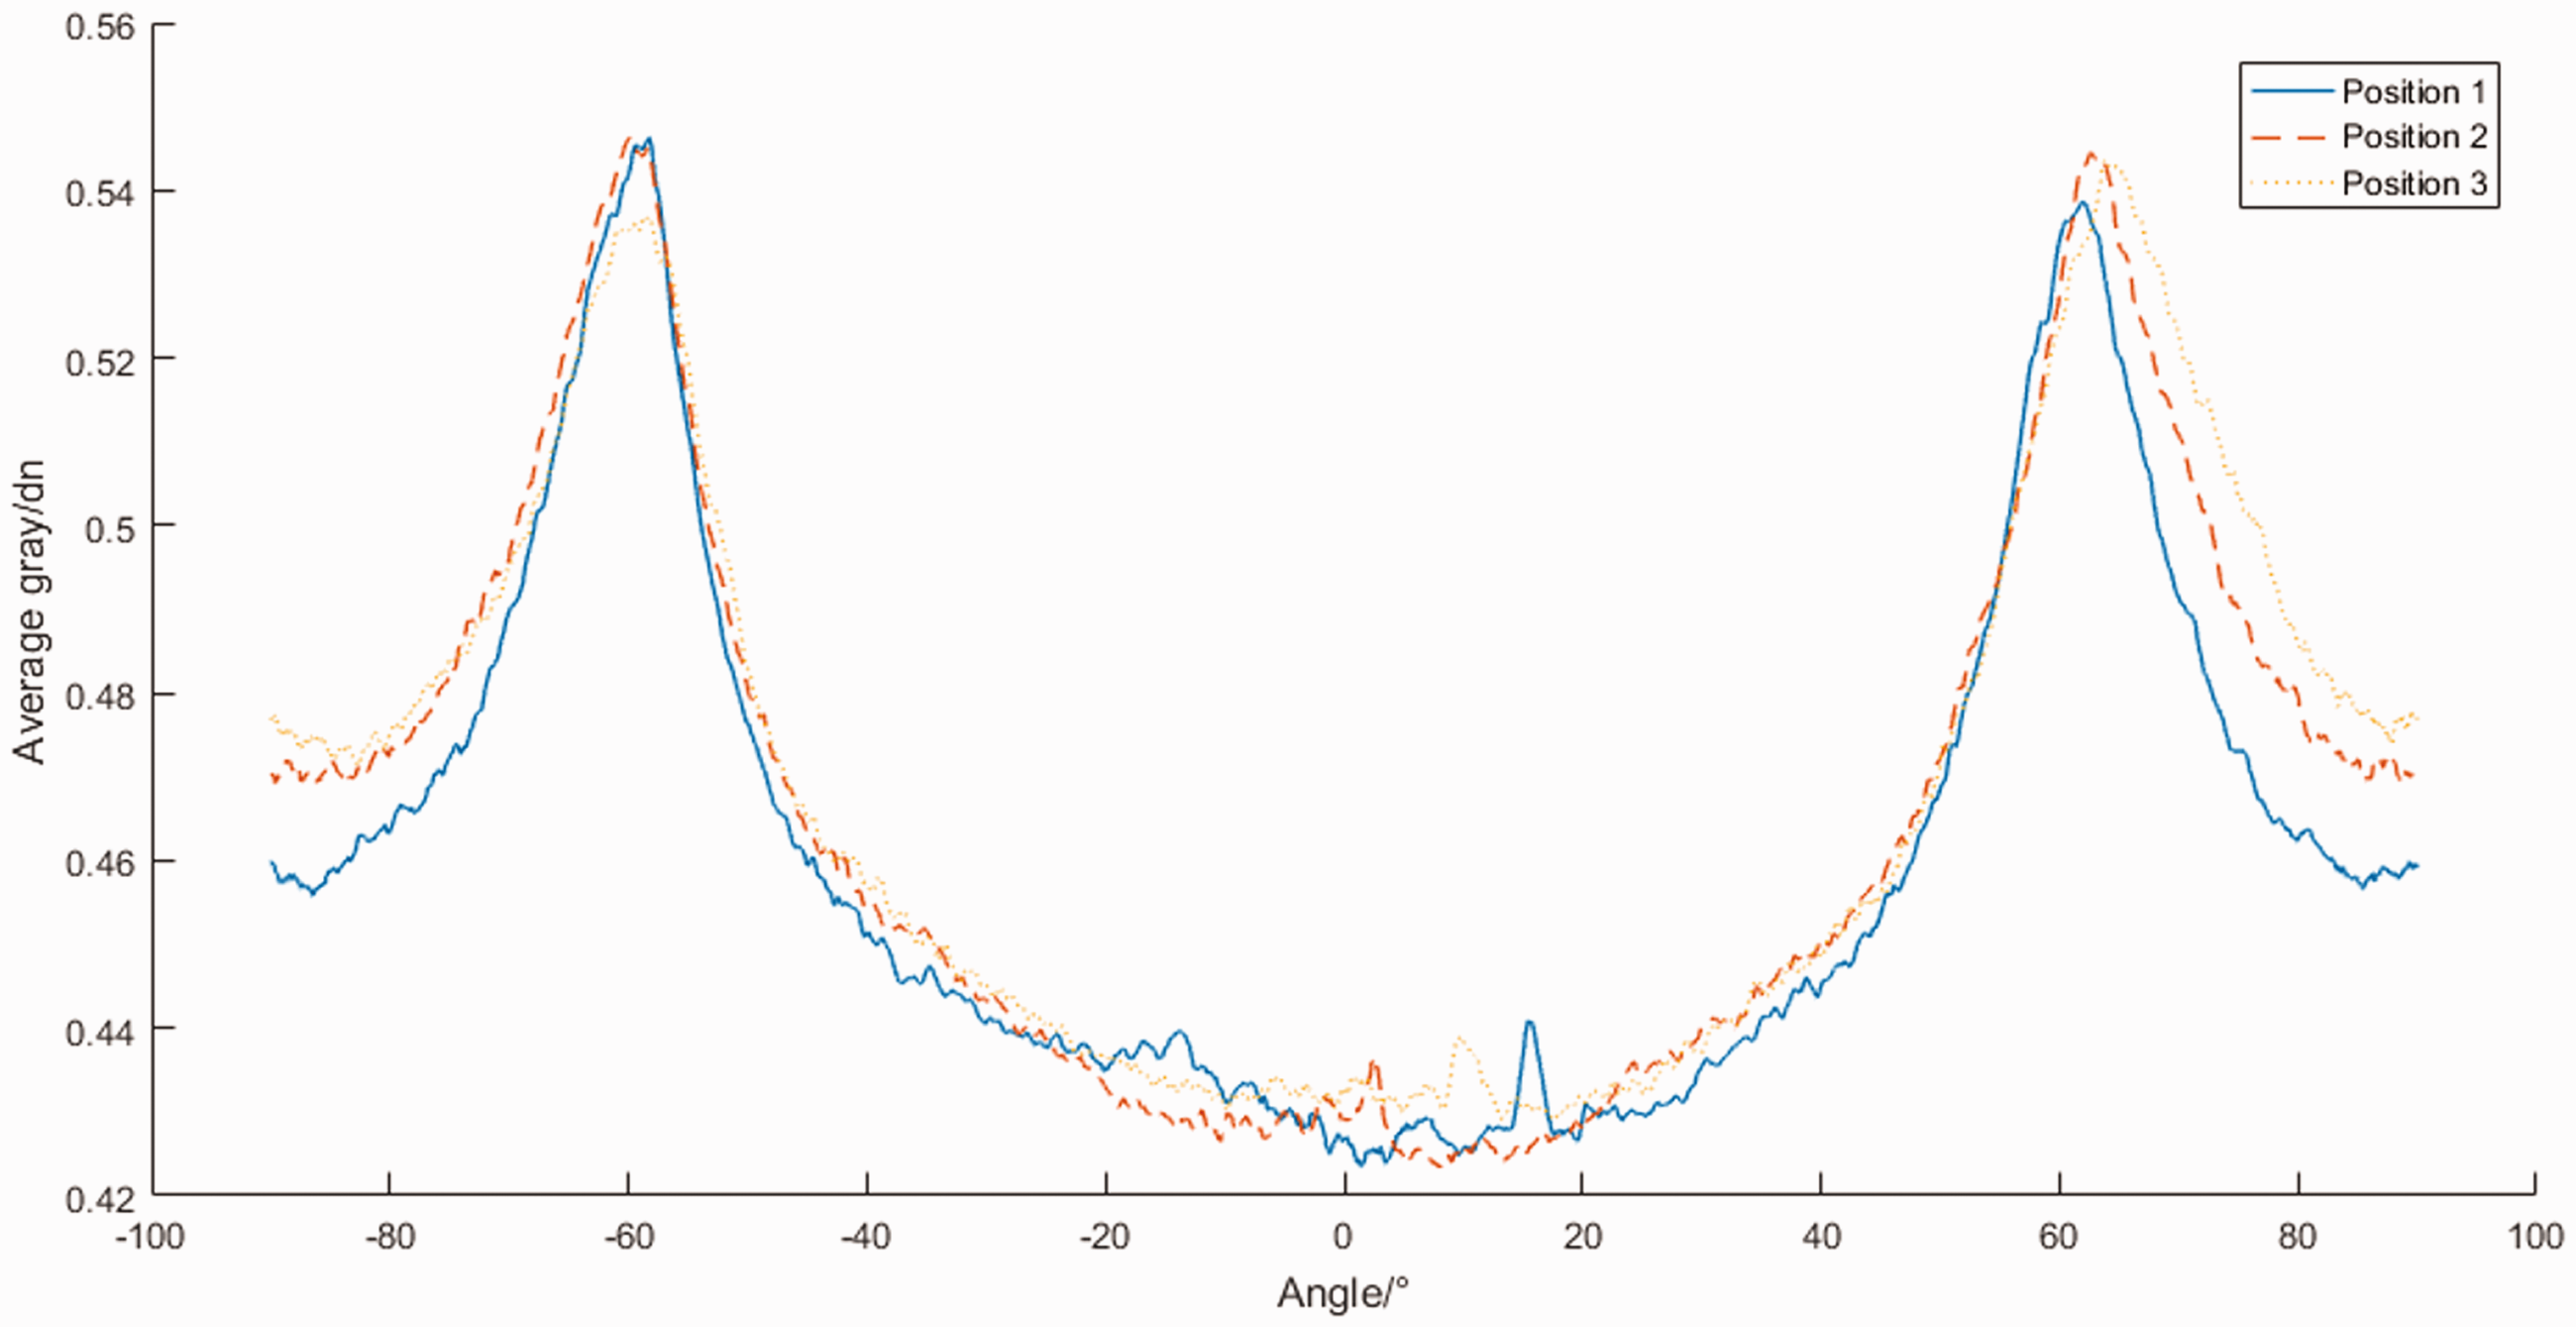
Braiding angle detection average grayscale comparison chart.
Conclusion
In this study, a method for controlling the trajectory and speed of the mandrel in the process of robot-assisted braiding of composite fibers was proposed, and the braiding angle on the surface of the preform was detected by image processing.
This study proposes a trajectory planning method for a traction robot in the braiding process of a spatially curved special-shaped core mold, which avoids the time spent in real-time control of the robot trajectory. The proposed algorithm theory can accurately locate the robot trajectory and improve braiding accuracy. An adjustment method for the pulling speed of the mandrel was proposed. The pulling speed of the mandrel was adjusted discretely and segmentally, and the relationship between the braiding speed of the fabric and its relative sliding speed during the braiding process was analyzed. The expected braiding angle can be reduced to within ±2° by planning the path and speed of the mandrel pulling trajectory. To detect the braiding angle on the surface of the braided preform, an algorithm for detecting the braiding angle based on the image processing of machine vision is proposed, which can effectively calculate the average braiding angle on the surface of the tubular fabric.
The results show that the traction robot control method and machine vision detection algorithm proposed in this study meet the requirements of actual production accuracy and quality inspection and can be used as a theoretical and technical basis for manufacturing high-performance composite preform products.
Footnotes
Declaration of conflicting interests
The author(s) declared no potential conflicts of interest with respect to the research, authorship, and/or publication of this article.
Funding
The author(s) disclosed receipt of the following financial support for the research, authorship, and/or publication of this article: This project is supported by National Natural Science Foundation of China (Grant No. 51905088).
