



Abstract
As a result of the limitation of bicomponent spinning in which it is difficult to obtain the interface evolution of the fiber forming process and guarantee performance stability, numerical simulation was carried out to investigate the effect of cooling, melt viscosity, and inlet flow rate on the interface throughout the process. The results showed that the position deviation of the interface only occurred inside the orifice and the interface distortion continued until after extrusion, with the maximum deformation occurring during extrusion swelling. Based on sufficient multifield data obtained from the simulation, it was demonstrated that the interfacial curvature was governed only by the viscosity difference between individual components, and the position of the interface was determined by the mechanical energy of the bicomponent melt. Moreover, the curvature and the position of the interface can be adjusted indirectly by changing the viscosity ratio, which can be regulated by the flow ratio, bringing guidance for the full process control of the bicomponent fiber preparation.
Keywords
Bicomponent spinning is an extrusion process allowing the combination of two polymers into a single fiber with an obvious interface in the cross-section to obtain special properties from individual components. The fibers produced by bicomponent spinning are typically used to make functional fibers for the textile industry according to their cross-section type: islands in sea ultrafine fibers or segmented pie ultrafine fibers with two components that are easy to split,1,2 sheath/core bicomponent fibers with a specific functional sheath layer or core layer, 3 and side-by-side bicomponent fibers with a self-crimping function due to the different thermal shrinkage of two components. 4 Among them, the special performance of the extensibility and reversibility of side-by-side fiber depends on the crimp curvature which is believed to correlate strongly with the morphological configuration of the cross-section. 5 Therefore, the control of the interface is particularly critical to ensure the performance of the functional fiber.
The interface morphology of side-by-side bicomponent fibers (or membranes) has been studied for decades. It has been found that the main factors influencing the interface morphology include the difference in melt viscosity, flow rate ratio between individual components, and the orifice structure of the spinneret. First, when the bicomponent melt was coextruded through a constant orifice at approximately the same flow rate, interface deformation would be triggered by the viscosity difference between the two components. 6 Han 7 carried out an experimental study of coextruding polystyrene (medium viscosity) with low-density polyethylene (LDPE) (low viscosity) and high-density polyethylene (HDPE) (high viscosity), respectively. Observation of the extrudate cross-section showed that the phase with the higher viscosity has a convex surface for both pairs of polymers. Hence the authors considered that the viscosity ratio between the two components was primarily responsible for the curvature of the interface. Southern and Ballman 8 conducted experiments on side-by-side bicomponent fiber with the nylon/nylon system, and found that the interface originally located as a diameter between the two components always curves around the high viscosity component. The interface wraparound phenomenon can be attributed to a minimum energy dissipation principle, which causes the higher viscosity melt to move into the lower shear rate region in the capillary center. In addition, Han 7 reported that when the flow rates of the two components were roughly the same, the HDPE phase with higher viscosity was encapsulated by the polystyrene phase, which was consistent with similar research results. 9 However, as the flow rate ratio of HDPE to polystyrene increased, the HDPE phase tended to surround the polystyrene phase which was less viscous. Thus, the author indicated that the flow rate ratio of the two components was also responsible for determining the interface curvature but no mechanism interpretation was proposed.
The orifice (or die) structure also plays a major role in the interface evolution. 10 Lee and White 11 investigated the side-by-side configuration of extrudates in different capillary length-to-diameter (L/D) ratios. It was observed that the component with the higher viscosity has a convex surface and the interface curvature was found to be an increasing function of the capillary length-to-diameter ratio, but there was no explanation of the reason for the interface change with the L/D ratio. Zhou et al. 12 presented a spinneret design that allowed the two components to be combined out of the orifice, so the melts solidified rapidly after the contact and bond after extrusion, which was beneficial to forming an ideal side-by-side cross-section.
The above studies researched the interface morphology by observing the cross-section of the extrudate (or fiber), which also can be obtained by means of numerical simulation during interface motion. Wang et al. 13 simulated the extrusion of polyethylene terephthalate (PET)/polyamide 6 (PA6) bicomponent fiber and found that the lower viscosity ratio was beneficial to inhibiting extrusion swelling. Liao et al. 14 simulated the flow of PET/PA6 melt in the spinneret orifice by the finite element method based on Navier–Stokes equations and Bird–Carreau equations. It was demonstrated that the interface deformation and position deviation started in the orifice before extrusion, and the increase of the flow rate ratio between the two components facilitated the movement of the interface position and the encapsulation of the higher viscosity melt. Zhang et al. 15 simulated the coextrusion process of the polystyrene/HDPE bar. The results showed that the interface was biased to the side of the low-viscosity melt when the flow rate ratio was equal to unity, and a minor change in the flow rate caused a large fluctuation in the position of the interface, but there was no explanation for the deviation of the interface position.
To sum up, there are two methods to research the interface of bicomponent melt including the experimental method and the numerical simulation. The limitation of the experimental method to study the interface is obvious. First, observation of the cross-section of formed fiber or extrudate by a microscope can only obtain the final morphological characteristics of the interface, while it is difficult to determine the stage and cause of the interface deformation and deviation. During bicomponent spinning, the two components converge in the spinneret and flow side by side to the outlet of the orifice, then the fiber is formed and the interface is fixed after the melt is coextruded into the air. Our previous simulation research 14 has demonstrated that the distortion and displacement of the interface started when the two components converged in the spinneret, forming a configuration by which the low-viscosity component encapsulated the high-viscosity component. The cross-sections of formed fibers obtained from the experimental studies 12 also seem to be consistent with the simulation results of the flow in the orifice. However, it should be pointed out that the interface distortion observed in a formed fiber may be different from that within the orifice because extrusion and cooling still exist between the initial interface and the final fixed interface. Some dramatical interface rearrangement may occur during the extrusion swelling process. 11 It is generally considered that the encapsulation interface configuration formed in the orifice may be further distorted or recovered during extrusion compared with the orifice flow stage. Nevertheless, how the interface changes from the orifice to the air remains unclear yet. Second, the flow characteristics (pressure, viscosity, velocity, shear rate, etc.) of the melt during spinning were not quantitatively measured. 16 For instance, it is unknown whether the viscosity ratio between the two components changes at different flow ratios or the length-to-diameter ratios of the orifice because the polymer melt is a viscoelastic nonNewtonian fluid. Therefore, it is not rigorous to investigate separately the effects of flow rate ratio or length-to-diameter ratio on the interface of the side-by-side bicomponent fibers in the experiment.
It is worth noting that numerical simulation is an effective means to obtain the complete flow field parameters of the full process.17–19 It is expected to make up for the shortcoming of experimental research and solve the problem of interface formation of bicomponent fiber considering multiple-factor coupling. However, there are very few simulation studies on the interface evolution, while the full process of bicomponent spinning has not been involved. In this study, numerical simulation and experimental methods were both used to study the interface evolution of bicomponent spinning. To avoid the influence of uncertain interactions caused by the difference in the chemical structure of the two components, the PET system (HPET/LPET) which can be used in crimped fiber with different viscosity was selected for research. Aiming at the unresolved problems of the literature cited above, simulation of the full process of bicomponent spinning was carried out considering the cooling effect based on a nonNewtonian fluid model. The mechanism of interface evolution was fundamentally and accurately demonstrated based on sufficient multifield data obtained from the computation, and the preparation process of bicomponent fiber with an ideal side-by-side configuration was proposed based on the mechanism.
Experimental method
Materials
Commercial melt spinning grades of PET with an intrinsic viscosity of 0.64 dl/g purchased from UNIFULL and PET with an intrinsic viscosity of 0.82 dl/g from Sinopec Shanghai Petrochemicals, with respectively named LPET and HPET in the paper, were used for producing bicomponent fibers.
Rheological measurements
Rheological measurements were carried out on a rotational rheometer (Physica MCR 301, Anton Paar) to obtain the rheological parameter such as zero shear viscosity of HPET and LPET for simulation. The concentric parallel plate with a diameter of 25 mm was used. The chosen gap was 1 mm for all measurements. The HPET and LPET chips were dried under vacuum before measurement, and steady shear experiments were performed at the spinning temperature of 290°C, covering a shear rate ranging from 0.01 to 100 s−1.
Bicomponent spinning experiment
The HPET and LPET chips were dried under vacuum to a moisture content of less than 0.01%. HPET/LPET side-by-side bicomponent fibers were fabricated using a bicomponent melt spinning machine (ABE Φ25 × 2), schematically shown in Figure 1. The spinneret plate had 24 hole orifices, and each orifice was 0.35 mm in diameter. The spinning temperature was set at 290°C and the as-spun fibers were taken up at a speed of 600 m/min.
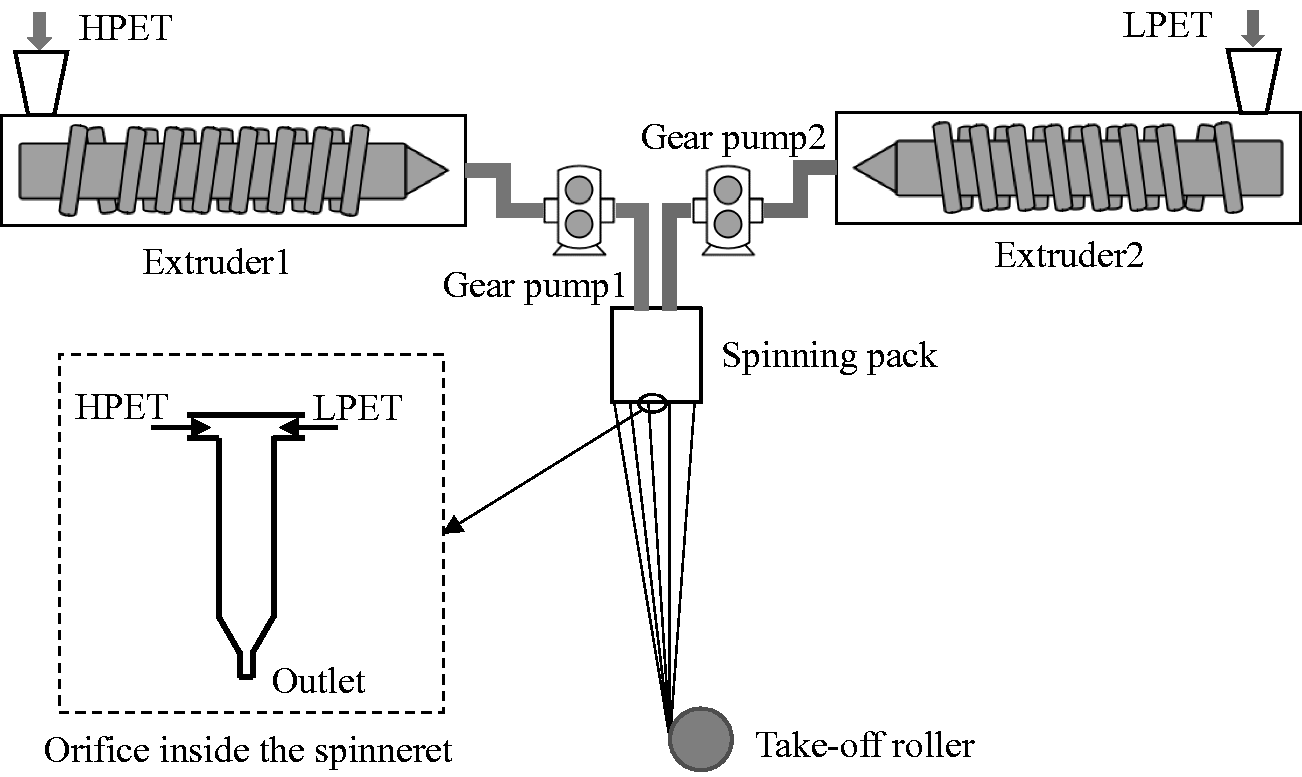
Schematic diagram of experiment and structure of the orifice.
Numerical simulation method
Governing equations
Melt spinning is a steady and continuous process for polymers. When the polymer melt is extruded from the spinneret, it will be rapidly cooled and solidified in the air. Therefore, the spinning process can be regarded as a steady state, nonisothermal flow of the melt with the governing equations as follows.
For the incompressible fluid, the continuity equation can be written as:

The momentum equation can be written as:




The energy equation can be written as:

The heat conduction can be assumed to be governed by Fourier’s law:

Constitutive equation
Previous literature8,12,20 showed that the elasticity ratio has relatively little effect on the interface curvature in contrast to the importance of the viscosities of the two components. Therefore, a pure viscous model was employed as the constitutive equation. The viscosity of polymer melt is governed by both temperature and shear rate, thus the viscosity equation can be written as:

To reflect the pseudoplastic behavior of polymer melt under a high shear rate, the Bird–Carreau model was used as the constitutive equation:


The Arrhenius law was given as:

Geometrical model
According to the channel design of the side-by-side bicomponent spinneret, the geometrical model required for the simulation is shown in Figure 2, including the orifice section and the extrusion section. As the fiber can be regarded as an axisymmetric structure (cylinder), only half of the complete fiber was used for computation.
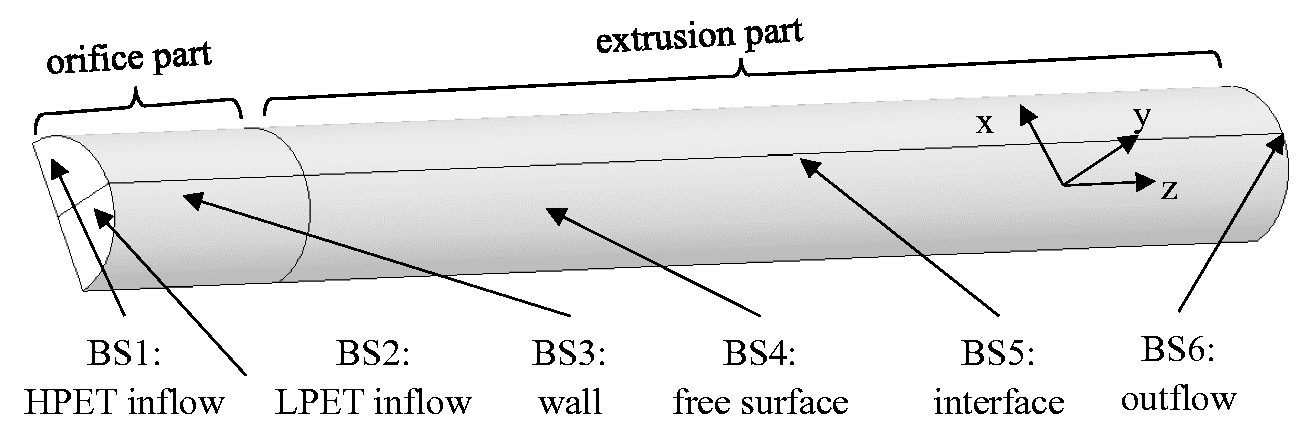
Geometrical model of bicomponent fiber for simulation.
Boundary conditions
Let BS1, BS2, BS3, BS4, BS5 and BS6 denote the HPET inflow boundary, the LPET inflow boundary, wall, free surface, the interface between the two components and the outflow boundary, respectively (Figure 2). Assuming that the spinning process is a fully developed flow, the boundary conditions can be expressed as:
BS1 and BS2: The melt flow in the orifice through the inflow boundary. The volume flow rates were set according to different composition ratios between the two components and the inlet temperature was set to the spinning temperature:
BS3: Assuming that there was no wall slip, hence the melt velocity was equal to zero on the wall of the orifice. The melt is heated during flowing in the spinning pack. Therefore, the temperature of the wall was set to the spinning temperature:
BS4: The melt is cooled and solidified in the air after extrusion. To simplify the calculation, it was assumed that the fiber out of the orifice was cooled by a circular air blow. Therefore, the same convection equation was imposed in all directions on the surface of the fiber. In addition, surface tension and air friction were neglected. Hence the dynamic conditions of the free surface can be written as:



The heat convection condition was given by:


Here, V is the fiber velocity, while A is the cross-sectional area of the fiber. Substitution of A by Q/V, equation (16) becomes:
4. BS5: Different from homocomponent melt spinning, the dynamic conditions must be defined to track the interface between the two components for bicomponent spinning. Without considering mutual diffusion, the melt does not flow through the interface. Besides, assuming that there is no slipping between the two components.
5. BS6: Assuming that the melt free fell at the outlet, the normal force and the tangential force were equal to zero:



Material properties and numerical method
Newton–Raphson iteration was used to solve the equations. Furthermore, comprehensively considering the calculation accuracy and efficiency, the following interpolation schemes were selected: the mini-element for velocity, and the linear element for pressure and temperature.
Properties of HPET and LPET are listed in Table 1. Due to the same molecular structure, the difference between the two melts can be assumed only in viscosity.
Material properties used in the melt spinning process
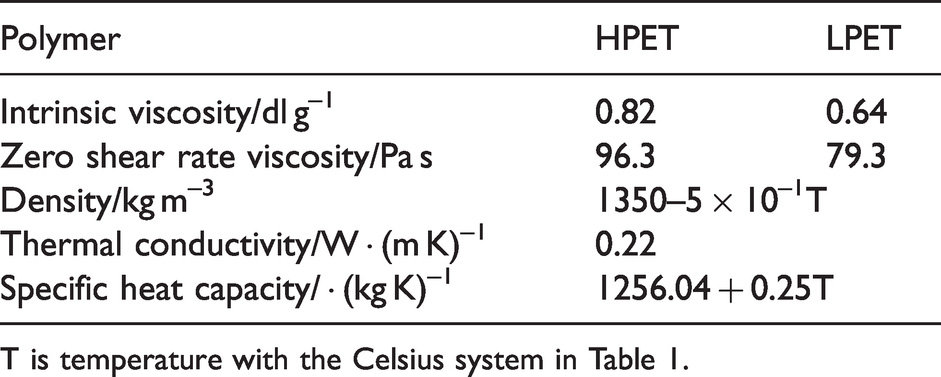
T is temperature with the Celsius system in Table 1.
Results and discussion
Interface evolution throughout the process
To fill the gap in the interface evolution between the flow in the orifice and the formed fiber, the flow field of polymeric melt from confluence to extrusion throughout the spinning process (Figure 3) was computed and analyzed. The final morphology was presented and compared with the literature. Figure 4(a) presents the geometrical contour of the fiber extruded with obvious extrusion swelling at the outlet of the orifice. The diameter of the HPET/LPET fiber extruded was stabilized at 0.39 mm after extrusion from a spinneret with an orifice diameter of 0.35 mm without drawing. The cross-section of the tail end of the fiber with the flow rate Q1 = Q2 = 5 × 10⁻¹¹m3/s obtained by simulation is shown in Figure 4(c). The x and y directions in Figure 4(c) are the radial direction of the section and the x direction is perpendicular to the interface. All figures of interface distribution in this paper follow this coordinate system. As shown in Figure 4(c), the interface shape was far from flat for the ideal side-by-side configuration. The interface changes can be divided into position deviation and interface distortion. The former means that the interface deviates from the ideal position (y axis), which is manifested as the interface move to the side of the LPET phase. The latter means that the curvature of the interface increases (the HPET phase to be convex) accompanied by the tendency that the LPET phase encapsulates the HPET phase. It can be seen that the interface morphology on the final cross-section of bicomponent fiber obtained by the simulation was consistent with the relevant experimental research.10,21
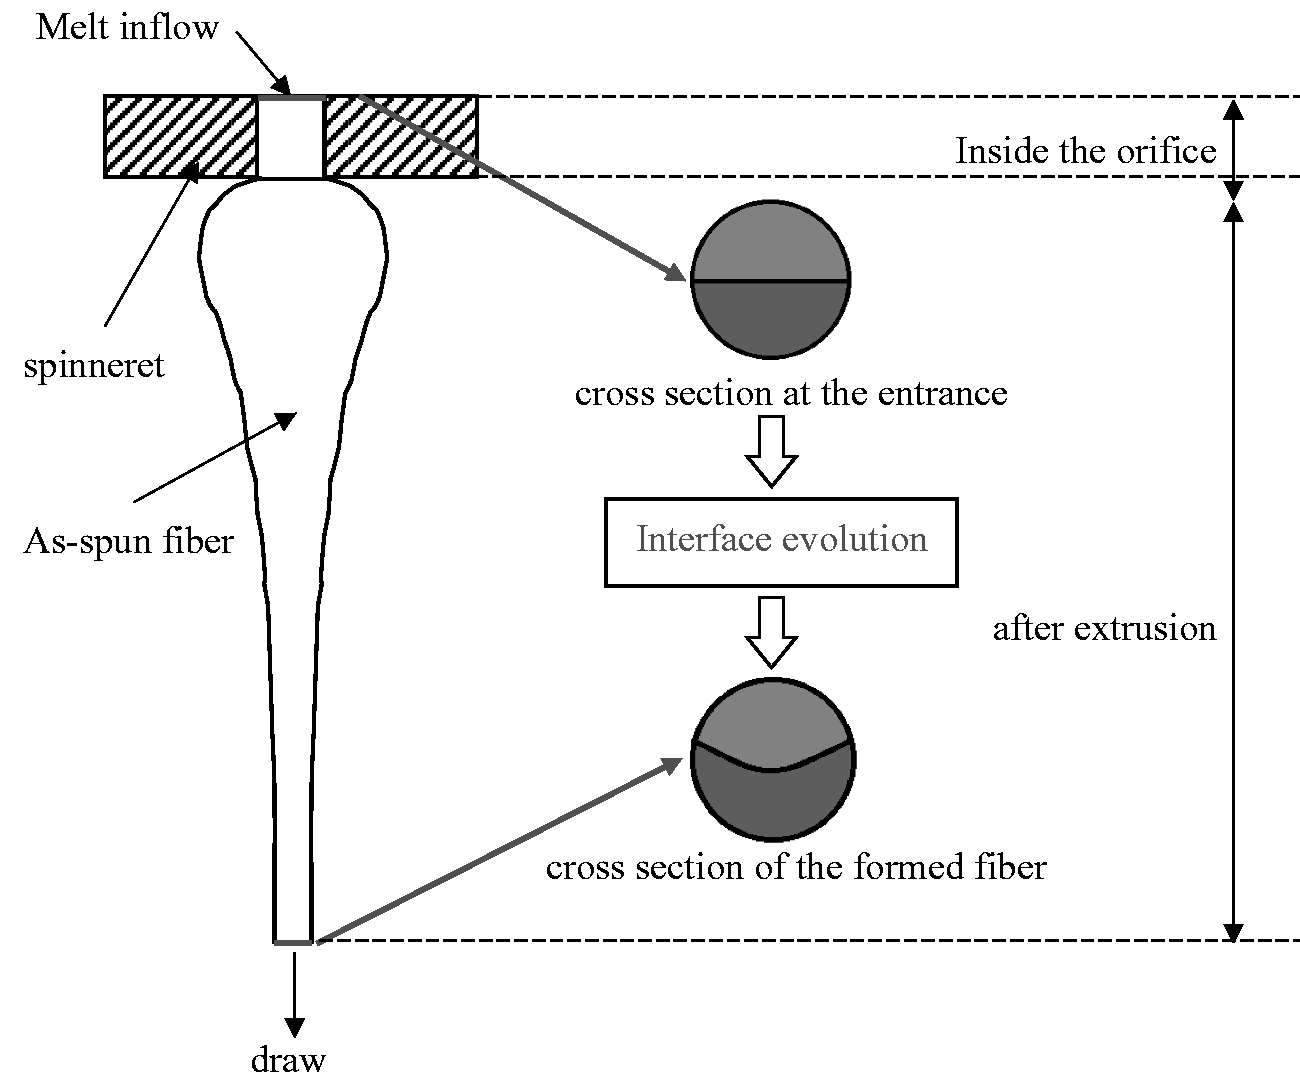
Schematic diagram of interface evolution of bicomponent fiber during spinning.

(a) Geometry contour of fiber extruded; (b) temperature contour of the longitudinal profile of fiber; (c) simulation cross-section of the end of the fiber and (d) the interface distribution along the spinning line (the coordinate system is the same as in (c)).
To find out when the interface changed as mentioned above, the interface distribution along the flow direction is shown in Figure 4(d). It can be seen from Figure 4(d) that when the two component melts converged, the curvature of the interface changed dramatically with the encapsulation configuration formed, and the interface position moved to the side of the LPET phase (the dotted line is the symmetry axis of the orifice section, that is, the interface position before the melts converge). It is of interest to note that the deviation of the interface position finished within a short distance before extrusion. Different from the interface position that quickly stabilized, the curvature of the interface continued to increase throughout the flow process. The position of z = 0.6 mm is the outlet of the orifice with the melt swelled so that the fiber diameter was increased. For z ≥1 mm, the curvature of the interface gradually stabilized with no significant change along the spinning line.
The interface distortion has been attributed to a minimum energy dissipation principle that causes the low viscosity melt to move into the higher shear rate region on the orifice wall (a flow condition with minimum pressure loss). Figure 5(a) displayed the shear rate distribution inside the orifice. The wall of the orifice is the high shear rate zone while the shear rate decreases from the wall to the center of the orifice. Then, the viscosity of the melt was determined by equation (9) above. It can be seen from equation (9) that the viscosity decreases as the shear rate increases, resulting in a decline in melt viscosity from the center to the orifice wall. In addition, the low viscosity melt tends to occupy the high shear rate zone, which leads to a larger proportion of the circumference occupied by LPET melt. Therefore, the viscosity difference is the motivation for the interface distortion. As long as there is a difference in viscosity of the polymeric melts flowing, the encapsulation will continue to grow. Hence the phenomenon that the interface curvature grew with the increase of the capillary length-to-diameter ratio observed in the early literature7,8,20 can be explained above.
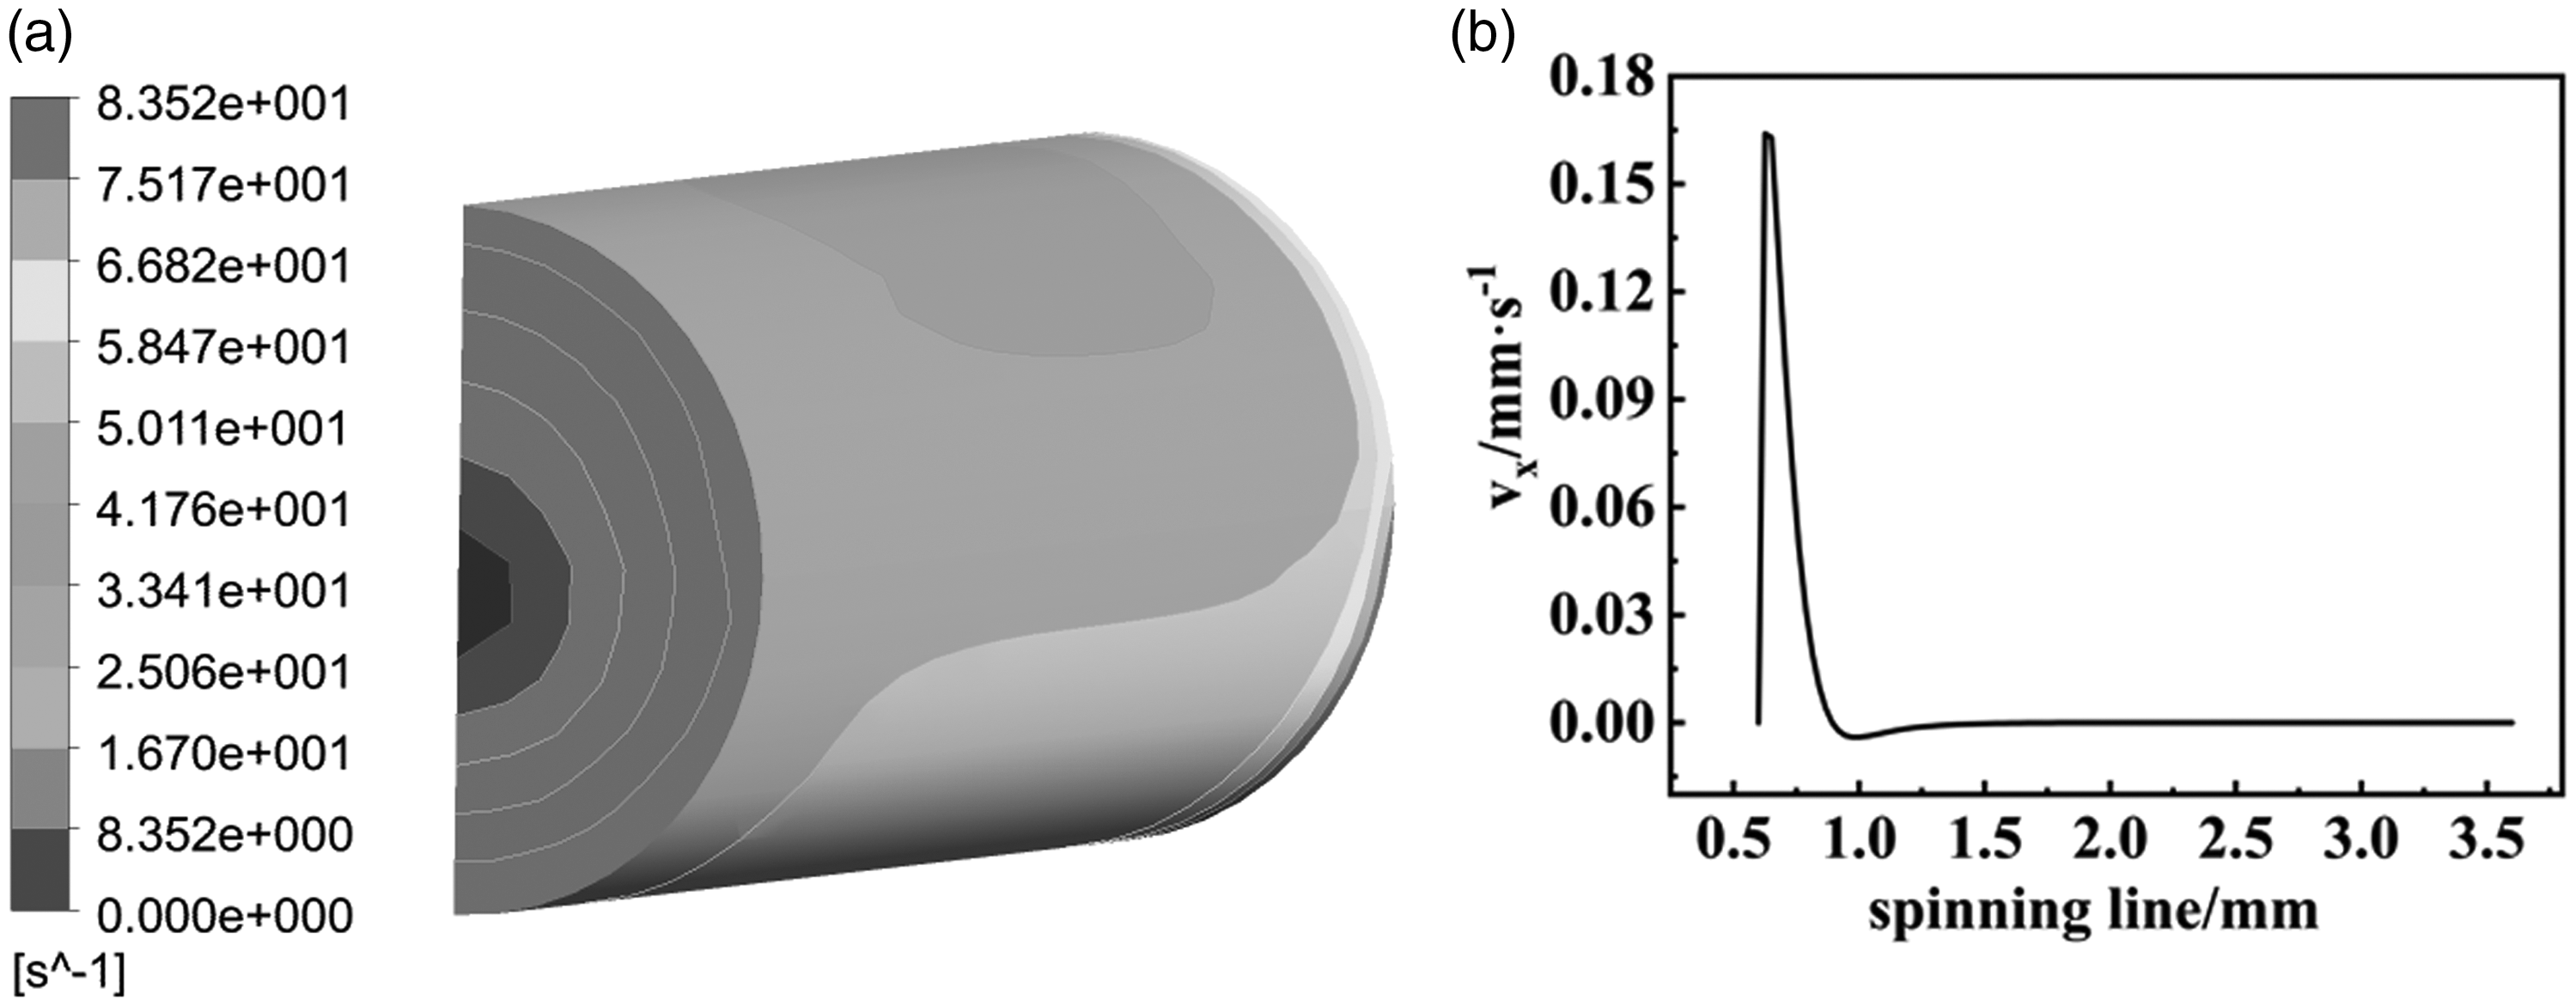
(a) Shear rate distribution inside the orifice and (b) V x along the spinning line.
The termination of the interface distortion can be attributed to the cooling process. Figure 4(b) shows the temperature contour of the longitudinal profile of fiber. The form of heat transfer is heat conduction inside the fiber (0 < |x| < R), while heat convection occurs between the air and the fiber surface. As a result of the cooling effect, there is an axial temperature field that decreases along the spinning line while there is also a radial temperature field caused by heat conduction from core to surface inside the fiber. In the present simulation, the surface temperature of the fiber dropped from 290.0°C to 281.0°C, and the core temperature dropped to 281.1°C at the position of 3 mm after extrusion. More importantly, the temperature drop along the spinning line resulted in a rise in the melt viscosity with worse flowability, causing the encapsulation phenomenon no longer to aggravate. The velocity in the x direction Vx (perpendicular to the interface) along the spinning line (started from x = 0.6 mm where the melt was extruded) is shown in Figure 5(b). After extrusion swelling, Vx was close to zero, indicating the poor flowability.
According to the basic principle of fluid mechanics, fluid flows from a region with higher mechanical energy to a region with lower mechanical energy. Therefore, the deviation of the interface position may be attributed to the mechanical energy difference between the two components, indicating that the mechanical energy of the HPET phase in the flow was higher than that of the LPET phase. To verify this conjecture, the mechanical energy distribution of the flow region was calculated. After neglecting the effect of gravity (small enough), the mechanical energy of the flow can be written as:

Figure 6 shows the diametral distribution of mechanical energy in the orifice, with the spinning line (direction z) as a parameter. It can be seen from Figure 6 that the mechanical energy of HPET was significantly higher than that of LPET before the two component melts converged. Once the melts converged, the mechanical energy quickly achieved equilibrium in the radial direction of the orifice by the transverse flow. At z = 0.3 mm, the mechanical energy had no obvious gradient in the radial direction, and only decreased along the axial direction (spinning line). Therefore, the two component melts only flowed along the spinning line without radial velocity, leading to the stabilization of the interface position. The mechanical energy distribution in Figure 6 was exactly consistent with the interface deviation along the spinning line in Figure 4(d), demonstrating that the interface position was governed by the mechanical energy.
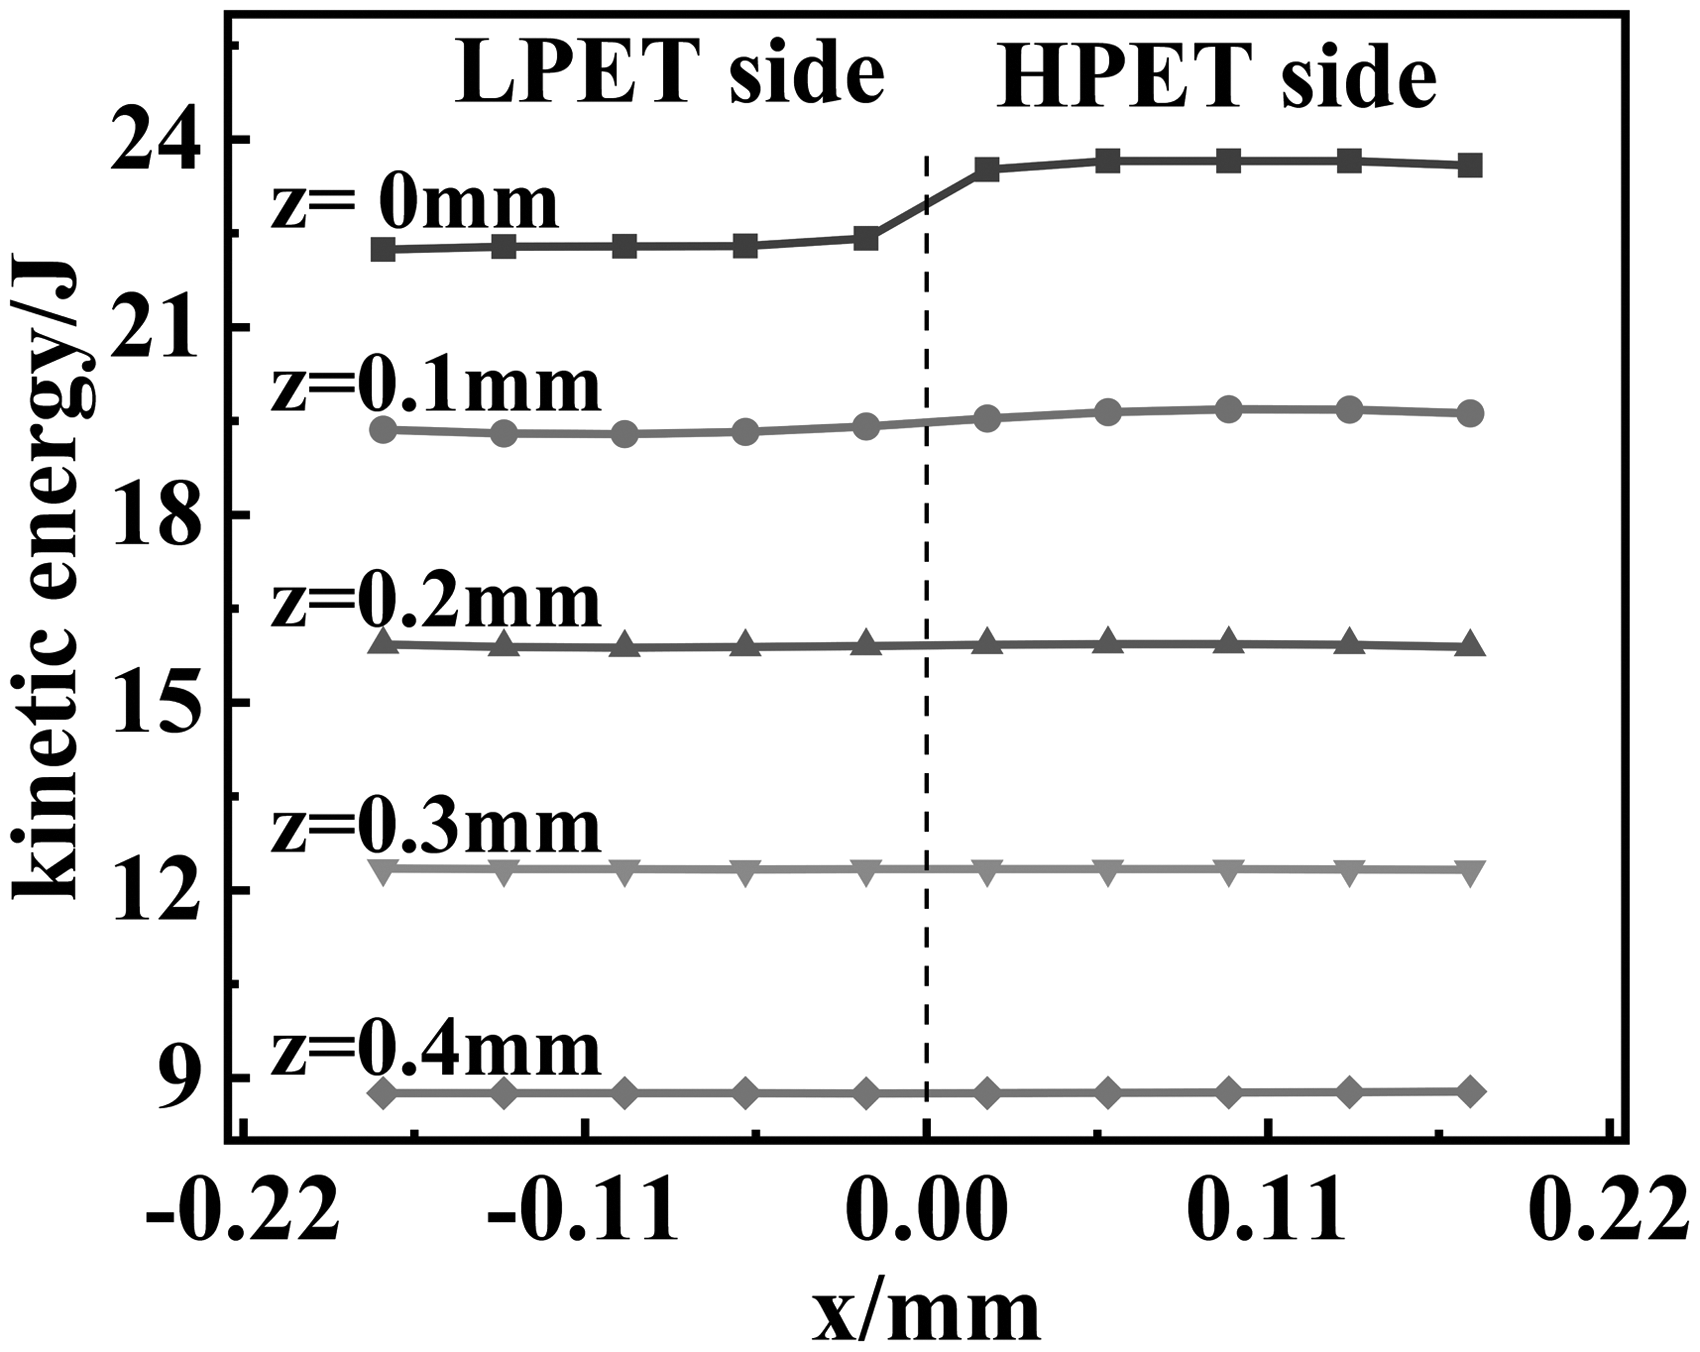
The mechanical energy in the radial direction along the spinning line.
In conclusion, during bicomponent spinning, the distortion and deviation of the interface started in the orifice. The interface position moved to the side of the LPET phase while the LPET phase tended to encapsulate the HEPT phase. The interface position stabilized within a short distance before extrusion while the interface curvature continued to increase throughout the spinning process, and finally stabilized under the effect of cooling. Moreover, the maximum deformation of the interface occurred during extrusion swelling.
Interface under different viscosity ratios
Similar to the previous literature, the interface distortion was explained by the viscosity difference between two component melts. Although there are no two materials with exactly the same properties except viscosity that can be used for experiments, the effect of viscosity difference can be further demonstrated by simulation. A series of zero shear rate viscosity ratios (represented by ηr) were artificially set in addition to the real material (ηr = 1.2) while other parameters were identical. The viscosity parameters of the two components are presented in Table 2. Figure 7(a) shows the interface distribution under different viscosity ratios at the same flow rate. At ηr = 1, the interface overlapped the symmetry axis of the cross-section and no deformation occurred. For ηr ≠ 1, interface shape change was noted and the curvature of the interface increased with the viscosity ratio, proving that viscosity difference was indeed the motivation for the interface distortion.
Viscosity of bicomponent melt
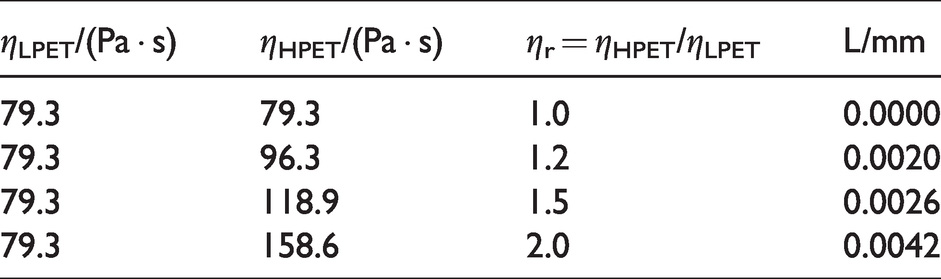
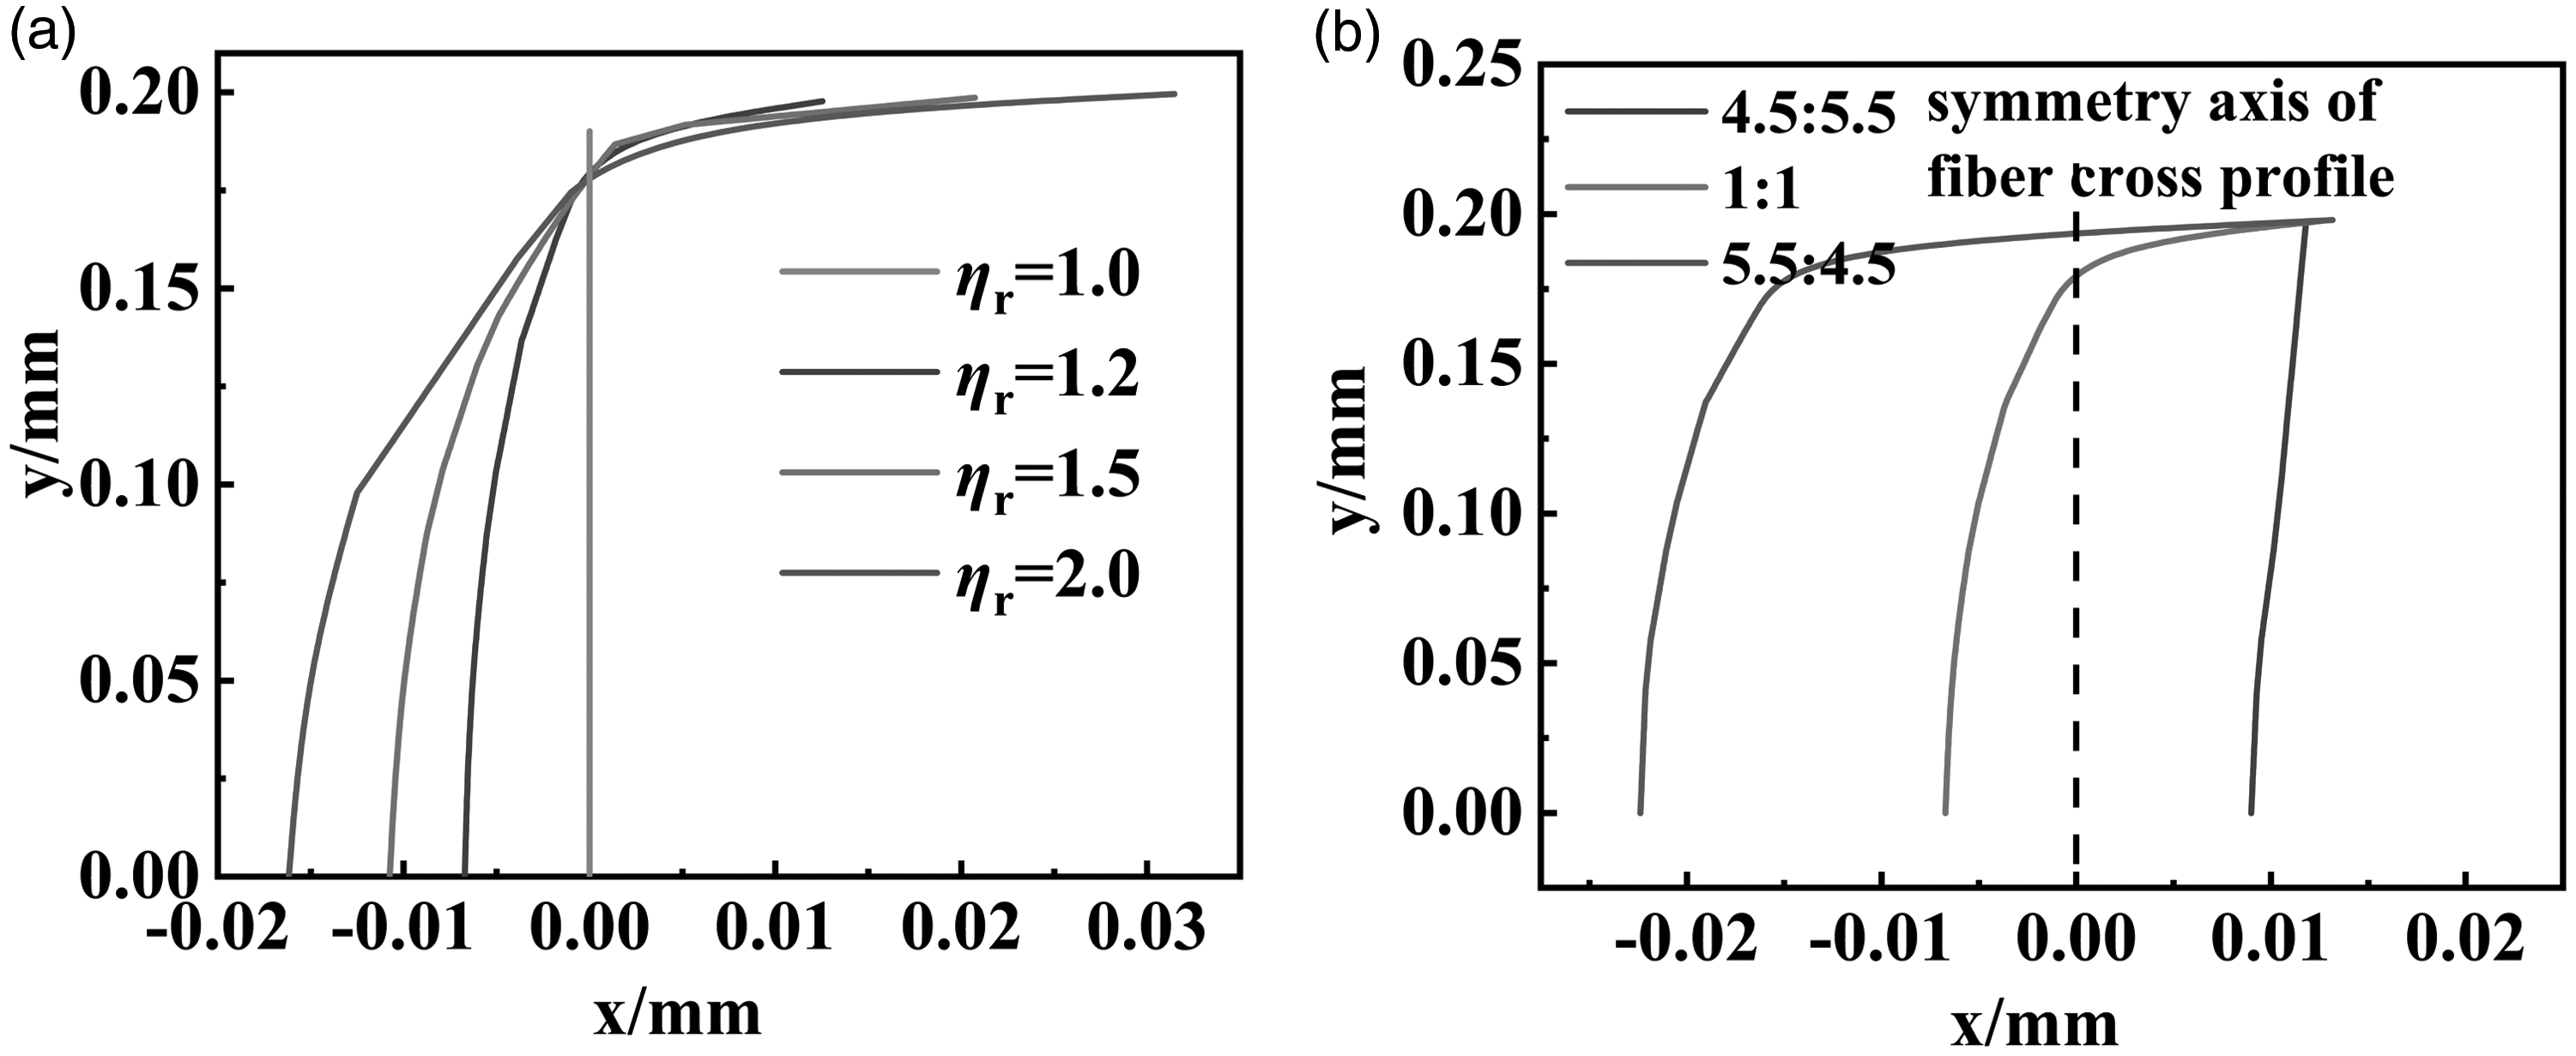
Interface distribution under different (a) viscosity ratios and (b) flow rate ratios.
What is more, for ηr > 1, the position of the interface was biased to the LPET side. Since the shape of the interface is an arc rather than a straight line, the arithmetic mean of the x coordinates of the nodes on the interface was employed here to represent the interface deviation L:

The interface deviation under different zero shear rate viscosity is shown in Table 2. At ηr = 1, the interface deviation L1 = 0 mm. When ηr increased to 2, the interface deviation achieved L2 = –0.0042 mm. The results can be explained because the LPET phase tended to occupy the wall of the orifice while the polymeric melt was incompressible, causing the interface inevitably to move to the side of LPET.
To sum up, the simulation above indicates that the viscosity ratio between two components is primarily responsible for the final shape of the interface. The higher viscosity ratio, the greater the level of encapsulation. To avoid the encapsulation configuration of bicomponent fiber, materials with similar intrinsic viscosity should be used to prepare bicomponent fibers, or the viscosity difference between the two component melts should be reduced through process adjustment.
Interface under different flow rate ratios
After finding out the evolution of the interface, the question therefore arises as to how to regulate the interface configuration during spinning. The inherent properties of the material (intrinsic viscosity, etc.) and the structure of the spinneret are unadjustable, so the process conditions are the most feasible way to regulate the interface while the flow rate ratio is a typical and effective regulation method. To study the influence of the flow rate ratio on the interface distribution, three different ratios were employed to simulate the bicomponent spinning. It should be noted that the flow rate ratio must be within a small range to obtain a convergence solution. The flow rate ratios set are presented in Table 3.
Flow rate of bicomponent melt
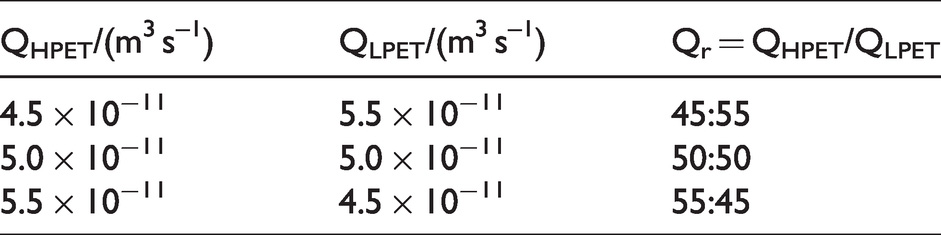
Figure 7(b) shows the interface distribution under different flow rate ratios. The interface deviation (L50:50) was equal to –0.002 mm at the same flow rate. As the Qr was increased to 55:45, the interface deviation (L55:45) was equal to –0.016 mm while L45:55 was equal to 0.010 mm. It can be noted that the position of the interface was biased to the LPET side at Qr = 1. This phenomenon was attributed to the viscosity difference between the bicomponent melts mentioned above. As the flow rate of HPET increased, the interface position kept moving to the side of the LPET. It can then be said that the mechanical energy of the HPET melt increased with the flow rate, leading to a transverse flow that pushed the interface to move. The transverse flow can be seen in Figure 8 which presents the velocity vector under different flow rate ratios.
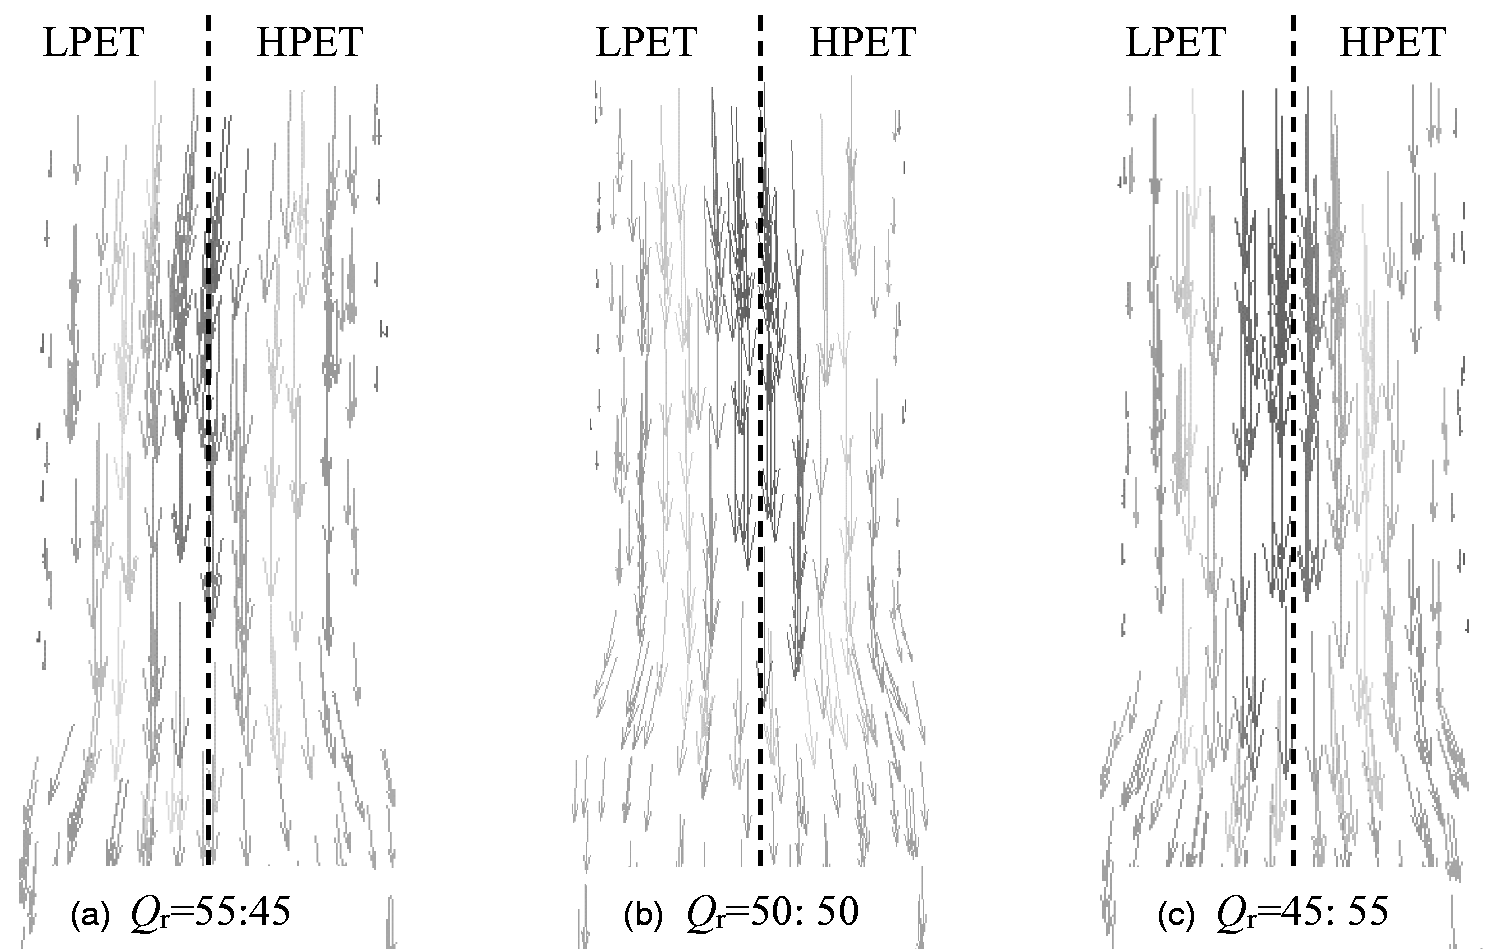
Velocity vector of bicomponent confluence under different flow rate ratios: (a) Qr = 55: 45; (b) Qr = 50: 50 and (c) Qr = 45: 55.
Furthermore, the interface curvature also increased with the flow rate of the HPET melt. Han 7 concluded that the flow rate ratio between individual components was also responsible for the interface curvature. Such an apparent result was easily obtained based on the observation of the cross-section of extrudates. However, the underlying causes of the interface deformation under different flow rate ratios have not been further explored due to the limitation of the experimental conditions. It may be doubted whether viscosity and flow rate ratio both were the factors that governed the interface curvature. Southern and Ballman 20 analyzed the double wraparound interface shapes (component B wrapped component A near the capillary wall while component A wrapped component B at the capillary center), inferring that the shear rate distribution led to different viscosity ratios on the interface, but no direct evidence was presented. In this study, comprehensive flow field data of the spinning process were obtained by numerical simulation, and the effect mechanism of the flow rate ratio on the interface was further demonstrated.
During the side-by-side flow of the melt, the variation of the flow rate is highly likely to lead to a change in the shear rate. In other words, with the rise of the flow rate of the HPET component, the shear rate difference between the two components on both sides of the interface also increased. Besides, the polymer melt is a pseudoplastic nonNewtonian fluid with shear thinning. Therefore, the variation of the difference in shear rate eventually leads to a further increase in the viscosity ratio between the two component melts, facilitating the formation of encapsulation configuration (the greater interface curvature). Figure 9 shows the shear rate distribution and viscosity at the outlet of the orifice. Along the x direction of the cross-section, the shear rate was high near the wall and low in the center, with the viscosity the opposite. There was no obvious shear rate difference and viscosity difference between two component melts because the difference in the inlet flow rate set was small. To distinguish the difference in viscosity, it is convenient to define a quantity 
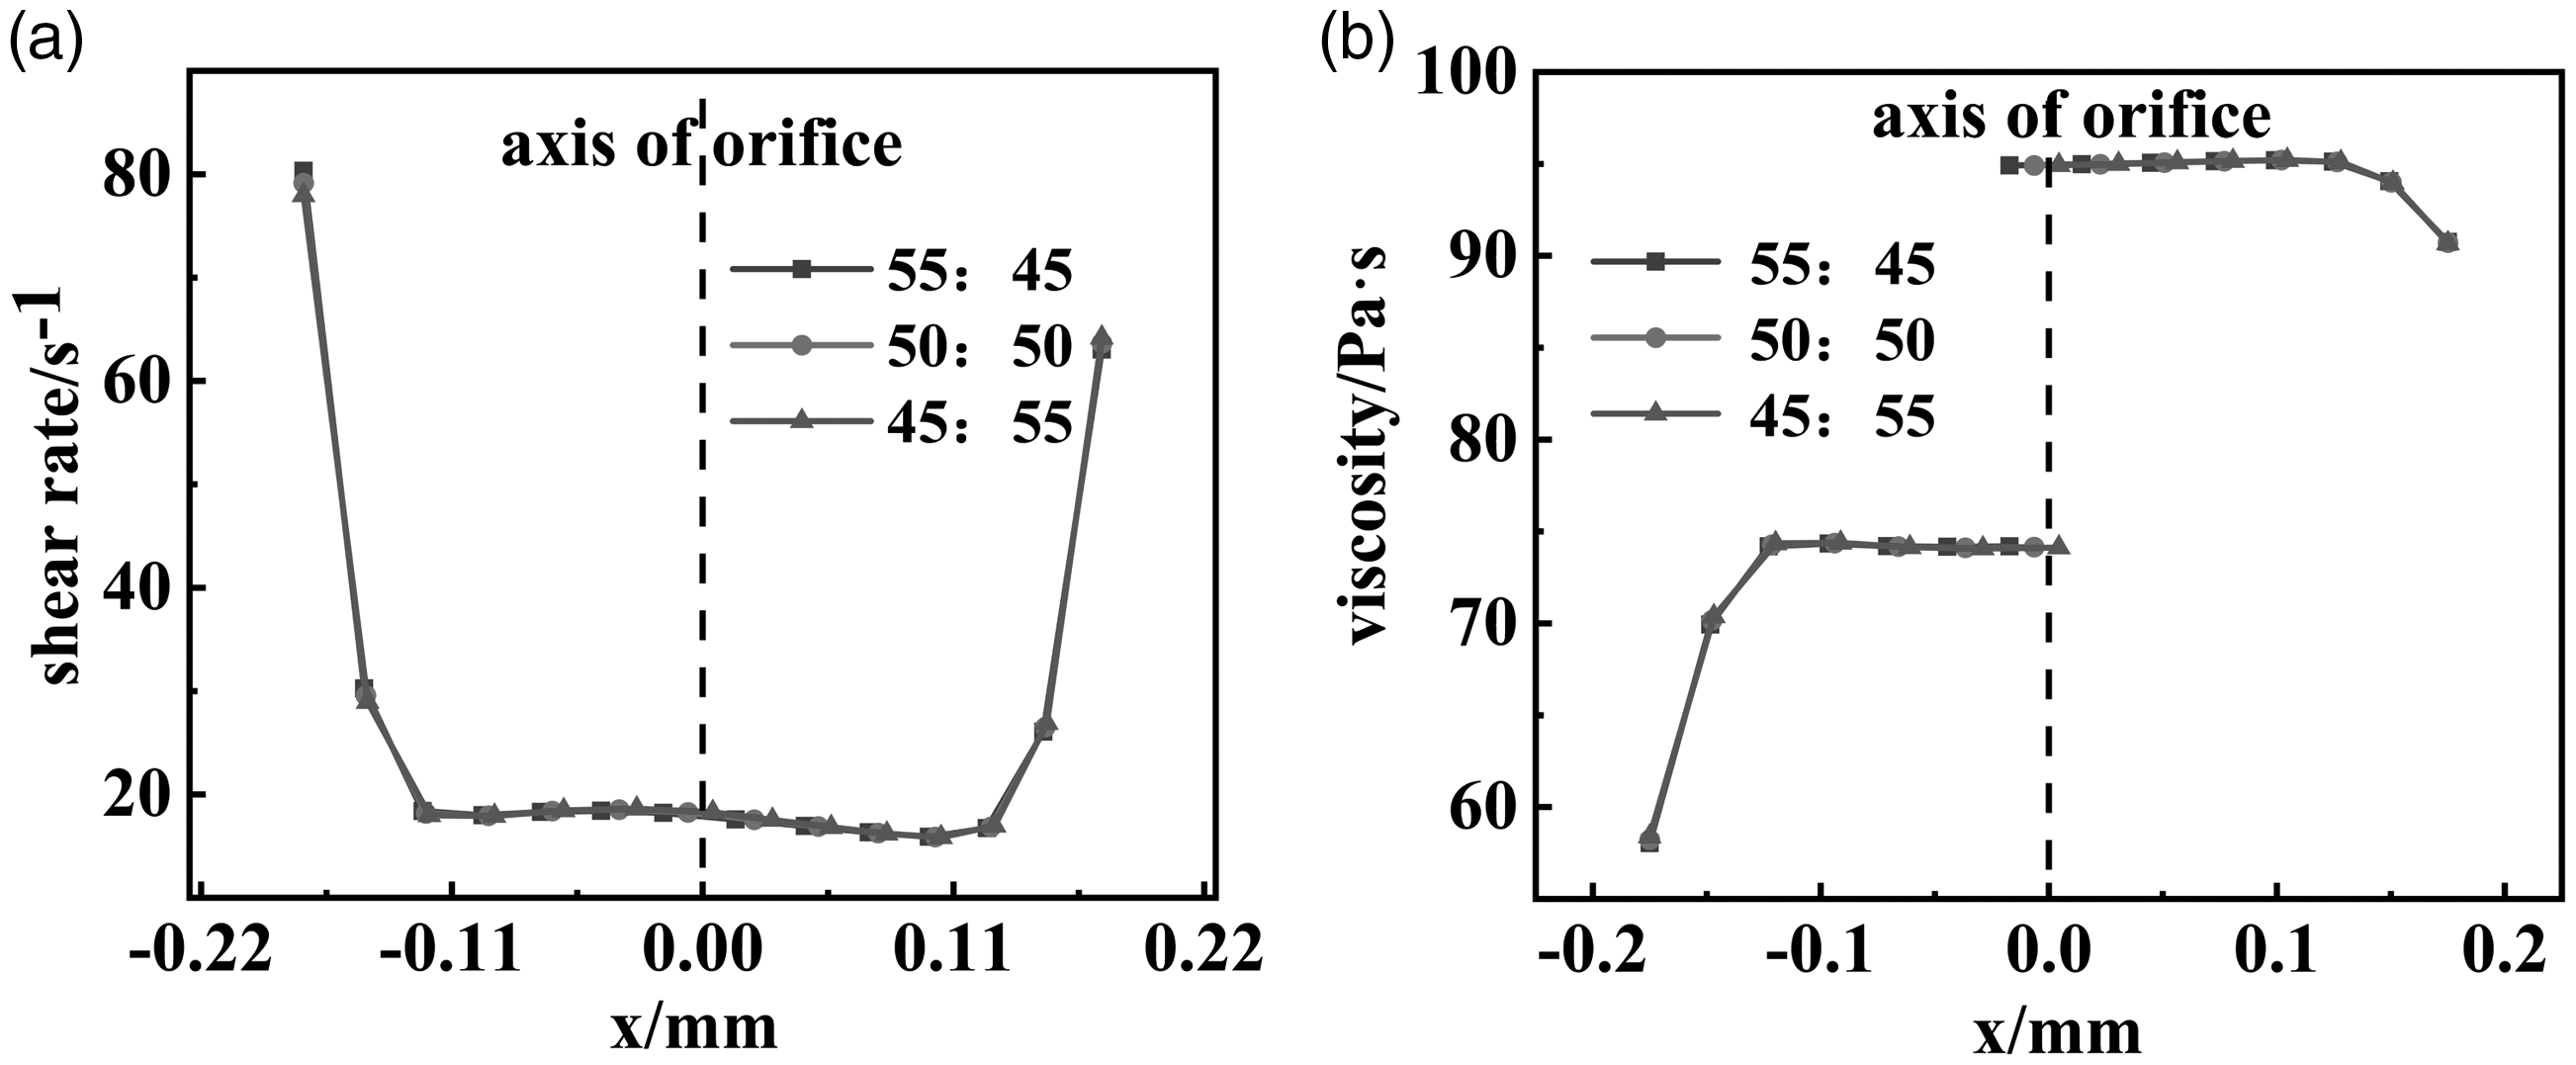
(a) Shear rate and (b) viscosity distribution in the radial direction of orifice outlet.
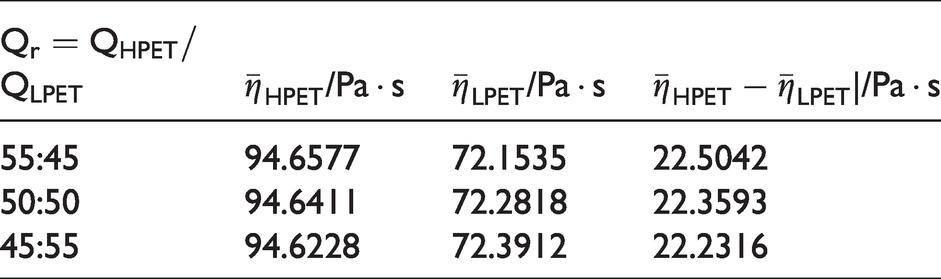
The weighted average viscosity of the two components along the x direction obtained by equation (16) is presented in Table 4. These results demonstrated that the viscosity difference between the two components increased with the flow rate of HPET. Therefore, the variation of interface curvature under different flow rate ratios was fundamentally caused by the viscosity difference between the two component melts. Meanwhile, the viscosity difference between the two components can be reduced by increasing the flow rate of the less viscous component under the premise that the flow rate ratio is close to unity, further suppressing the encapsulation phenomenon.
Average viscosity of bicomponent melts under different flow rate ratios
The bicomponent spinning experiment was carried out to verify the result of the simulation. HPET and LPET were fed into two extruders and transported to the spinning pack, flowing in respective channels. The two components converged in the spinneret, schematically shown in Figure 1. The as-spun HPET/LPET bicomponent fibers were cooled naturally in the air without a blow over cooling. Three different HPET/LPET composition ratios (60:40, 50:50, 40:60) were employed to evaluate the interface morphology. Figure 10 displays the cross-section of HPET/LPET fiber obtained by the bicomponent spinning under three different flow rate ratios. As the flow rate of the HPET component increased, the interface biased more to the LPET side and the interface curvature also increased. The evolution was consistent with the result of numerical simulation, verifying the reliability of the simulation study above.

Cross-section of the HPET/LPET bicomponent fiber under different flow rate ratios: (a) Qr = 40:60; (b) Qr = 50:50 and (c) Qr = 60:40.
Conclusion
The complete flow field parameters and interface evolution of bicomponent spinning including flow in the orifice, extrusion and cooling that cannot be obtained by an experiment were obtained by numerical simulation. The conclusions are as follows:
The interface distortion and position deviation started in the orifice. The interface position stabilized within a short distance before extrusion. The interface curvature continued to increase before the solidification of the melt under cooling. The largest interface distortion occurred during extrusion swelling. Among all the factors causing the interface distortion, the viscosity ratio between the two component melts was the only leading factor. Other factors such as the flow rate ratio and the length-to-diameter ratio of the orifice were both indirect effects that governed the interface by affecting the viscosity ratio at each point on the interface. By slightly increasing the flow rate of the low-viscosity component while the flow ratio was controlled close to unity, an almost ideal side-by-side configuration of bicomponent fiber can be achieved.
Footnotes
Declaration of conflicting interests
The author(s) declared no potential conflicts of interest with respect to the research, authorship, and/or publication of this article.
Funding
The author(s) disclosed receipt of the following financial support for the research, authorship, and/or publication of this aticle: This work was supported by the Open Research Fund of Shanghai High Performance Fibers and Composites Center (Province-Ministry Joint) (X12812101/010/002) and the National Key Research and Development Program of China (2016YFB0302703).
