
Abstract
Electrical responses of three-dimensional braided composites under mechanical loads are important for the design of structural health monitoring in real time. Here we reported electrical properties and electrical-mechanical behaviors of three-dimensional braided composites with different braiding angles under three-point bending load, and investigated the correlation between electrical resistance and damage of the three-dimensional braided composites. We found that change of resistance reflected damage modes of the composite. In addition, we proposed an electrical-mechanical model to explain the resistance changes of three-dimensional braided composites based on the Weibull distribution function. The results of the model verify the effectiveness and rationality of the experimental results under bending load, which provides a theoretical basis for the structural health monitoring of three-dimensional braided composites through a electrical resistance change method.
Keywords
Continuous structural health monitoring technique of the carbon fiber reinforced polymer (CFRP) has been applied to the aerospace field for improving structure safety1–3 with a lower cost. A number of real-time damage monitoring methods on CFRP composites have been developed4–10 recently. The CFRP composites have self-monitoring capability due to the electrical conductivity of carbon fibers. When there is a correlation between electrical resistance and structural damage, self-sensing can be achieved by measuring the resistance change of the composite. The resistance of the composite is constant before it is subjected to loading. Once the structure is damaged, the internal conductive network changes. The change in resistance can predict damage modes of the composite. Therefore, Wang and Chung 11 and Wang et al. 12 studied thickness resistance change of a single fiber reflecting the degree of fiber crimping under tensile loading. Jiang and Li 13 found that interfacial shear stresses caused the change of interfacial structure, and led to the change of resistance between single fiber and matrix under tensile. The electrical resistance change method (ERCM) was reported to detect the damage of CFRP.14–19
In previous studies, the ERCM has been used to detect cracking of laminate composites under tensile, 20 compression, 21 and bending.22,23 Grammatikos and Paipetis 24 found that invisible crack caused the resistance to increase irreversibly under tensile. Roh et al. 25 have proved that electromechanical response was correlated to the deformation of composites and crack propagation from elastic region to failure under three-point bending. Kwon et al. 26 reported that the resistance changes were consistent with crack propagation when flexed. As a result, the ERCM is feasible for damage detection in CFRP. Likewise, it is necessary to establish a quantitative analysis of damage between resistances under external loading.
Many researchers have performed in-depth studies of the electrical-mechanical model of CFRP under loading from different perspectives. Park et al. 27 and Wen et al. 28 introduced the concept of electrical ineffective length, related to the typical length of broken fiber to recover its current carrying capacity due to electrical contact points between fibers under tensile loading. Xia and Curtin 29 proposed a fiber random contact model to simulate the transverse conduction as well as longitudinal resistance of CFRP under tensile loading. Although the assumption of ideal periodic fiber distribution simplifies the calculation of circuit, it cannot address the effect of random fiber distribution on the properties. Therefore, we found that ERCM was not used to monitor the three-dimensional (3-D) braided composites under three-point bending, and the electrical-mechanical model of the 3-D braided composites under three-point bending has not been mentioned.
Here we measured the electrical properties of 3-D braided composites with the four-electrodes method. Based on the Weibull distribution function and Euler Bernoulli theory, we proposed the electrical-mechanical model to verify experimental results under three-point bending. The damage types of 3D braided composites were characterized by electrical resistance method.The relationship between damage modes and resistance during quasi-three-point bending was revealed.
Experimental method
Sample preparation
The carbon fiber (T700-12 k, from Zhongfu Shenying Carbon Fiber Co. Ltd) braided preforms were fabricated with 1 × 1 four-step braiding technique as shown in Figure 1(a). The preforms of 15°, 25°, and 35° were fabricated, respectively. The epoxy resin (JC-02A, from Changshu Jiafa Co. Ltd of China) was injected into the preforms with the vacuum-assisted resin transfer molding (VARTM) technique. The fiber volume fraction of samples was 42.2%, 45.1%, 48.5%, respectively. Figure 1(b) shows the 3-D braided composites with the braiding angles of 15°, 25°, and 35°, respectively. Figure 1(c) shows the size of each sample was 135 mm × 35 mm × 6 mm, and electrode spacing and span distance were 90 mm and 100 mm respectively.
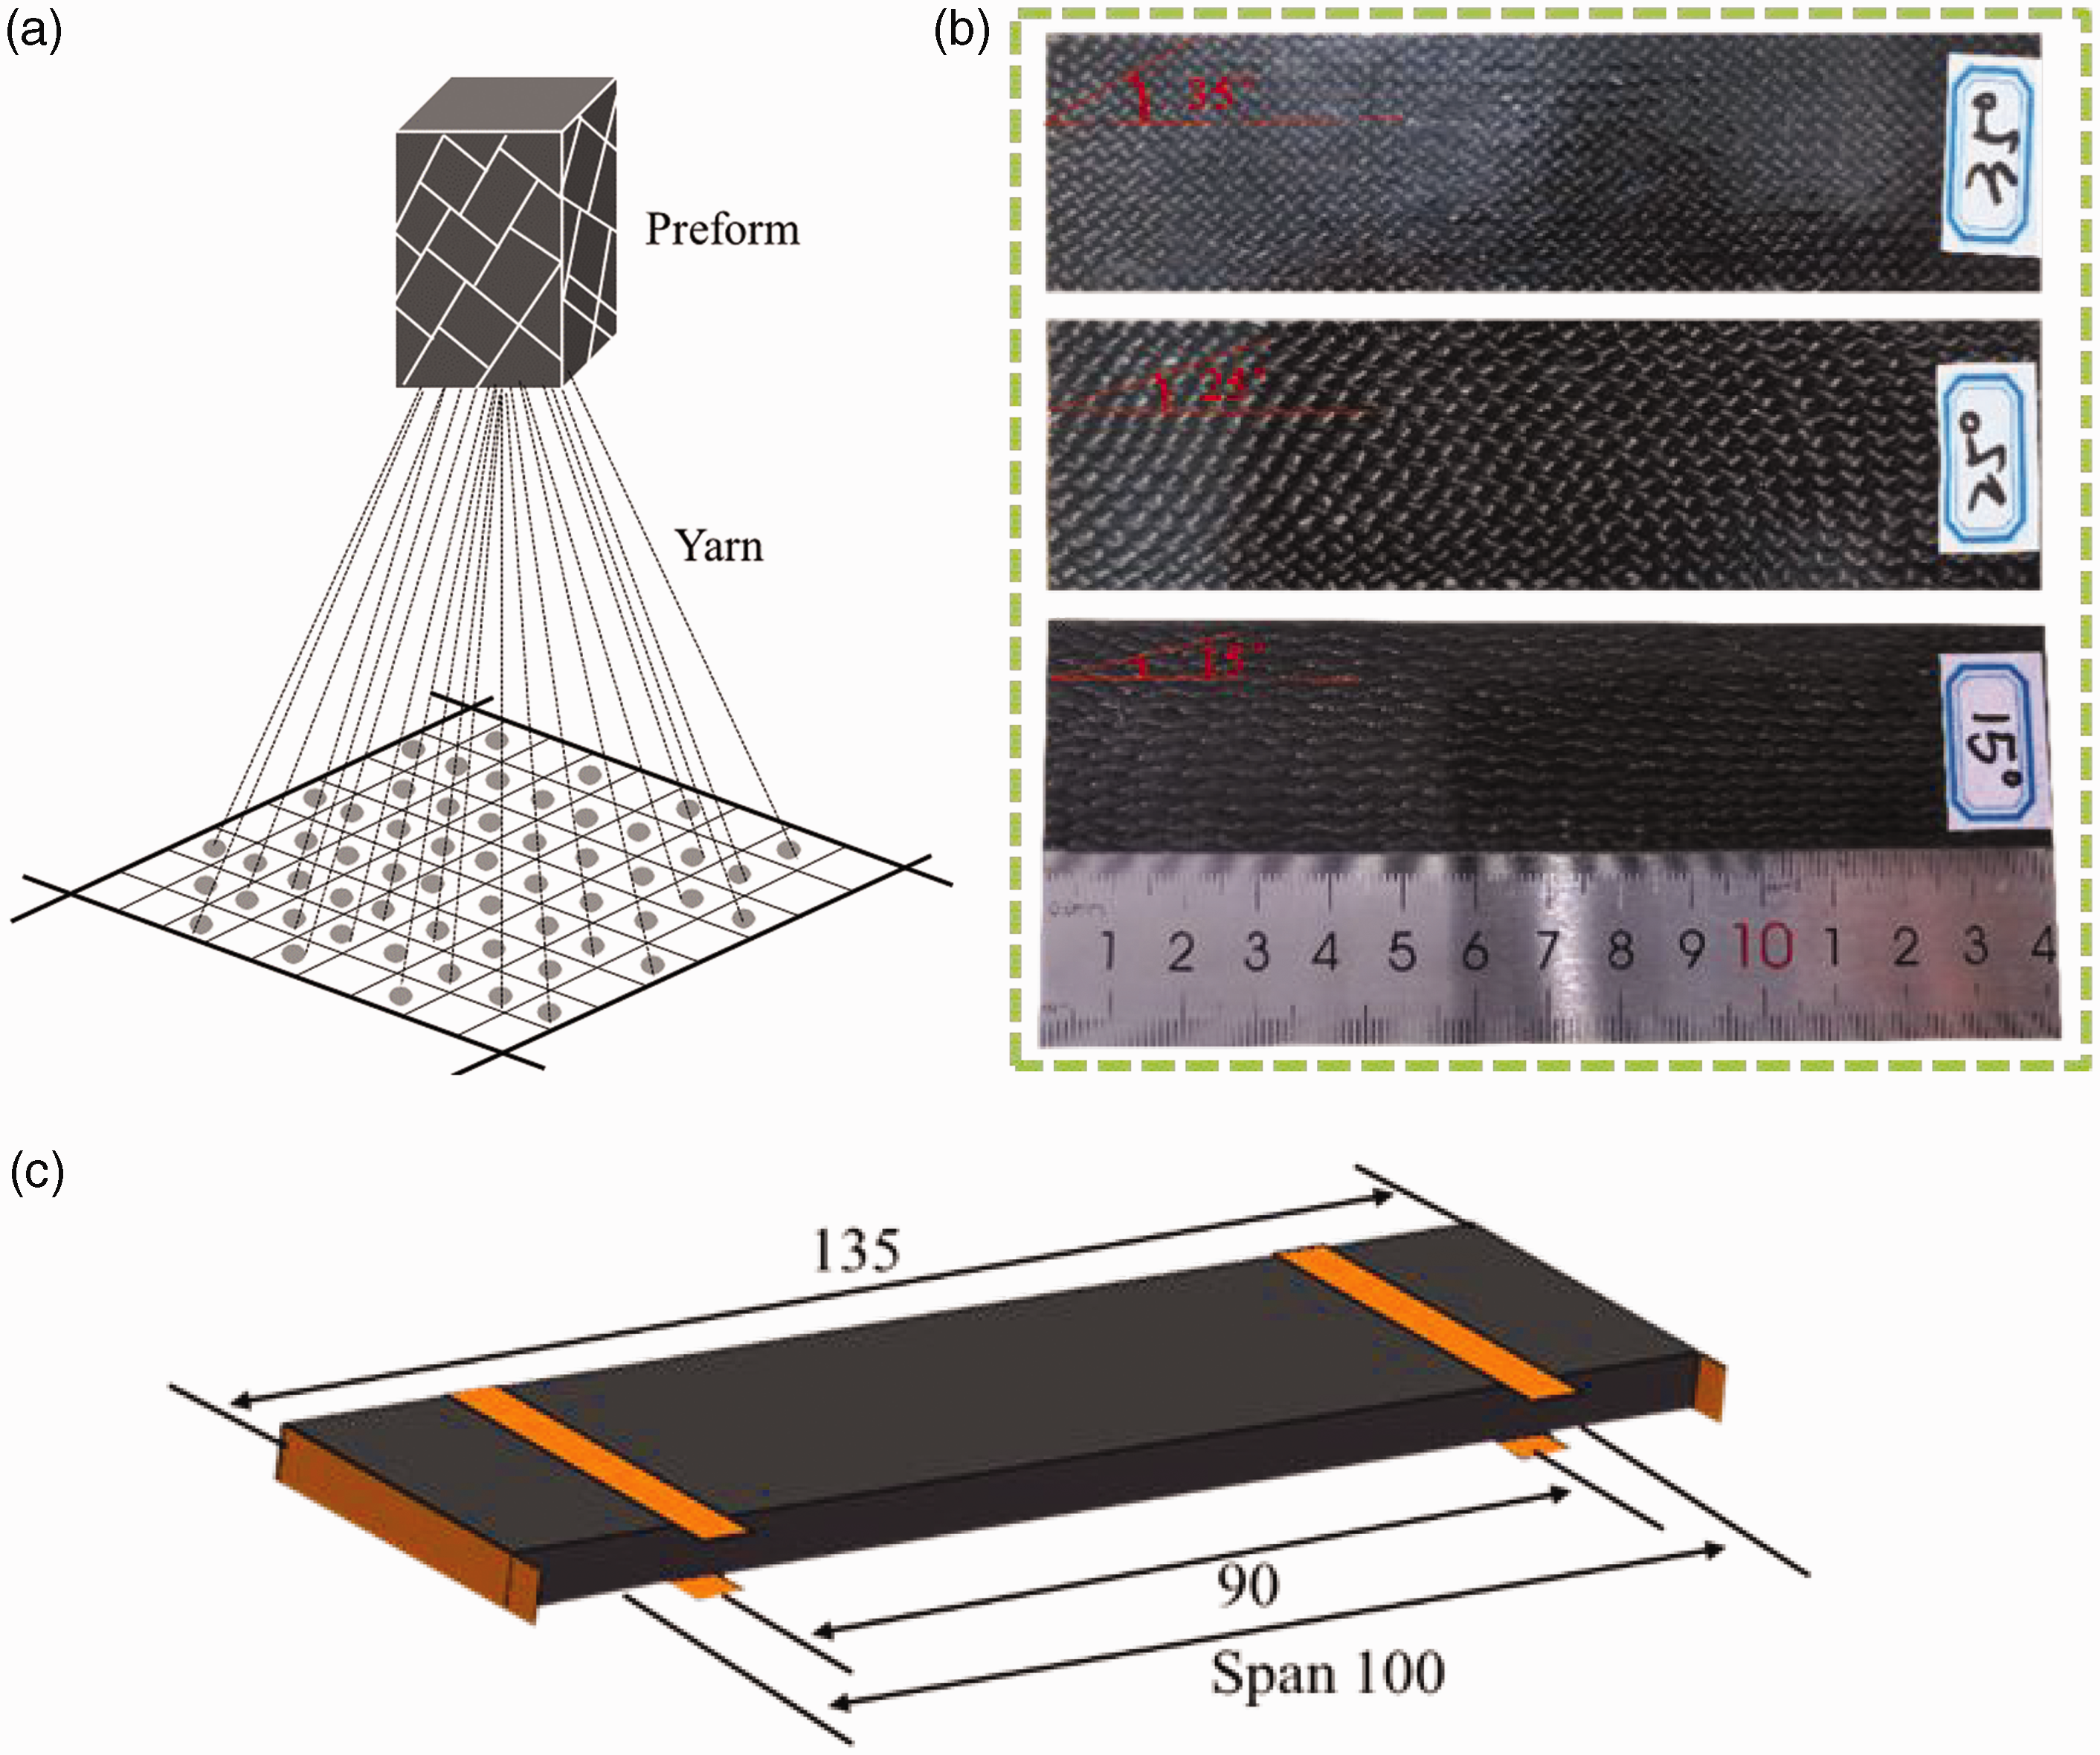
Sample preparation: (a) 3-D braided preform; (b) composite samples in different braiding angle and (c) sample size, copper electrodes on the compressive surface and tensile surface.
Tests
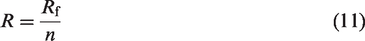
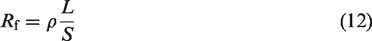
Figure 2(a) and (b) show that the surface resistance and longitudinal resistance were measured using the four-electrode method. The four electrodes consisted of two outer electrodes for current input and two inner electrodes for voltage output.

Measurement principle: (a) surface resistance measurement and (b) longitudinal resistance measurement. DC: direct current.
Quasi-static three-point bending tests were performed on MTS 810.23 at a loading rate of 2 mm/min. A constant current of 100 mA was introduced to the sample during loading, and an Agilent demodulator was used to record the change of voltage. Each test was repeated two times on the MTS test system. Figure 3 shows the whole testing setup. The bending test standard refers to ASTM 7264 and the span-thickness ratio was selected as 16:1.
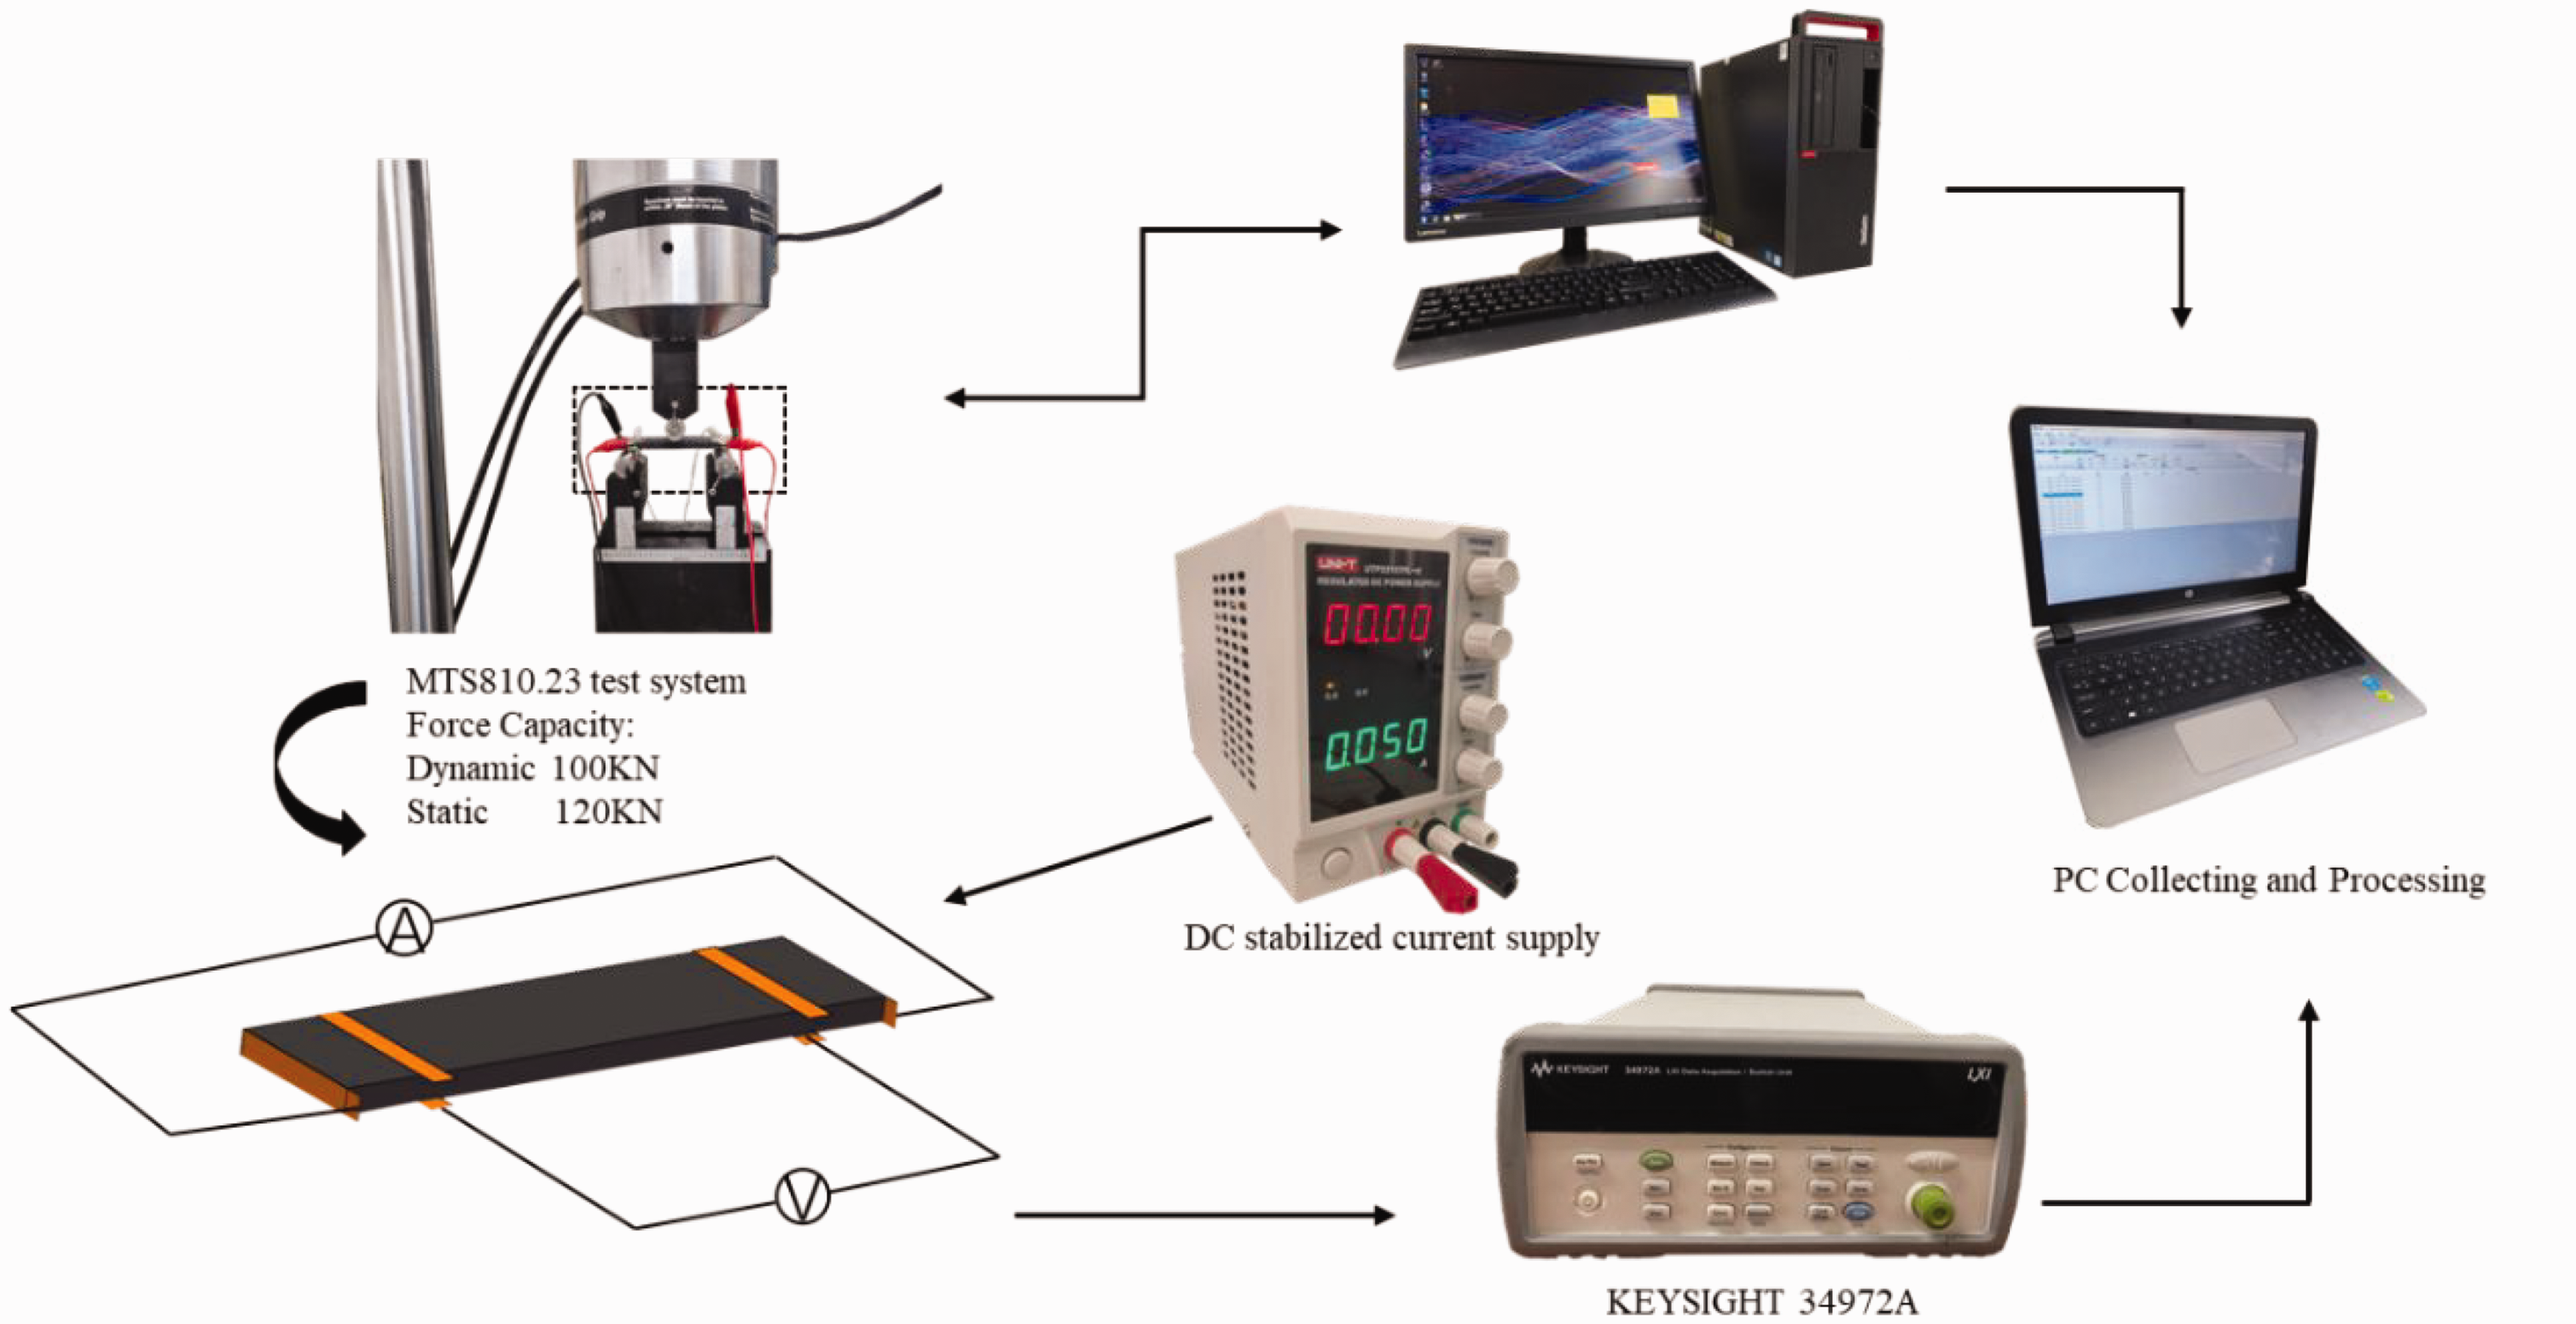
Electrical-mechanical test setup.
Macroscopic failure mechanism
Mechanical properties of 3-D braided composites are anisotropic, and the braiding angle is an important parameter affecting bending strength. 30 The composite of different braiding angles has diverse failure mechanisms. 31 The damage modes of 3-D braided composites are resin crack, fiber fracture, and resin shedding under three-point bending load. 32
The bearing force of the cross-section of a small braiding angle is uneven, and resin shedding occurs on one side of the compression surface when the load reaches maximum. The fiber fracture due to failure strength of tensile surface and crack propagation until to neutral surface leads to failure of samples. The resin-fiber interface debonding of the compression surface of a large braiding angle leads to a decrease of bending strength. The neutral surface of the samples tends to a tensile surface after deformation resulting in decrease of maximal tensile stress. Therefore, the samples have not been damaged after plastic deformation.
The above analysis shows that the failure of 3-D directional braided composites is mainly caused by fiber deformation and fracture, and the fiber strength in the longitudinal direction is an important indicator of the overall bending strength. The 3-D braided composites are transversely isotropic materials. The next section introduces the three-point bending failure of the 3-D braided composites, analyzes the fiber deformation and fiber fracture process, and derives the electromechanical model that reflects the fiber fracture of the composites under bending load.
Electrical-mechanical model
Based on the failure mechanism of composite, the conductive network of the composite is changed by the three-point bending load. Therefore, in order to model the resistance of change of the 3-D braided composite, the Weibull distribution function is introduced due to the random nature of fiber contacts during three-point bending. The resistance changes of 3-D braided composite show that these stages can be described in the cracking of resin and fiber fracture.
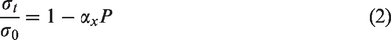
When cracking of resin occurs the increasing number of fiber contacts reduces the resistance changes and increases the electrical conductivity of the sample. As a result, resistance changes in terms of deflection are observed. Due to the random event of fiber contacts, the solution is to apply statistics theory using the Weibull distribution function:

Deformation of the resin and fibers in the 3-D braided composite under three-point bending load, results in a change in the size and shape of carbon fiber until the failure of neutral surface. The change in conductivity of the samples subjected to continuous stress
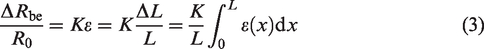
According to Hooke's law and other parameters, the electrical resistance changes of macroscopic is obtained as
According to the statics relation,
33
the physical expression of normal stress
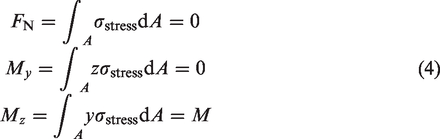
FN is the axial force on the cross section, My is the coupling moment on the y-axis, and Mz is the coupling moment on the z-axis.
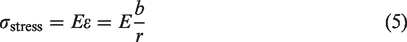
Assuming that there is no extrusion between the longitudinal fibers parallel to the neutral surface, then the longitudinal fibers are in unidirectional tension or compression. Combined with the geometric relationship before and after deformation, the physical relationship is satisfied as
Through the coupling torque deformation in the z-axis direction, the curvature formula of the neutral layer can be obtained
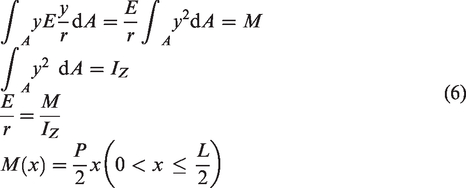
Then substituting equation (6) into equation (5) we can obtain

Resistance model of resin cracking (RRC model)
Then substituting equations (7) and (2) into equation (3) the resistance change of the sample can be derived as

Resistance model of fiber fracture (RFF model)
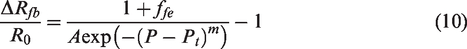
This is used once the fiber damage has occurred which is mainly fractured. The general exponential function can be adopted to describe the relation between electrical conductivity and bending load

Results and discussion
Electrical properties
Figure 4(a) shows the relationship between voltage and current from 0.01 A to 0.08 A. Figure 4(b) shows longitudinal resistance increases with increasing braiding angle. The conductive mechanism of the 3-D braided composites depends on the length of yarn in the longitudinal direction, and is related with resistance within a single yarn.
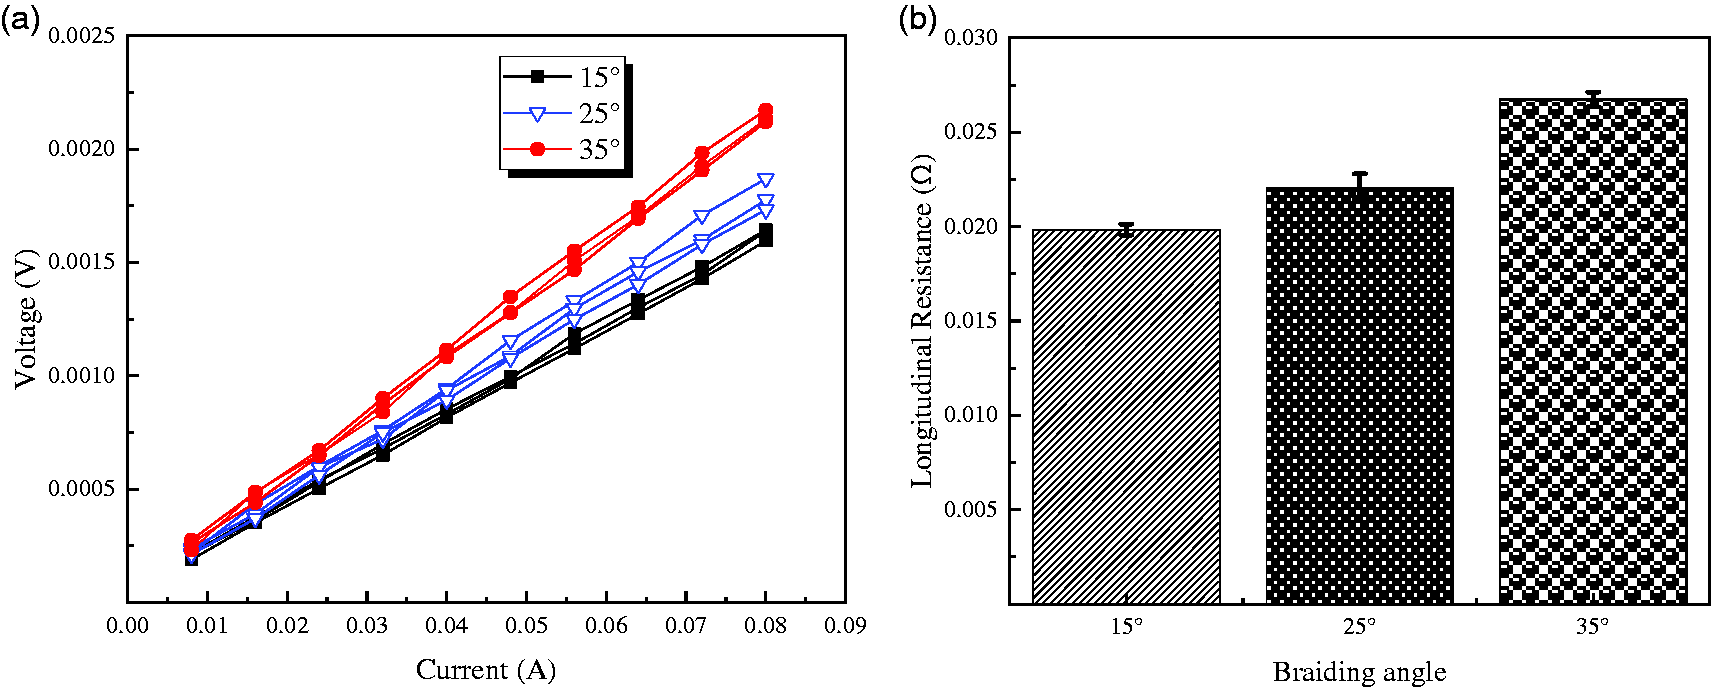
Electrical properties: (a) voltage-current relationship and (b) longitudinal resistance.
Figure 5 shows the trajectory of a single yarn in the corner unit cell region of a four-step braided composite. It is observed that the single yarn bulking degree of the different braiding angle is not consistent. The conductive mechanism of carbon fibers in the longitudinal direction depends on the number of fibers carrying a local current past a measurement electrode is

Single yarn space trajectory in braided preforms.
For samples with differences in braiding angle and the sample length, the fiber buckling of a large braiding angle is higher than that of a small braiding angle. Therefore, the resistance of a large braiding angle is higher than that of a small braiding angle under the sample length.
Figure 6 shows the potential of the upper and lower surfaces in the samples with direct current (DC) in the longitudinal direction. The upper and lower surfaces potentials of samples 35° are equivalent due to the transversely isotropic and braided unit's homogenization of braided composites.
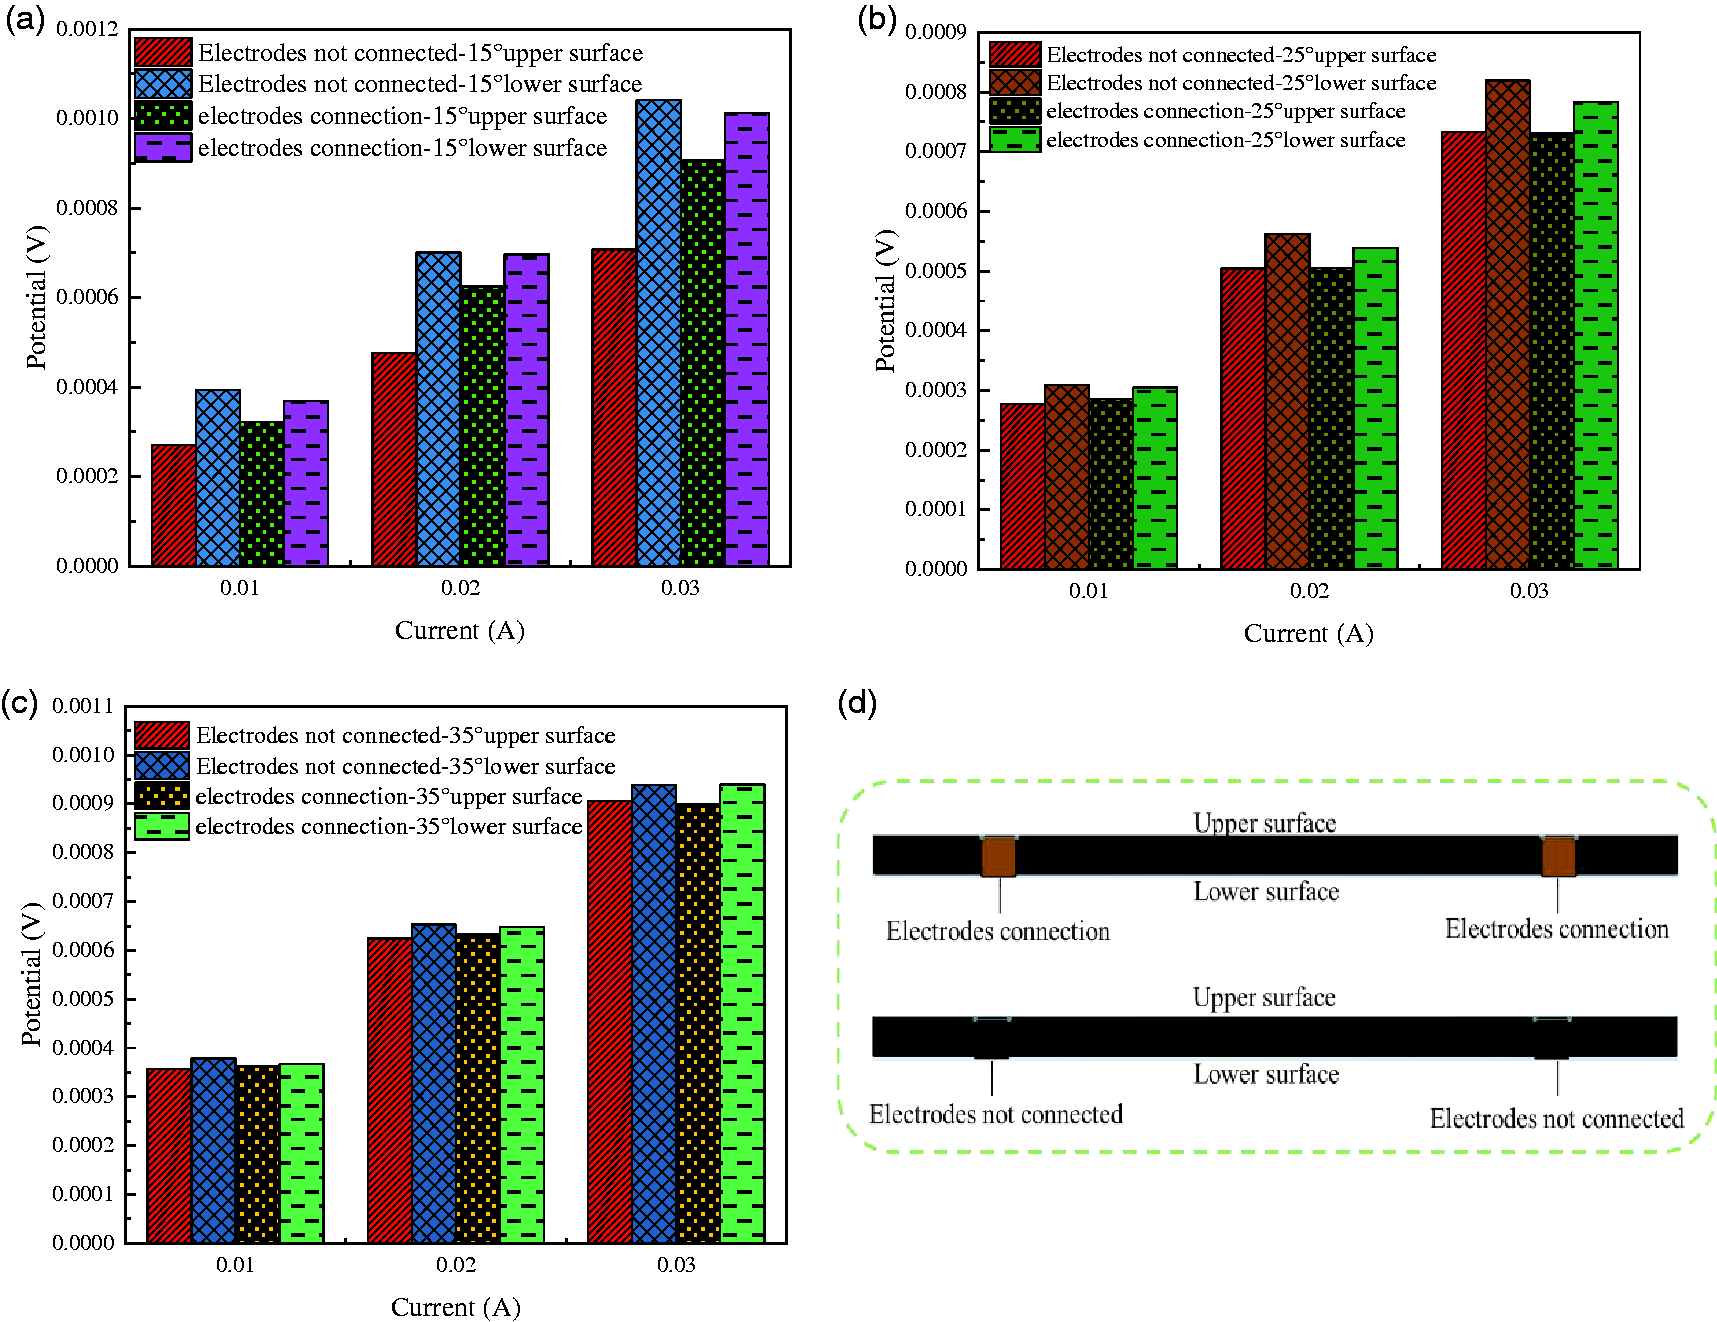
Potential obtained from the electrodes on the upper and lower surfaces in the longitudinal direction under non-load: (a) specimen 15°; (b) specimen 25°; (c) specimen 35° and (d) electrode configuration.
Electrical-mechanical behaviors under three-point bending load
Bending macroscopic mechanical behaviors
Figure 7(a) shows the load-deflection curves of 3-D braided composites with the braiding angles of 15°, 25° and 35°. It shows that the failure load decreases with the increasing braiding angle. Figure 7(b) shows the mechanical analysis of samples in longitudinal tensile and compressive directions. Figure 7(c) and (d) show that bending strength and modulus both decrease with the increasing braiding angle. Samples with braiding angle of 15° have high fiber orientation in the braiding direction. A number of fiber tows have the load-bearing capacity in the longitudinal direction and causing higher mechanical properties. However, samples with braiding angle of 25° and 35° have low fiber orientation, with a large number of fiber tows crimping in the longitudinal direction leading to a poor load-bearing capacity of fibers in the braiding direction.
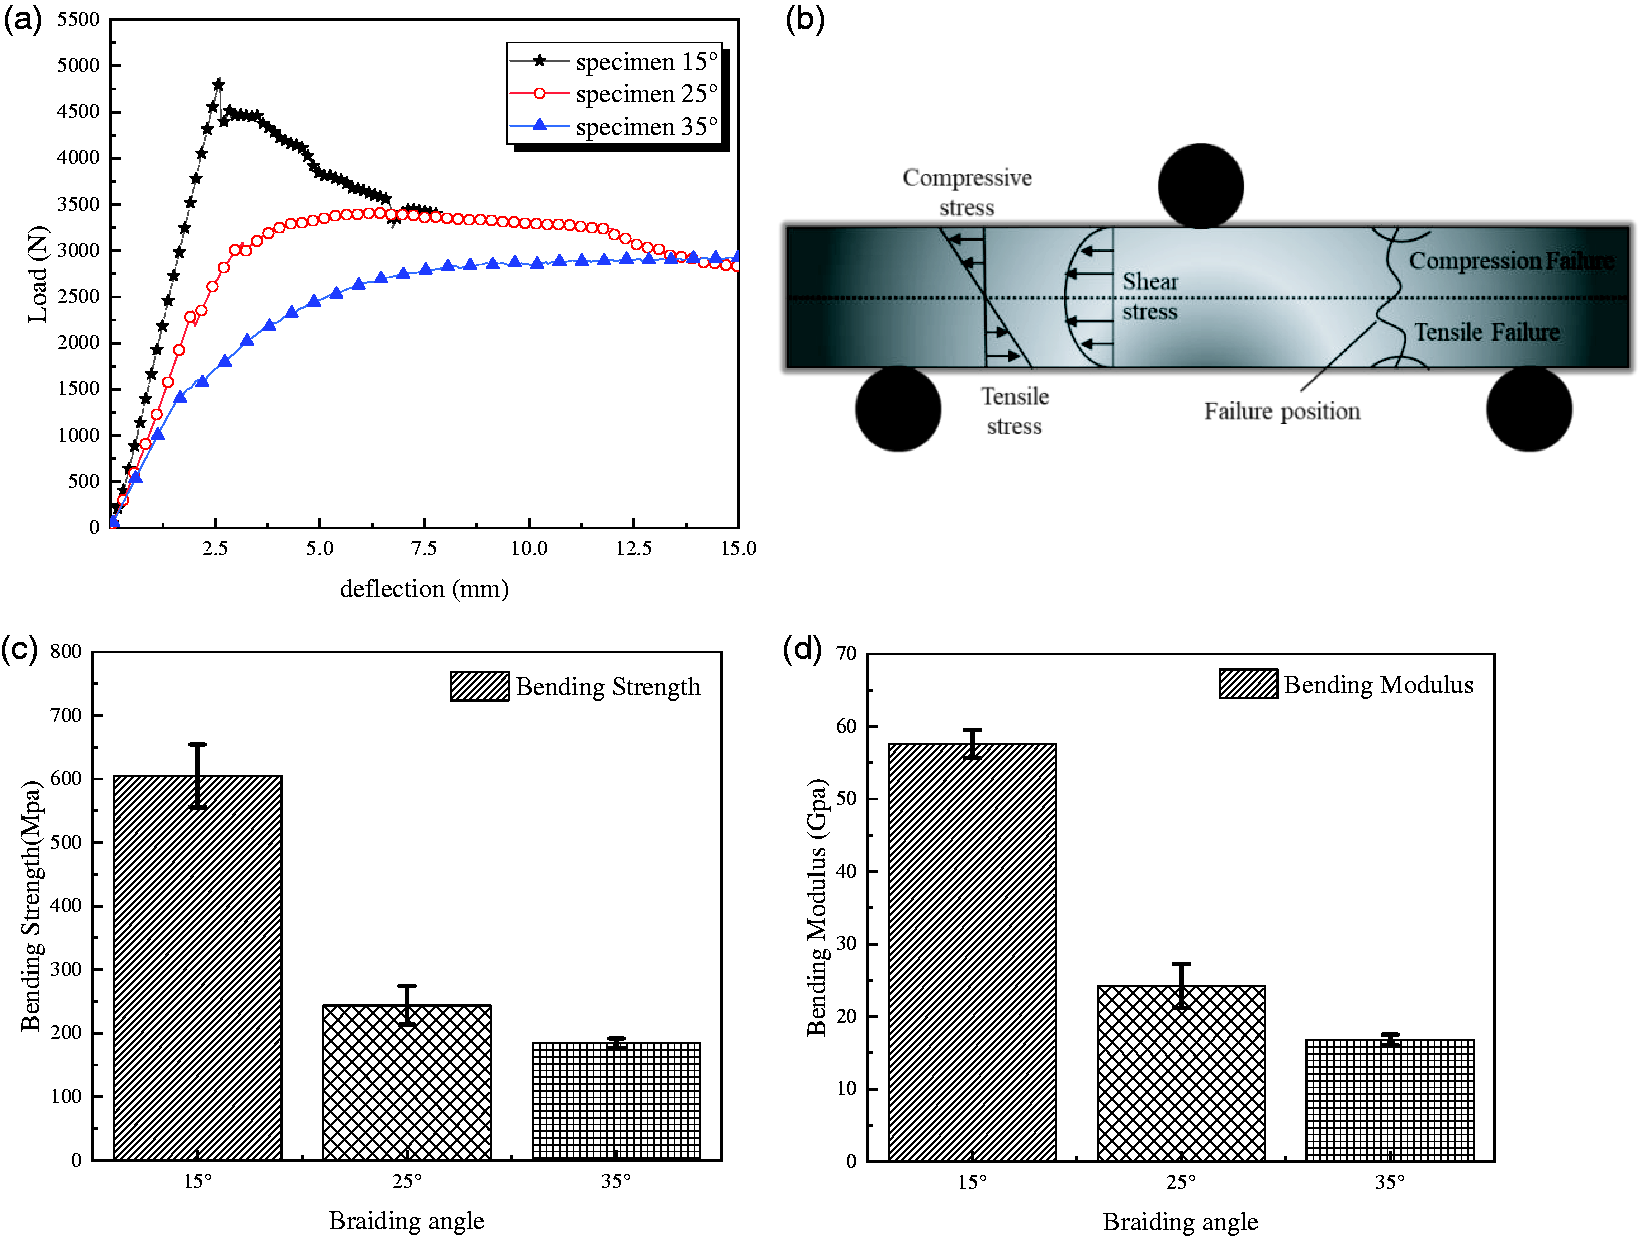
Load-deflection curves and mechanical properties in different angles during bending: (a) load-deflection relationship; (b) three-point bending force representation; (c) bending strength and (d) bending modulus.
Effect of damage on surface resistance
The force form of the 3-D braided composite is divided into tensile regions and compression regions during three-point bending. Therefore, we analyzed the difference in resistance change of the composite under action of tension and compression. The electrodes were placed on the upper and lower surfaces respectively, the failure process was analyzed by the change of compression and tensile surface resistance caused by resin cracking and fiber fracture in the process of stress transfer.
Figure 8(a), (b), and (c) show the load-deflection curves and resistance changes obtained from samples with compressive surface and tensile surface under three-point bending load. The loading procedure of samples is divided into I, II, III stages, respectively. The point A is the starting position of load and point B is the maximal load in the elastic stage, point C is the position of before sample failure, and point D is the position of sample failure.
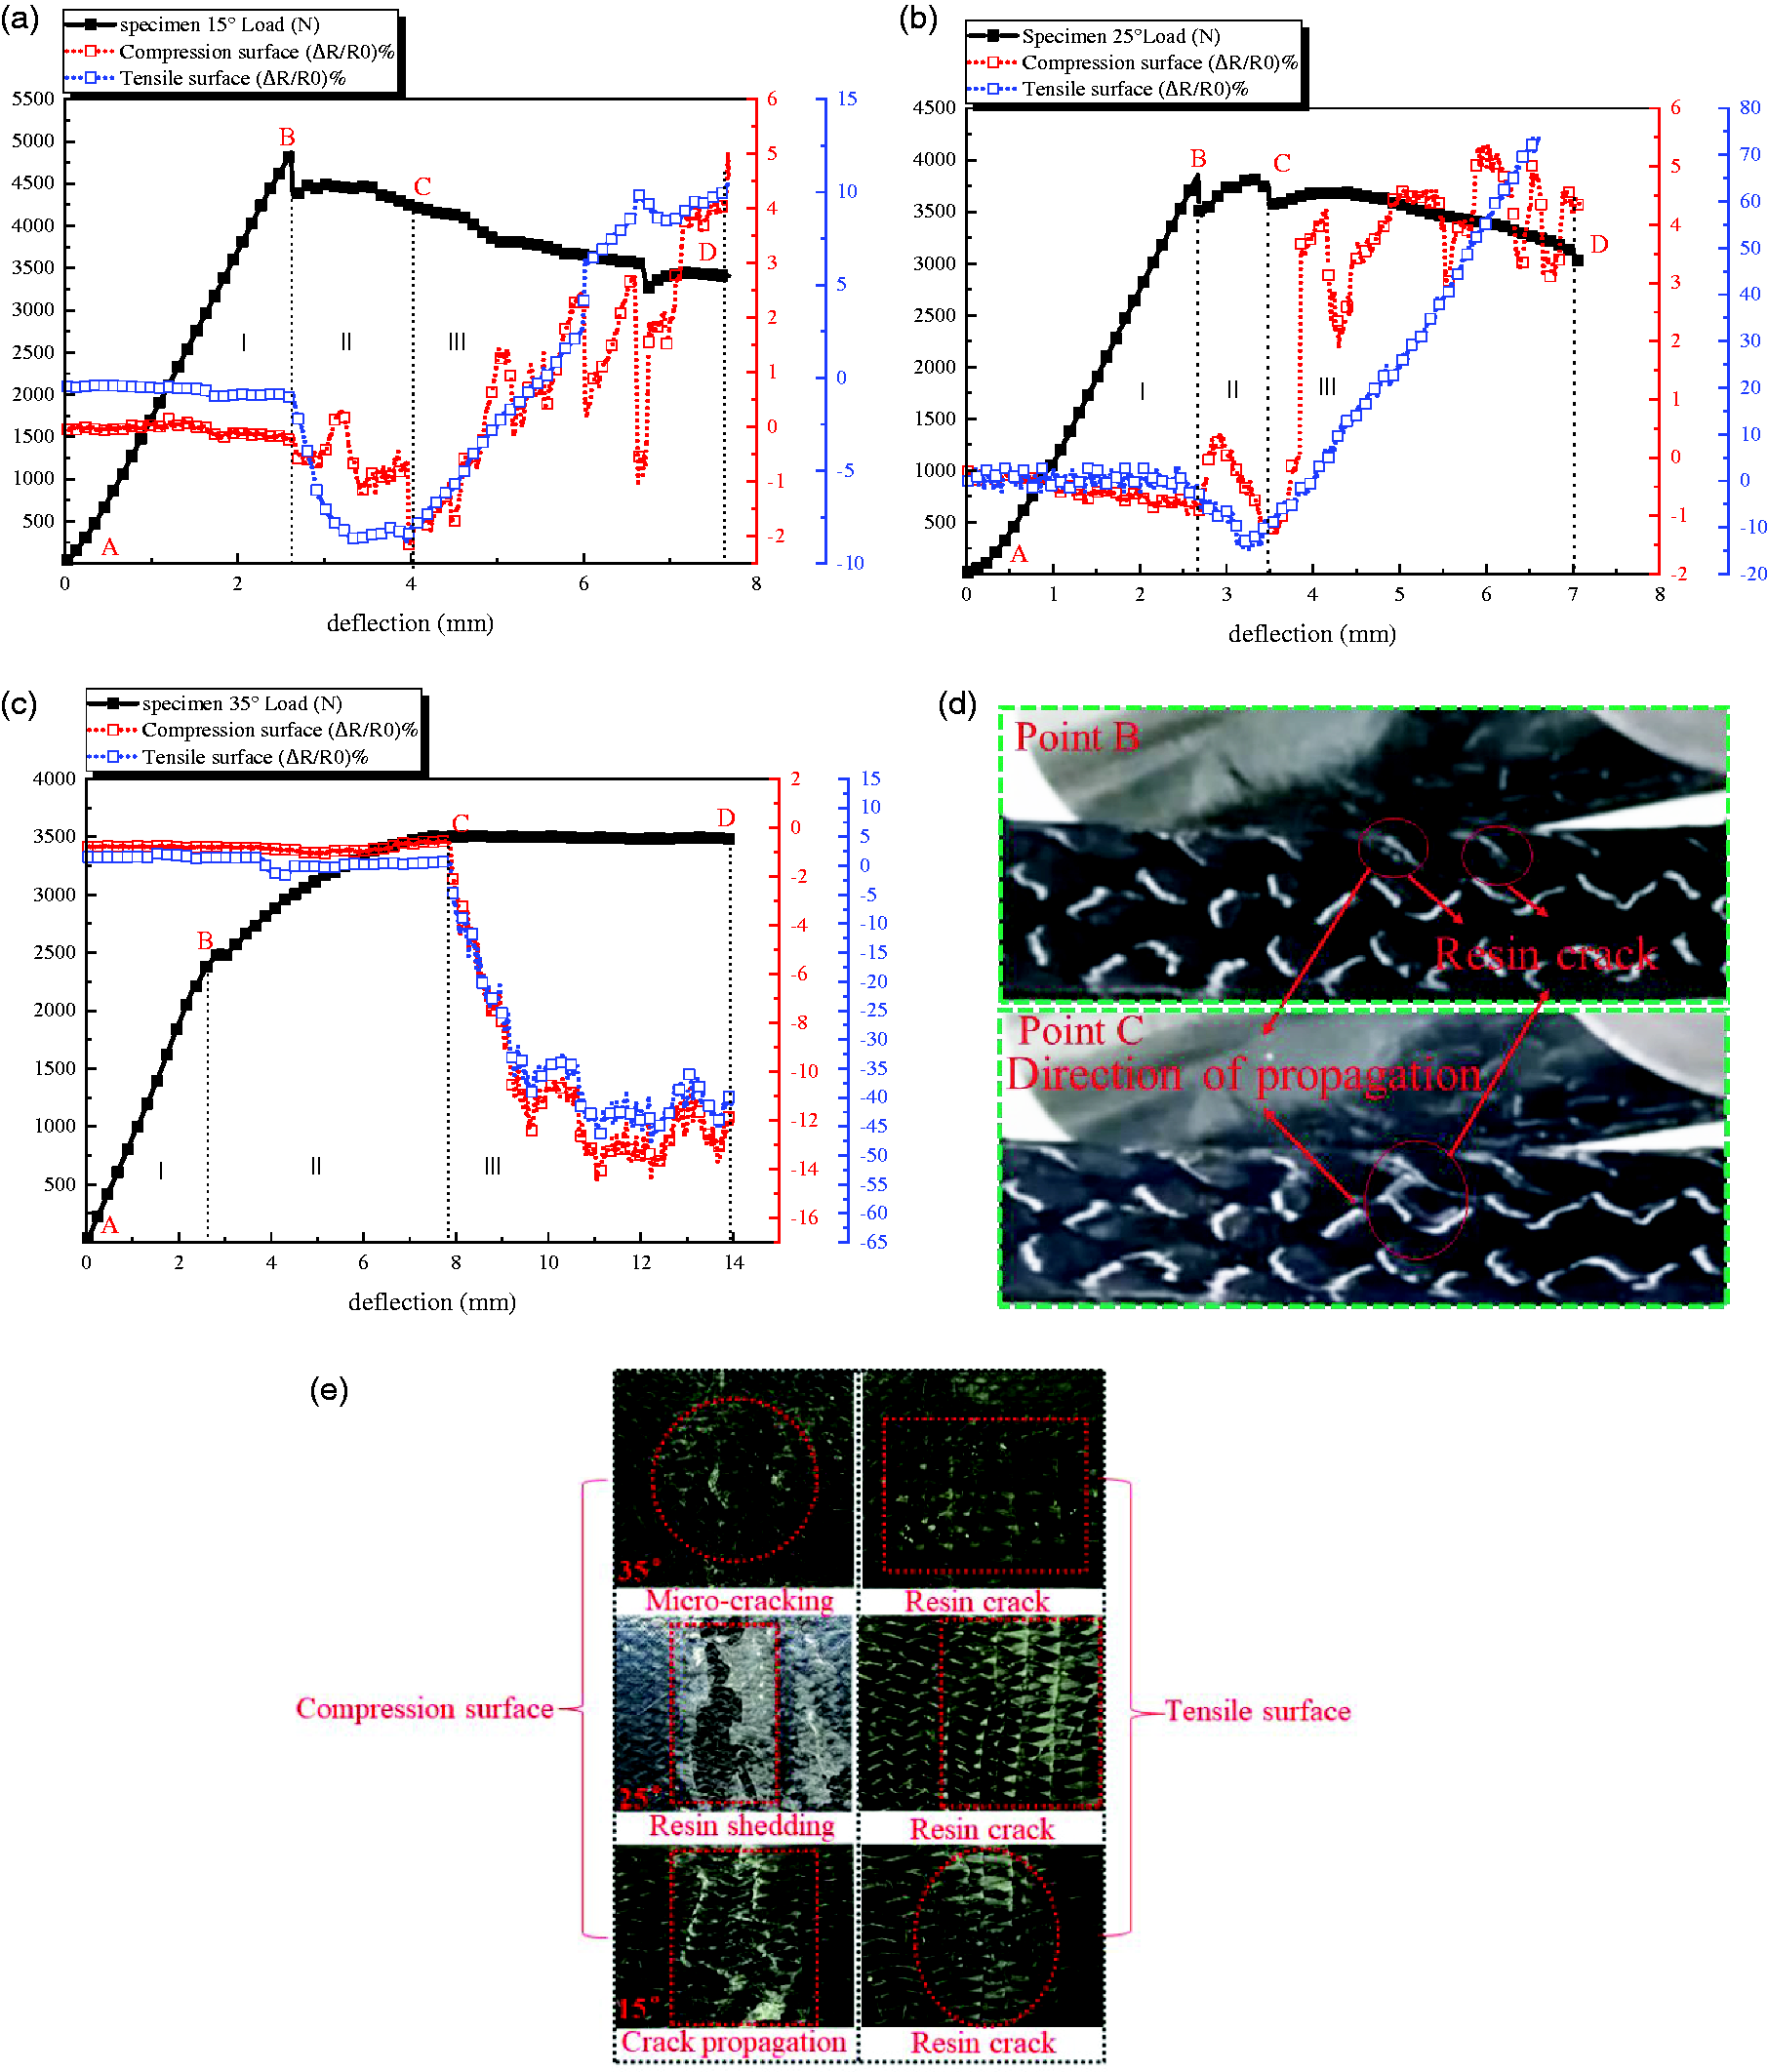
Load-deflection curves in bending and resistance changes during compression and tension: (a) specimen 15°; (b) specimen 25°; (c) specimen 35°; (d) crack propagation of sample 15° and (e) compressive and tensile surface failure morphologies.
Figure 8(a) shows the load-deflection curves and resistance changes of 15° samples. Constant resistance for the 15° samples shows no fiber fracture in first stage. Damage occurred at maximal load and resistance changed due to cracking of resin. During the second stage, cracks propagated along the resin to the thickness direction of fiber-to-fiber resulted in resistance increases under the compressive surface as shown in Figure 8(d). The tensile surface resistance decreased after reaching the maximum load and the resin microcracks appeared, resulting in increases of resistance due to the number of fiber tows contact points. During the third stage, a large number of fibers fractured resulting in increases of resistance. The resistance fluctuation forms of compressive surface and tensile surface were different. From comparison of the final damage morphologies in Figure 8(e), the results showed that damage modes of internal structure of the compression and tensile surface bounded by a neutral plane were different. To further analyze this difference further study is required by means of in situ computed tomography (CT) detection.
Figure 8(b) shows the load-deflection curves and resistance changes of 25° samples. Resin cracking of 25° samples and 15° samples occurred in the first stage, which showed the damage of samples at maximum load. During the second stage, the decrease of cross-sectional area due to the stretching of fiber led to decreases in resistance under the tensile surface. Change of resistance on the compressive surface was caused by the change of number of fiber contact points. During the third stage, the fracture of fiber showed a linear increase of resistance under the tensile surface. The fracture of fibers is accompanied by debonding of the resin-fiber interface under the compression surface, which leads to an increase of resistance fluctuation.
Figure 8(c) shows the resistance changes on compressive and tensile surfaces of 35° samples. In the first stage, the resistance of compression and tensile surface were basically not changed. As deflection increased in the second stage, it could be observed that the resistance was not changed and the braided structure of fiber showed great flexibility, indicating that the damage of resin is the main factor in the braided structure. For the large braiding angle in the third stage, resistance shows same increase and decrease due to the transversely isotropic and braided unit's homogenization of braided composites. In addition, the
Effect of damage on longitudinal resistance
The surface resistance changes under different braiding angle structures were obtained, and the difference between longitudinal resistance changes and surface resistance of 3-D braided composites under bending was explored. The loading procedure of samples is divided into I, II, III stages, respectively, as shown in Figure 9(a), (c), and (d). The point A is the starting position of load and point B is the maximal load in the elastic stage, point C is the position of before sample failure, and point D is the position of sample failure.
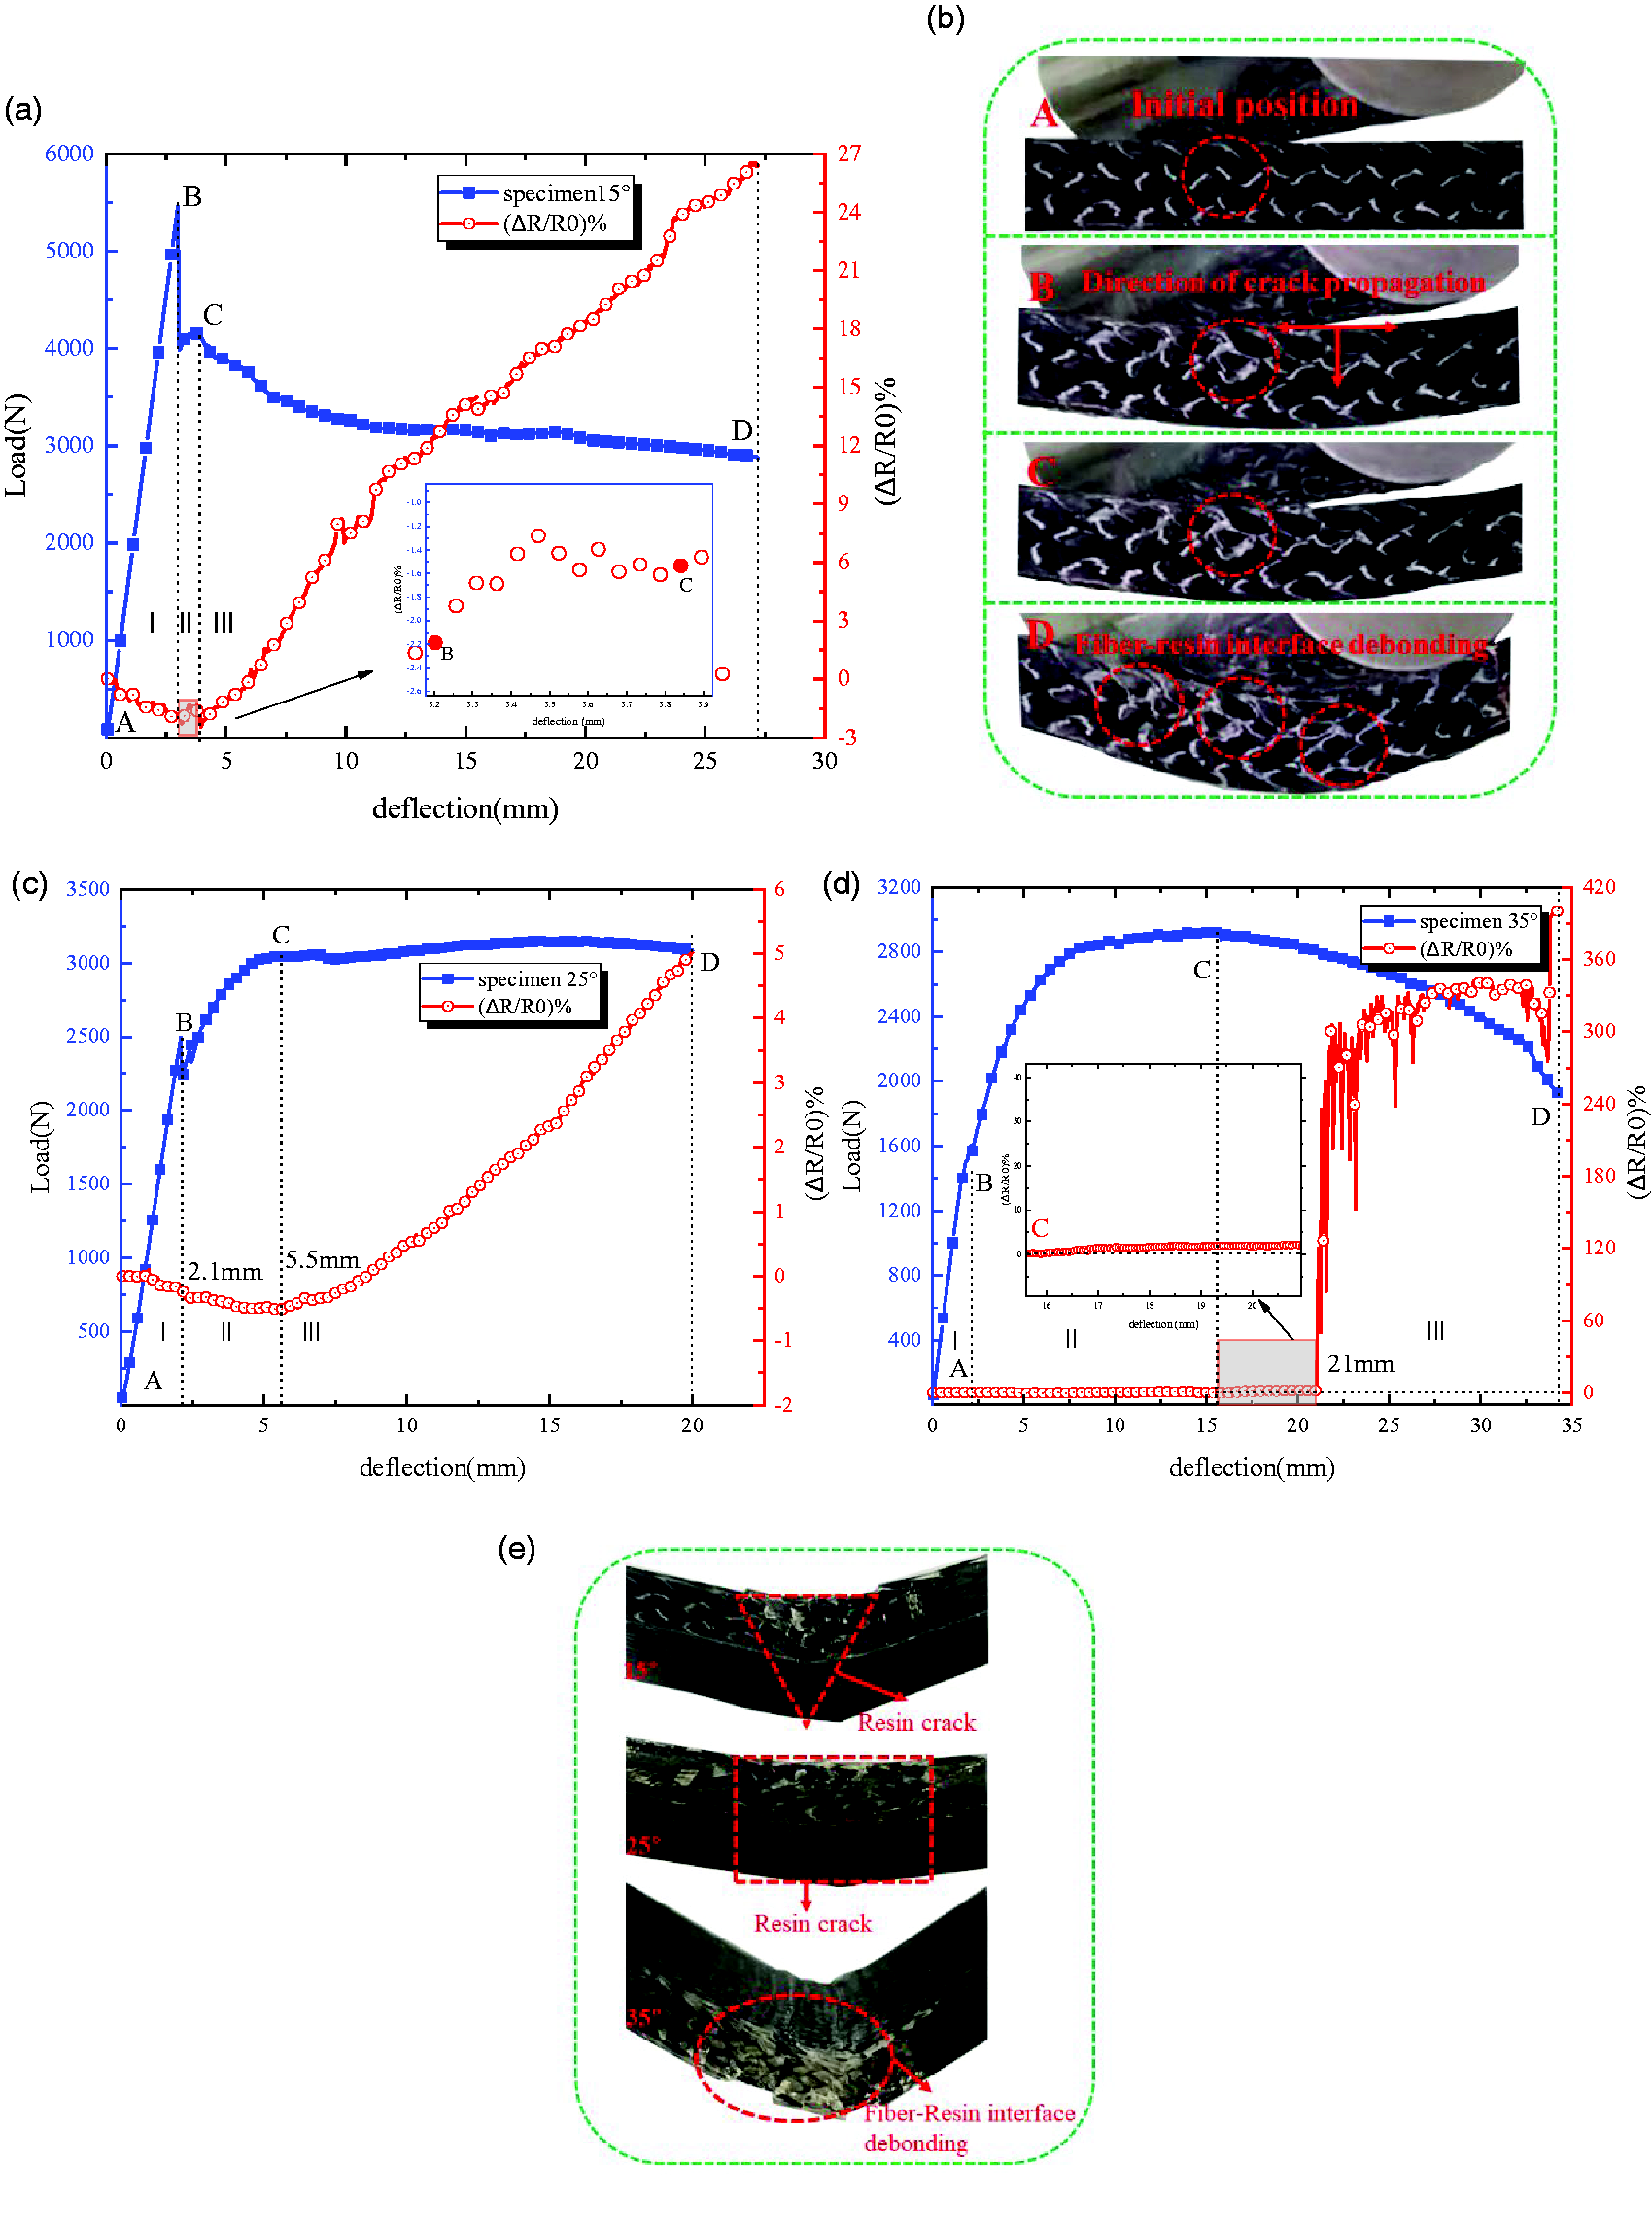
Load-deflection curves and resistance changes during bending: (a) specimen 15°; (b) damage mode process of sample 15°; (c) specimen 25°; (d) specimen 35° and (e) failure morphologies.
Figure 9(a), (c), and (d) show the longitudinal resistance changes under three-point bending loading of 15°, 25°, and 35° samples, respectively. Figure 9(a) shows the longitudinal resistance of 15° samples at different load positions under bending. For decreases of resistance in the first stage, the resin cracks occurred at maximum load and crack direction propagated to the neutral surface. The crack propagated to the internal structure, and a small amount of fiber fractured resulting in an increase of resistance in the second stage. It could be observed that crack propagation did not change from Figure 9(b). Entering the third stage, the debonding of the fiber-resin interface and the fracture of fiber are serious, which leads to a linear increase of resistance.
The damage mode of 25° samples at yield range from deflection 2.1 mm to 5.5 mm is resin cracking in the second stage, which shows a decrease of resistance. During the third stage, the damage of strain-hardening range is fracture of fiber, which leads to an increase of resistance.
The resistance of 35° samples has no change before maximum load. The cracking of resin resulting in no change of resistance in the first stage. The fibers gradually fracture and the resistance increases at 21 mm deflection in the third stage, and resistance fluctuations increase, showing a large amount of fiber fracture and severe resin shedding. By comparing the change of longitudinal resistance at different braiding angles, the
Electrical-mechanical model
By comparing the model calculation with experimental results, the k is 1.02,
Figure 10(a) shows the comparison between the resistance change of 15° samples and the electrical-mechanical model. The models of resin cracking and fiber fracture can capture the experimental results in three stages. The resistance calculated by the RRC model decreases nonlinearly, which is in good agreement with the percentage curve of resistance change in the first stage. When the deflection is 3.9 mm, the fibers begin to fracture and the resistance changes exponentially with the increase of deflection. The RFF model fractures instantaneously in the third stage, which may be related to the load value corresponding to fibers fractured. The 15° samples show brittle fracture and large-scale fiber fracture, so the model of the third stage is consistent.
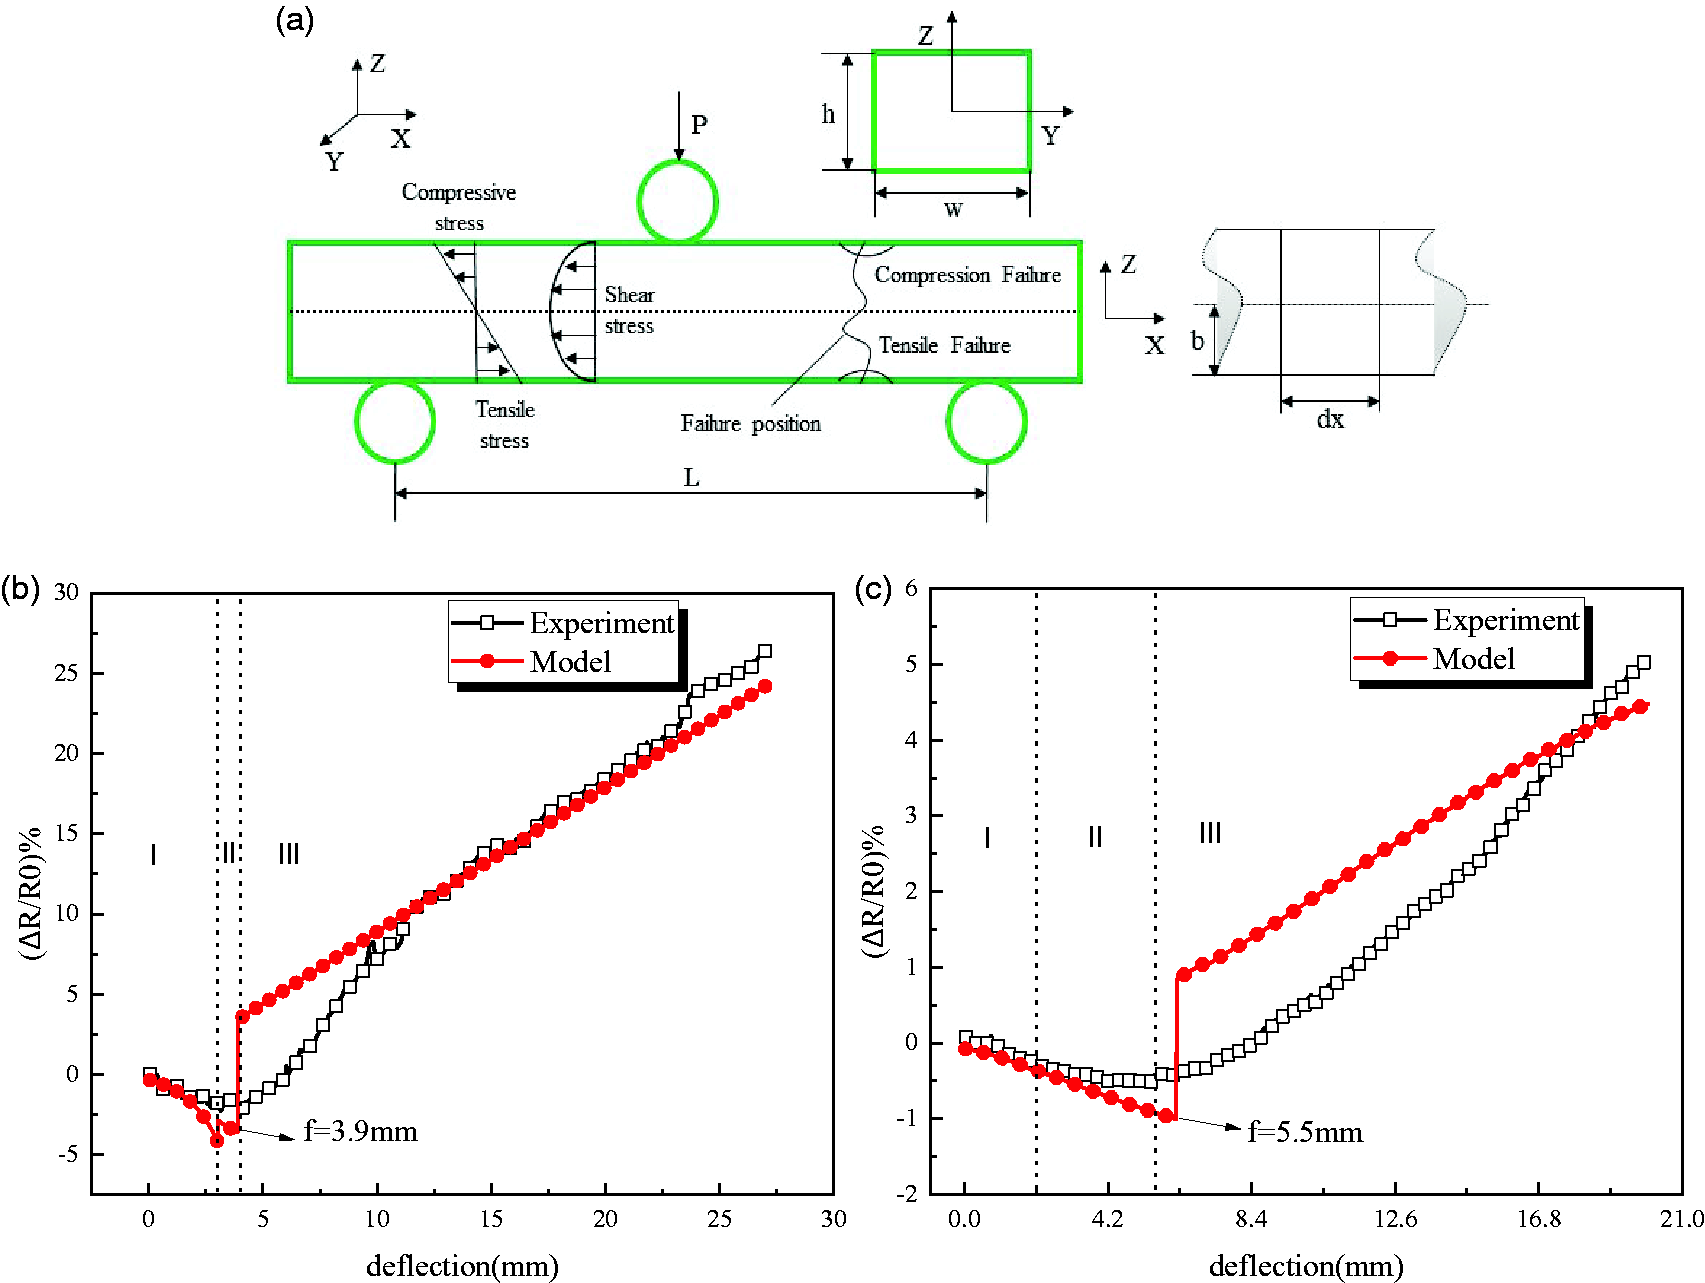
Mechanical analysis of bending load and experimental model results: (a) related parameters of the applied load and sample microsegment; (b) resistance changes of sample 15° and (c) resistance changes of sample 25°.
Figure 10(b) shows the comparison between the resistance change of 25° samples and the electrical-mechanical model. The curve of resistance changes match with the RRC model in the first and second stages. When the deflection is 5.5 mm, which is the highest point of strain-hardening (maximum load), the third stage has been in the plastic collapse region, and the load has not decreased, indicating that the fibers have capacity of load bearing. The accuracy of the RRF model shows deviation in the third stage, which is because the sample is in plastic failure rather than brittle fracture. When the sample has visible plastic deformation, the RRF model does not show linear exponential growth. Therefore, experimental results of the 35° samples are not suitable for this electrical-mechanical model. If the load value corresponding to the fiber fracture can be accurately judged, the accuracy of the electrical-mechanical model in predicting the damage of 3-D braided composites will be improved.
Conclusion
We studied the electrical properties and electrical-mechanical behavior in 3-D braided composites. The longitudinal resistance has been found to increase with increasing braiding angle. The bending strength and modulus decrease with the increase of braiding angle under three-point bending load. The cracking of resin and fracture of fiber leads to changes of resistance in three stages. The models of resin cracking and fracture of fiber verify the effectiveness and rationality of the experimental results under bending load.
Footnotes
Declaration of conflicting interests
The author(s) declared no potential conflicts of interest with respect to the research, authorship, and/or publication of this article.
Funding
The author(s) disclosed receipt of the following financial support for the research, authorship, and/or publication of this article: The authors acknowledge the financial support from the National Science Foundation of China (Grant Number 51875099), Shanghai Sailing Program (Grant Number 19YF1401200), the Fundamental Research Funds for the Central Universities of China (Grant Number 2232021G-02) and the Initial Research Funds for Young Teachers of Donghua University.