




Abstract
The SARS-CoV-2 pandemic has increased the demand for antiviral technologies to mitigate or prevent the risk of viral transmission. Antiviral treated textiles have the potential to save lives, especially in healthcare settings that rely on reusable patient-care textiles and personal protective equipment. Currently, little is known about the role of textiles in cross-contamination and pathogen transmission, despite the wealth of information on hard surfaces and fomites harboring viruses that remain viable in certain circumstances. In addition, there is no international standard method for evaluating residual viral activity on textiles, which would allow a thorough investigation of the efficacy of antiviral textile products. Therefore, this pilot study aims to develop and refine a standardized protocol to quantitatively evaluate residual viral activity on antiviral textiles. Specifically, we focused on general textiles, such as bed linens, commonly used in healthcare settings for patient care. The Tissue Culture Infectious Dose 50 (TCID50) method is frequently used to quantitatively evaluate viral infectivity on textiles, but has not been established as a standard. This procedure involves observing the cytopathic effect of a given virus on cells grown in a 96-well plate after several days of incubation to determine the infectivity titer. We used HCoV-229E and Huh-7 human liver cancer cells for this investigation. We worked to improve the TCID50 method through variations of different steps within the protocol to attain reproducible results. Our proposed optimized hybrid protocol has shown evidence that the protocol is technically simpler and more efficient, and provides successful, consistent results. The analysis showed a significant difference between the treated fabric compared with controls.
Severe Acute Respiratory Syndrome (SARS) coronavirus, Middle East Respiratory Syndrome (MERS) coronavirus and the four endemic human coronaviruses (HcoV NL63, OC-43, 229E and HKU-1) can persist on inanimate surfaces, such as metal, glass and plastic, for up to nine days, but little is known about the persistence of viruses on textile and soft surfaces. 1 The vast diversity and complexity of different types of textile materials and construction methods make understanding of residual viral infectivity more difficult because the findings cannot be applied to other soft or amorphous materials, such as paper goods. The literature indicates that the human coronavirus, specifically SARS-CoV-2, can persist for up to two days on textiles, 2 but research is limited in this area.
In their current form, these textiles can host and spread bioaerosols, allergens, bacteria and viruses, and can promote cross-contamination. In addition, the reusable textile-based personal protective equipment (PPE) and patient-care textiles found in healthcare have never been characterized nor modeled to quantify their contribution to the development and spread of pathogens. The rise of SARS-CoV-2 and other viruses has created a demand for antiviral technologies that can mitigate the risk by simply creating an antimicrobial/antiviral bio-barrier on textiles to prevent microbes and viruses from attaching to them. This pilot study investigates the residual viral infectivity and persistence of contamination on textile surfaces, specifically bed linen materials commonly used in healthcare settings. Initial studies indicate SARS-CoV-1 can survive on disposable polypropylene and cotton textile surfaces for up to two days and 24 hours, respectively. 3 Despite being able to detect the virus after that time period, these studies do not detect the viral load capable of infecting human cells with COVID-19. Due to the variations within each individual, it is not clear what specific amount of virus load will infect a person. However, some studies have shown the virus load range and possibility of being infected by SARS-CoV-2. One recent study found that during the peak infection period, it is estimated that around 109–1011 SARS-CoV-2 visions (RNA copies) exist in the lungs of an infected individual. 4 Another study, which used a transmission model stimulation, concluded that transmission is very unlikely (∼0.00005%) given an exposure to an infected person with an upper airway viral load of less than 104 SARS-CoV-2 RNA copies, and unlikely (∼0.002%) given an exposure to an infected person with a viral load of less than 105 SARS-CoV-2 RNA copies. In addition, it is much more likely (39%) given an exposure to an infected person who is shedding over 107 SARS-CoV-2 RNA copies, and 75% given an exposure to an infected person with a viral load of over 108 SARS-CoV-2 RNA copies. 5 These studies used reverse transcription polymerase chain reaction (RT-PCR)-based methods to evaluate the viral load but did not assess the infectivity of the samples. A recent study concluded that in infected hosts there is approximately a four order of magnitude difference between the viral RNA load and the number of infectious units. 4 Whether this difference holds up for virus contamination on textiles and surfaces is yet to be determined.
All textiles have a propensity to allow cross-contamination, but this can have an especially dangerous outcome in healthcare settings. Healthcare textiles always are in close contact with patients. In particular, reusable textiles have body fluid, skin scale and blood pathogen residues after being used for a period of time. 6 According to one study, around 10% of healthcare gowns were contaminated with microorganisms after patient healthcare activities. 7 Another study, which purposely took off contaminated PPE (gloves and gowns) worn by 10 healthcare workers engaged in stimulated activities, found 1–4 log10 MS2 bacteriophages were transferred to sterilized scrubs, 8 which further shows healthcare PPE could increase the spread of the microorganisms. The self-contamination process is fast and unnoticeable. Perry et al. 9 showed that during a 24-hour nurse shift, there is a 15% increase of MRSA, VRE and/or C. difficile (from 1 to >100 colony forming units). Microorganisms transfer from contaminated textiles to skin, cloths, personal items, object surfaces, etc. Currently, laundering is the method used to reduce the existence of microorganisms on textiles, but there is still a large chance that microorganisms could survive on the textiles due to different laundering methodology parameters, fabric types, microorganism types, etc.,10–12 which may cause pathogenic microorganisms to recover and cross-contaminate. Therefore, it is critical that textiles have some antibacterial or antiviral properties that could potentially inhibit the spread of bacteria or viruses. To some extent, they can thus help avoid cross-contamination and protect people’s health. The protocols and methods for analyzing the antibacterial activity of textiles are rather mature, since people have been looking for the solution to fight bacterial infections for a long time. Meanwhile, the application of biomedical textiles is rapidly developing, such as surgical gowns, hygienic masks, adhesive bandages, hospital sheets and curtains. Besides that, implantable biomedical textile products, such as stent grafts, hernia meshes, sutures and cardiovascular grafts, are also playing an important role in people’s lives and require the antibacterial property to function well inside the body. People are paying much attention to how to avoid bacterial infection, while antiviral activity is likely to be ignored.
There are limited studies in the published standards that investigate the transfer of the viral activity of textiles. One of them is the ISO 18184 protocol, which determines the antiviral activity of textile products against specified viruses. The protocol is specified for the Influenza A virus (H3N2), A/Hong Kong/9/68, TC adapted ATCC VR-1679 Influenza A virus (H1N1), A/PR/8/34, TC adapted ATCC VR-1469 and Feline calicivirus, strain F-9 ATCC VR-782. In this method, viruses are deposited onto a textile specimen and the residual viral infectivity is counted after a 2 hour incubation period. The infected plates are made with a series of dilutions prior to determining the infectious titer. The first dilution begins with a maintenance medium in new test tubes, which are kept at a constant temperature. Wash-out virus suspensions from both the selected control specimens and treated specimens are then added to the test tubes with the maintenance medium. The combination of medium and suspension from the first set of test tubes is then added to the new set. This process is repeated serially to prepare the series of dilutions for the virus suspension. Then, the antiviral product test specimen reduction rate is compared to the control specimen by the common logarithm. The infectivity titer, the number of infectious viral particles per unit volume, is found by interpreting a plaque assay and/or using the Tissue Culture Infectious Dose 50 (TCID50) method. The plaque assay utilizes only two wells from the series of dilutions for the virus suspension. Comparably, the TCID50 method has a requirement in which multiple wells per dilution are infected with serial dilution of a virus, the dilution at which 50% of the viruses are infected is the TCID50. The common disadvantages of these protocols are that they require a large amount of sample materials, different neutralizing media types and complicated procedures, which makes the protocols impractical. The ISO 18184 standard tends to be technically challenging and lead to inconsistent results based on the person conducting the analysis. Therefore, it is essential to develop a practical protocol for analyzing the antiviral activity of textiles for different applications that will meet the increasing needs of hygiene, especially during the COVID-19 pandemic.
The present study aims to develop a standardized method to help eliminate operator-related differences. By creating a protocol for evaluating residual viral infectivity on textiles, different volumes of the virus and periods of incubation time were tested to see which condition works the most effectively. This protocol is a modification of ISO 18184, which we refer to as the “gold standard” protocol. The modification in the protocol was required because of the complex procedures in ISO 18184, for example, the Eppendorf tubes in ISO 18184 were replaced by 96-well plates in the gold standard protocol. In addition, the virus type is also altered, which results in a shorter incubation time with an accurate result. The sample size is also altered, which requires fewer resources, such as medium volume and virus inoculation volume, for the length of the procedure. Another important difference is that fewer kinds of mediums, such as the Soybean Casein Digest Lecithin Polysorbate (SCDLP) medium, are used in the “gold standard” protocol and the result reading day is more flexible, ranging from day 5 to day 7. This “gold standard” protocol has been operated by different operators to eliminate errors and the results are shown to be consistent.
Materials and methods
Textile sample preparation
The technical aspects of the various standard methods were optimized and a hybrid protocol was proposed. The 100% cotton woven fabric sheet samples were purchased from a retail store; these fabrics would typically be exposed to potential viral contamination in environments such as in hospitals and consumers’ residences (Figure 1). These samples were treated with Goldshield® 5, which is an Environmental Protection Agency (US) registered (#85556-1) and water-stable product. This technology was developed by Goldshield Technology, created to kill microorganisms after contact. The fabric was treated with Goldshield® 5 detergent and dried in an oven. After the treatment, all samples were washed with tap water for 10 minutes at 60°C without detergent. Then, these samples were rinsed twice for 5 minutes and the wash cycle was repeated 10 times. After the washing procedure, samples were ready to be used. For the convenience of fitting samples into the 96-well plate, they were cut into circles 9 mm in diameter by using a Graphixscan 800 CadCam Technology® laser cut machine (Figure 1). All of the samples were autoclaved for 15 minutes at 134°C in separate sterilization pouches for each type, arranged so no samples would overlap. After sterilization, the samples were transferred to a biological safety cabinet and were ready for use.

Scanning electron microscopy images of 100% cotton woven fabric (a) and laser cut samples (b).
Cell and virus
All the experiments performed were conducted in a biological safety cabinet (Class II cabinet) with proper precautions appropriate for a Biosafety Level 2 laboratory. The HCoV 229E virus strain (a gift from Ralph Baric, UNC) and Huh-7 human liver carcinoma cells were used for this study. Huh-7 cells were maintained in Dulbecco’s Modified Eagle Medium (DMEM; Fisher, MA, USA) with high glucose supplemented with 10% fetal bovine serum (FBS; Fisher, MA, USA) and 1% PenStrep (Penicillin-Streptomycin, Gibco, Dublin, Ireland). The HCoV 229E virus was prepared in 2 ml microtubes and stored in a –80°C freezer.
HCoV 229E virus stock preparation
Huh-7 cells were cultured in a T75 flask until they became confluent and then the media were removed and replaced with 100 µl of virus suspension and 5 ml of 1 + 1 + 1 medium, which consists of Minimum Essential Medium (MEM) supplemented with 1% FBS, 1% Hepes buffer and 1% PenStrep. After 2 hours of incubation at 36°C, 10 ml of 10% FBS medium was added to the flask and incubated again for 72 hours. After 72 hours, the entire volume of the flask was transferred to a conical tube and centrifuged at 13,000 rpm for 10 minutes to form a Huh-7 cell pellet separate from the virus supernatant. The supernatant was transferred to cryovials with 50 µl in each and the new aliquots were stored in a −80°C freezer.
Infectivity titer of virus stock
Eight 2 ml screw top vials were filled with 1.8 ml of 1 + 1 + 1 medium each and a 1:10 serial dilution was performed by transferring 200 µl of a virus aliquot into the first vial and mixing by pipetting carefully up and down. 200 µl from the first vial were transferred into the second vial and mixed with the pipette. This was repeated with each subsequent vial until all eight dilutions were prepared. A 96-well plate was seeded with 20,000 cells per well and 100 µl from the first dilution vial was transferred to each well in the first row of the plate. Then, 100 µl from the second vial was added to each well in the second row and this was repeated for the subsequent tubes and rows. The plates were incubated for seven days and TCID50 was calculated.
TCID50 titration assay
Huh-7 cells were cultured in a T75 flask until they reached 80% confluency. One 96-well plate was seeded with 20,000 Huh-7 cells per well for each textile sample and one plate for the virus only control sample. Each well requires 100 µl for the media and cells mixture and 10,000 cells per well need to be seeded 24 hours before virus infection. The total volume of the cells and media was calculated and incubated in a CO2 incubator for 24 hours. Wells with evidence of cytopathic effects (CPEs) are counted as positive, while those with evidence of healthy or confluent cells are counted as negative (Figure 2). For example, if four out of four replicates have CPEs, the number noted will be 4, whereas 0 refers to 0 with CPEs. So, there is a total of three numbers (between 0 and 4) for each triplicate.
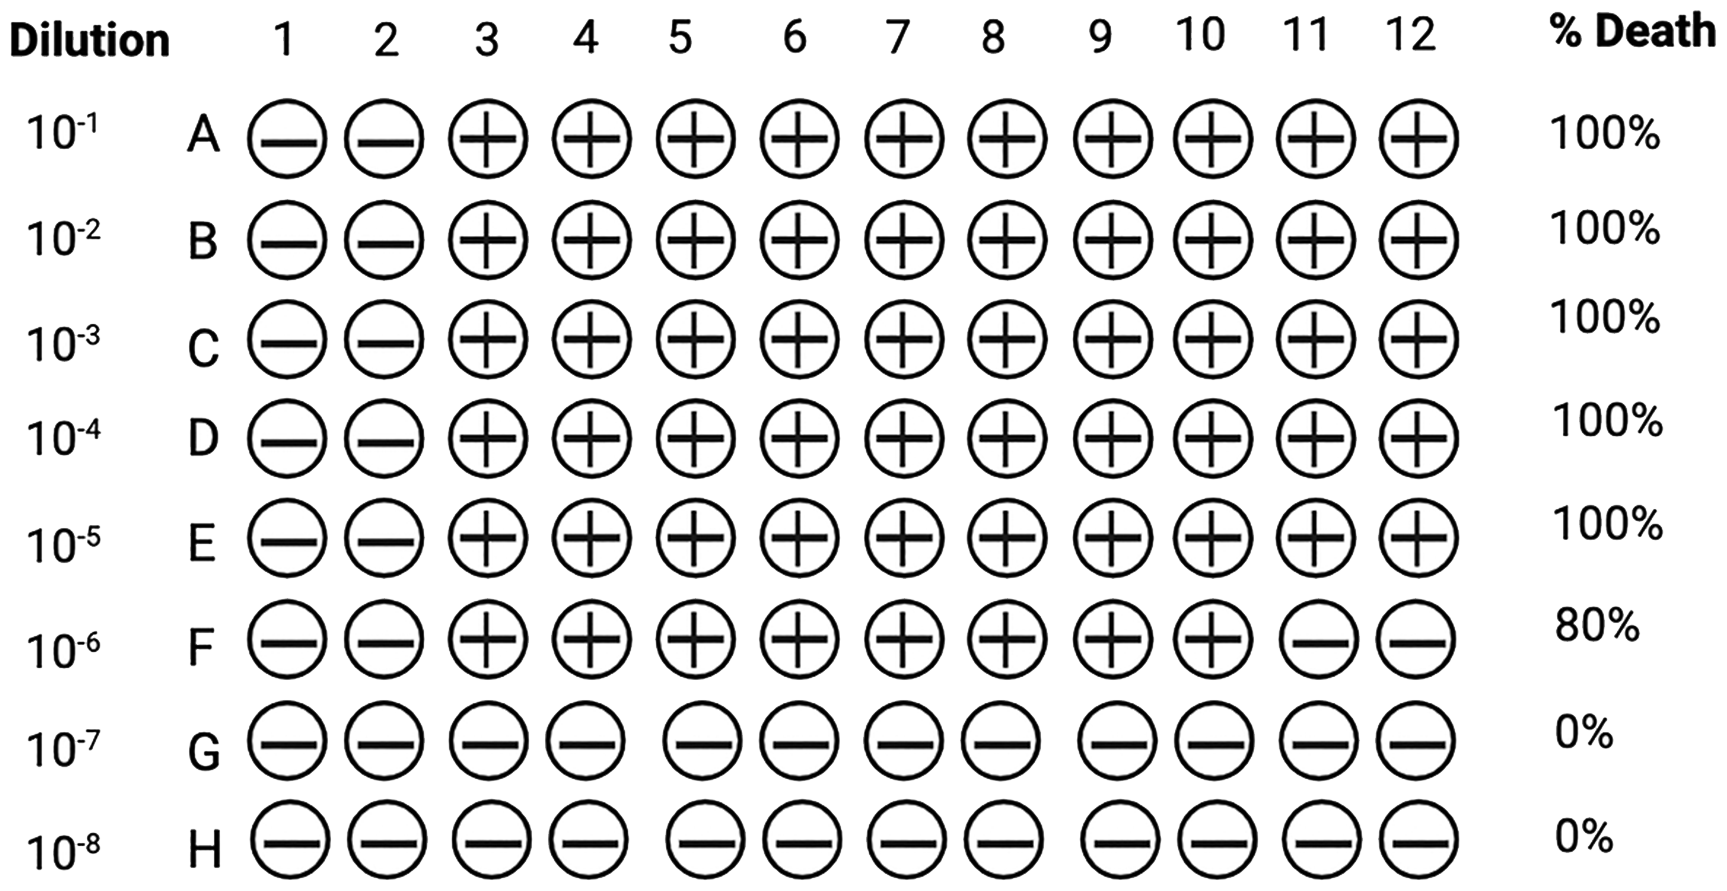
Tissue Culture Infectious Dose 50 assay.
Serial dilutions are used to calculate the TCID50, which is used to identify the dose of viral titer at which 50% of the infected cells display a CPE. We identify CPEs as present (+) or absent (–) for each well of the plate.
Virus exposure to textiles
To test the virus infection on the textile samples, different volumes of virus were added into the textile sample and incubated during the same period. In a brand new 96-well plate, each experimental group had n = 3, namely an antiviral treated textile sample, an untreated textile sample and a virus only control sample. Each textile sample was placed into wells with tweezers, maintaining a separate row (Figure 3). Different volumes of virus aliquot were directly added onto the samples and were out on the shaker soaking within the time range of 1–2 hours. MEM 1 + 1 + 1 medium was mixed by pipetting up and down five times to elute the virus.
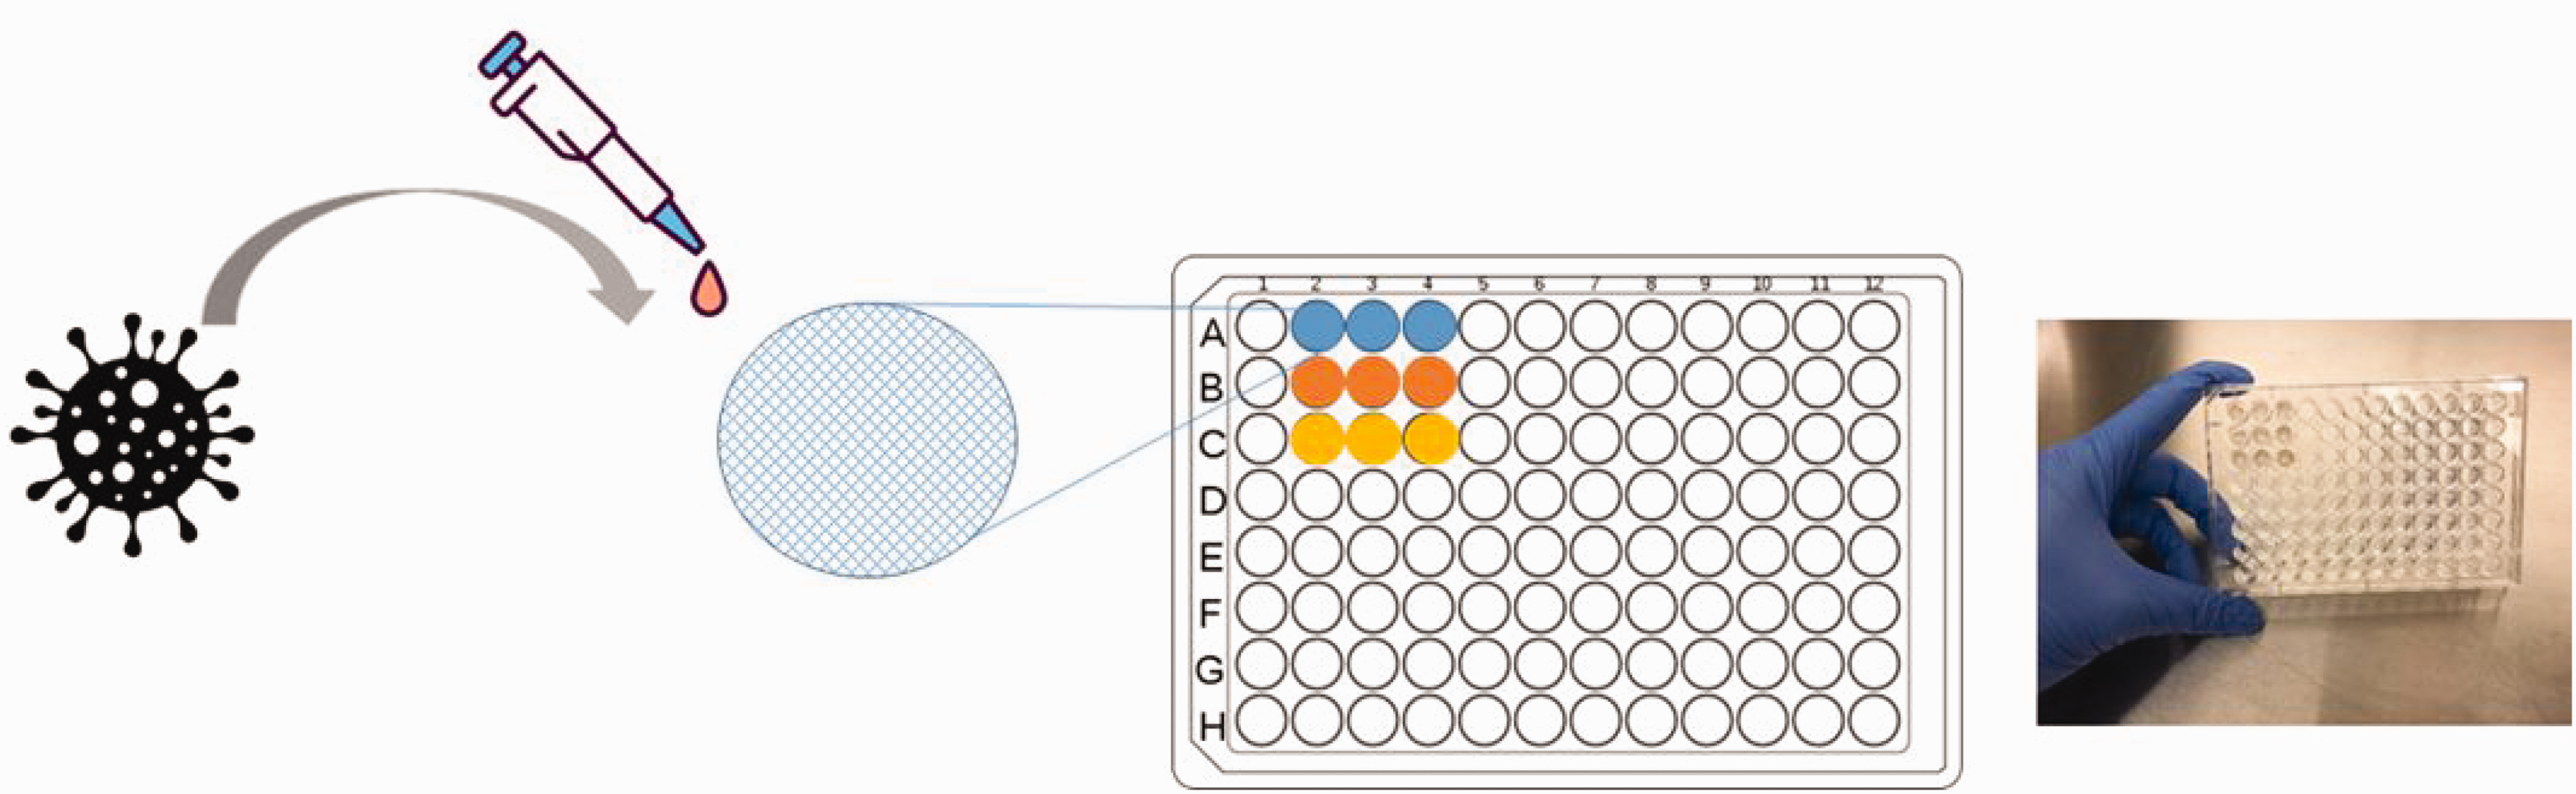
Virus added to textiles.
Each triplicate of the textile sample is represented by a different color and the virus is added to each sample for a dynamic incubation time on a rocker shaker at room temperature.
After a predetermined incubation time, the fluid from each well was diluted with MEM 1 + 1 + 1 medium. After that, 27.7–100 µl was transferred from each sample and the serial dilution was performed. To do this, a multichannel pipette was used to transfer 27.7 µl fluids from the wells for each specimen in the exposure plate to each of the three wells (S1, S2, S3) in the respective row in the dilution plate (Figure 4). After the transfer, the solution was mixed. The transfer was continued for each subsequent row to create serial dilutions. This step was repeated with a new plate for each textile sample (Figure 5). Each plate represents one sample type, with four columns of each triplicate, three triplicates in a row. After the serial dilution, all the plates were incubated for seven days.
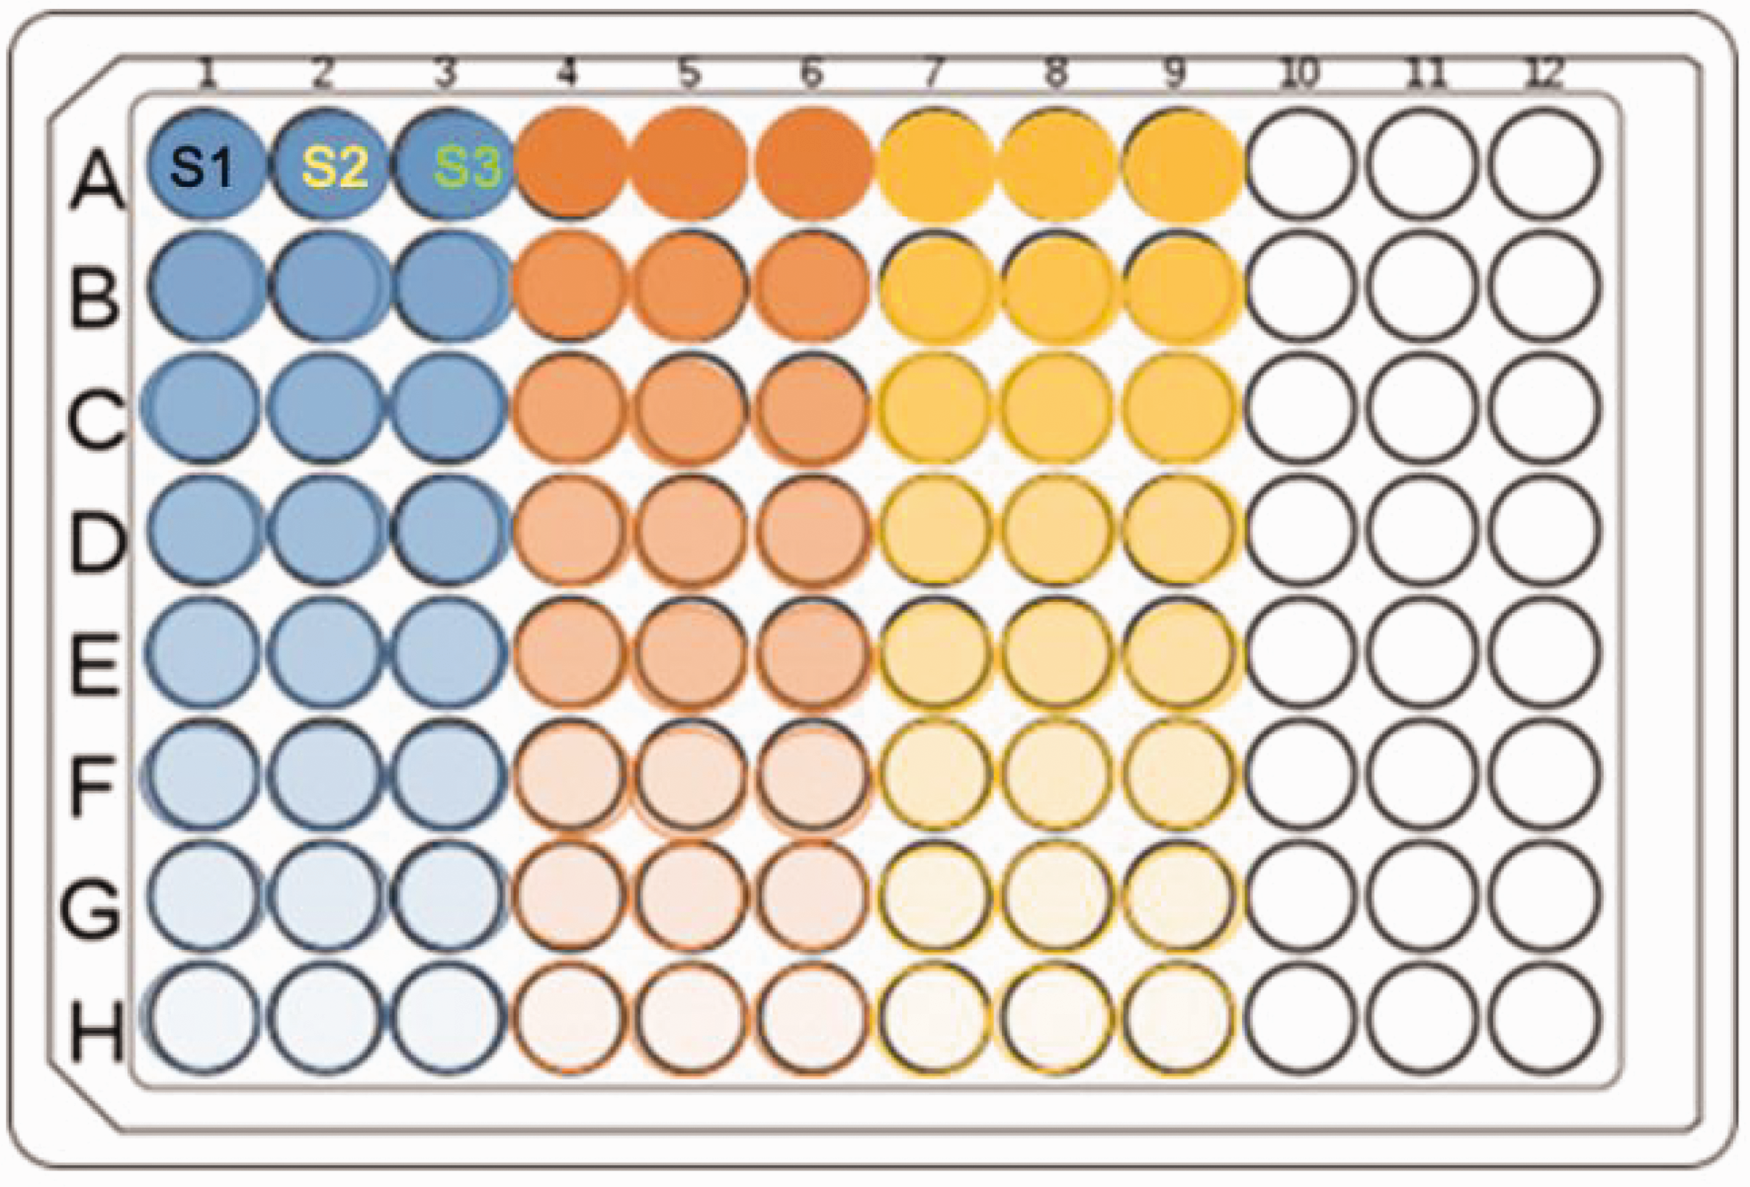
Viral dilution preparation: a 96-well plate with three columns/replicates for each textile sample with a 1:10 serial dilution between each column from A to H.
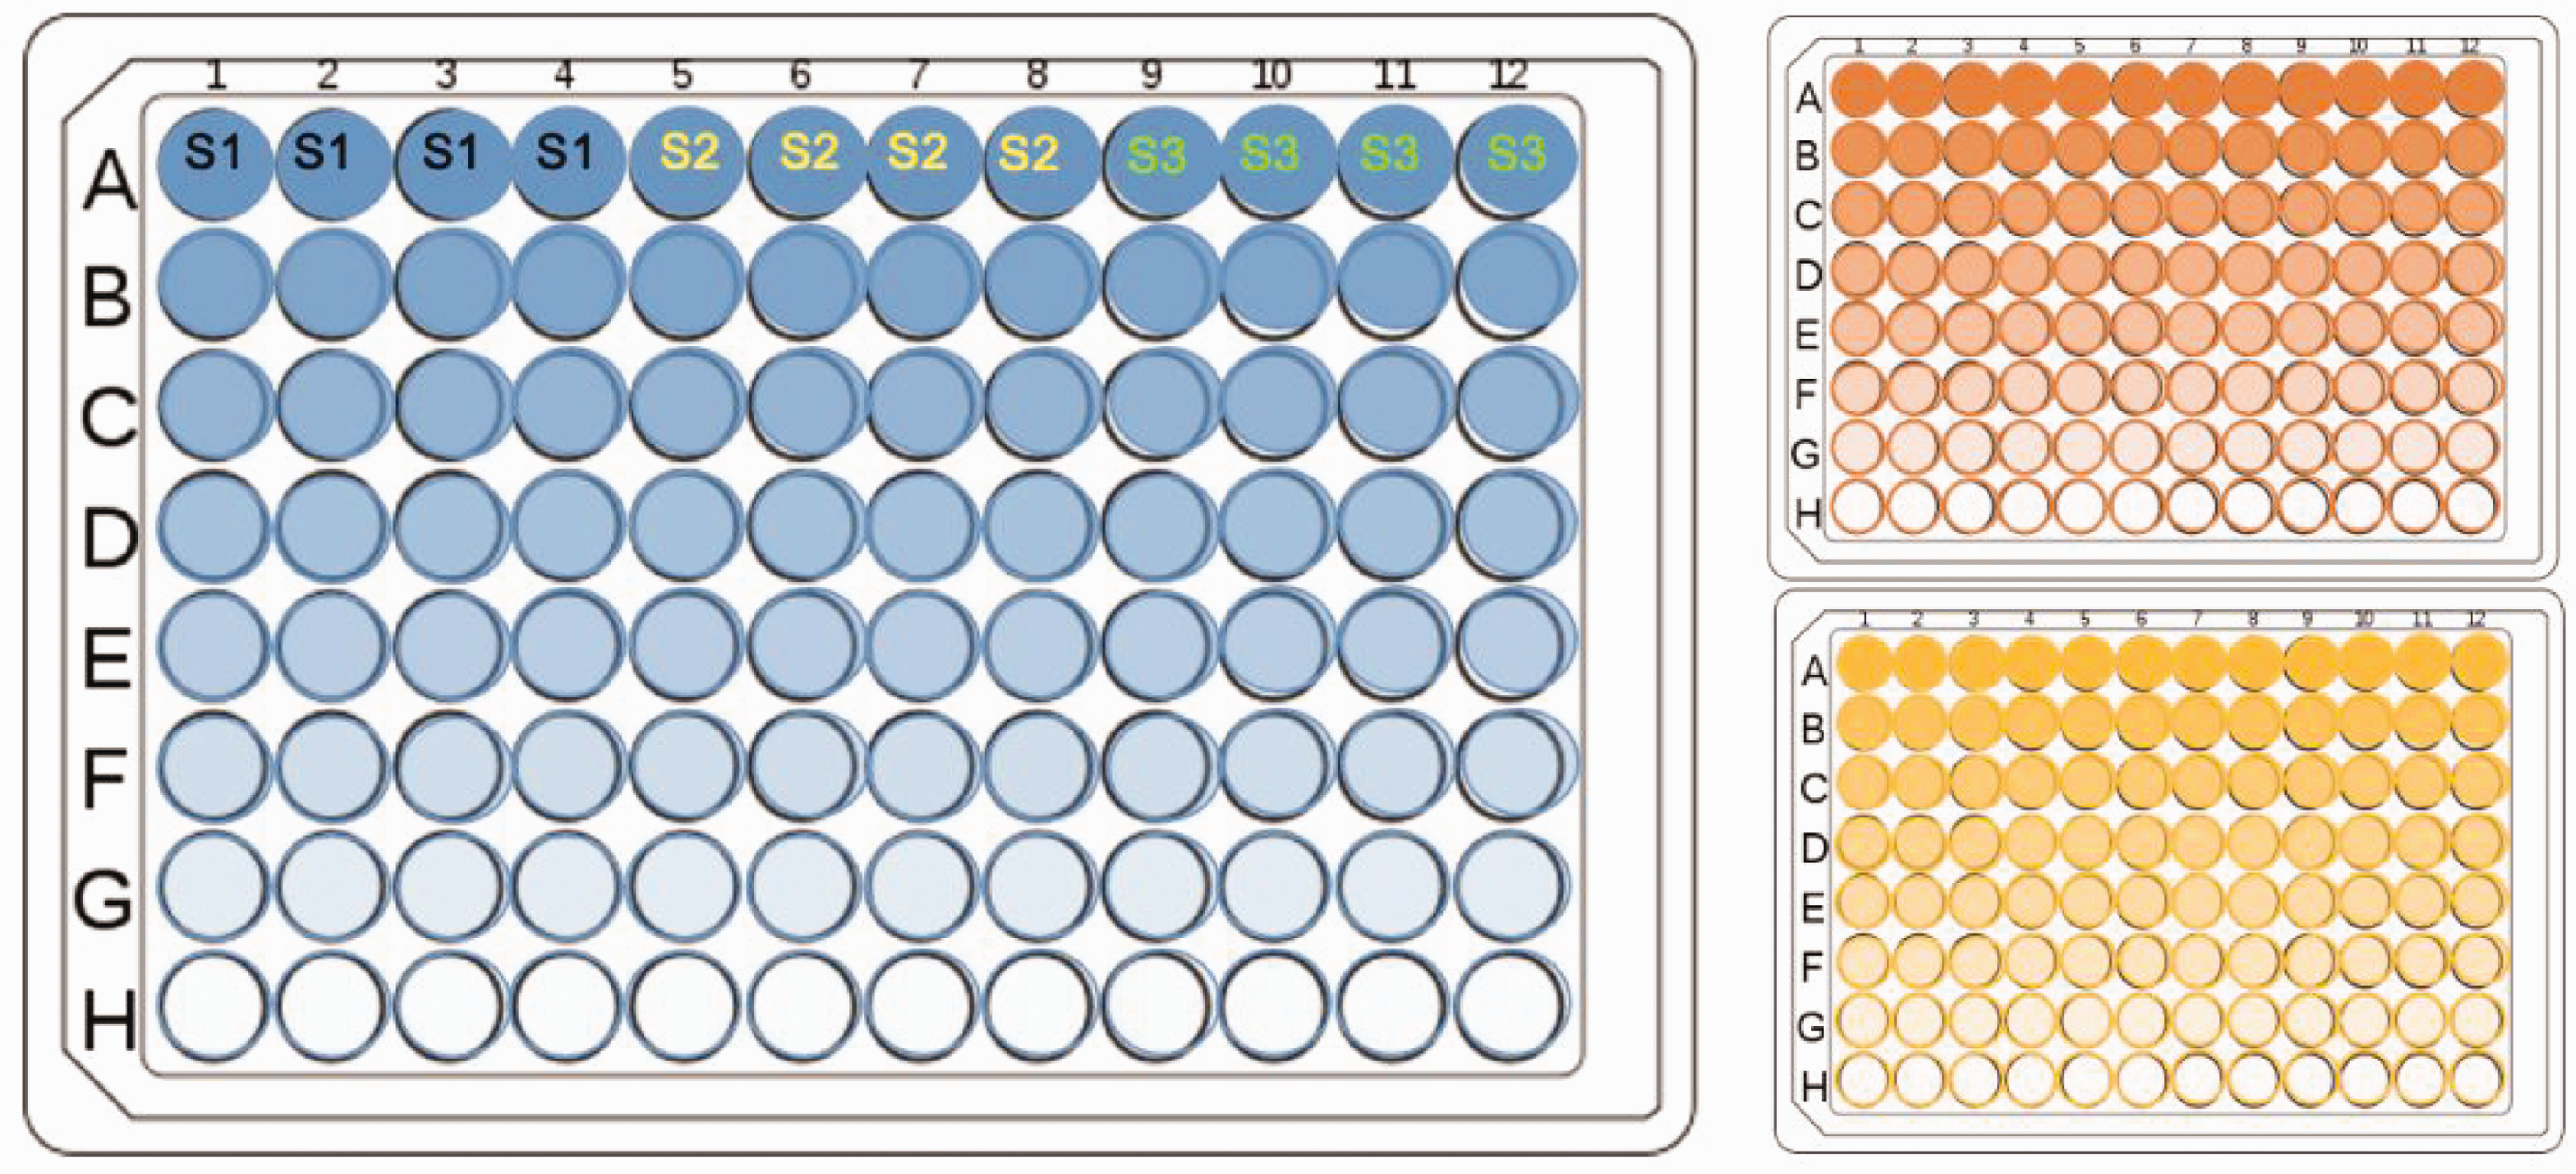
Serial dilutions: 96-well infection plates with one plate per sample.
Samples were incubated for 1 and 2 hours, and the diluted MEM 1 + 1+1 medium was changed to 27, 50 and 100 µl. Accordingly, within the set diluted medium added, we also changed the initial dilution volume to 50, 80 and 100 µl to discover the influence of different dilution volumes on the behavior of the virus infected cells (see supplement).
Viral activity measurement
After the seven day incubation period for virus infected cell plates, each well was observed under an inverted brightfield optical microscope, an EVOS FL2 Auto Imaging System; a brightfield with the light/brightness range of 0.0020–0.0025 was used in this experiment. Each well was examined for evidence of CPEs and recorded in triplicate.
Statistical analysis
Results were expressed as mean ± standard error of the mean. Triplicates were conducted for all the experiments and all the results were read on day 7. Statistical analysis was performed using Microsoft Excel. All of the log values were calculated as 10 based (log10). Statistical significance of the differences was determined by Student’s t-test, and significant results were considered when p < 0.05.
Results and discussion
Microscopic cytopathic effects
Results are determined by observing the microscopic CPEs caused by the virus in the monolayer of the cells (Figure 6). In some cases, the results were vague because healthy but overly confluent cells are difficult to differentiate from CPE activity. However, after five days of incubation, the wells with healthy cells and virus infected cells were noticeably different colors (Figure 7). Healthy cells have a normal cell metabolism function, which causes the media to change from pink to yellow as the nutrients are used. Wells showing CPEs remain pink because no cells are alive to metabolize the media. This color change has proven to be nearly 100% accurate in predicting the presence of CPEs before viewing the plates under a microscope.

Examples of classifying cytopathic effects (CPEs).
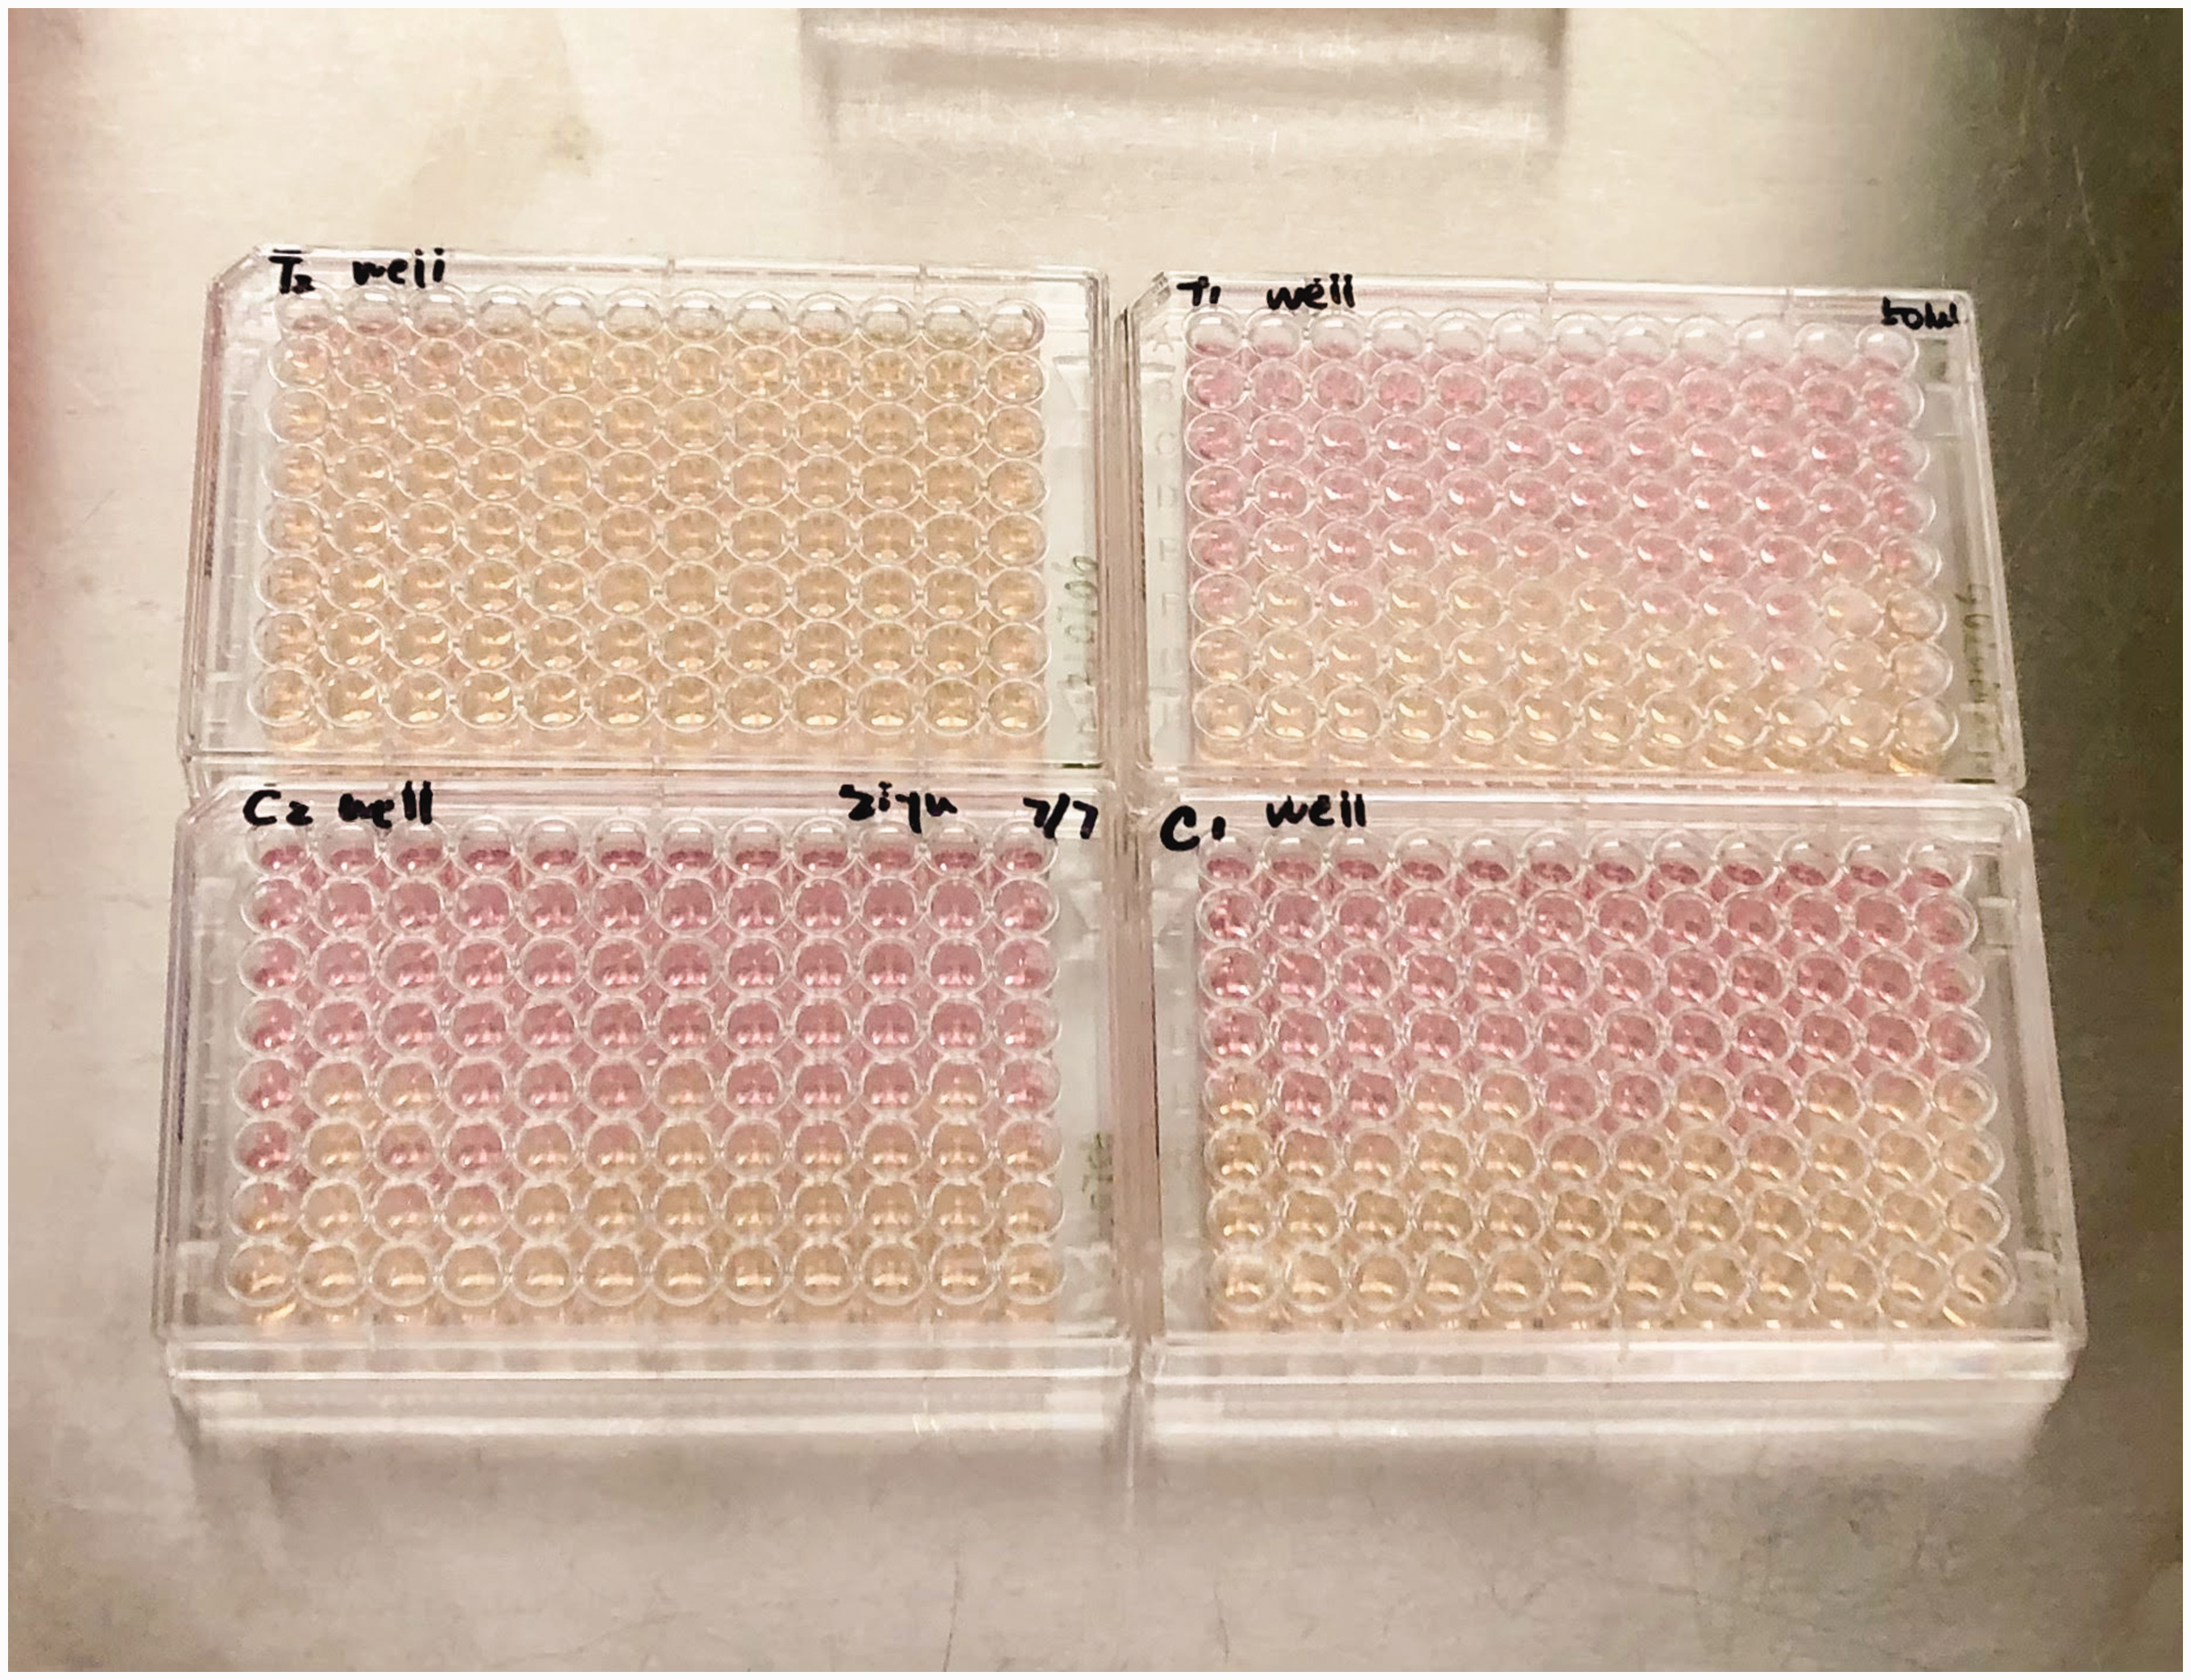
Example of visual evidence of cytopathic effects.
The top row (Figure 6(a)–(c)) are healthy and do not exhibit CPEs, and thus identified as (–) for TCID50 calculations. The bottom row (Figures 6(d)–(f)) exhibit CPEs and are identified as (+) for TCID50 calculations.
Virus amount and incubation time evaluation
To test the influence of virus volume and incubation time related to the antiviral effect, total viral volumes of 200 and 50 µl were added to the textile sample and incubated for both 1 and 2 hours (Figure 8).
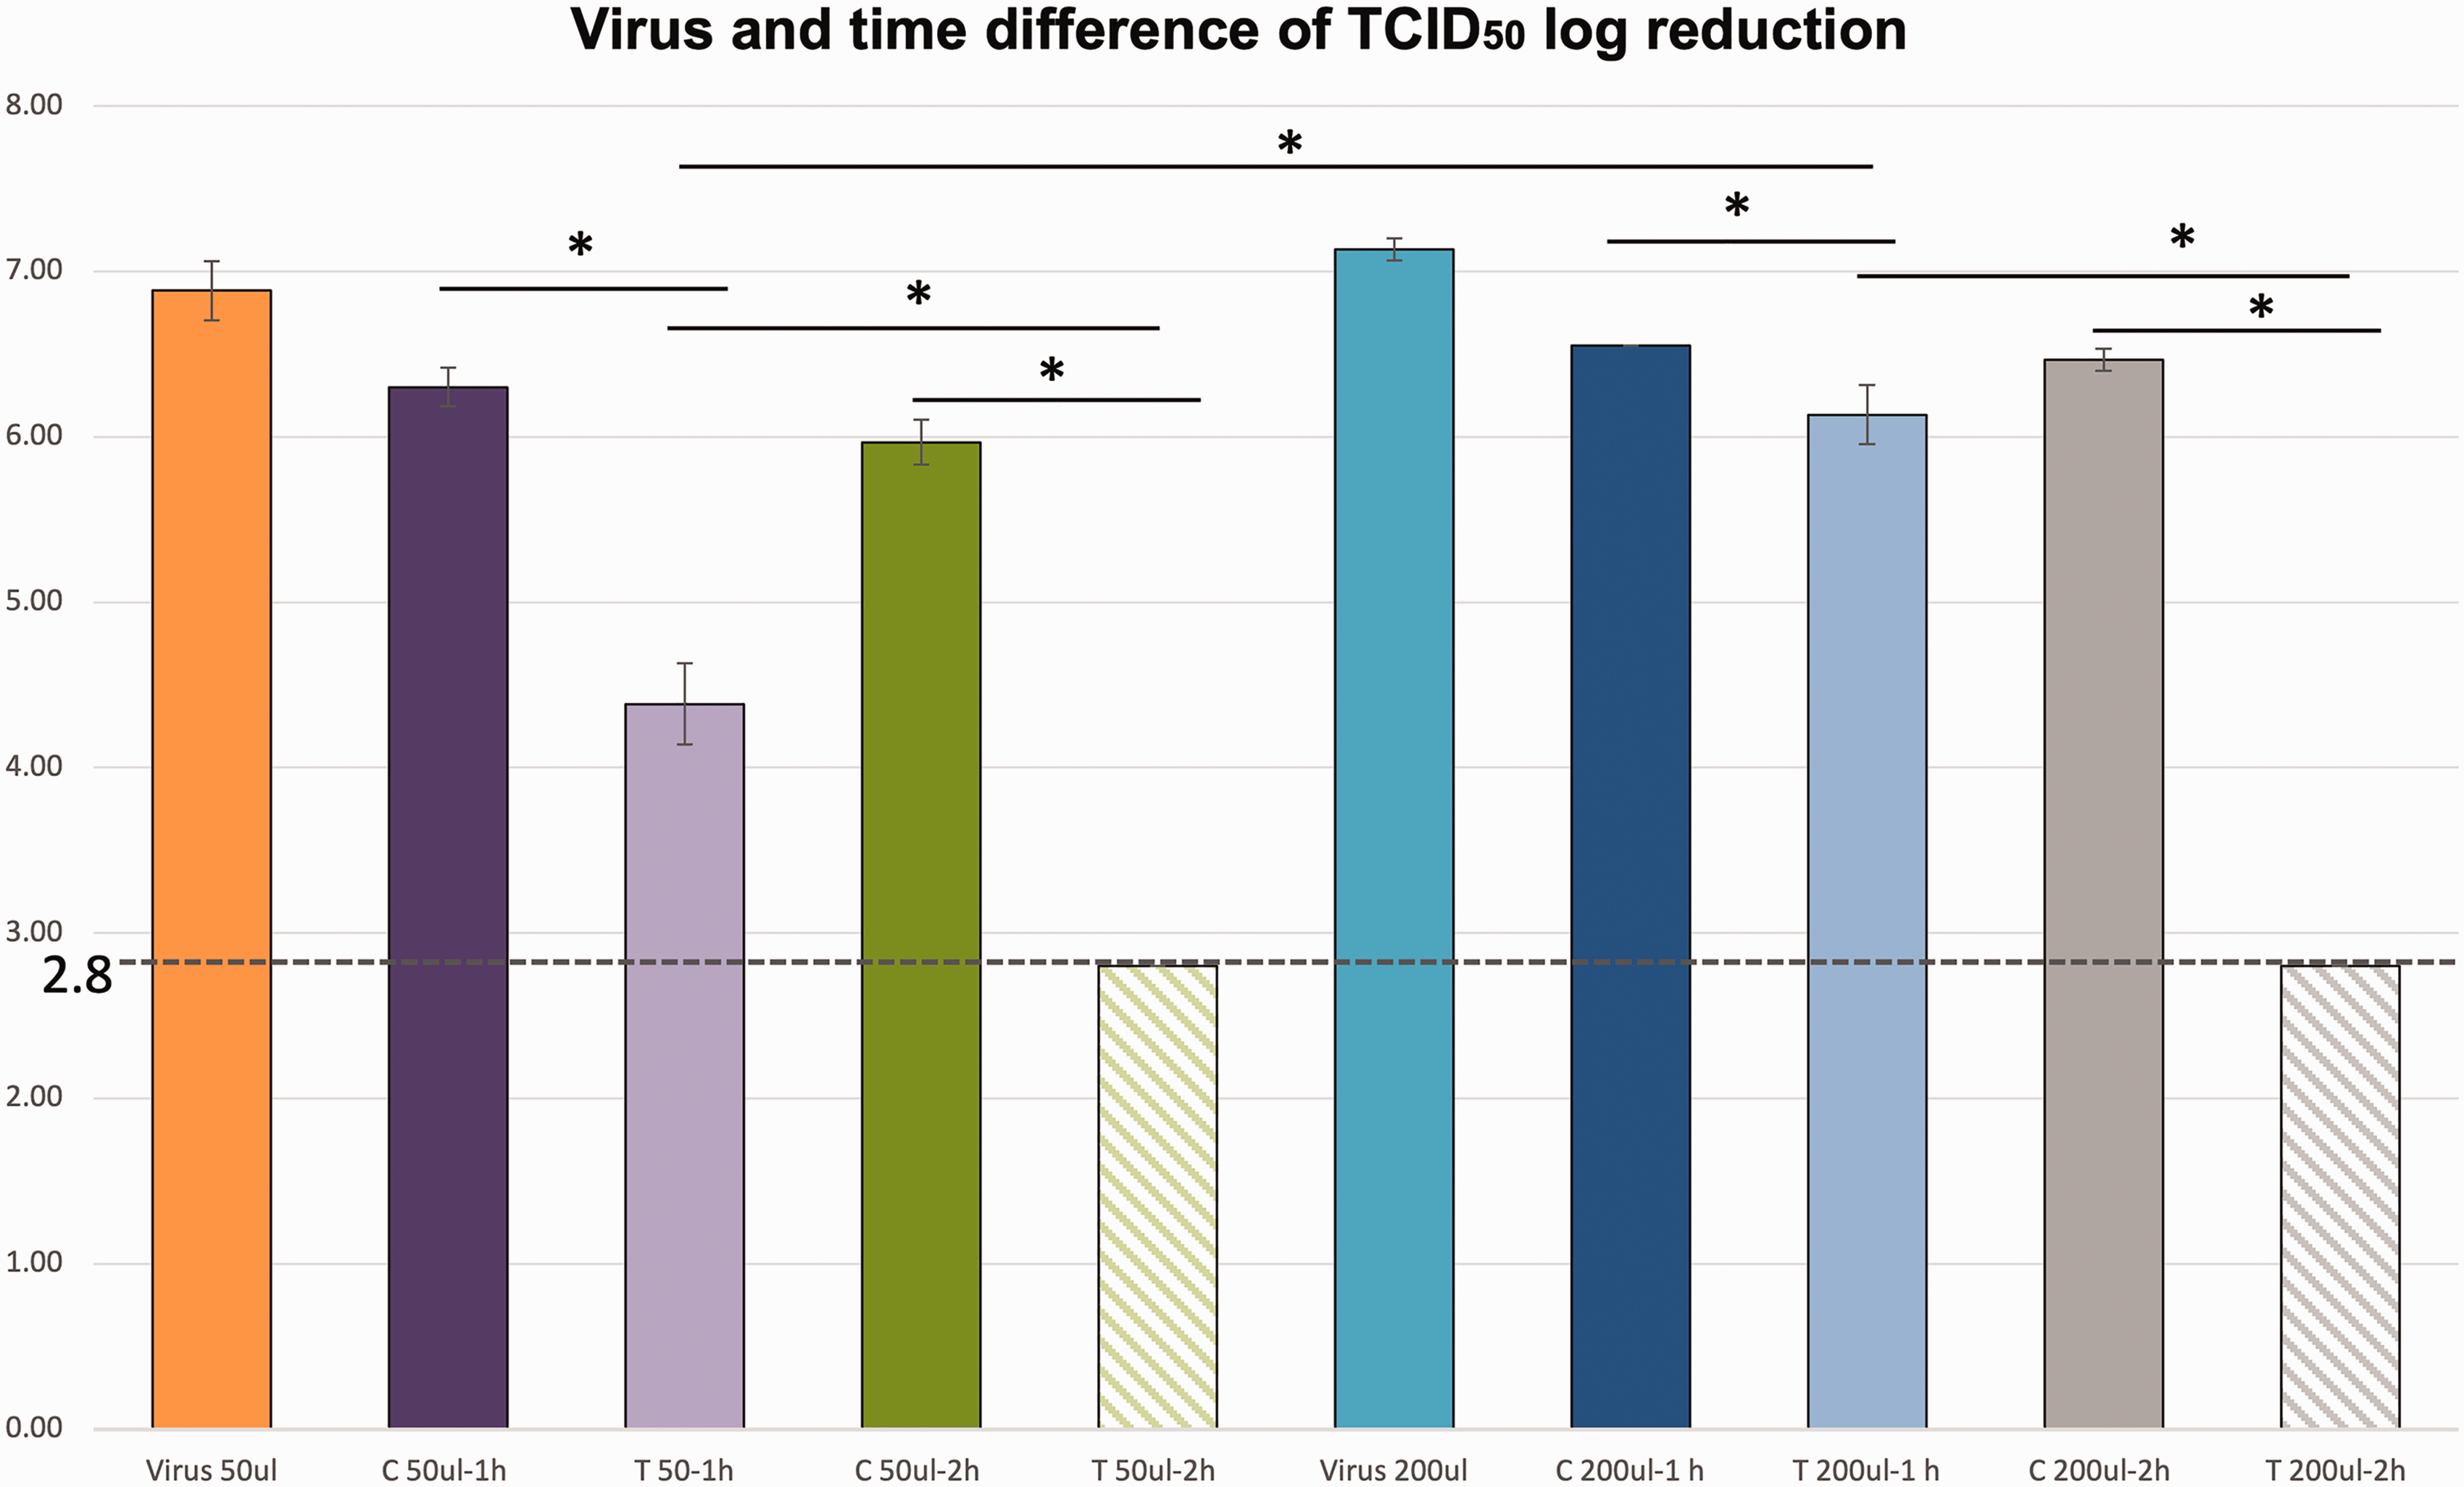
Antiviral results of different virus volumes and incubation times. Virus 50/200 µl: virus control; C: control sample; T: treated sample. 1h: 1 hour incubation time; 2h: 2 hours incubation time (the dashed line indicates the limit of detection under the assay conditions of 2.8 log10 Tissue Culture Infectious Dose 50 (TCID50)).
Virus amount variance
Viral volumes of 50 and 200 µl were added to the textile sample to test the impact of different virus volumes on textile antiviral activity. The TCID50 log value of the patterned bar (T50 µl-2h and T200 µl-2h) was below the limit of detection of 2.8 log10 TCID50. The ISO 18184 protocol specifies that if the virus on the control fabric is reduced by more than 1 log reduction, the test is invalid. From the result, after 1 hour incubation, compared with the 50 µl control sample, the treated sample has a 1.92 TCID50 log reduction, while the 200 µl sample has 0.42 TCID50 log reduction. After 2 hours of incubation, the 50 µl group has a TCID50 log reduction greater than 3, and the 200 µl group has a TCID50 log reduction greater than 3.5. This is reasonable because as the volume of virus increases, textile samples with a controlled surface area will need more time to react with the virus. The P-value between each control group and treatment group is less than 0.05. Meanwhile, the P-value between treatment groups of different virus volumes is also less than 0.05. Overall, the above results indicate different virus volumes and incubation times have an effect on the viral activity.
Incubation time variance
The TCID50 log value has a larger decrease in the second hour of incubation when comparing both 50 and 200 µl viral volumes incubated for 1 or 2 hours (Figure 8). Both control samples showed a little antiviral activity compared with the virus control, which means that due to the textile–virus interaction, there are some detrimental effects on the virus itself due to the mechanical, physical and chemical properties of the textiles. 13 Overall, with the increase of incubation time, the antiviral effectiveness of different virus volumes increases. This result showed similar trends with antiviral fabric properties that were tested following the ISO 18184 methodology.14,15 In addition, the TCID50 shows a larger drop within the second hour incubation compared with the first hour. This may be due to the virus fluid absorbance of the textile sample within the first hour, which slows down the antiviral reaction. Once textile samples are completely soaked in the virus fluids, the reaction time speeds up.
Presoaked and unsoaked variance
Due to different hydrophobicity and hydrophilicity properties of the textile products, an evaluation test was designed to determine whether soaking the textile sample in aqueous conditions can affect the textile antiviral activity. Textile samples were divided into two groups: presoaked and unsoaked. Presoaked samples were soaked in the 200 µl MEM 1 + 1 + 1 medium for 30 minutes. Once the samples are wet throughout, excess media can be removed and the samples can be placed into the wells. After that, virus fluids were added into the textile samples. For the unsoaked samples, virus fluids were added directly onto the samples in the 96-well plate.
From Figure 9, compared with the control sample, textile samples that were presoaked have 0.71 TCID50 log reduction, and the unsoaked sample has 1.9 TCID50 log reduction. This is reasonable, because the antiviral treatment on the sample surface could come off and fade through the presoaked process. After that, the antiviral activity is not as strong as that of the unsoaked sample. Also, it is possible that less virus was attached on the presoaked samples since media may have occupied among the fibers during the presoak process, and therefore the antiviral activity was not as strong as that of the unsoaked groups.
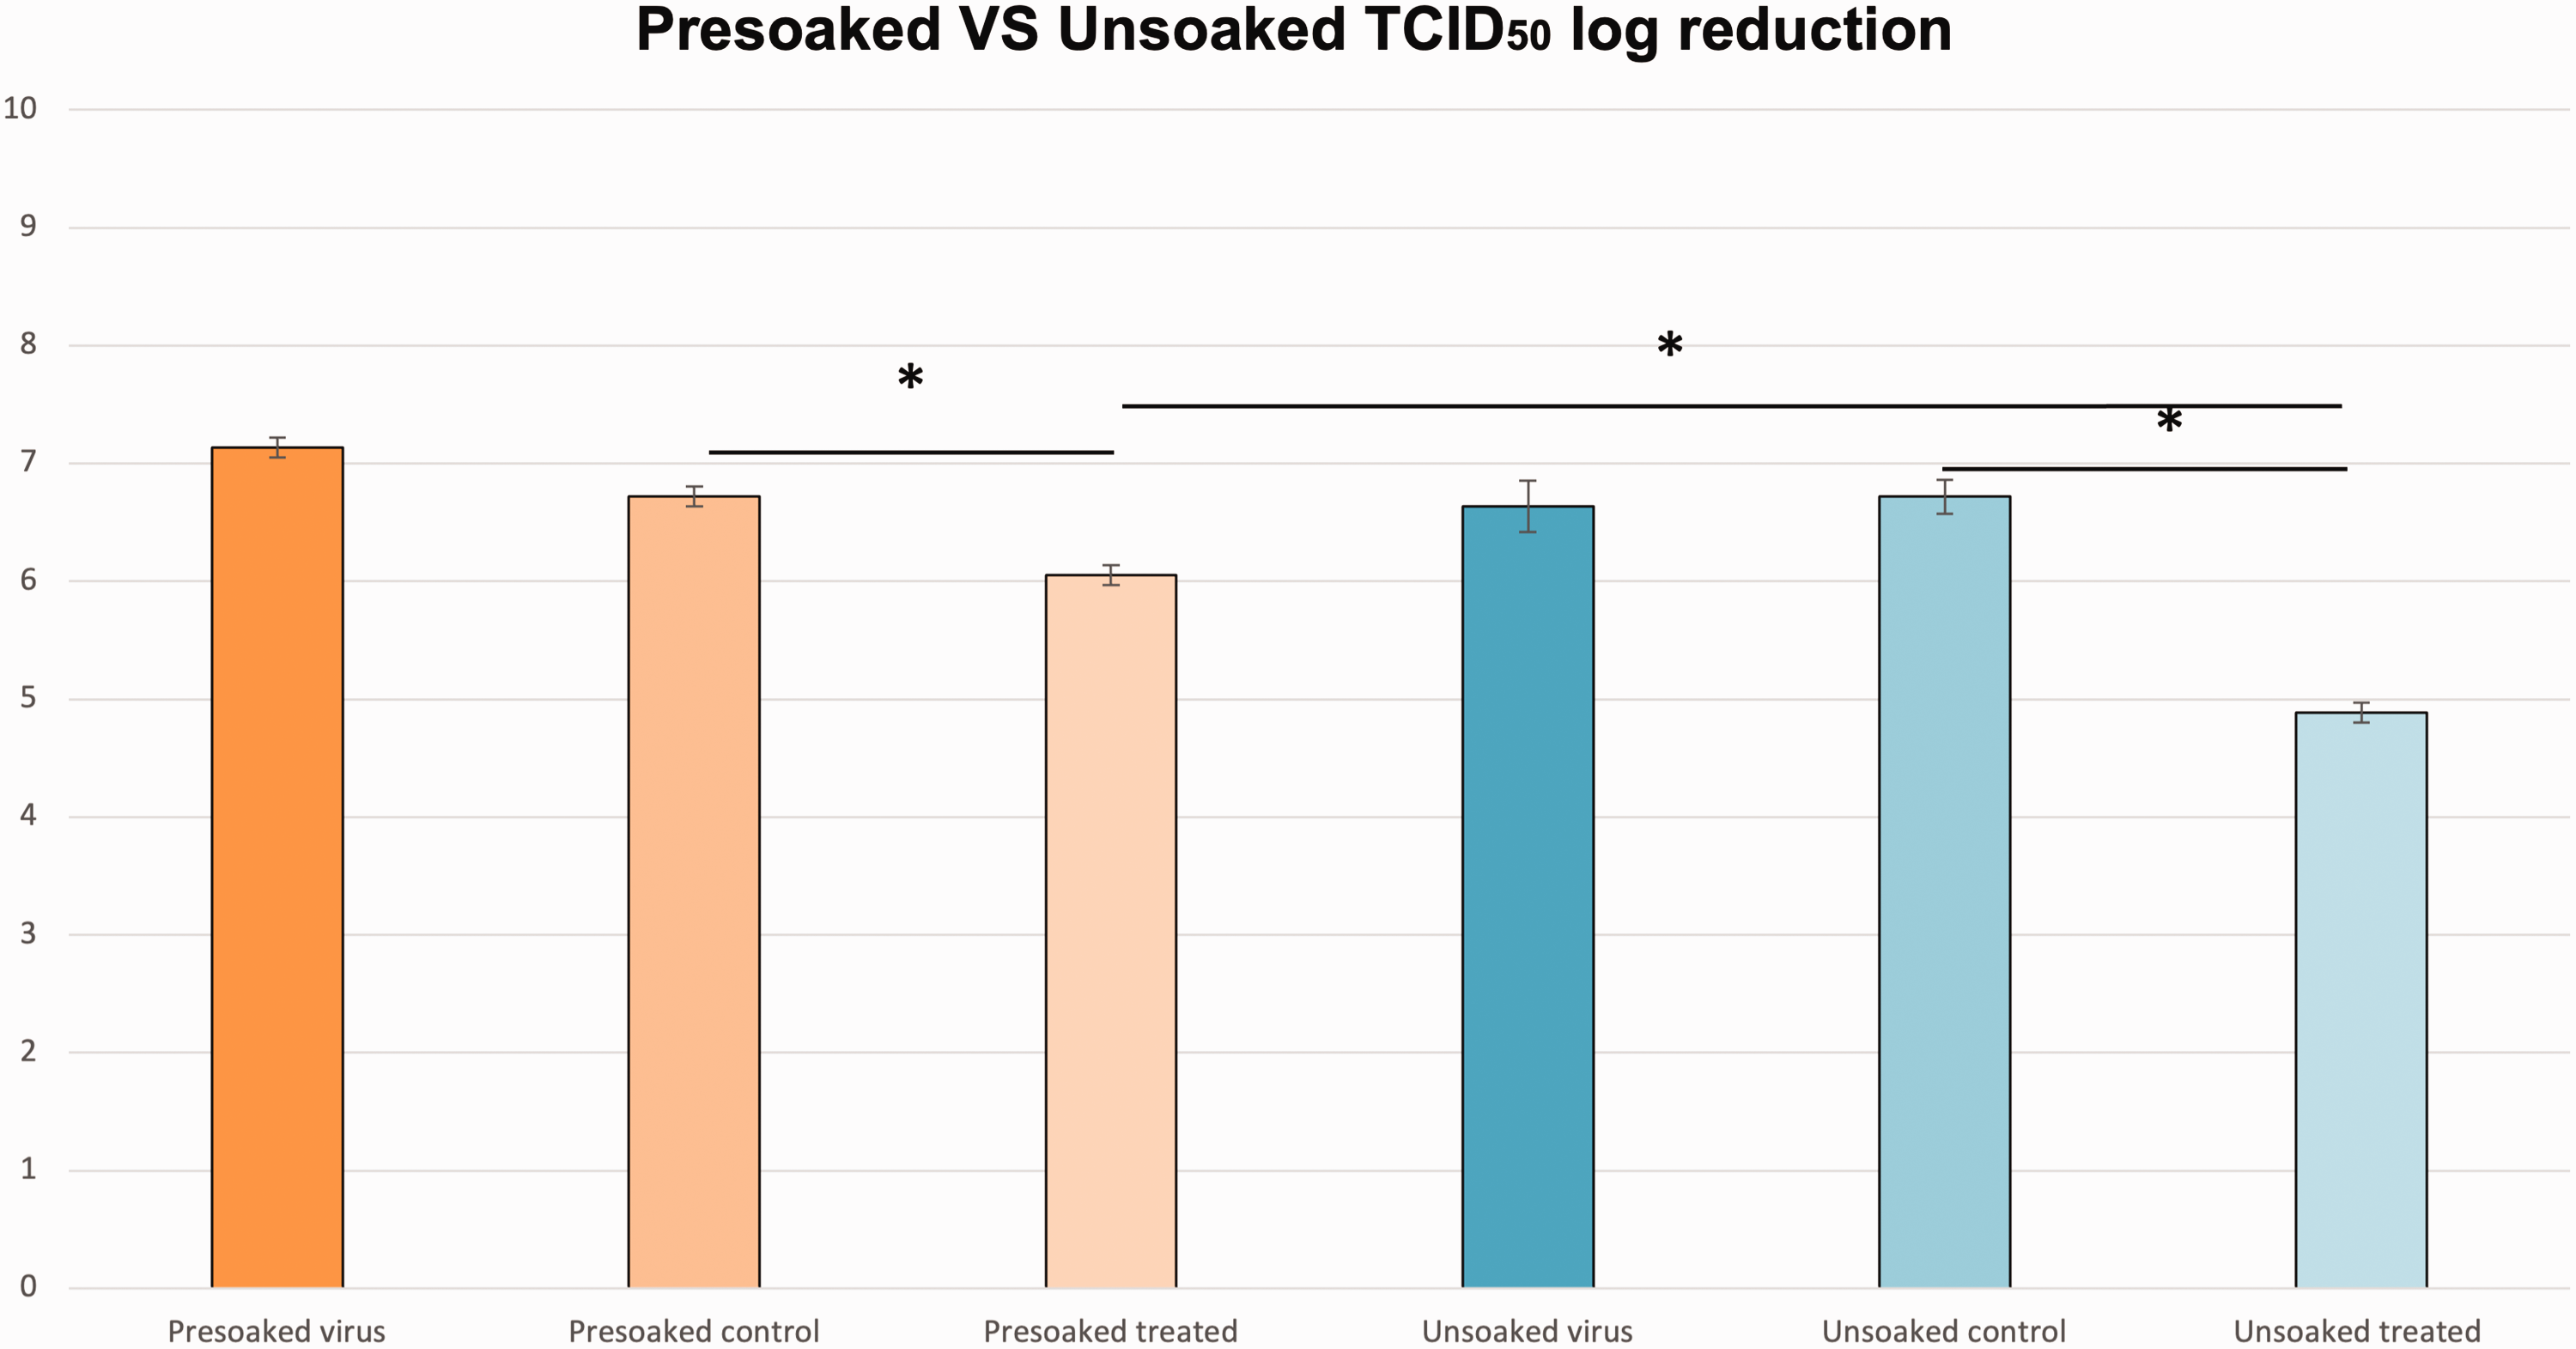
Antiviral result of the presoaked sample and the unsoaked textile sample. Presoaked virus: virus only control to which was added the same amount of Minimum Essential Medium (MEM) as the presoaked samples; Presoaked control: presoaked control samples; Presoaked treated: presoaked treated samples; Unsoaked virus: virus only control (unsoaked); Unsoaked control: control samples (unsoaked); treated: treated samples (unsoaked); TCID50: Tissue Culture Infectious Dose 50.
Conclusion
In summary, we have successfully modified a protocol for testing antiviral activity for textile samples, which is a combination of ISO 18184 and what we call “gold standard” protocols.16,17 This resultant protocol was prepared after careful performance of both the protocols multiple times, and observing all the important steps while negating all the repetitive steps in the prior protocols. The controllable parameters, such as virus volume, incubation time and initial virus dilution volume, are showing different impacts on the final textile antiviral results. As a result, this protocol can be used to evaluate the CPEs of antiviral textiles. It contains instructions for maintaining the HUH-7 cell line and HCoV-229e virus, which are used extensively in this protocol. The protocol also demonstrates the difference between CPE and healthy cells, which is crucial for reproducible results.
The next steps of this project will be to answer some more questions, including the effects of laundry on the efficacy of the antiviral coating, that is, the appropriate temperature, type of detergent and drying conditions when the antiviral textiles are laundered. In addition, the effects of light, temperature, humidity and other environmental conditions on the shelf life of the antiviral treatment will also provide valuable input for the end use applications.
Differences between existing the ISO18184 protocol and our optimized hybrid protocol, the “gold standard” protocol

Footnotes
Acknowledgements
We wish to extend our sincere gratitude to Dr. Martin W. King, Dr. Donald Thompson and Dr. Roger Barker for their contributions to this project. We also wish to thank Bailey Knight for laser cutting the samples and Judy Elson for her assistance with our electron microscopy.
Declaration of conflicting interests
The author(s) declared no potential conflicts of interest with respect to the research, authorship and/or publication of this article.
Funding
The author(s) disclosed receipt of the following financial support for the research, authorship and/or publication of this article: This work was supported by Goldshield Technology, Piedmont Chemical, the Wilson College of Textiles and the NCSU Laboratory Research Equipment Program (LREP) (JMG).

Supplemental material
Supplemental material for this article is available online.