
Abstract
Monitoring pulse and arterial oxygen saturation (SpO2) continuously and in real-time is conducive to the prevention and monitoring of cardiovascular disease. The reported optical fiber fabrics have the shortcomings of low side-emitting and side-coupling efficiency of a single fiber, and more optical fibers were used. In this paper, we propose a micro-bending bulge structure based on side-emitting and side-coupling of the polymer optical fiber (POF), and a small number of the POFs are woven into the fabric as weft yarns to measure pulse and SpO2 using a simple plain weave. The experiments investigated the effect of the different micro-bending bulge structures on the side-emitting and side-coupling efficiencies by means of the ray tracing method, explored the feasibility to measure pulse waves and SpO2 on the fingertip, brachial artery, and forehead ophryon, and evaluated the accuracy of the measurements in the static, dynamic, and sweating states. The results show that the side-emitting and side-coupling efficiencies of the POF are optimal by adopting a 1 mm micro-bending bulge height and a 3 mm micro-bending bulge width. The fabric sensor with three side-emitting POFs and two side-coupling POFs is capable of monitoring pulse and SpO2 on the forehead. In addition, the maximum error is 1 bpm for the pulse and within 2% for SpO2 on the forehead.
Keywords
Cardiovascular disease is the major factor affecting the health of the elderly.1,2 Pulse and arterial oxygen saturation (SpO2) are important vital signs, which can offer useful information for the identification and prevention of cardiovascular disease.3–5 Thus, wearable fabric sensors for monitoring the pulse and SpO2 in real-time have attracted great attention. 6
For electronic sensors for monitoring the pulse and SpO2, photodiodes and integrated chips are usually employed,7,8 whose substrates are fabricated with multiple layers of polyimide or polyurethane. However, they have low air permeability, resulting in being uncomfortable for long-term and continuous health monitoring. 9 Compared with traditional electronic sensors, optical fiber sensors offer advantages such as small size, light weight, low cost, and immunity to electromagnetic interference.10–13 Polymer optical fiber (POF) sensors are widely used due to their higher flexibility and lower Young's modulus for fabric sensors.14,15 Conventional POF fabric (PF) sensors for monitoring the pulse and SpO2 are mostly based on embroidery technology or fixing POFs with chemical materials. Rothmaier et al. 16 integrated POFs into a textile substrate by embroidery (producing microbends with different diameters), and the maximum coupling efficiency was only 0.00799%. Krehel et al. 17 presented 82 POFs embroidered on fabric in the form of three concentric rings, acting as the light source and the light collector with a maximum coupling efficiency of less than 0.07%. Quandt et al. 18 proposed a parallel PF sensor based on embroidery to acquire pulse wave signals of the reflection mode on the fingertip and forehead, but the SpO2 was not obtained as only one wavelength light source was used. The POFs in the embroidered fabrics were often fixed by a certain number of fixed points to keep the fiber structure stable, which made the preparation process complex. Besides, for measuring the wrist pulse and SpO2, Ballaji et al. 19 reported that 16 POFs were fixed inside polyvinyl chloride (PVC) tubes. The distal ends of the POFs were cleaved at a 45° angle and fixed into a textile pocket. However, this method requires a special pocket for placing the sensor. Because the POF is wrapped with PVC, the hardness increases and the comfort decreases. The use of many POFs reduces the comfort of the fabric and makes it inconvenient to connect detection circuits. Therefore, the reported PF sensors have limitations of low coupling efficiency, many POFs, poor comfort, and inconvenient connection to subsequent detection circuits.
In this work, we design a POF fabric sensor for pulse and SpO2 measurement (POF-PSFS) that adopted the micro-bending bulge structure of the POF based on side-emitting and side-coupling. The thermosetting process was applied to prepare the micro-bending bulge structure of the POF. The ray tracing method was applied to simulate and evaluate the side-emitting and side-coupling efficiencies in different micro-bending bulge heights, and the micro-bending bulge height of excellent side-emitting and side-coupling efficiencies was selected for the POF-PSFS fabrication. Three side-emitting POFs and two side-coupling POFs were woven into the fabric at intervals as weft yarns in plain weave. Based on the mechanism of reflection mode photoplethysmography (PPG), we explored the feasibility of measuring the pulse and SpO2 on the fingertip, brachial artery, and forehead and evaluated the accuracy of the pulse and SpO2 measurement when the body was in the static, dynamic, and sweating states. It was demonstrated that the POF-PSFS was able to measure the pulse and SpO2 on the forehead, and had the characteristics of high side-coupling efficiency, a small number of POFs, easy preparation, and better comfort. It is promising for large-scale production.
Principle of polymer optical fiber fabric sensor for pulse and arterial oxygen saturation monitoring
The POFs achieve the functions of side-emitting and side-coupling by means of the topical micro-bending bulge structure. POFs with light refracted out of the micro-bending bulge are called side-emitting POFs, and POFs coupled with external light are called side-coupling POFs. The POF is composed of core and cladding (Figures 1(a1) and (a2)). Figure 1(a1) shows the side-emitting principle of the micro-bending bulge structure. The incident angle of the incoming ray at interface 1 is greater than or equal to the critical angle for total internal reflection of the core and cladding. It can meet the condition for total internal reflection, and the ray continues to be transmitted to the micro-bending bulge structure. In the micro-bending bulge, the incoming ray meets the interface of the core and cladding at a small angle and is thus refracted into the external environment, which achieves the side-emitting function of the POF. Figure 1(a2) shows the side-coupling principle of the micro-bending bulge structure. The incident angle of the incoming ray at surface 2 is less than or equal to the critical angle for total internal reflection of the core and cladding, then the ray reaches the core and is transmitted to the end face of the POF, so the POF has the side-coupling function.
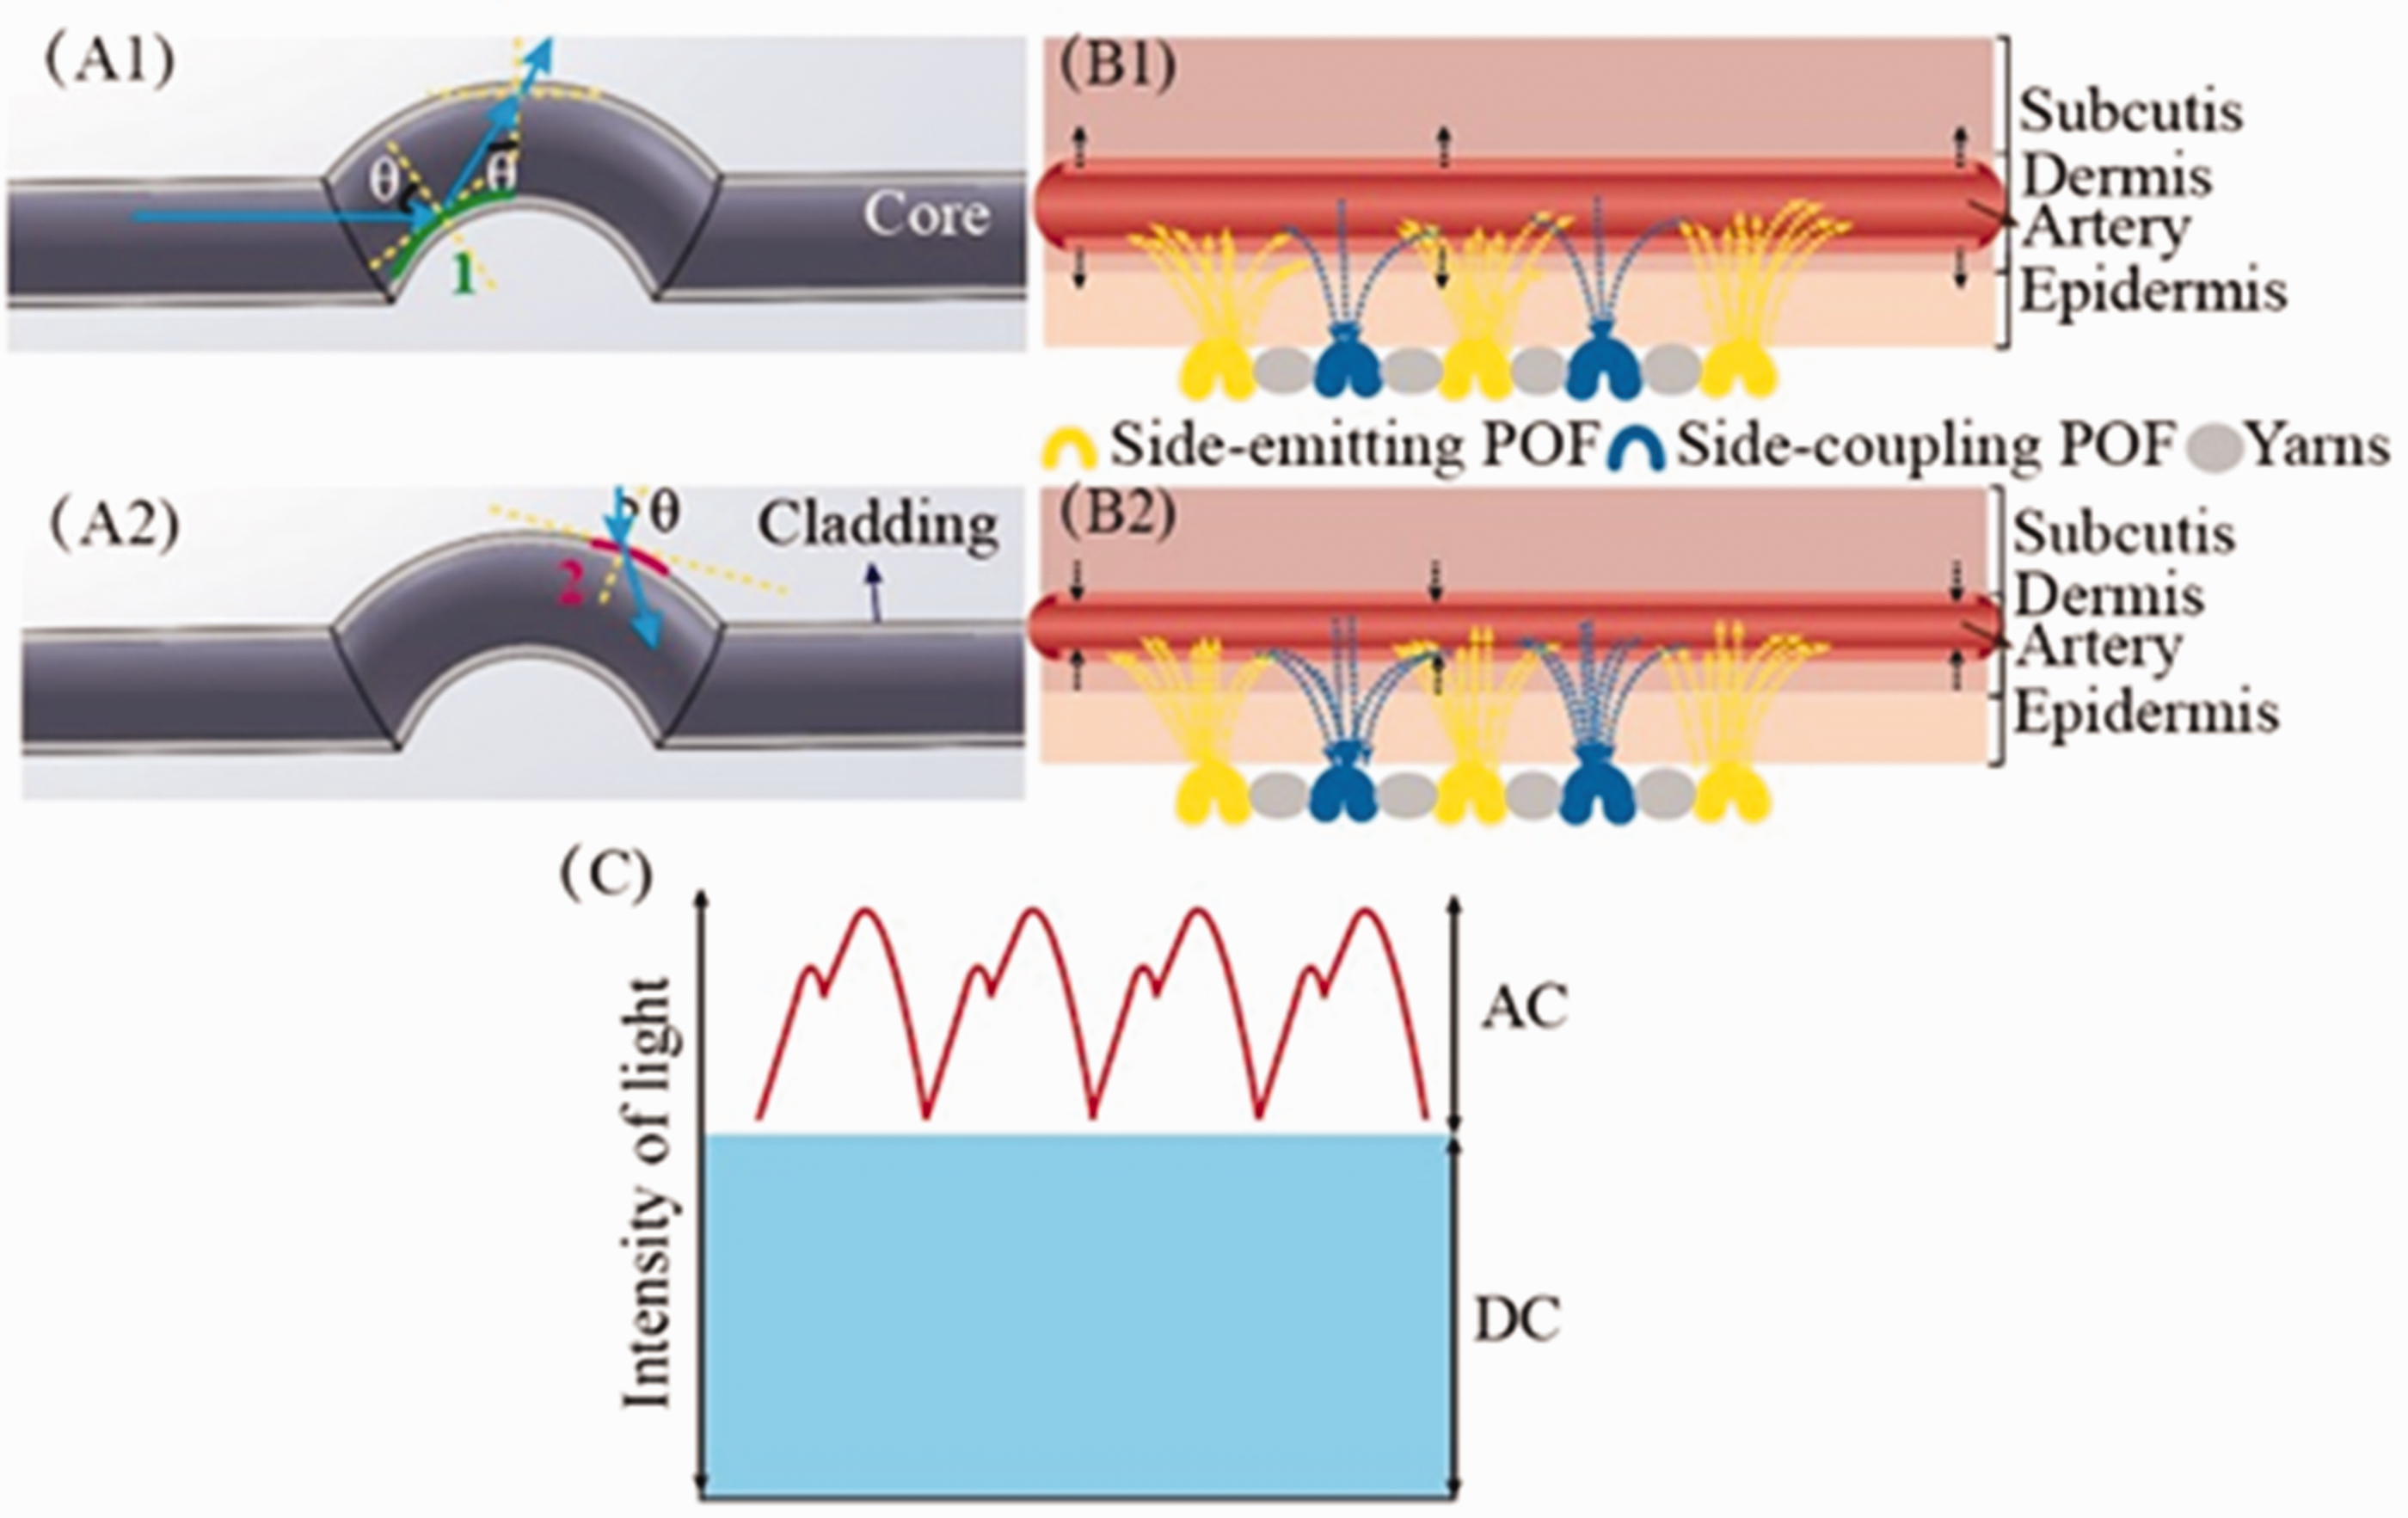
(a1) Schematic illustration of the side-emitting polymer optical fiber (POF). (a2) Schematic illustration of the side-coupling POF. (b1) Schematic diagram of the POF fabric sensor for pulse and arterial oxygen saturation measurement (POF-PSFS) based on photoplethysmography (PPG) while the heart contracts. (b2) Schematic diagram of the POF-PSFS based on PPG while the heart relaxes and (c) The composition of the pulse signals. AC: alternating current; DC: direct current.

Schematic illustration of the simulation model: (a) polymer optical fiber model; (b) side-emitting model and (c) side-coupling model. (Color online only.)
As shown in Figures 1(b1) and (b2), based on PPG, the light emitted by the side-emitting POFs passes through the epidermis, dermis, arteries, and subcutis and is partly absorbed, then the scattering light returns to the skin surface again and the light passing through the skin surface is received by the side-coupling POFs.20,21 With the cyclic changes of heart contraction and relaxation, the blood volume in the arteries and the volume of hemoglobin increase or decrease. Hemoglobin is one of the main components of red light absorption in the blood. 22 In Figure 1(b1), when the heart pumps blood to the body, the arteries expand and the arteries’ blood volume and the light absorption of hemoglobin increase, resulting in less light traveling back to the skin and the decrease of the light intensity coupled by the side-coupling POFs. In Figure 1(b2), as the blood returns to the heart, the arteries contract and the arteries’ blood volume and the light absorption of hemoglobin decrease, leading to more light traveling back to the skin. The light intensity of the side-coupling POFs coupling light increases. 23 As shown in Figure 1(c), the absorption light intensity (direct current (DC) light intensity) of the epidermis, dermis, and subcutis tissue shows little change, while the changes in blood volume and hemoglobin volume in the arteries affect the absorption light intensity (alternating current (AC) light intensity), so the light intensity changes of the side-coupling POF can reflect the changes of blood volume in the arteries.20,21,23 So, the pulse information is obtained.
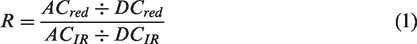
The hemoglobin has a different absorptivity depending on the oxygen level and the wavelength of light. The deoxygenated hemoglobin absorbs more light in the red band, while the oxygenated hemoglobin absorbs more light in the infrared band.24,25 By illuminating the skin with red light at the wavelength of 650 nm and infrared light at the wavelength of 940 nm, the AC light intensity and DC light intensity under the two wavelengths are obtained. The ratio of their values is R (Equation (1)).20,26 According to the literature, the relationship between SpO2 and AC and DC light intensity is as shown in Equation (2)

Fabrication of polymer optical fiber fabric sensor for pulse and arterial oxygen saturation monitoring
Materials
The warp yarns of the POF-PSFS employed 19.7 tex viscose/nylon. The blend ratio of viscose/nylon yarn is 80:20, and the yarn twist is 63 twists/10 cm. The weft yarns employed 1000 µm diameter POFs, 19.7 and 295.5 tex viscose/nylon. The core and cladding materials of the POF (core diameter 980 µm and cladding thickness 20 µm) were polymethyl methacrylate (PMMA) and fluorinated polymer, respectively. Viscose/nylon yarns are provided with excellent hygroscopicity and wear resistance. The 19.7 tex viscose/nylon yarns were purchased from Dongguan Zhengyu Textile Co. Ltd (Guangdong, China), and the 295.5 tex viscose/nylon yarns were prepared by 15 roots of 19.7 tex viscose/nylon yarns twisted by 3 twists/cm. PMMA POFs were bought from Jiangxi Dasheng Plastic Optical Fiber Co. Ltd.
Structure and design of the POF
Figure 2(a) shows the micro-bending bulge structure for simulation. When the light source is stable, more light is refracted from the micro-bending bulge structure and the side-emitting efficiency is higher. The more light that is coupled and transmitted to the end face of the side-coupling POF, the better the side-coupling efficiency. With a certain width (w) of the micro-bending bulge, the incident angle of light in the POF will change due to the diverse heights (h) of the micro-bending bulge. Therefore, the matched height and width need to be selected to get high side-emitting and side-coupling efficiencies. For convenient processing, w is set as 3 mm. The nine schemes of micro-bending bulge heights designed are shown in Table 1.
Simulation design parameters of micro-bending bulge heights
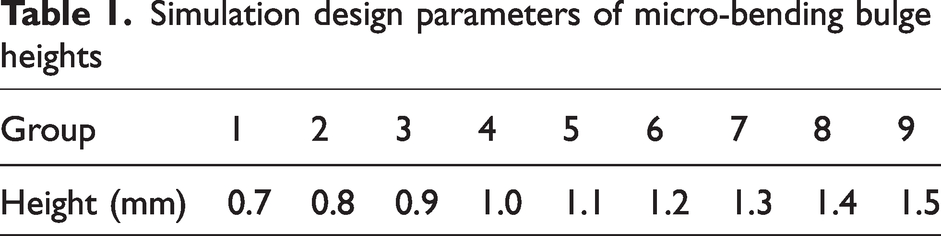
The side-emitting and side-coupling efficiencies of the optical fiber structures mentioned above are simulated by the ray tracing method so as to optimize the height of the micro-bending bulge structure. The diameter of the POF is 1 mm and the width of the micro-bending bulge structure is 3 mm. In the process of the simulation, the total number of incident rays is 271 and the initial intensity of each ray is 1 W, so the total light flux is 271 W.
In Figure 2(b), the light source was set on the left-hand end of the POF (red circle position), and the detection board (black module) was put on the top of the micro-bending bulge to detect the side-emitting light intensity. The ratio of the light intensity at the detection surface to the light intensity of the light source is the side-emitting efficiency. As shown in Figure 2(c), a vertical downward light source was arranged directly above the right-hand side (red circle position) of the micro-bending bulge structure and a circular detection board (black module) with a diameter of 1 mm was placed on the right-hand end face of the POF. The ratio of the light intensity at the circular detection surface to the light intensity of the light source at the red circle is the side-coupling efficiency.
Fabric weave
The POF-PSFS adopts the weaving process. The simplest plain weave was used to weave three side-emitting POFs and two side-coupling POFs as weft yarns, which were employed based on the previous research of the team group. As shown in Figure 3(a), the POF-PSFS comprises the substrate fabric (SF) and PF. Along the weft direction, the PF includes the liner fabric (LF), POF interlacing area (PIA), and POF micro-bending bulge part (PMBP).

Schematic structure of the polymer optical fiber fabric sensor for pulse and arterial oxygen saturation measurement (POF-PSFS): (a) plan structure diagram; (b) three-dimensional structure diagram; (c), (d) the looming drafting of substrate fabric and POF fabric, respectively; (e) the POF-PSFS sample and the detail of the micro-bending bulge part and (f) the side-emitting and side-coupling structure and the output light at the end of the bundled POFs after injecting the light. (Color online only.)
In the LF, POFs act as floating line, and the LF was woven in plain weave to protect the POFs and facilitate POF bundling. The PIA serves to fix the POFs. The PMBP is used for side-emitting and side-coupling.
The SF was woven in plain weave, as shown in Figure 3(c). PF was prepared by the looming draft, as shown in Figure 3(d). The simplest plain weave was adopted. The PF contained three side-emitting POFs and two side-coupling POFs, and every POF was threaded in the black interlacing points, as shown in Figure 3(d). Side-emitting POFs and side-coupling POFs were woven into the PIA in plain weave and were present on the fabric surface of the PMBP in the weft floating over four interlacing points. The width of the PMBP is achieved by controlling the number of floating wefts. The stability of the POFs was regulated by adjusting the length of the PIA. A side-emitting POF and an adjacent side-coupling POF were separated by 295.5 tex yarn (blue interlacing points). The 295.5 tex yarns had a high density and were only woven into the PIA and the PMBP, so as to avoid the light of the side-emitting POFs entering the side-coupling POFs directly. To ensure the flattening and completeness of the PF, the whole PF was connected by 19.7 tex yarns (gray interlacing points). The weave diagram in the orange rectangle was used to weave the LF (orange rectangle), shown in Figure 3(a), the weave diagram in the green rectangle was adopted to weave the PIA (green rectangle), shown in in Figure 3(a), and the weave diagram in the red rectangle was employed to weave the PMBP (red rectangle), shown in Figure 3(a).
The fabric is shown in Figure 3(e). The fabric parameters are shown in Table 2. The width of the PMBP is 3 mm, which is in agreement with the width of the micro-bending bulge structure. The warp density was 400 ends/10 cm and the total warp ends were 652. The reed number was 100. The POF-PSFS was woven by a DWL5016 dobby loom.
Parameters of fabric particulars for each part
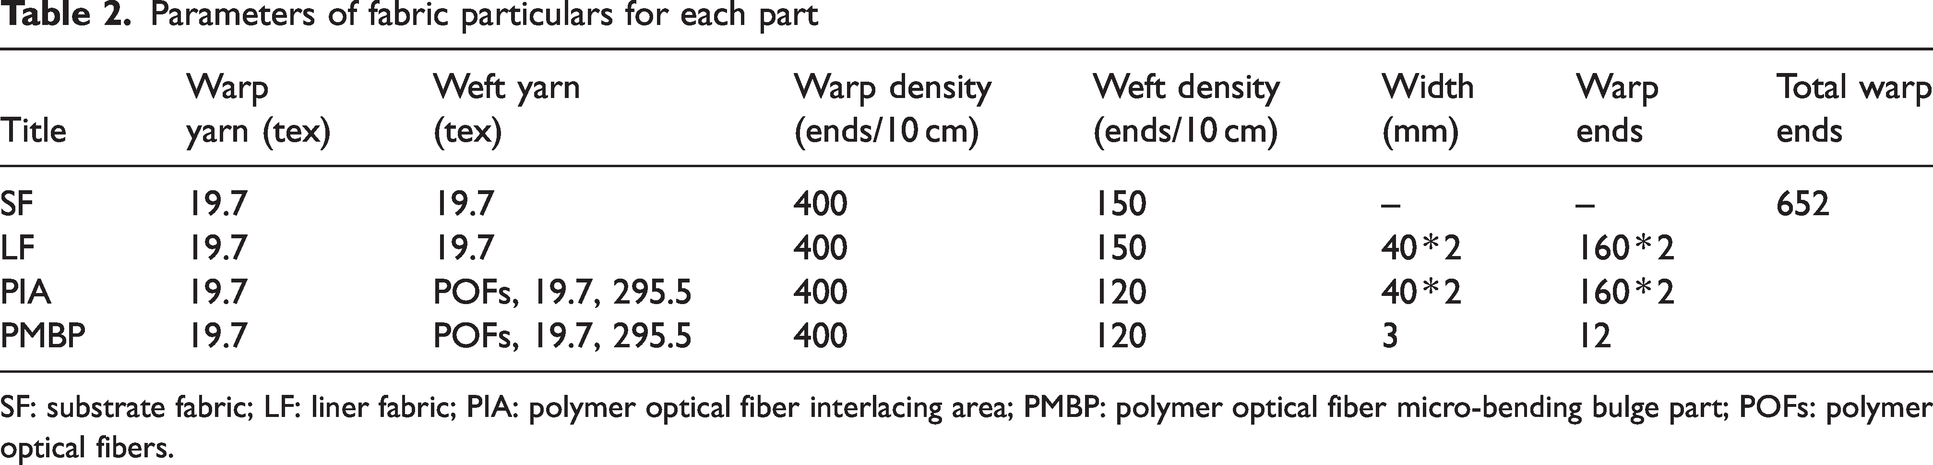
SF: substrate fabric; LF: liner fabric; PIA: polymer optical fiber interlacing area; PMBP: polymer optical fiber micro-bending bulge part; POFs: polymer optical fibers.
Experimental setup
The experimental setup for measuring the properties of the POF-PSFS is shown in Figure 4, which comprised a circuit board, a power source, and a personal computer (PC) module. The circuit board was integrated with a red light source (650 nm), an infrared light source (940 nm), and two photodetectors (PDs). Three side-emitting POFs bundled by heat-shrinkable tubes had one end connected to the interface of the red light source and the other end connected to the infrared light source interface. The two side-coupling POFs had two ends connected to the two PDs, respectively. The circuit board was powered by a mobile power source. When the circuit board was working, the red light source and the infrared light source emitted light alternately and the flicker frequencies of the two light sources were both 200 Hz.
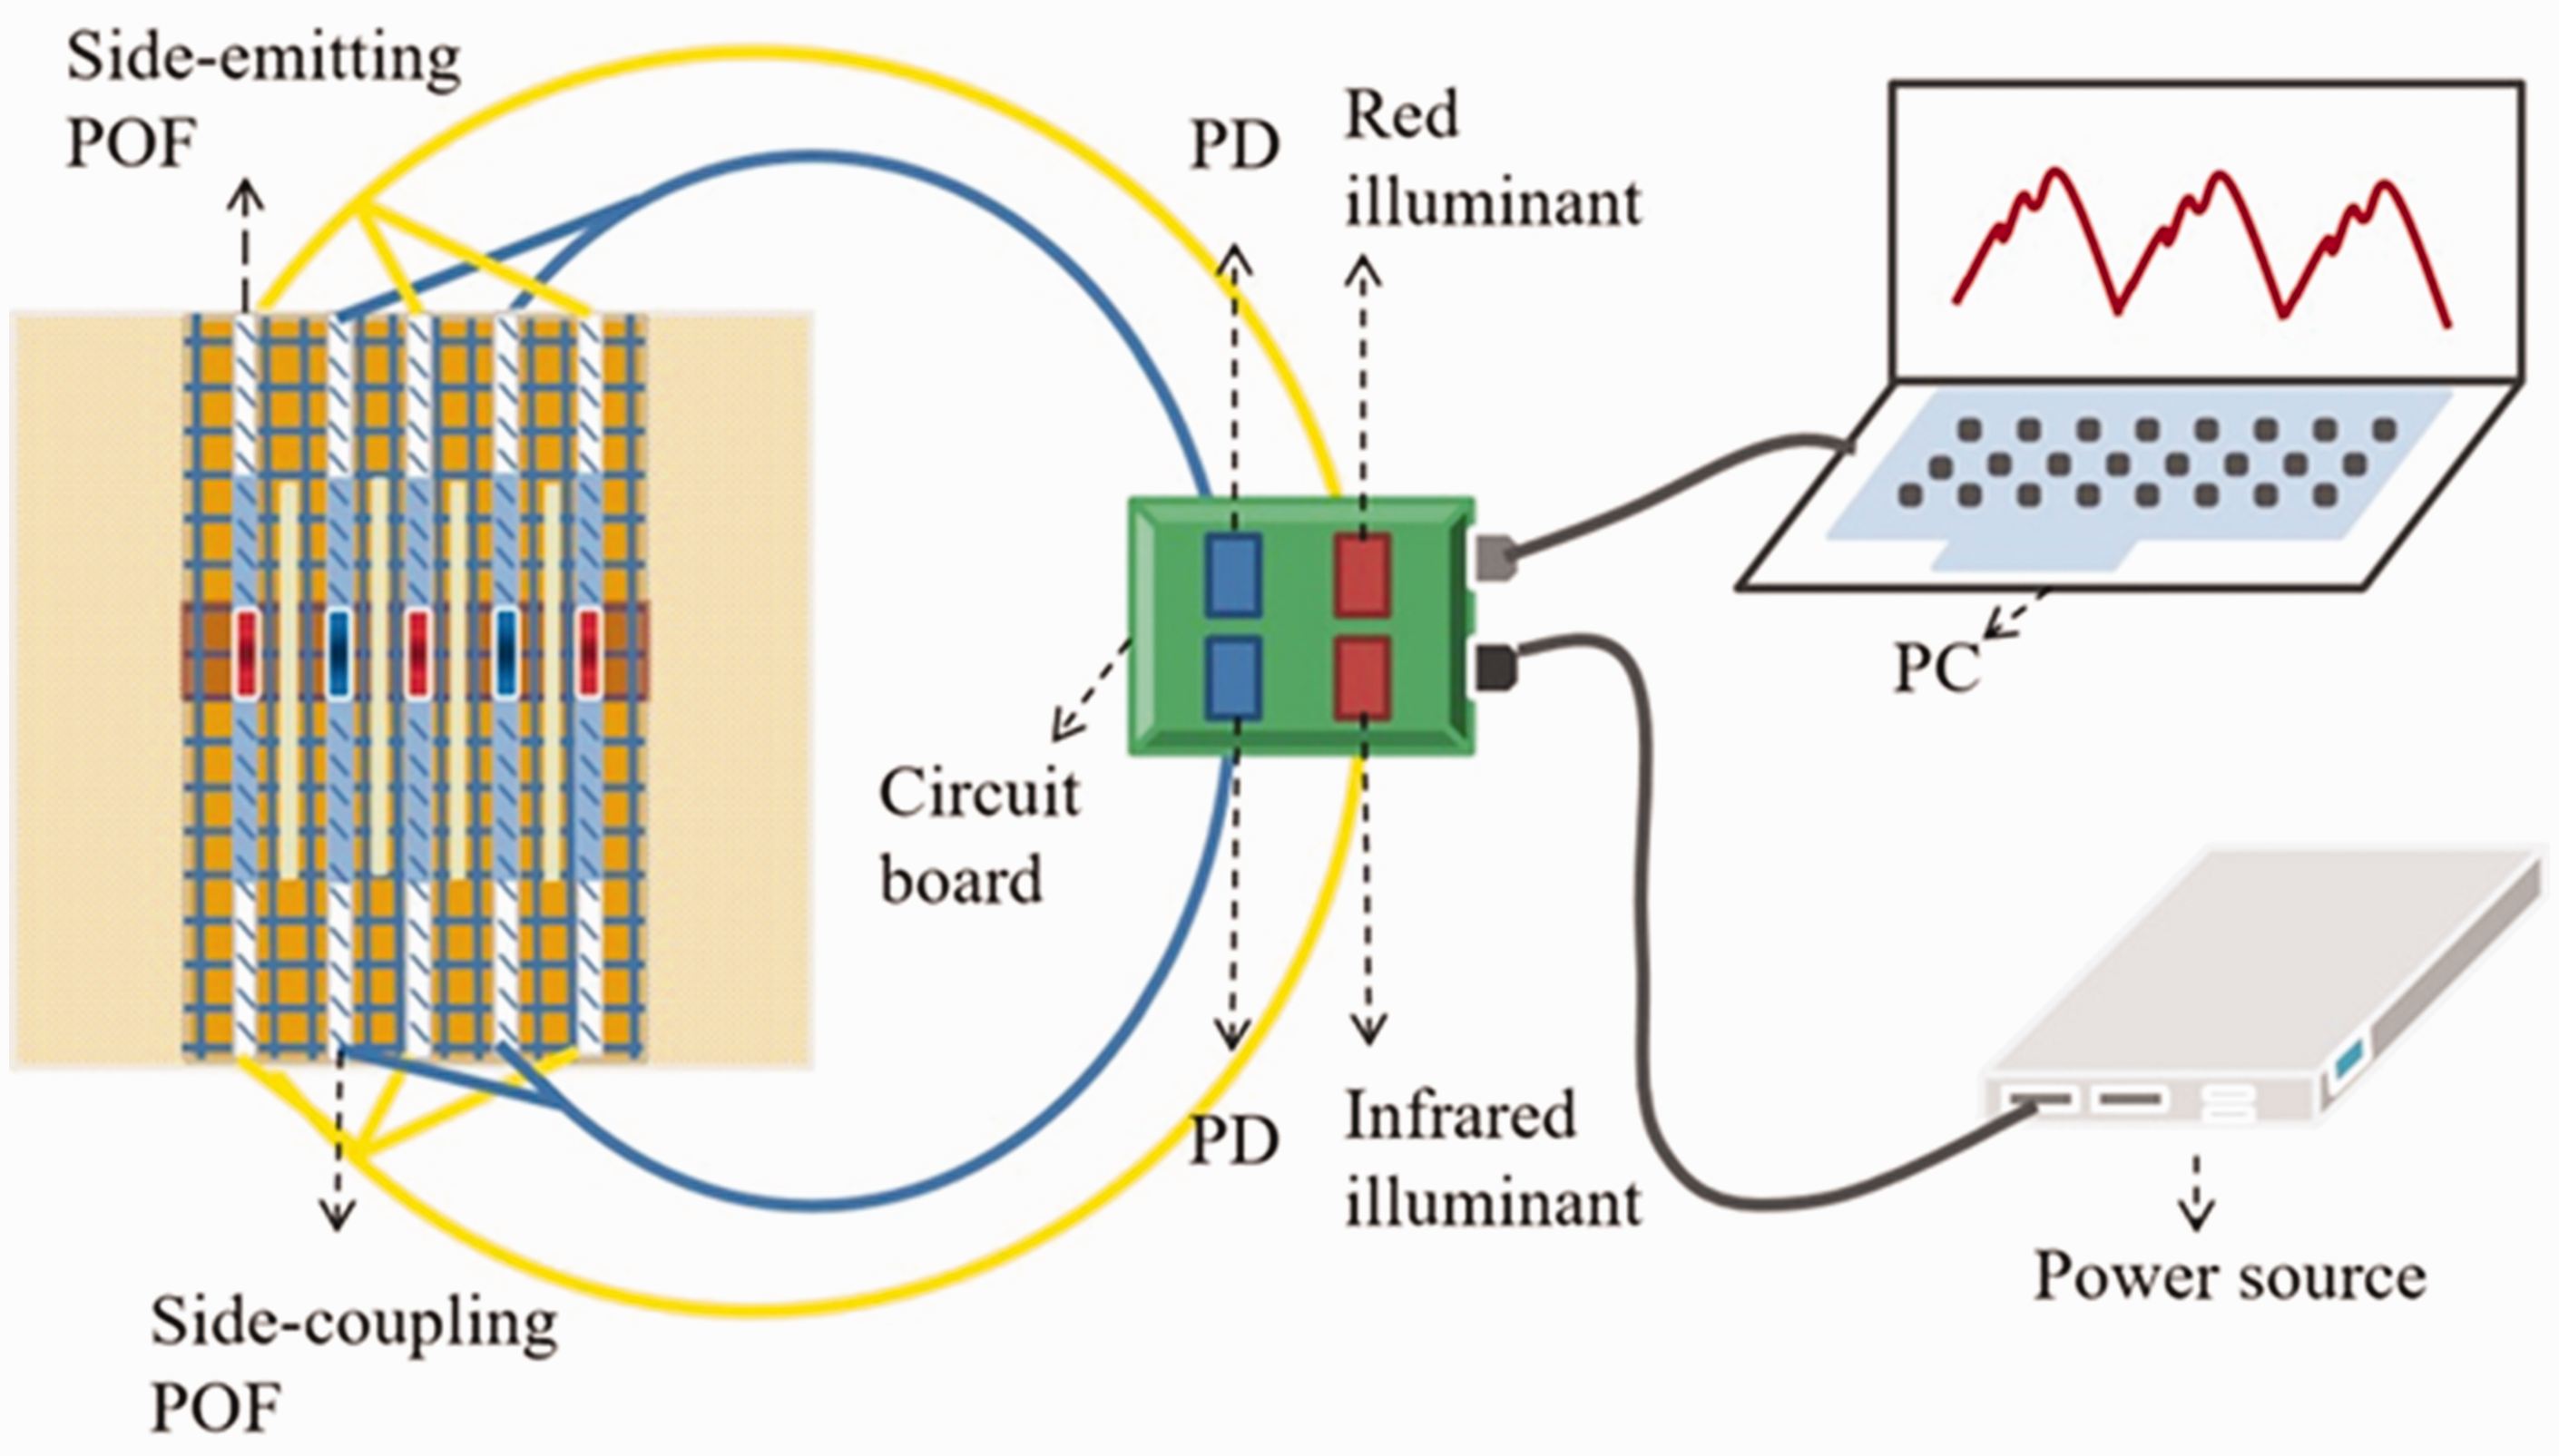
Schematic diagram of the experimental setup for pulse and blood oxygen measurement. POF: polymer optical fiber; PD: photodetector.
The PDs converted the optical signal into an electrical signal, and the pulse signal in the form of voltage output was transmitted to the PC for storage and calculation. The experiment collected pulse signals of red light and infrared for 5 seconds each time. In order to evaluate the accuracy and reliability of the POF-PSFS, a medical physiological monitor (model iMEC12) was used as a comparison instrument, and the fingertip detector monitored the pulse and SpO2 in real-time.
Results and discussion
Influence of the heights of the micro-bending bulge on the side-emitting and side-coupling efficiencies
Figures 5(a1)–(b4) demonstrate the ray trace simulation of the side-emitting POFs and side-coupling POFs with four micro-bending bulge heights. With the 0.8 mm height (h) of the micro-bending bulge, part of the incident rays was directly emitted from the other end of the side-emitting POF. There were fewer rays in the black module, and the side-emitting efficiency was low. In the side-coupling POF, a small part of the rays entered the POF, and there were fewer rays in the black module, so the side-coupling efficiency was low. When the height (h) was 1.2 and 1.4 mm, the incident angle of the incoming rays at interface 1 was smaller than the critical angle for total internal reflection of the core and cladding, and most of the rays entered the cladding instead of the black module, so the side-emitting efficiency was low. The incident angle of the incoming ray at surface 2 was smaller than the critical angle for total internal reflection of the core and cladding. Most of the rays entered the cladding on one side of the micro-bending bulge, so the side-coupling efficiency was low. With the height (h) being 1 mm, the incident angle of the incoming rays at interface 1 was greater than or equal to the critical angle for total internal reflection of the core and cladding, and more rays were transmitted to the micro-bending bulge. In the micro-bending bulge, the incident angle was smaller than the critical angle for total internal reflection of the core and cladding, and the rays refracted into the external environment, so that the side-emitting efficiency was high. The incident angle formed at surface 2 was greater than or equal to the critical angle for total internal reflection of the core and cladding, which satisfied the condition of total internal reflection and continued to transmit to the end face of the POF with high side-coupling efficiency.

(a1)–(a4) Schematic ray paths in the side-emitting polymer optical fibers (POFs). (b1)–(b4) Schematic ray paths in the side-coupling POFs. (c) The side-emitting and side-coupling efficiencies in nine different heights and (d) Schematic structure and dimensions of the micro-bending bulge.
The side-emitting efficiency and the side-coupling efficiency of nine micro-bending bulge heights for POF are simulated and shown in Figure 5(c). The side-emitting efficiency was better than the side-coupling efficiency. The side-emitting efficiency and the side-coupling efficiency first increased and then decreased as the heights of the micro-bending bulge increased. When the micro-bending bulge height was 1.5 mm, the side-emitting efficiency of 17.9% was the lowest. The side-coupling efficiency was the lowest when the height was 0.7 mm, which was 8.6%. When the height was 1 mm, the maximum side-emitting efficiency of 48% and side-coupling efficiency of 22% were reached. When the micro-bending bulge heights increasing, the incident angle of the incoming ray in the POF decreased. In the 1 mm height, the incident angle approached the critical angle of total internal reflection. Most rays in the side-emitting POF were transmitted to the micro-bending bulge. The incident angle at the micro-bending bulge was smaller than the critical angle for total internal reflection of the core and cladding. Most of the rays were refracted from the micro-bending bulge. After the rays were coupled by the side-coupling POF, the incident angle was greater than or equal to the critical angle for total internal reflection of the core and cladding, and more rays were transmitted to the end face.
In order to maximize the light intensity of the side-emitting POF illuminating the skin at the micro-bending bulge and the light intensity of the side-coupling POF transmitting to the end face, the POF with the micro-bending bulge height of 1 mm was used to manufacture the POF-PSFS. The POF obtained by heat setting and cooling in a customized mold is shown in Figure 5(d).
Collection of raw pulse signals in different body parts
The POF-PSFS was made of the POFs with the 1 mm micro-bending bulge height. Pulse signals in different body parts were acquired by the experimental setup in Figure 4 to find the preferred signal acquisition part. A healthy subject was tested statically on the fingertip, brachial artery, and forehead ophryon.
In Figure 6, without any signal processing, the raw red light signals (Figures 6(a2)–(c2)) and infrared light signals (Figures 6(a3)–(c3)) on the fingertip, brachial artery, and forehead ophryon are demonstrated. The peak voltage of the red light signals obtained from the fingertip was about 2 V and the peak voltage of the infrared light signals was approximately 2.8 V. The signal intensity was strong and the amplitude varied clearly. The signal fluctuation of the brachial artery was not obvious. The maximum voltage of the red light signal on the forehead was 1.8 V or so and the maximum voltage of the infrared light signal was an estimated 2.4 V, where the amplitude variation was comparatively distinct. Compared with the signals from the fingertip, the signal intensity and amplitude from the forehead ophryon are smaller; however, the difference is acceptable.
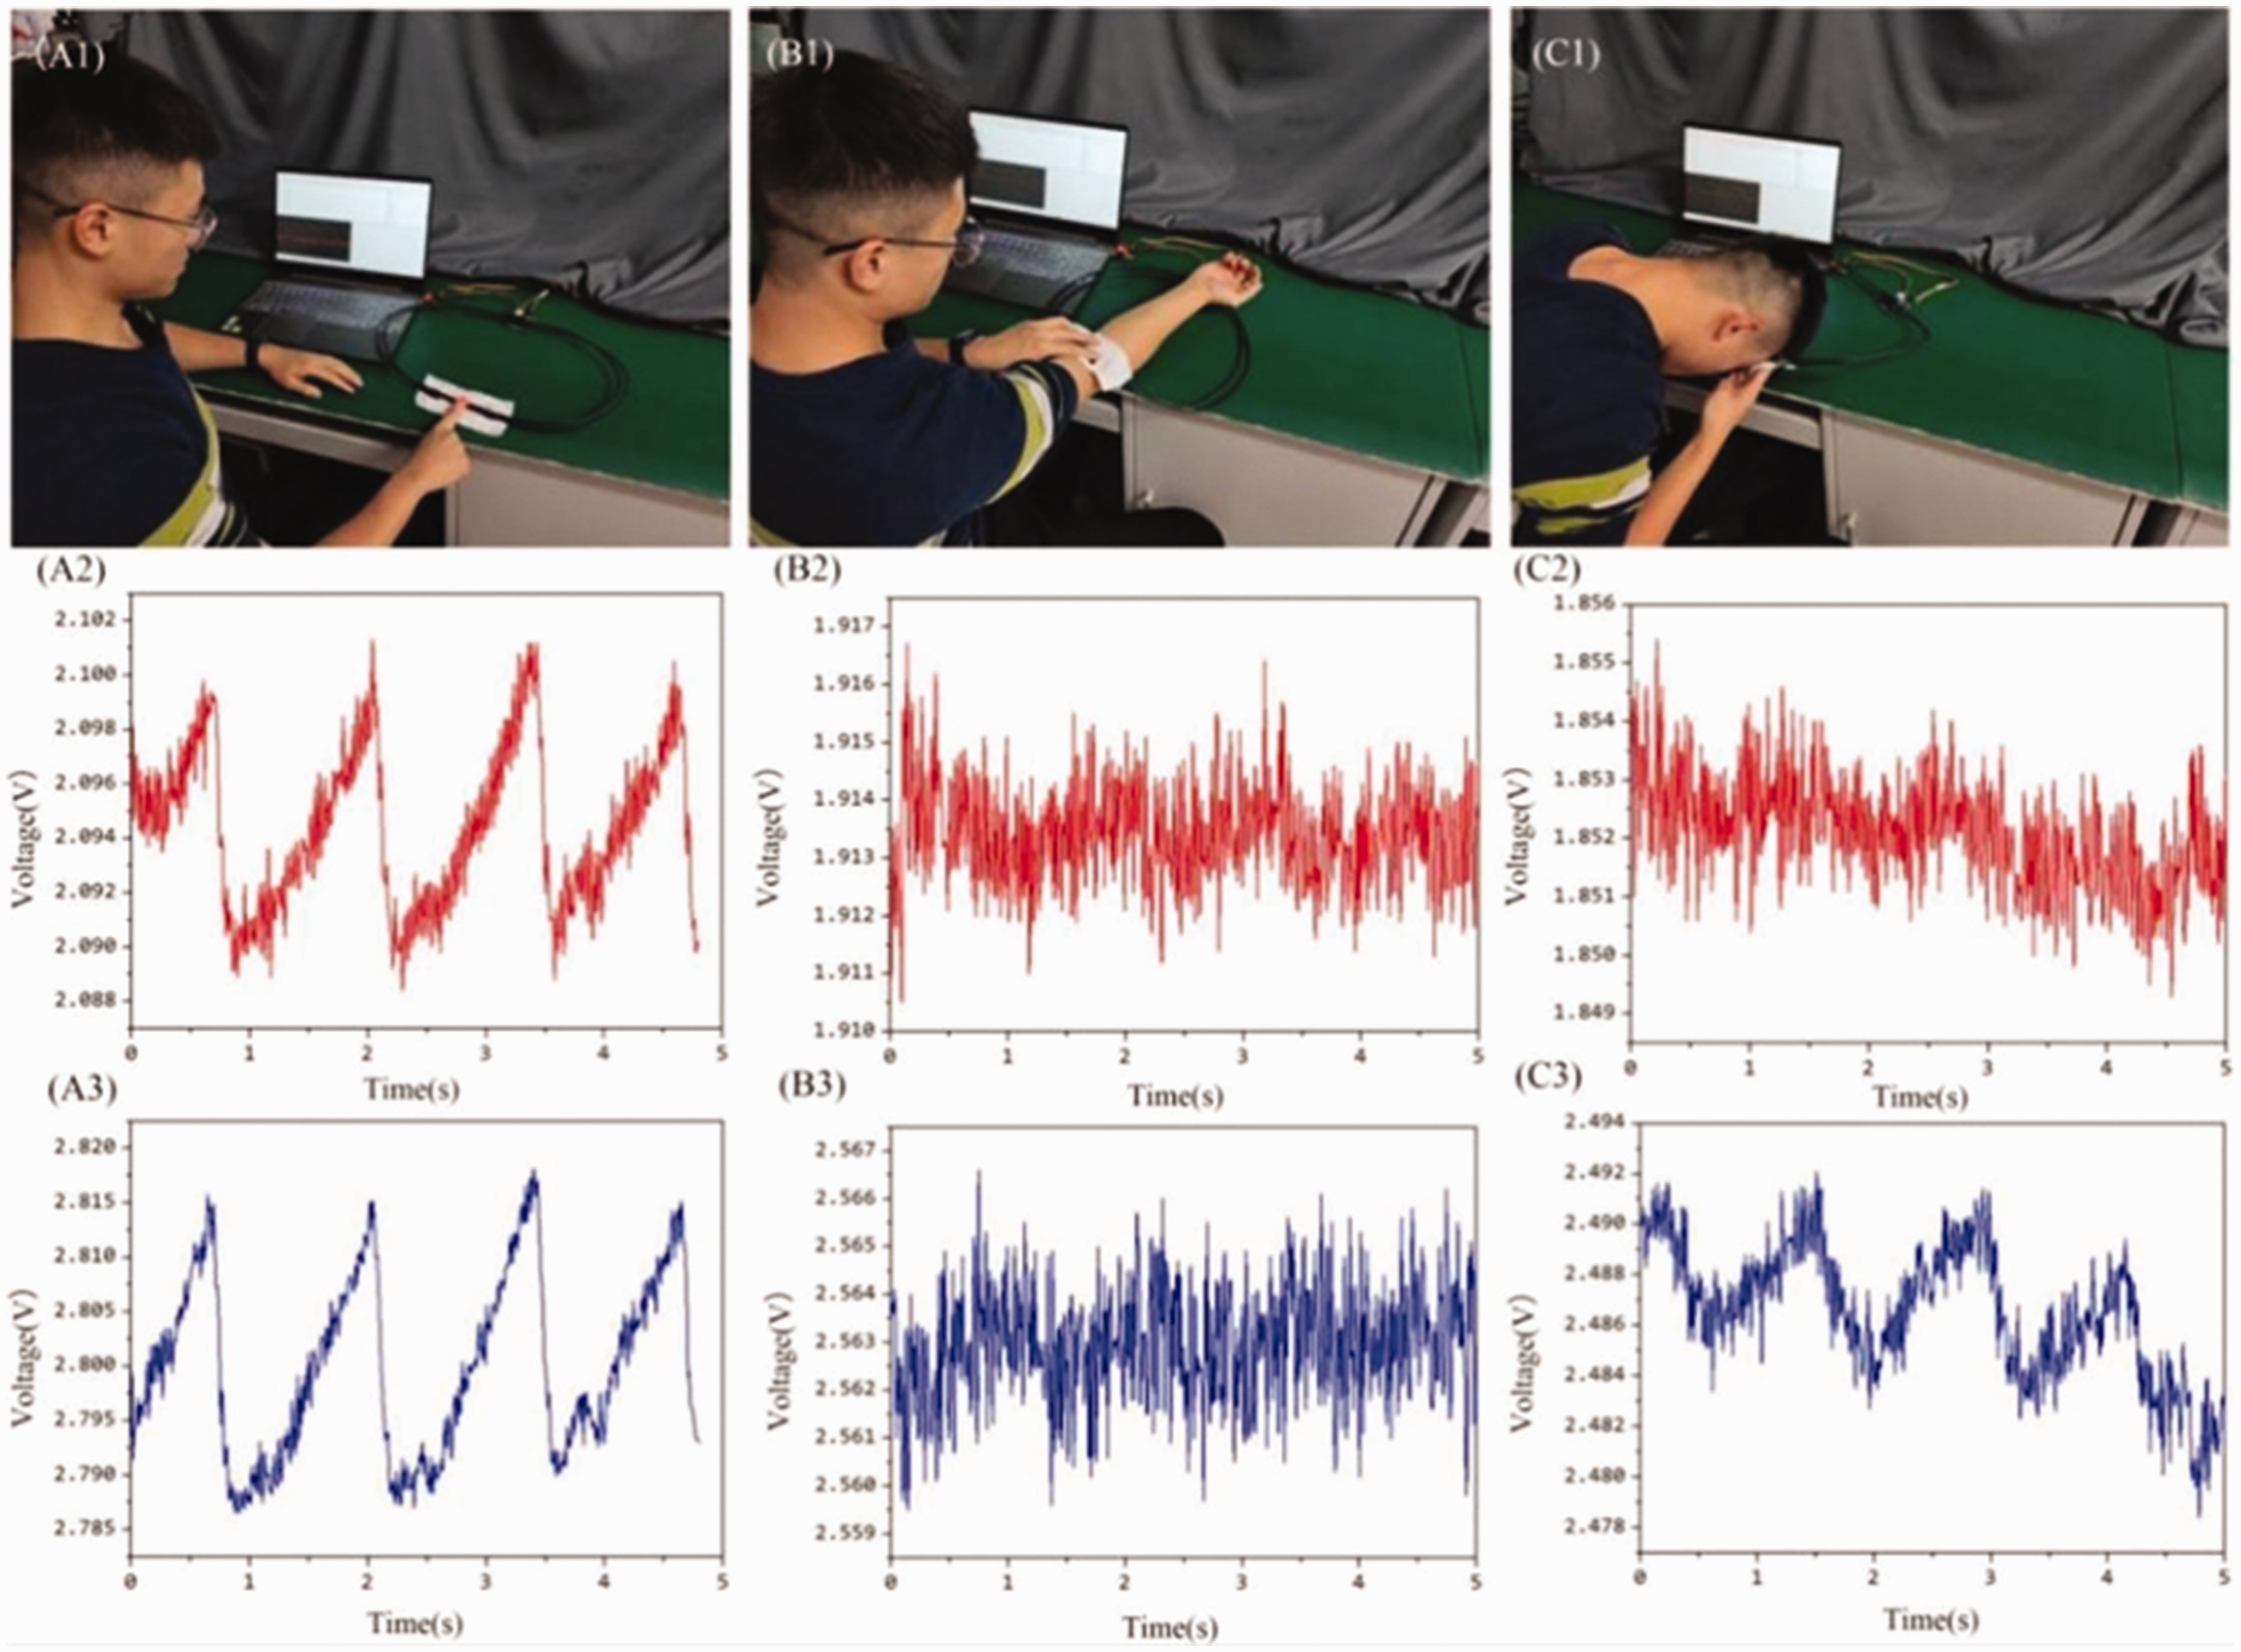
Pulse signals measurement in different body parts: (a1) polymer optical fiber fabric sensor for pulse and arterial oxygen saturation measurement (POF-PSFS) on the fingertip; (a2) the red light pulse wave on the fingertip; (a3) the infrared light pulse wave on the fingertip; (b1) POF-PSFS in the brachial artery; (b2) the red light pulse wave in the brachial artery; (b3) the infrared light pulse wave in the brachial artery; (c1) POF-PSFS on the forehead ophryon; (c2) the red light pulse wave on the forehead ophryon and (c3) the infrared light pulse wave on the forehead ophryon.
The pulse signals on the fingertip change obviously and the signal amplitude is large. This is because the blood vessels of the fingertip are close to the skin and rich in capillaries. Because there are more muscle tissues and bones in the brachial artery, more light is absorbed. The light intensity reflected into the skin is weak. Therefore, the waveforms of the red and infrared light signals are not very clear. The blood vessels on the forehead ophryon are also near to the skin, but there are more noises than that on the fingertip.
The results indicate that the POF-PSFS can measure the pulse signal of the fingertip and forehead. However, the fingertip is not convenient for long-term, real-time monitoring as it would affect finger movement. The pulse signals of the brachial artery are not effective. Hence, the forehead would act as the signal acquisition position for the POF-PSFS in combination with a hat or other clothing to conveniently achieve monitoring tasks.
Accuracy test of the sensor in different states
To evaluate the accuracy of the sensor, tests were carried out in the static, dynamic, and sweating states, respectively. The static test and dynamic test referred to Rothmaier et al., 16 Krehel et al., 17 Quandt et al., 18 and Ballaji et al. 19 The study of sweating as a transmission medium between the POF and the skin is to explore the impact on light transmission and accuracy. The POF-PSFS, sewn to the inside of a headband, was worn on the subject's forehead ophryon, and simultaneously the medical physiological monitor detector was on the fingertip.
Six healthy subjects with an average age of 24 years were divided into three groups for the static, dynamic, and sweating states (slight sweating test and profuse sweating test). Two subjects participated in each state. The tests were repeated three times for each subject in one state. Before the experiment, the subjects sat in silence for 3 minutes, and their mood remained basically stable during the test. Data acquisition started after the pulse signal was stable, and each signal acquisition time was 5 seconds. Two were statically tested. Two others nodded and shook their heads for the dynamic test. For the sweating test, firstly, the other two harvested the forehead signal in a dry state as a control experiment, and then the subjects performed the slight sweating test by short-term exercise and the profuse sweating test by long-term exercise.
Due to the burrs and unevenness of the unprocessed pulse signals, the acquired unprocessed signals need to be further processed in order to improve the calculation accuracy of the pulse and SpO2 monitoring. The pulse frequencies are concentrated between 1 and 3 Hz.23,27 A low-pass filter in the cut-off low-frequency (≤3 Hz) was applied to minimize burrs and unevenness for the unprocessed signals. Next, the preliminarily processed signals were smoothed, adopting average algorithms, where the signals were clear and smooth. The calculation accuracy of the pulse and SpO2 was suitable. After the signals were processed, collected data was used to calculate the pulse and SpO2.
Figure 7(a) shows the pulse and SpO2 measured by the POF-PSFS in the static, dynamic, dry, and sweating states. All pulse measurements were in the range of 60–80 bpm, which is in the pulse range of healthy adults (60–100 bpm). The SpO2 levels for all measurements were in the range of 97–100%, which is in the SpO2 range of healthy human beings (92–100%). 28

Tested data and error of the pulse and arterial oxygen saturation (SpO2) on the forehead in the static, dynamic, dry, slight, and profuse sweating states tested: (a) tested data of the polymer optical fiber fabric sensor for pulse and arterial oxygen saturation measurement (POF-PSFS) and (b) pulse and SpO2 error between the POF-PSFS and medical physiological monitor.
Figure 7(b) shows the pulse and SpO2 error between the POF-PSFS and medical physiological monitor in different states. The range of pulse error is from –2 to 2 bpm, and the maximum pulse error was 4 bpm. The SpO2 error is between –1% and 2%, and the maximum SpO2 error was 3%.
The average error and standard deviation in different states are shown in Table 3. It can be seen that the average error of the pulse was within 1 bpm and the average error of the SpO2 was within 2%. The standard deviation of the pulse was within 1 bpm, and that of the SpO2 was within 1%. Due to adopting the same principle of PPG for the pulse and SpO2 monitoring, the accuracies are similar to each other. 16 This indicated that the POF-PSFS was capable of monitoring the pulse and SpO2. The measurement in the static state was more accurate than that in the dynamic state. The reason is the motion artifact caused by body movement. The motion artifact interferes with the pulse signal, resulting in the measurement deviation of the pulse and SpO2.16,29,30 The average error and standard deviation of the slight and the profuse sweating states were similar. The average error of pulse in the dry state was superior to that in the sweating state, which might be due to the weak interference of sweat on the signal and the weak drift produced by the processed signal.
Average error and standard deviation of the pulse and arterial oxygen saturation (SpO2) in different states

Conclusions
In this paper, a POF-PSFS with the micro-bending bulge structure was designed based on side-emitting and side-coupling. To get satisfactory side-emitting and side-coupling efficiencies by the ray tracing method, a micro-bending bulge POF with the 3 mm height and the 1 mm width was adopted. The simulated POF exhibited optimal performance, which possessed high side-emitting efficiency (48%) and excellent side-coupling efficiency (22%). Three side-emitting POFs and two side-coupling POFs were alternately woven as weft yarns using the simplest plain weave, which was beneficial to keep the POFs stable in the fabric compared with 82-root POFs with the embroidery process. The raw pulse waveforms on the fingertip and forehead were clearer using the POF-PSFS compared with those of the brachial artery. For long-term, real-time monitoring, the forehead was preferred to monitor signals. It showed the capability to monitor the pulse and SpO2 in different states, such as static, dynamic, and sweating, and the average error was within 1 bpm for the pulse and within 2% for the SpO2. The error of the dynamic state and the sweating state was slightly larger than that of the static state. The superior side-coupling performance, five POFs, satisfactory comfort, and simple textile manufacturing process display are promising for industrialized-scale production. In the future there will be a challenge with the fiber diameter thinning and chip miniaturization to be overcome.
Footnotes
Declaration of conflicting interests
The author(s) declared no potential conflicts of interest with respect to the research, authorship, and/or publication of this article.
Funding
The author(s) disclosed receipt of the following financial support for the research, authorship, and/or publication of this article: This work was supported by the Tianjin Municipal Special Foundation for Key Cultivation of China (grant no. XB202007), the Enterprise Entrusted Projects (grant no. 2019-1200-24-001150), and the Tianjin Science and Technology Program (grant no. 20YDTPJC01380).