



Abstract
Arc explosion accidents in live working seriously threaten the safety of power workers. At present, the mainstream arc protective clothing material is aramid and blends of aramid. However, aramid will produce toxic gas under high temperature combustion, which is harmful to the health of operators. Therefore, it is a special challenge to study fabrics that are friendly to the human body and have a highly protective performance to protect electrical workers. Polyimide is nontoxic and has excellent high temperature resistance, flame retardation, and mechanical properties. In this paper, polyimide was proposed to be used as an arc protective clothing material. In order to explore the feasibility of polyimide in the field of arc protection, molecular dynamics simulation was used to compare the heat resistance of polyimide and aramid in terms of bond order and glass transition temperature. Referring to ASTM F1959 and IEC 61482-1-1, an arc test apparatus was built to test the protective properties of materials. The protection failure mechanism was analyzed by comparing the safety protective performance of polyimide and aramid fabric under the arc. It was found that polyimide has better arc thermal protective performance and break open threshold. The simulation and test results show that polyimide can be used as a material for arc protective clothing to improve protective performance.
Keywords
With the increasing incidence of live working, the probability of arc accidents continues to increase, posing a significant threat to the life safety of power staff.1,2 The electric arc is a gas discharge phenomenon accompanied by high temperature plasma and molecular clouds. With the continuous repulsive magnetic force generated by the current, the plasma cloud expands rapidly. This expansion, coupled with rapid temperature rise, can quickly produce explosive hazards.3–5 In many national, regional, and international standards, electrical safety involves important issues related to thermal hazards, especially the thermal hazards caused by arc flash accidents. 6 Both NFPA 70E 7 and IEEE Std 1584 8 describe arc thermal hazards and are used as references for many safety engineering programs as well as national, regional, and international regulations. Thermal hazards are generally considered the most significant hazards of arc flash accidents because the documented arc flash injuries are mainly burns.9,10 A survey showed that 20% of patients had burns due to arc flash events, of which 63% had second-degree burns and 37% had third-degree burns. 11
Although an arc event may last only a few cycles, it can have a lasting impact on people, including burns, tinnitus, psychological fear, and even death. 12 The relationship between skin heat absorption and human burn time is that when the skin is exposed to the incident energy of 1.2 cal/cm2 for a second, it will cause a second-degree burn to the body. 13 Arc safety protection measures should be carried out to provide a safe working environment for hazardous arc places. The most studied and used is wearing arc protective equipment.14–18
According to ASTM F1959 19 and IEC 61482-1-1 20 standards, the material of arc protective clothing should meet the characteristics of not melting and dripping in high temperatures or flames and will automatically extinguish when it is separated from the fire source. Currently, three types of materials are commonly used in arc protective clothing. The first is meta-aramid and blends of meta-aramid. Aramid is a polymer material with high temperature resistance, flame retardation, high strength, and high modulus, which is the mainstream arc protective clothing material in the market at present. The second is flame retardant (FR) treated cotton (FR cotton is most commonly blended with nylon), and the third is modacrylic and modacrylic blends. In addition, other types of materials include para-aramid blends, PBI/Kevlar blends, etc. 21 The arc protective clothing products on the market mainly include Nomex and Protera from DuPont, Glenguard Hi-Vis from Glen Raven, Tecasafe from TenCate, and other products, such as Indura UltraSoft, Kermel/Lenzing.
Scholars have investigated the theory and testing of arc protective materials in recent years. Li et al. 22 studied the arc protection mechanism of aramid fabrics by testing and analyzing aramid fabrics treated with different incident energy arcs. It provides a good understanding of how fabrics respond to protection in an arc event. In terms of studying the influence of material parameters on arc protective performance, Zhu et al. 23 used meta-aramid fiber, FR viscose fiber, para-aramid fiber, and conductive fiber as primary materials to make blended fabrics with different proportions and predicted the protective performance using mathematical models. Hoagland and Morrow 24 found that compared with conventional meta-aramid fabrics, neoprene/meta-aramid fabrics and PVC/meta-aramid/para-aramid blended fabrics have better arc protective performance, but their costs have also increased. In addition, Hoagland et al. 25 studied the effects of industry contaminants, including diesel fuel, dry lime, nickel dust, palladium dust, sodium hydroxide slurry, carbon black dust, dry and wet cement, a flocculent slime, hydraulic fluid, and transformer oil on the performance of electric arc clothing. The results showed that wet pollution would reduce the protective performance of arc protection FR clothing, while dry pollution had little effect. Klausing and Hoagland 26 systematically studied the influence of sweat on the protective performance of arc protective fabrics. The results showed that the arc rating decreases with the addition of moisture, and the influence of sweat on single-layer and multi-layer fabrics are not significantly different. For the characterization methods of materials, molecular dynamics simulation is often used for polymer simulation and parameter prediction. The flame retardation and arc resistance of the material are verified by the combustion test and arc test.
Polyimide is a polymer material with an imide ring in the main chain. polyimide polymers are used in electronics, aerospace, and the medical industry due to their excellent properties, such as good thermal insulation and excellent flame retardation, high temperature resistance, 500°C degradation temperature, high limited oxygenation index, 27 high mechanical strength, electrical insulation, and nontoxic. Compared with aramid fiber, polyimide does not produce toxic gas when burning at high temperatures, which is harmless to the human body. After carbonization, the fiber expands to block heat transmission to the human body. Currently, polyimide FR fabric has been developed and applied in the field of fire safety clothing in the textile field. 27 Polyimide used in the field of arc protective clothing can give full play to its high temperature resistance, flame retardation, high strength, and nontoxic properties. It is of great practical significance to study the arc resistance of polyimide.
In this paper, the molecular structure of polyimide and aramid was modeled. The stability and heat resistance of the two materials were compared and analyzed by simulating the molecular bond order and glass transition temperature. The bond order corresponds to the strength of the chemical bond, which represents the stability of the molecule. The glass transition temperature reflects the heat resistance of the material to a certain extent. The reason of influencing glass transition temperature was explained by energy analysis and cohesive energy density (CED). The arc platform was built to test the arc protective properties of the two materials. The simulation and test results showed that both materials could protect the human body from second-degree burns under electric arc explosion. Polyimide material is better than aramid in thermal protection performance and rupture performance, which shows that polyimide material is feasible in the field of arc protection. The results of this study can provide a theoretical reference for the application of polyimide material in power system safety protection.
Molecular dynamics simulation
Traditional experimental studies consume a lot of resources and time, while it takes much less time and cost to study the properties of polymers by molecular simulation technology. In general, the study of material properties is a typical multiscale problem, involving microscopic, mesoscopic, and macroscopic structures. Many factors, such as temperature field and force field should be considered. It is difficult to clarify the influence of each specific factor through experimental methods. Therefore, many researchers have used the molecular dynamics method to predict and explain the properties of materials at multiple levels, such as atomic, molecular, and even polymer condensed states.28–31 The microstructure, interface characteristics, and performance improvement of different composite materials have also been studied.32–34
In this section, we used molecular dynamics to model the molecular structure of arc protective material. The stability of molecular chains of polyimide and aramid materials under temperature changes was studied and compared from the point of view of bond order and glass transition temperature.
Molecular models
Kapton film produced by DuPont is one of the earliest products of polyimide, which has excellent high temperature resistance and flame retardation. Kapton film is made by condensation polymerization of pyromellitic dianhydride (PMDA) and 4, 4′-oxydianiline (ODA) in the polar solvent. 35 In the field of polyimide fiber, the Aoshen Company in China synthesized a precursor solution with PMDA and ODA as monomers, prepared precursor fiber by dry spinning technology, and prepared polyimide fiber by the thermal cycling process 36 (the polyimide fiber used in this paper). Therefore, this section used the PMDA-ODA chemical structure of polyimide to model. The most typical structure of aramid chemical is the meta-aramid structure and para-aramid structure. Currently, aramid 1313 (meta-aramid) is mostly used in the field of fire and arc prevention. Therefore, it is more practical to select the meta-aramid structure for aramid molecular modeling. The molecular formula structures of polyimide and aramid are shown in Figure 1. Based on the molecular structure, the three-dimensional models of the two molecules were established using the Materials Studio software, as shown in Figure 2.
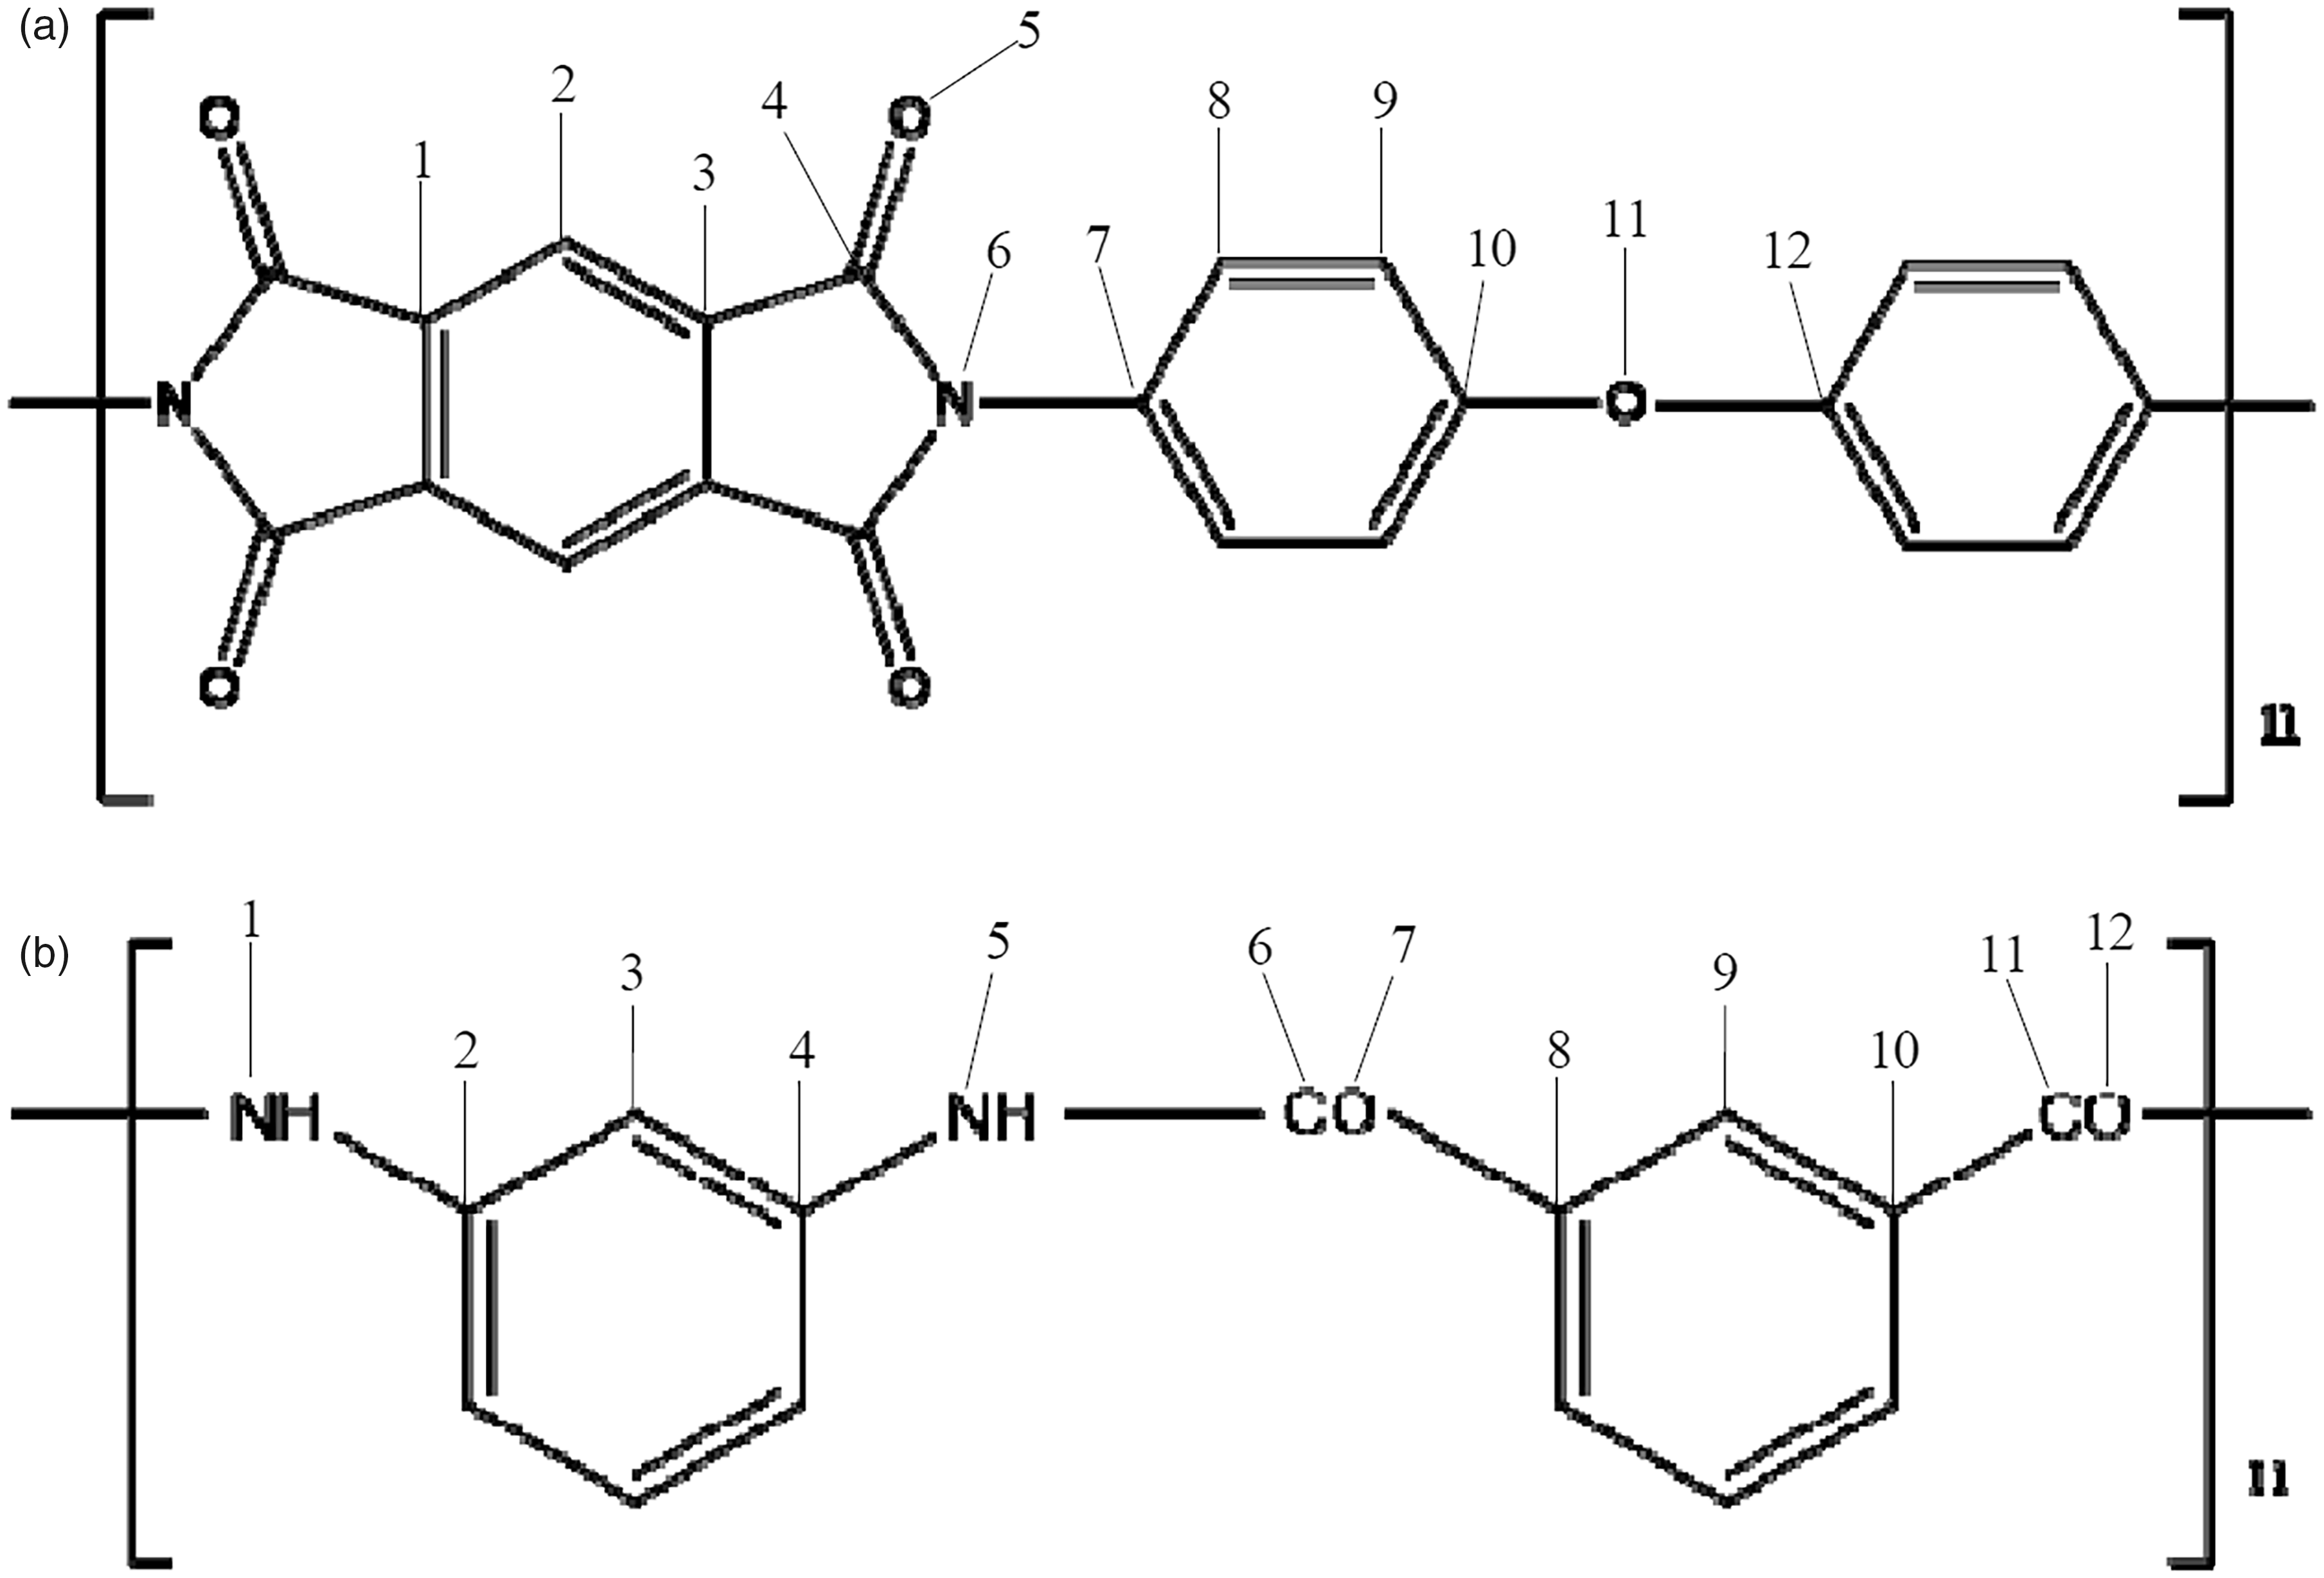
Molecular formula structures of polyimide and aramid (a) polyimide and (b) aramid.
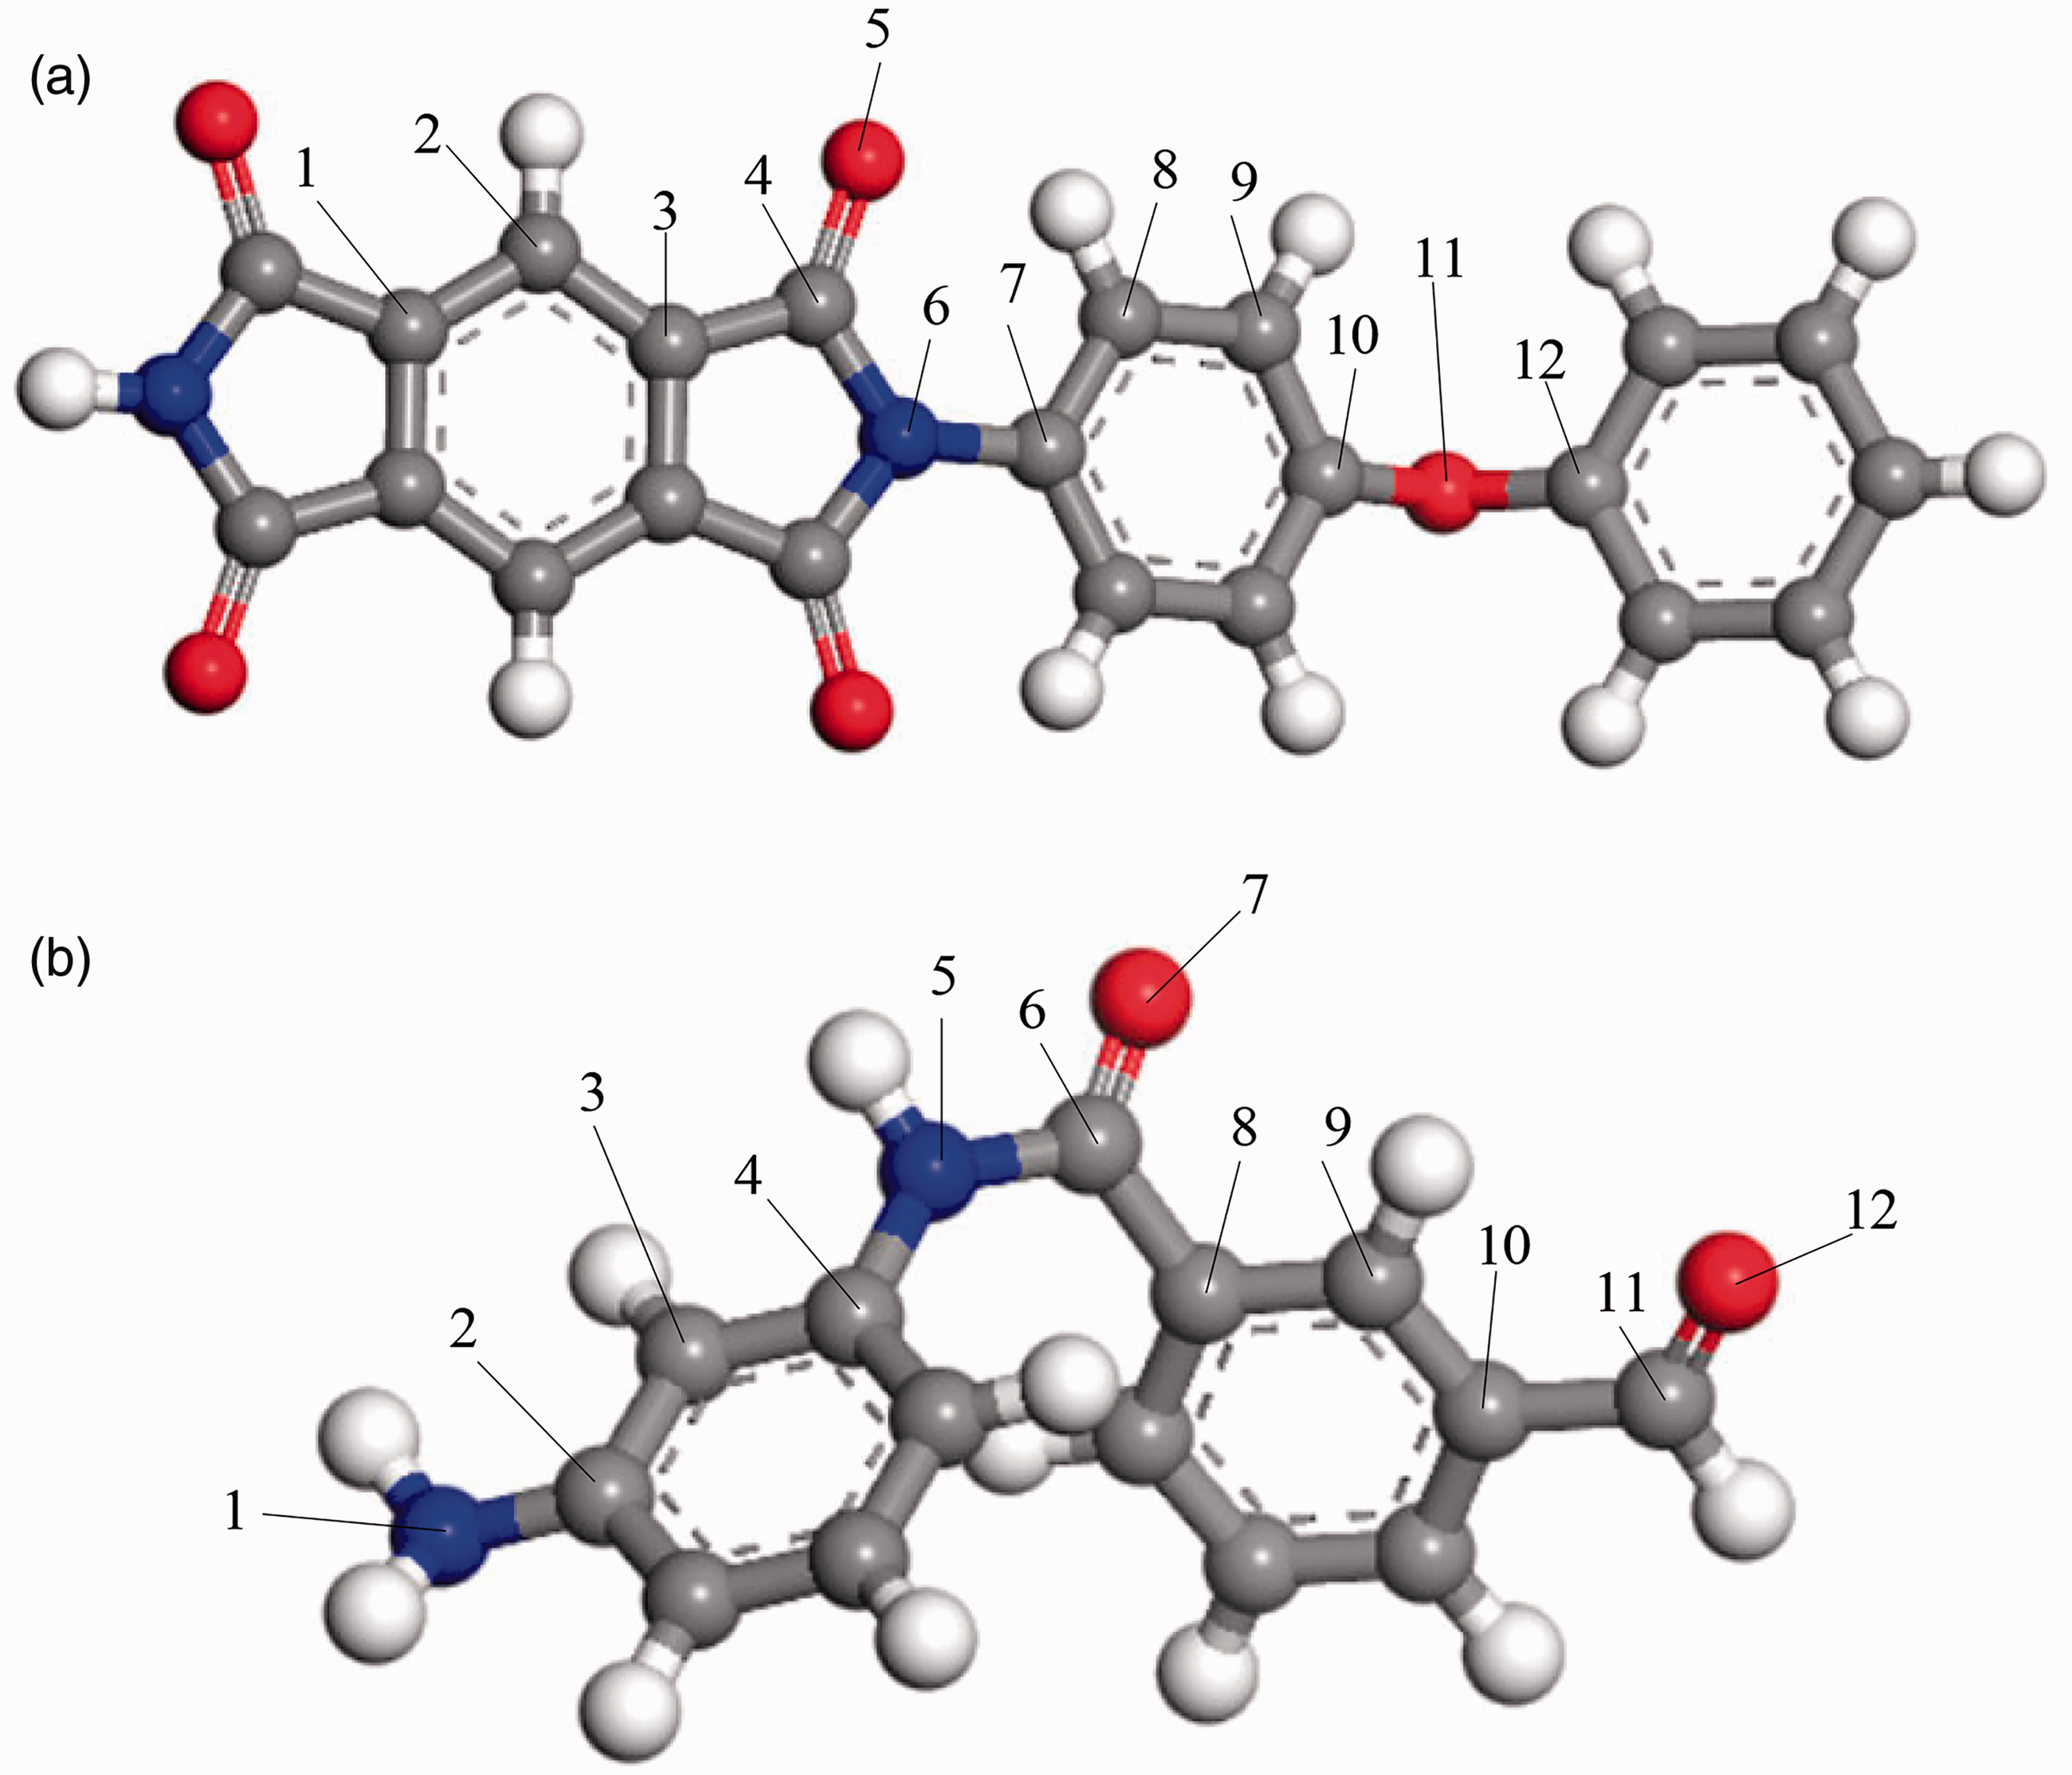
The three-dimensional models of the two molecules (a) polyimide and (b) aramid.
Bond order analysis
In molecular orbital theory, bond order is introduced as a parameter to measure the strength of the chemical bond, which refers to the overlapping degree of chemical bond formed by bonding two atoms. The greater the degree of overlap, the lower the energy of the combined molecular orbital and the stronger the chemical bond formed. For diatomic molecules, the bond order is calculated by half of the difference between the number of bonding electrons and the number of antibonding electrons. When forming covalent bonds, bonding electrons reduce the energy of the system, which is conducive to the formation of stable bonds, while antibonding electrons increase the energy of the system, which is not conducive to the formation of stable bonds. Therefore, a large bond order means that the more bonding electrons, the more stable the chemical bond. In summary, the bond order of a chemical bond represents the bond strength between adjacent atoms in a molecule, and it is a parameter to measure the relative strength of a chemical bond. The higher the bond order, the stronger the chemical bond, the more stable the bond, and the lower the bond order, the easier the chemical bond will break. The bond order parameters of polyimide and aramid molecules were calculated in the DMol3 module by using density functional theory, as shown in Table 1.
Molecular bond order of polyimide and aramid
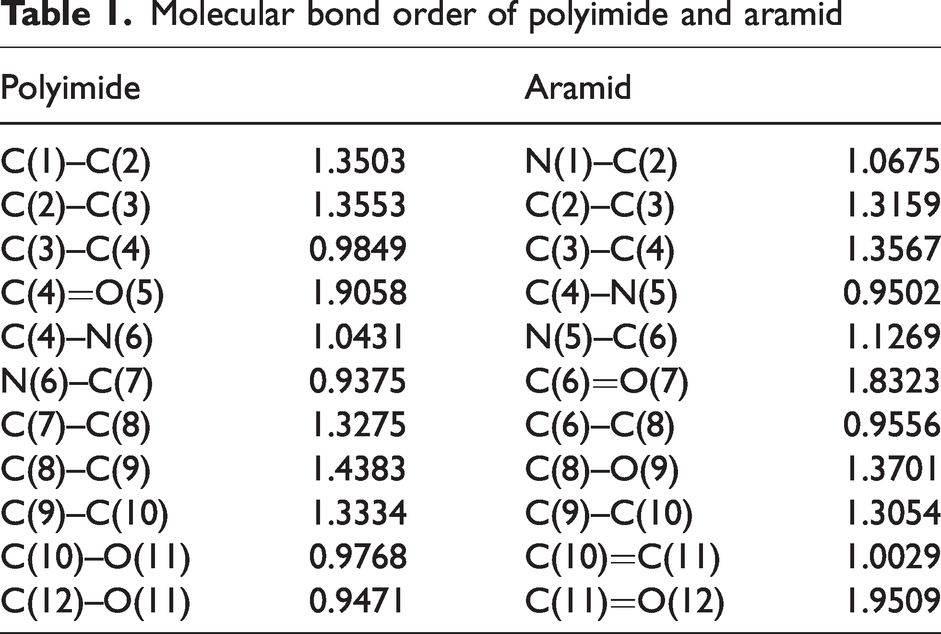
Through the chemical bond energy level comparison of the two molecules in Table 1, it can be found that the C–N bond of the imide ring in the polyimide, the C–N bond connecting the imide to the aromatic ether, the C–C bond in the connection between the imide structure and the benzene ring, and the C–O bond between the benzene ring and the oxygen atom in the aromatic ether bond have low bond order, those chemical bonds would break first at high temperatures. The C–N bond and C–C bond connecting the amide bond and the benzene ring in the meta-aramid and the C–N bond of the amide bond itself were of lower bond level and were prone to breakage. The C=O double bond in polyimide and aramid and the C–C bond of the benzene ring were higher in bond order, the chemical bond was more stable, and it was not easy to rupture. Moreover, due to the high content of C=O in polyimide molecules, the bond order was generally greater than that of aramid, so polyimide requires higher energy to break the chemical bond, it has higher thermal stability and high temperature resistance.
Glass transition temperature
Generally speaking, the glass transition temperature is the upper limit of the temperature at which amorphous plastics can theoretically work. Beyond the glass transition temperature, plastic basically loses its mechanical properties, and many other properties will drop sharply. From the molecular level, the glass transition temperature is the characteristic temperature of the amorphous region of polymers from frozen state to relaxation. When the temperature of the polymer is below the glass transition temperature, the molecular chains and segments in the material cannot move at will, and the polymer macroscopically shows a glass state. At this time, only atoms or groups can vibrate at the equilibrium position. When the polymer temperature is above the glass transition temperature, although the internal molecular chain of the material cannot move at will, the chain segment can move, and the polymer macroscopically shows high elasticity. As the temperature continues to rise, the whole molecular chain can move and the material shows viscous flow characteristics macroscopically. Therefore, the glass transition temperature is also the initial temperature at which the molecular chain of the material begins to move.
For arc protection materials, on the basis of ensuring flame retardation, materials with high glass transition temperatures should be selected to ensure that the physical and mechanical properties of the materials will not change.
According to the principle of the group contribution method, some simple aspects of the chemical composition structure are identical to the whole in many different molecules. Therefore, following this principle, it is possible to predict various properties of polymers by studying the repeat units of the polymers.
The molecular properties of both molecules were explored by using repeat units to construct polymer cells.
Taking polyimide as an example, the simulation process of its glass transition temperature was described as follows:
The polyimide molecular repeat unit was selected to construct the molecular chain. The longer the molecular chain, the higher the degree of polymerization, and the more consistent with the real situation. However, too long a molecular chain would lead to a large amount of calculation and long terminal relaxation time, resulting in the system not reaching the equilibrium state, so it was finally decided to construct a molecular chain with a length of 15 repeat units. Then the constructed molecular chain was optimized to make the structural energy and configuration of the molecular chain most reasonable. The initial amorphous polyimide cell was constructed by using a polyimide molecular chain under the amorphcus module, and the force field was selected as COMPASS. The structure of the initial amorphous cell was optimized, and the smart algorithm was used for molecular dynamics optimization. The polyimide cell was annealed for five cycles in the temperature range of 300–700 K. The optimized and annealed polyimide cell was simulated by molecular dynamics. The simulation temperature was from 400 K to 1000 K in intervals of 100 K. The simulation time for each process was 100 ps with a step at 1 fs. Each process was first equilibrated once by a canonical ensemble, and then the cell volume was compressed using a isothermal-isobaric ensemble to raise the density to equilibrium. After molecular dynamics simulation, the cell density of polyimide at each temperature was calculated.
The glass transition temperature of the aramid molecule was simulated with reference to the polyimide.
The specific volume versus temperature curve can be obtained by counting the cell density at different temperatures, as shown in Figure 3. The free volume theory states that under the glass transition temperature, the material is in the frozen glass state, with larger density and smaller specific volume. When it is above the glass transition temperature, the volume expands with the temperature rise, the density becomes smaller, and the specific volume becomes larger. The increase of the specific volume is not obvious below the glass transition temperature. With the increasing temperature, kinks will occur in the curve between the specific volume and temperature, and its position determines the glass transition temperature. A first rough estimate of the kink position is obtained by visual inspection of the data points. The polyimide was between 650 K and 750 K, and the aramid was between 500 K and 600 K. This estimate fits each set of data to a straight line through linear regression. The final value of the glass transition temperature results from the intersection of these two lines. 37
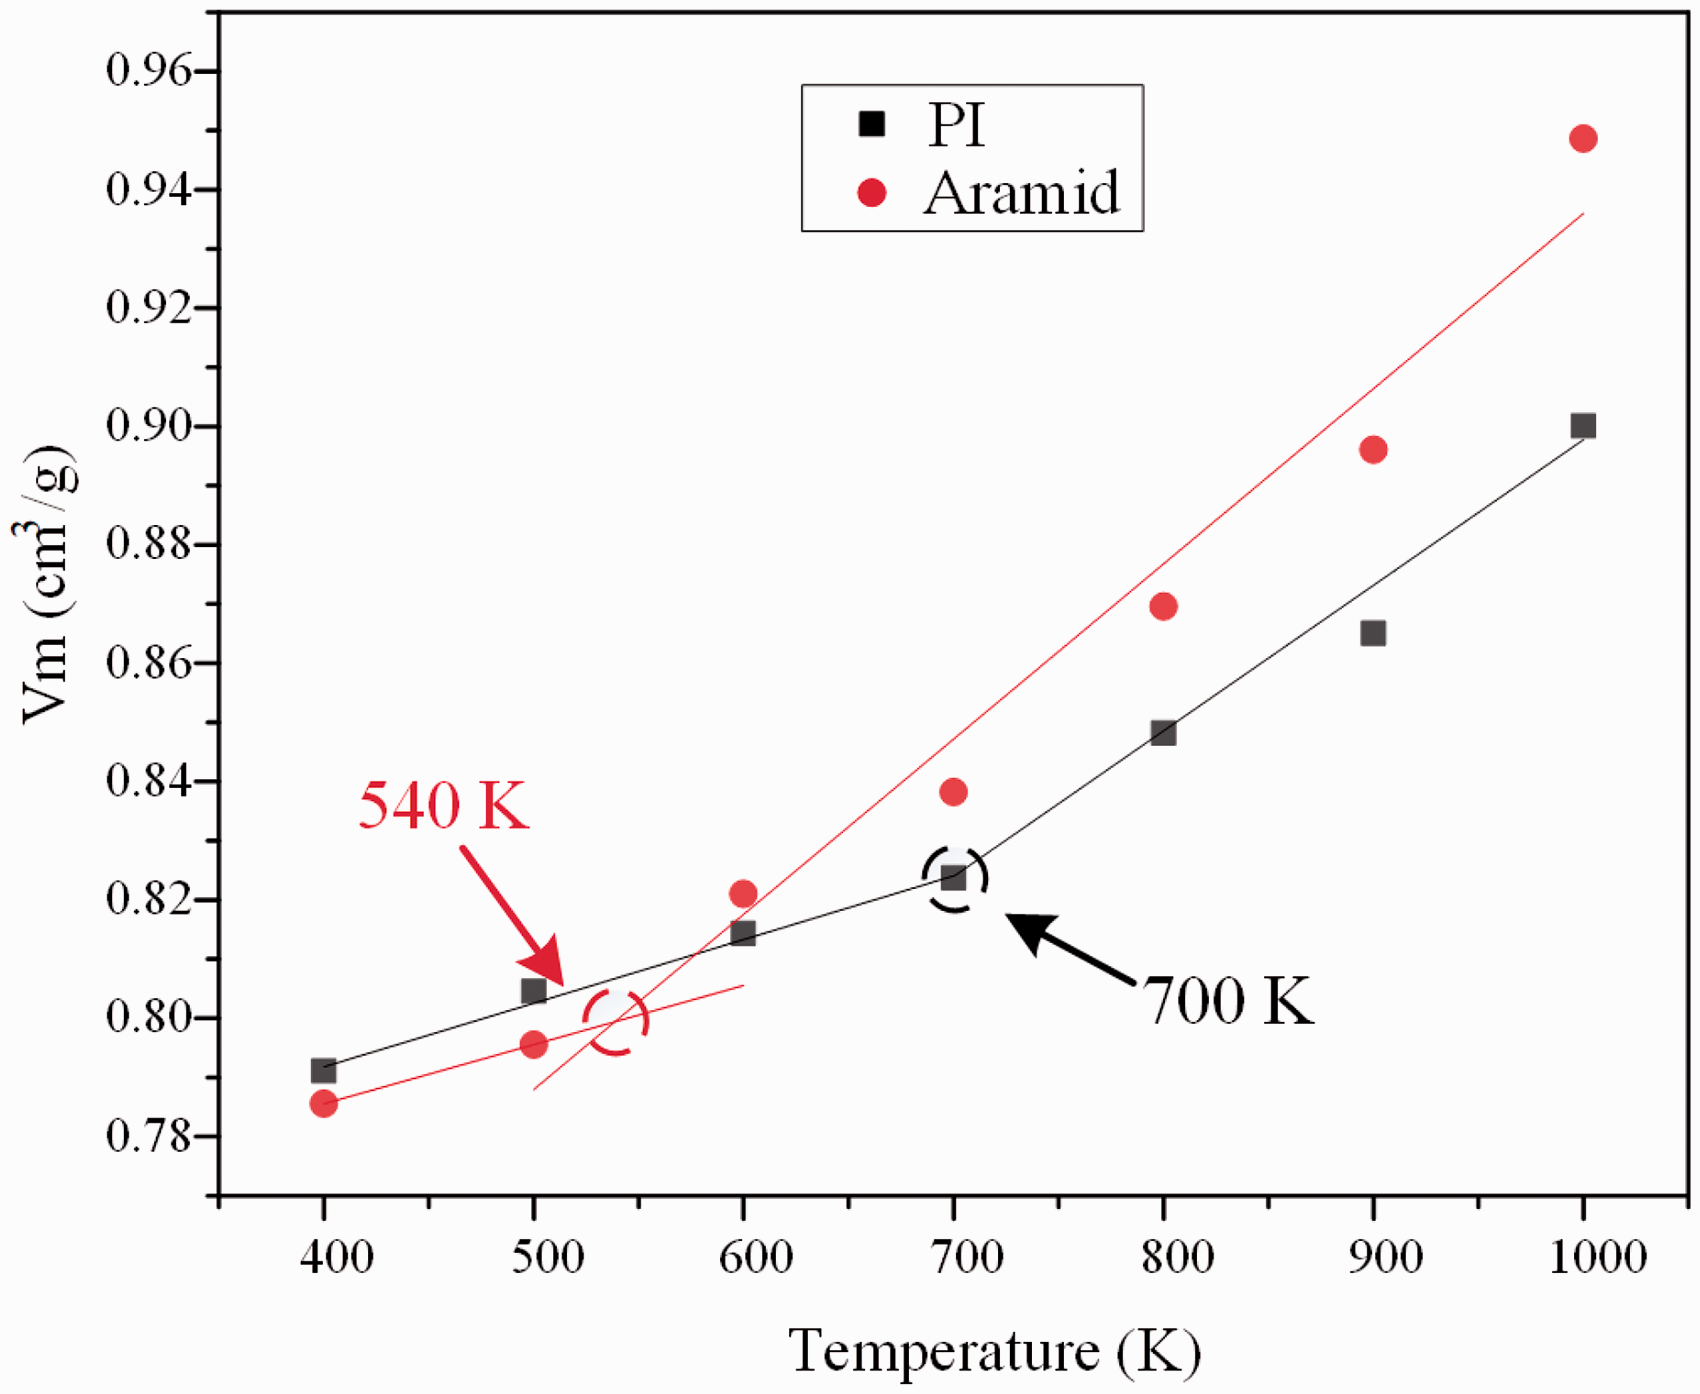
Specific volume versus temperature curve.
In Figure 3, the molecular density of polyimide at the initial temperature was less than that of aramid, which was consistent with the known polyimide density of 1.26–1.3 g/cm3 and the aramid molecular density of 1.33–1.4 g/cm3. Due to the influence of the cooling rate, the simulated glass transition temperature will be greater than the actual value. 38 The faster the cooling rate, the greater is the glass transition temperature. The glass transition temperature of the polyimide molecule in this study was 700 K, which is consistent with the values in the existing literature, 39 indicating that the molecular model and the glass transition temperature procedure are correct. Under this operation, the glass transition temperature of the aramid molecule was 540 K. From the perspective of molecular motion, the motion threshold of the polyimide molecular chain is higher, which can keep the molecular structure unchanged at higher temperatures, and the molecular chain has better rigidity. Compared with aramid, polyimide has higher heat resistance in the face of arc or flame and can keep the physical properties of the material unchanged.
Changes of energy and force during glass transition
With the temperature increasing, the internal energy and intermolecular force of polymer material will change. The change of energy and force not only affects the heat resistance and stability of the material but also affects the glass transition temperature. Therefore, studying the changes in energy components and force can provide a theoretical basis for explaining the glass transition temperature of the material and comparing the heat resistance of the material.
Energy component change analysis
Molecular mechanics determines that the total energy of the system can be expressed as the sum of several independent energy terms. To explore the energy changes of various parts of the system during the glass transition of the material, the energy values of various parts of the system at different temperatures were counted. Under the compass force field, the total potential energy of the system can be expressed by equation (1):

Figure 4 shows the changes of bond potential energy components of the two materials at different temperatures during the glass transition process. It can be seen that the bond stretching energy, angular bending energy, dihedral torsion energy, and inversion energy of polyimide and aramid molecules increase linearly with the increase of temperature. Because with the increasing temperature, the vibration of atoms in the molecular chain was enhanced, resulting in the stretching and rotation of chemical bonds between atoms. At the same time, owing to the relative molecular weight of polyimide being greater than that of aramid, the molecular chain of polyimide was longer, which increases the bond potential energy of molecules to a certain extent, so polyimide was greater than aramid in all energy components. It can be seen that the largest potential energy in the polyimide molecule was the bond angle energy, while in aramid it was the bond expansion energy. This is because the polyimide molecular chain in Figure 1(a) contains aromatic ether bonds, and the C–O bond between the oxygen atom and the connected benzene ring was easy to deflect, forming a bond angle, and the angle will deflect in the process of temperature rise. In the aramid molecule, the benzene ring was connected by the amide bond, which did not cause a large bond angle deflection, but increased the stretch of the chemical bonds.
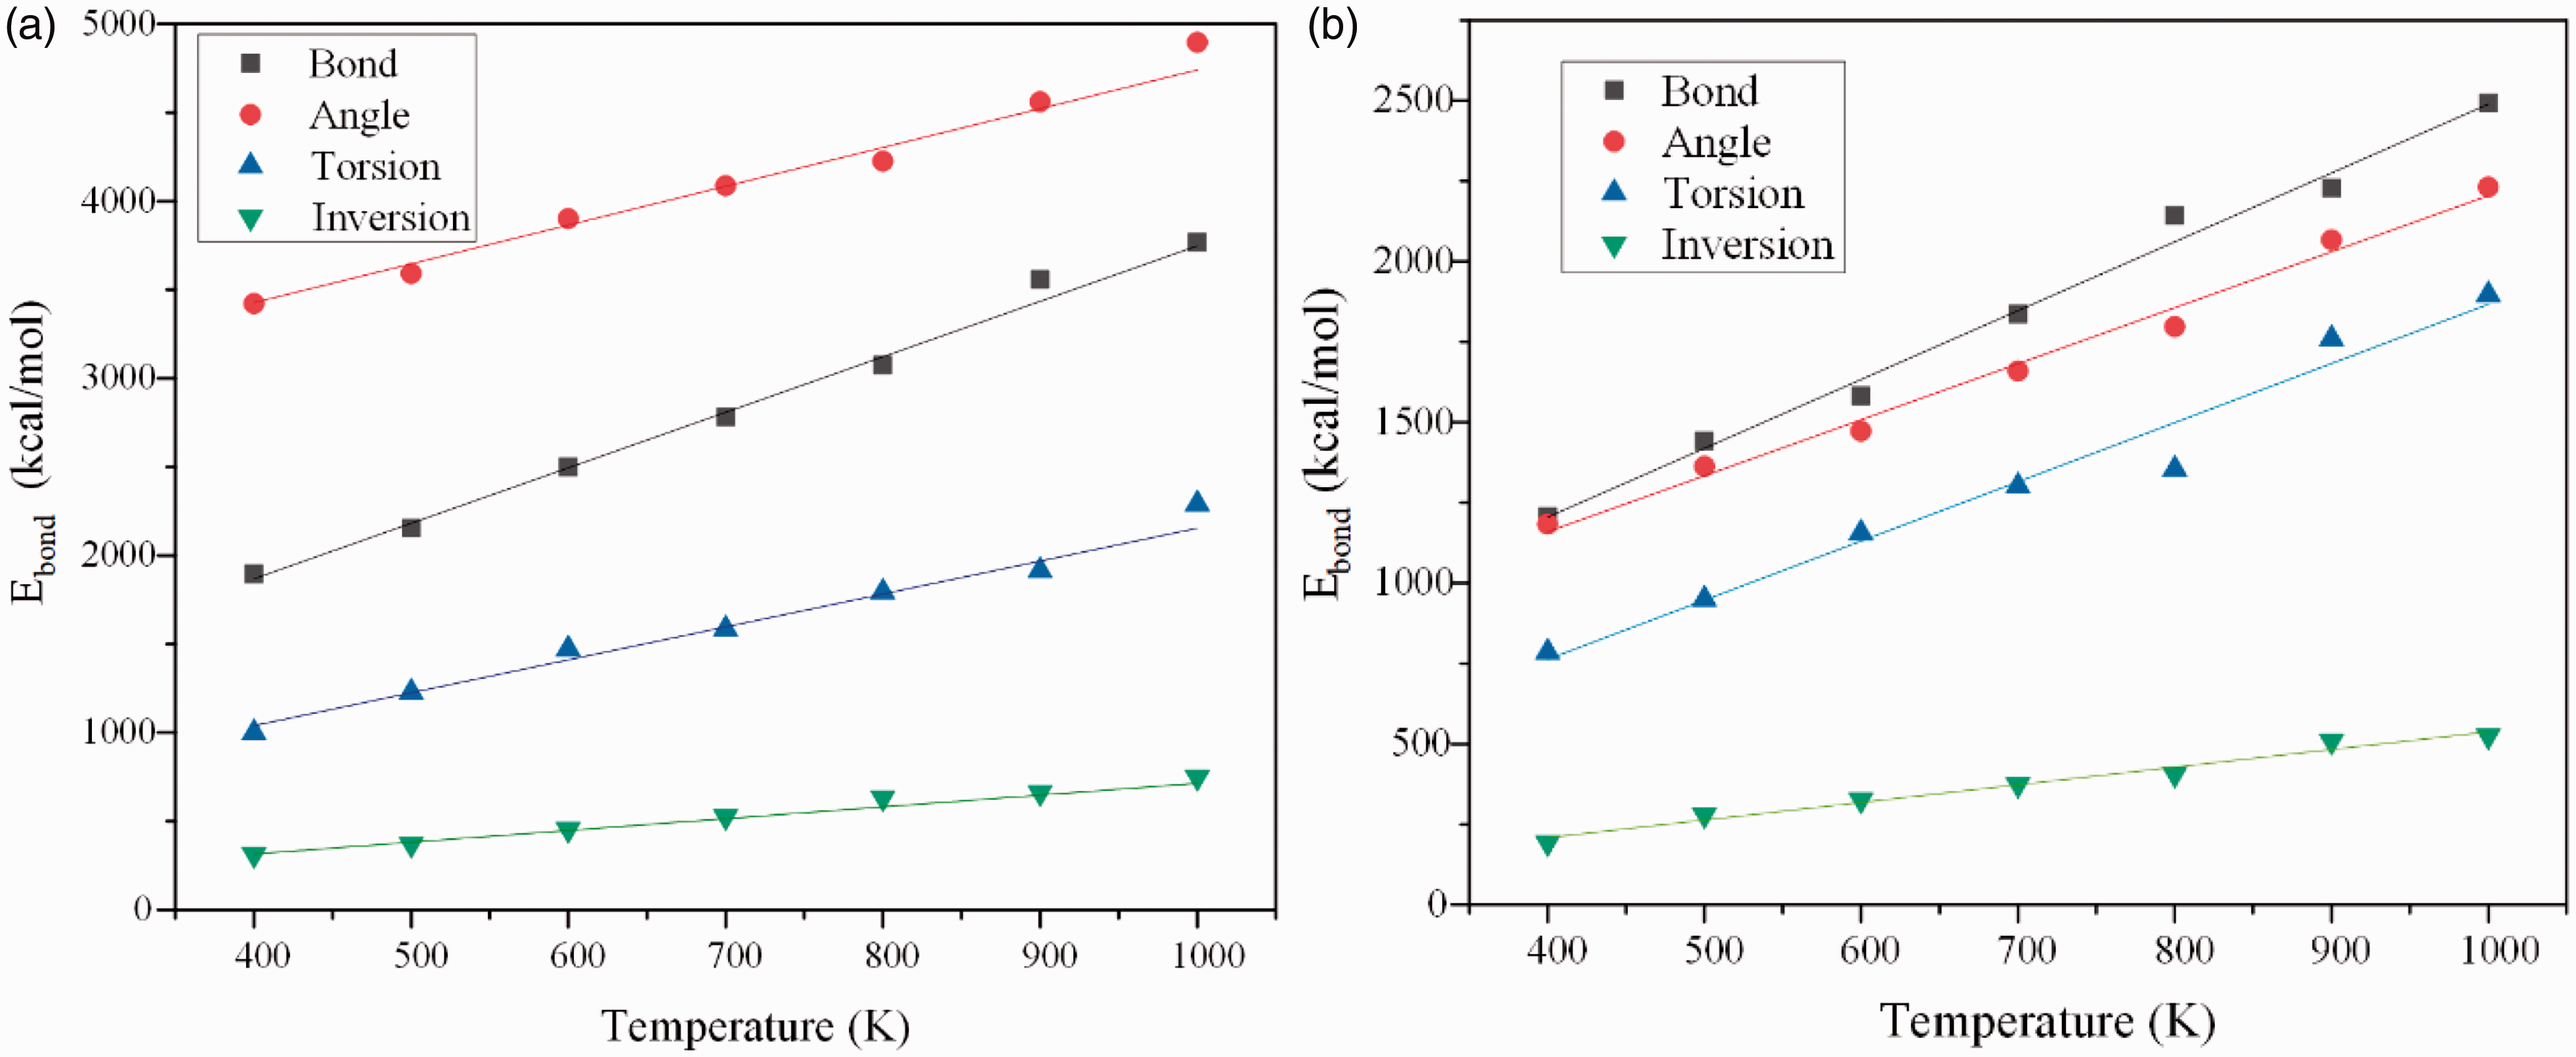
Bond potential energy changes of two materials at different temperatures: (a) polyimide and (b) aramid.
Figure 5 shows the change of nonbond potential energy of the two materials at different temperatures during the glass transition. In the process of calculating the nonbond energy, the cut-off value was set to 1.25 nm, which was less than half of the cell length (during the glass transition, the cell length was maintained at about 2.8–3.5 nm). It can be seen that the change trend of the nonbond interaction energy of polyimide and aramid was similar to the glass transition temperature, indicating that nonbond energy plays an important role in the glass transition process of polymers. By comparison, it was found that the maximum nonbond energy of polyimide was 6063.9 kcal/mol (negative value, the negative sign indicates the direction of the force, the attractive force is negative, and the repulsive force is positive), and the maximum nonbond energy of aramid was 4954.9 kcal/mol. Nonbond potential energy is the product of intramolecular nonbond force and displacement. The nonbond energy is mainly related to the nonbond force because the bond length and molecular volume limit the atomic displacement. The nonbond energy of polyimide was greater than that of aramid, which means that the nonbond force in the polyimide molecule is larger and the molecule is more stable. As the temperature increases, the motion range of the atoms increases, the atoms get closer together, the attractive force gradually decreases, the repulsive force increases continuously, the force slowly converts to a positive value, and the nonbond energy also converts to a positive value.
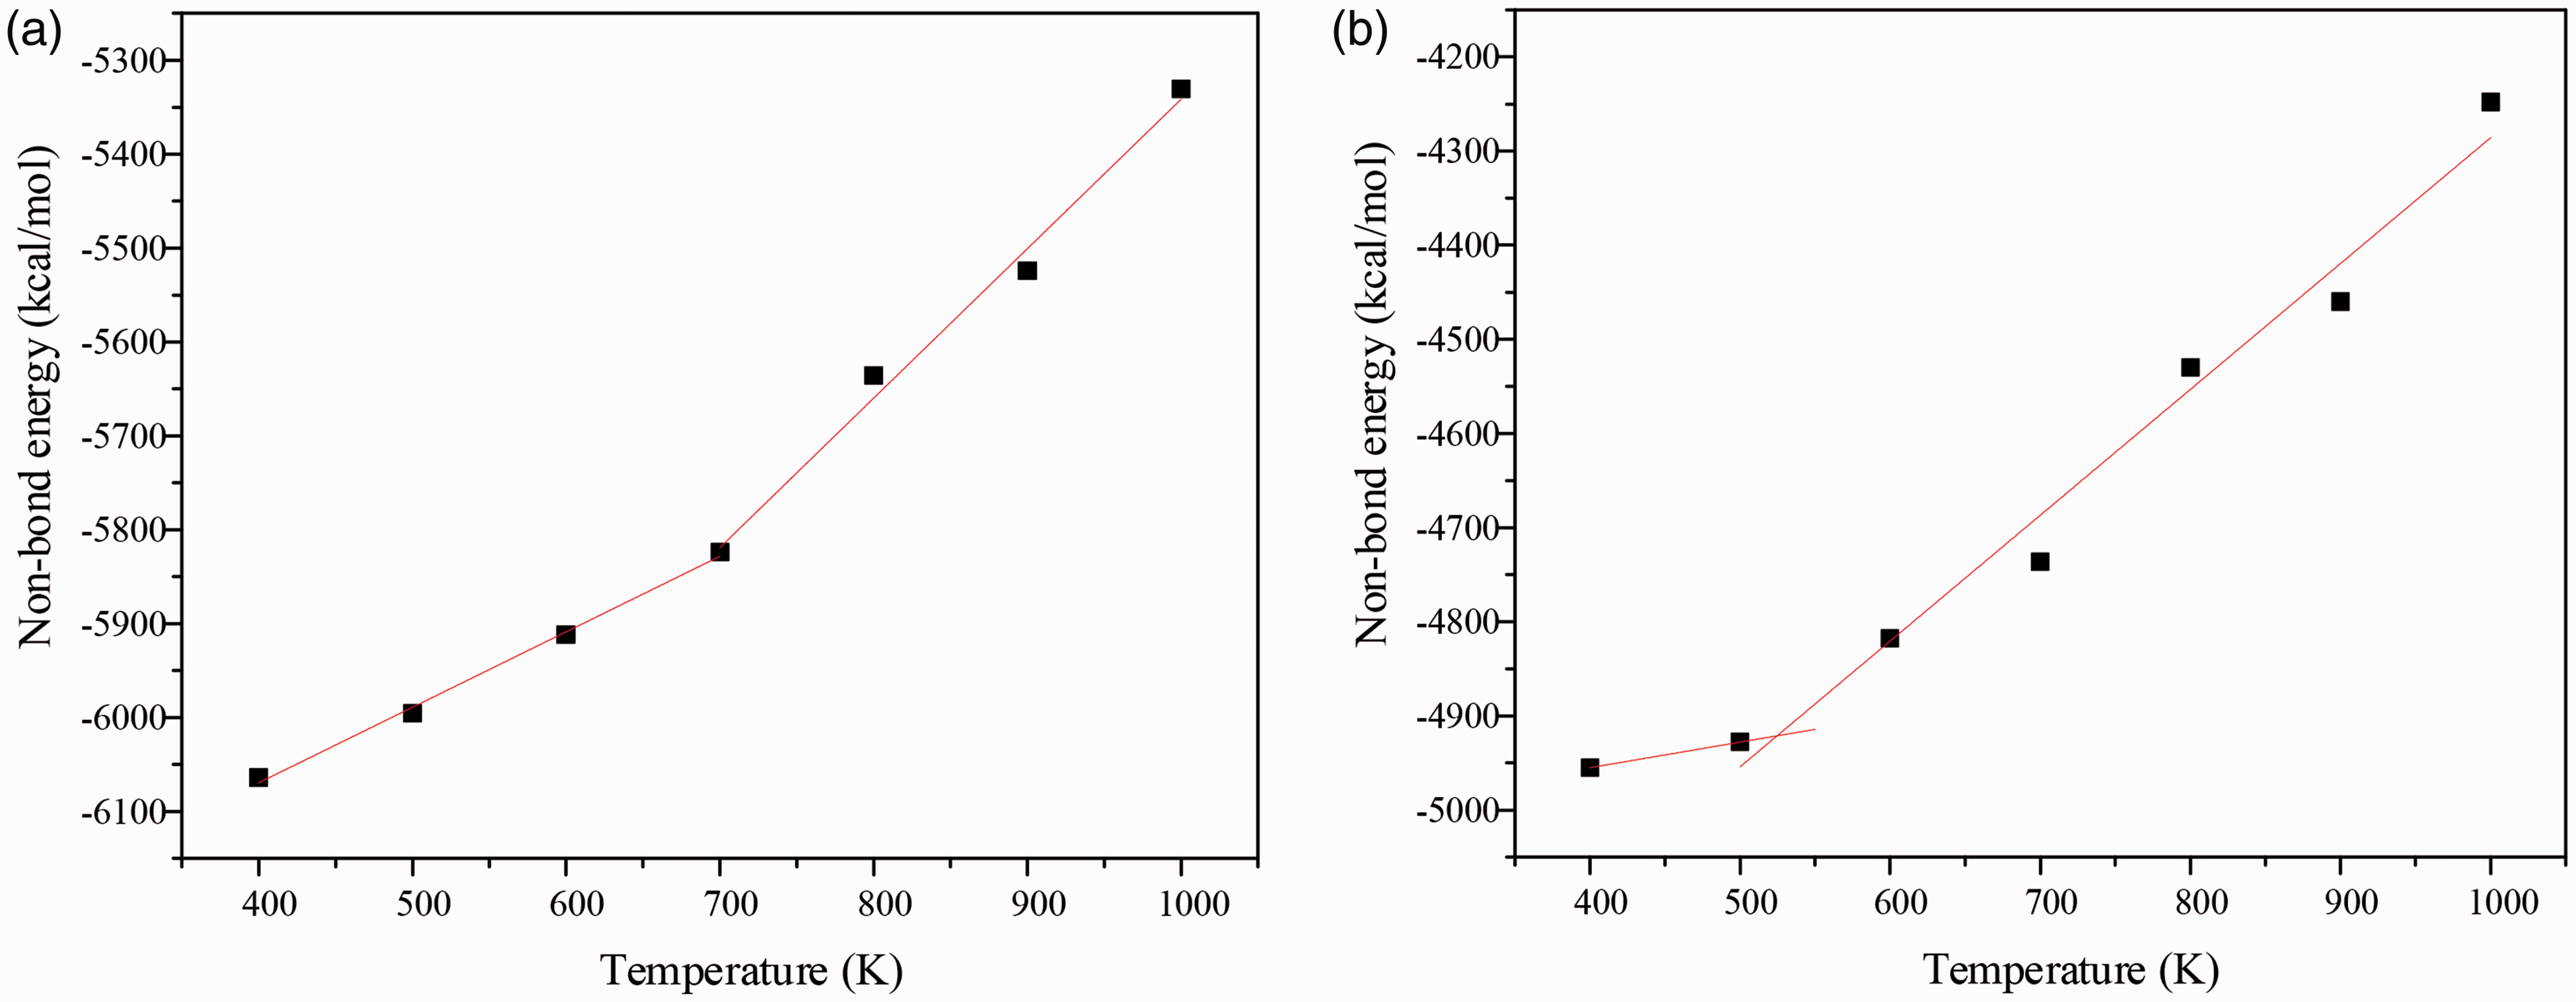
Variation trend of nonbond energy at different temperatures: (a) polyimide and (b) aramid.
CED analysis
The force between molecules is usually expressed by CED. Cohesive energy refers to the energy required to separate 1 mol of liquid or solid molecules out of the range of molecular gravity. The cohesive energy per unit volume of material becomes the CED:

The CED of the two materials at different temperatures is also calculated by the CED module under the Forcite module, as shown in Figure 6.
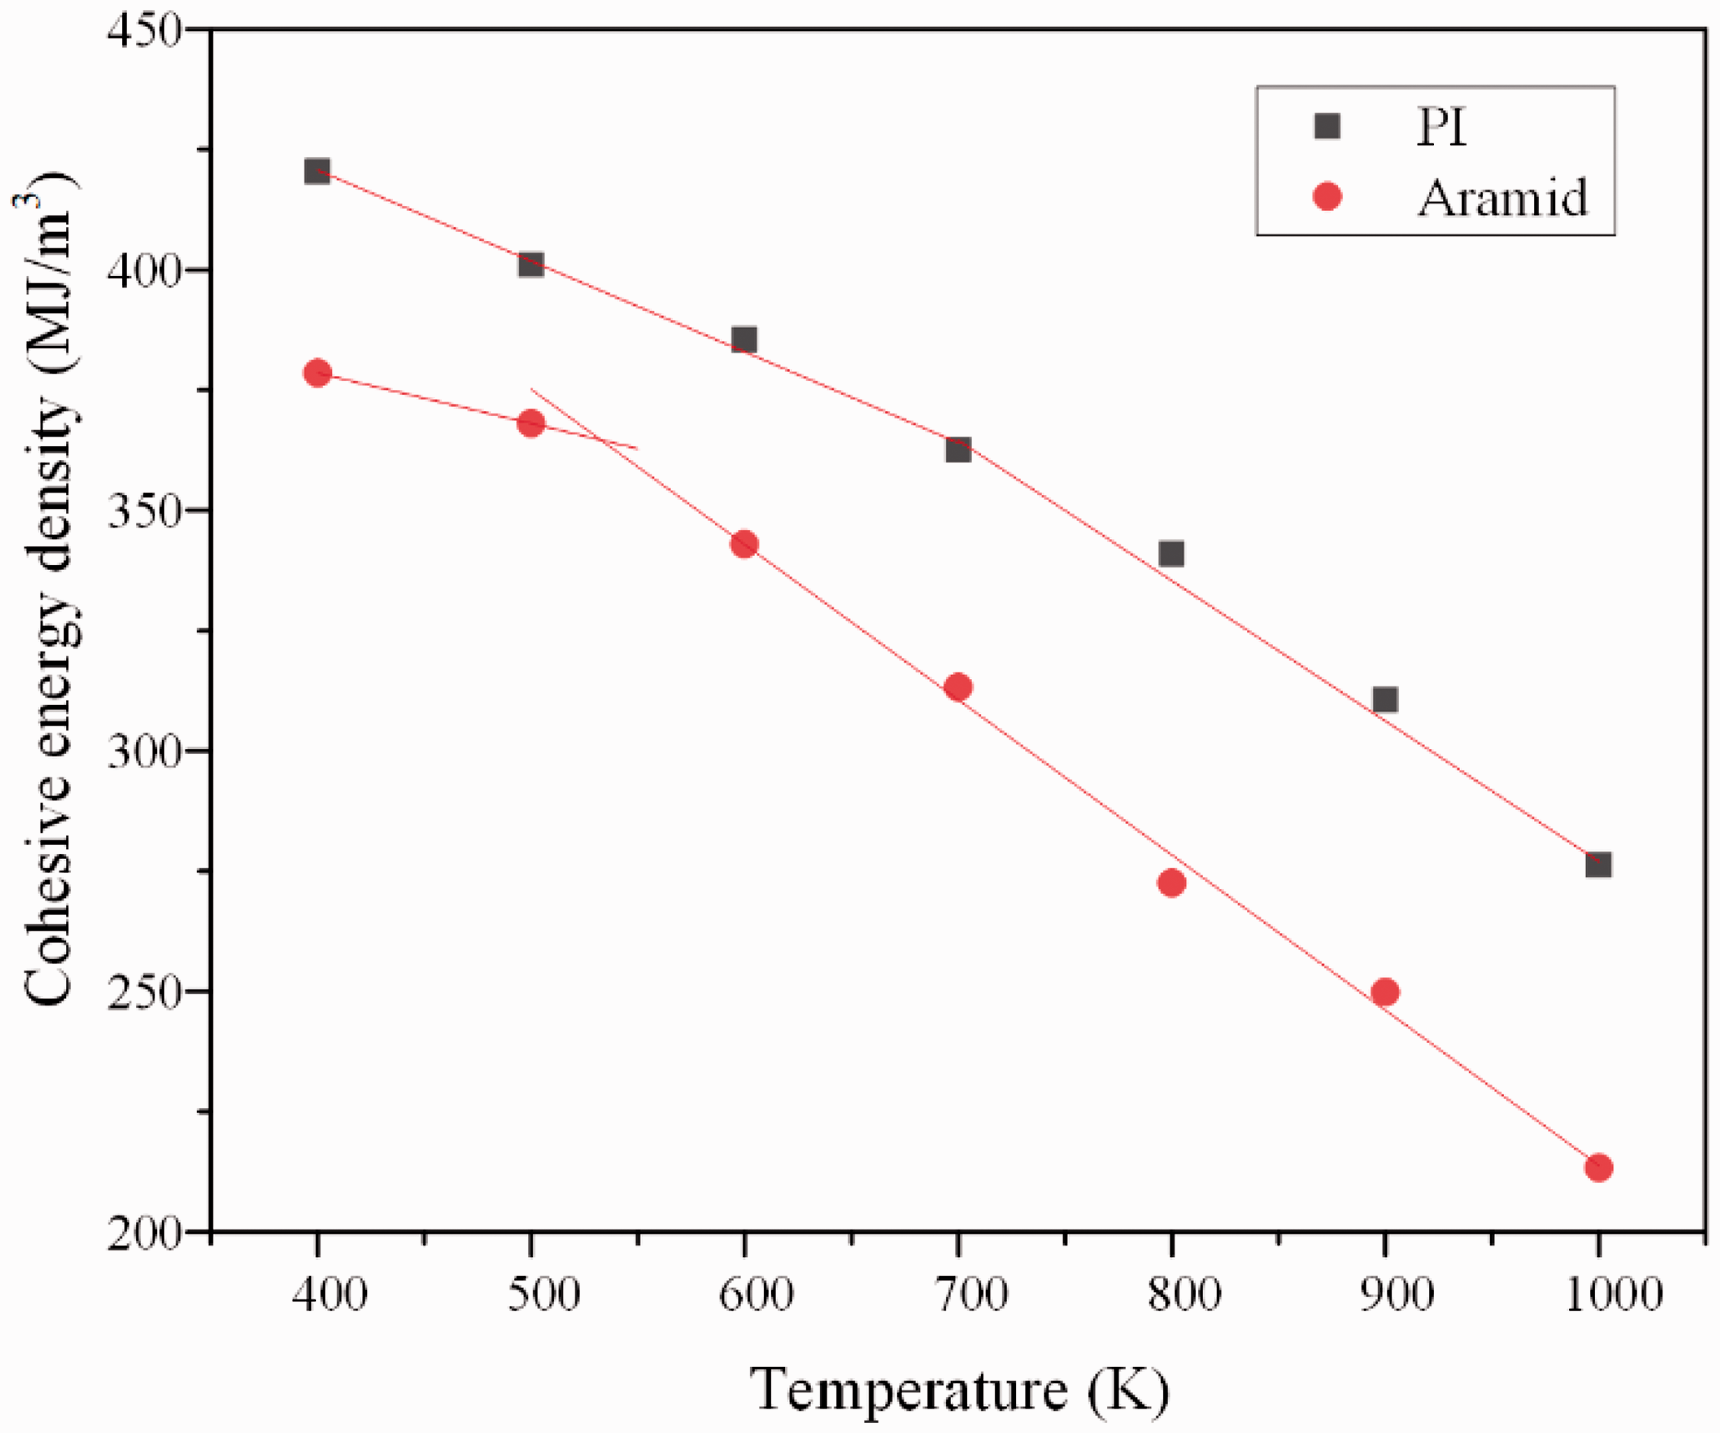
Variation trend of cohesive energy density at different temperatures.
With the increase of temperature, the cohesive energy densities of the two polymer materials decreased continuously, and the decreasing trend was the same as the glass transition temperature. After the polyimide material exceeds the glass transition temperature of 700 K, the decreasing slope of CED increased from 0.1889 to 0.2917. And when the aramid exceeds 540 K, the decline slope of CED increased from 0.1047 to 0.3227. At different temperatures, the CED of polyimide is greater than that of aramid, indicating that the intermolecular force of polyimide is larger, and the strong intermolecular force corresponds to better mechanical strength and heat resistance. After exceeding the glass transition temperature, the decreased rate of polyimide CED was smaller than that of aramid, indicating that the stability of polyimide is better than that of aramid when the temperature changes.
Molecular models of polyimide and aramid were established by molecular dynamics simulation, and the bond order and glass transition temperature of the two molecules were compared. The bond order and glass transition temperature of polyimide were higher than those of aramid, and the glass transition temperature of both materials exceeded 500 K, which belonged to high temperature resistant materials. The reasons that affect the glass transition temperature were analyzed from energy change and CED. Polyimide has higher molecular potential energy and CED than aramid, so the force within and between molecules is stronger. The glass transition temperature is higher than aramid, which can maintain the stability of molecular chains at higher temperatures. It has a certain theoretical basis for its application in the field of arc protection.
Test device and evaluation method of skin burns
Arc test platform
Referring to the ASTM F1959 standard test method for determining the arc rating of materials for clothing and IEC 61482-1-1 live working–protective clothing against the thermal hazards of an electric arc, the high current circuit test system was used to build the arc test platform. The circuit diagram of the arc test platform is shown in Figure 7.
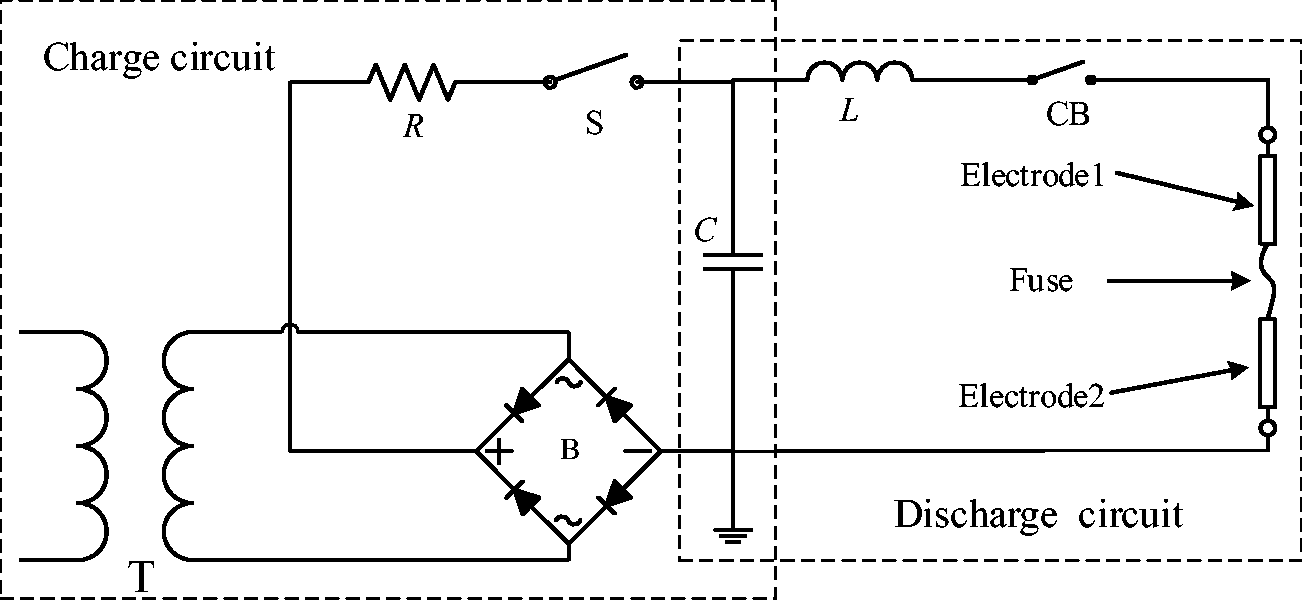
Circuit diagram of the arc test circuit system.
In Figure 7, T, B, R, S and C form the charging circuit of the capacitor bank, where T is the transformer, B is the rectifier, R is the charging circuit resistor, and the charging speed can be controlled by adjusting the resistance value, S is the charge switch, and C is the capacitor bank. L, C, CB, electrodes, and fuse wire make up the high current discharge circuit, where L is the inductor, CB is the discharge switch, two electrodes used copper rods with a diameter of 19 cm and length of 45 cm, fuse wire was made of copper wire. The function of the fuse was to connect the ends of opposing electrode tips and initiate the arc under the current action.
The high current circuit adopted the L-C discharge principle. During the test, first the switch CB of the right discharge circuit was opened, the charge switch S was closed, charging the capacitor bank C through transformer T and rectifier B to store electrical energy. After charging is finished, the charge switch S was disconnected and the discharge switch CB was closed to discharge the capacitor to generate a high current.
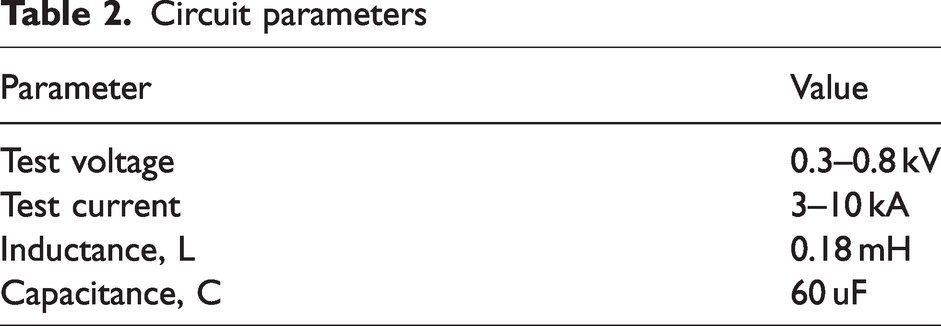
The circuit current frequency was changed by changing the values of capacitor C and inductor L. The magnitude of the circuit current was changed by adjusting the charging voltage of the capacitor. The circuit parameters used in the test are shown in Table 2. Figure 8 shows the arc test platform apparatus.
Circuit parameters
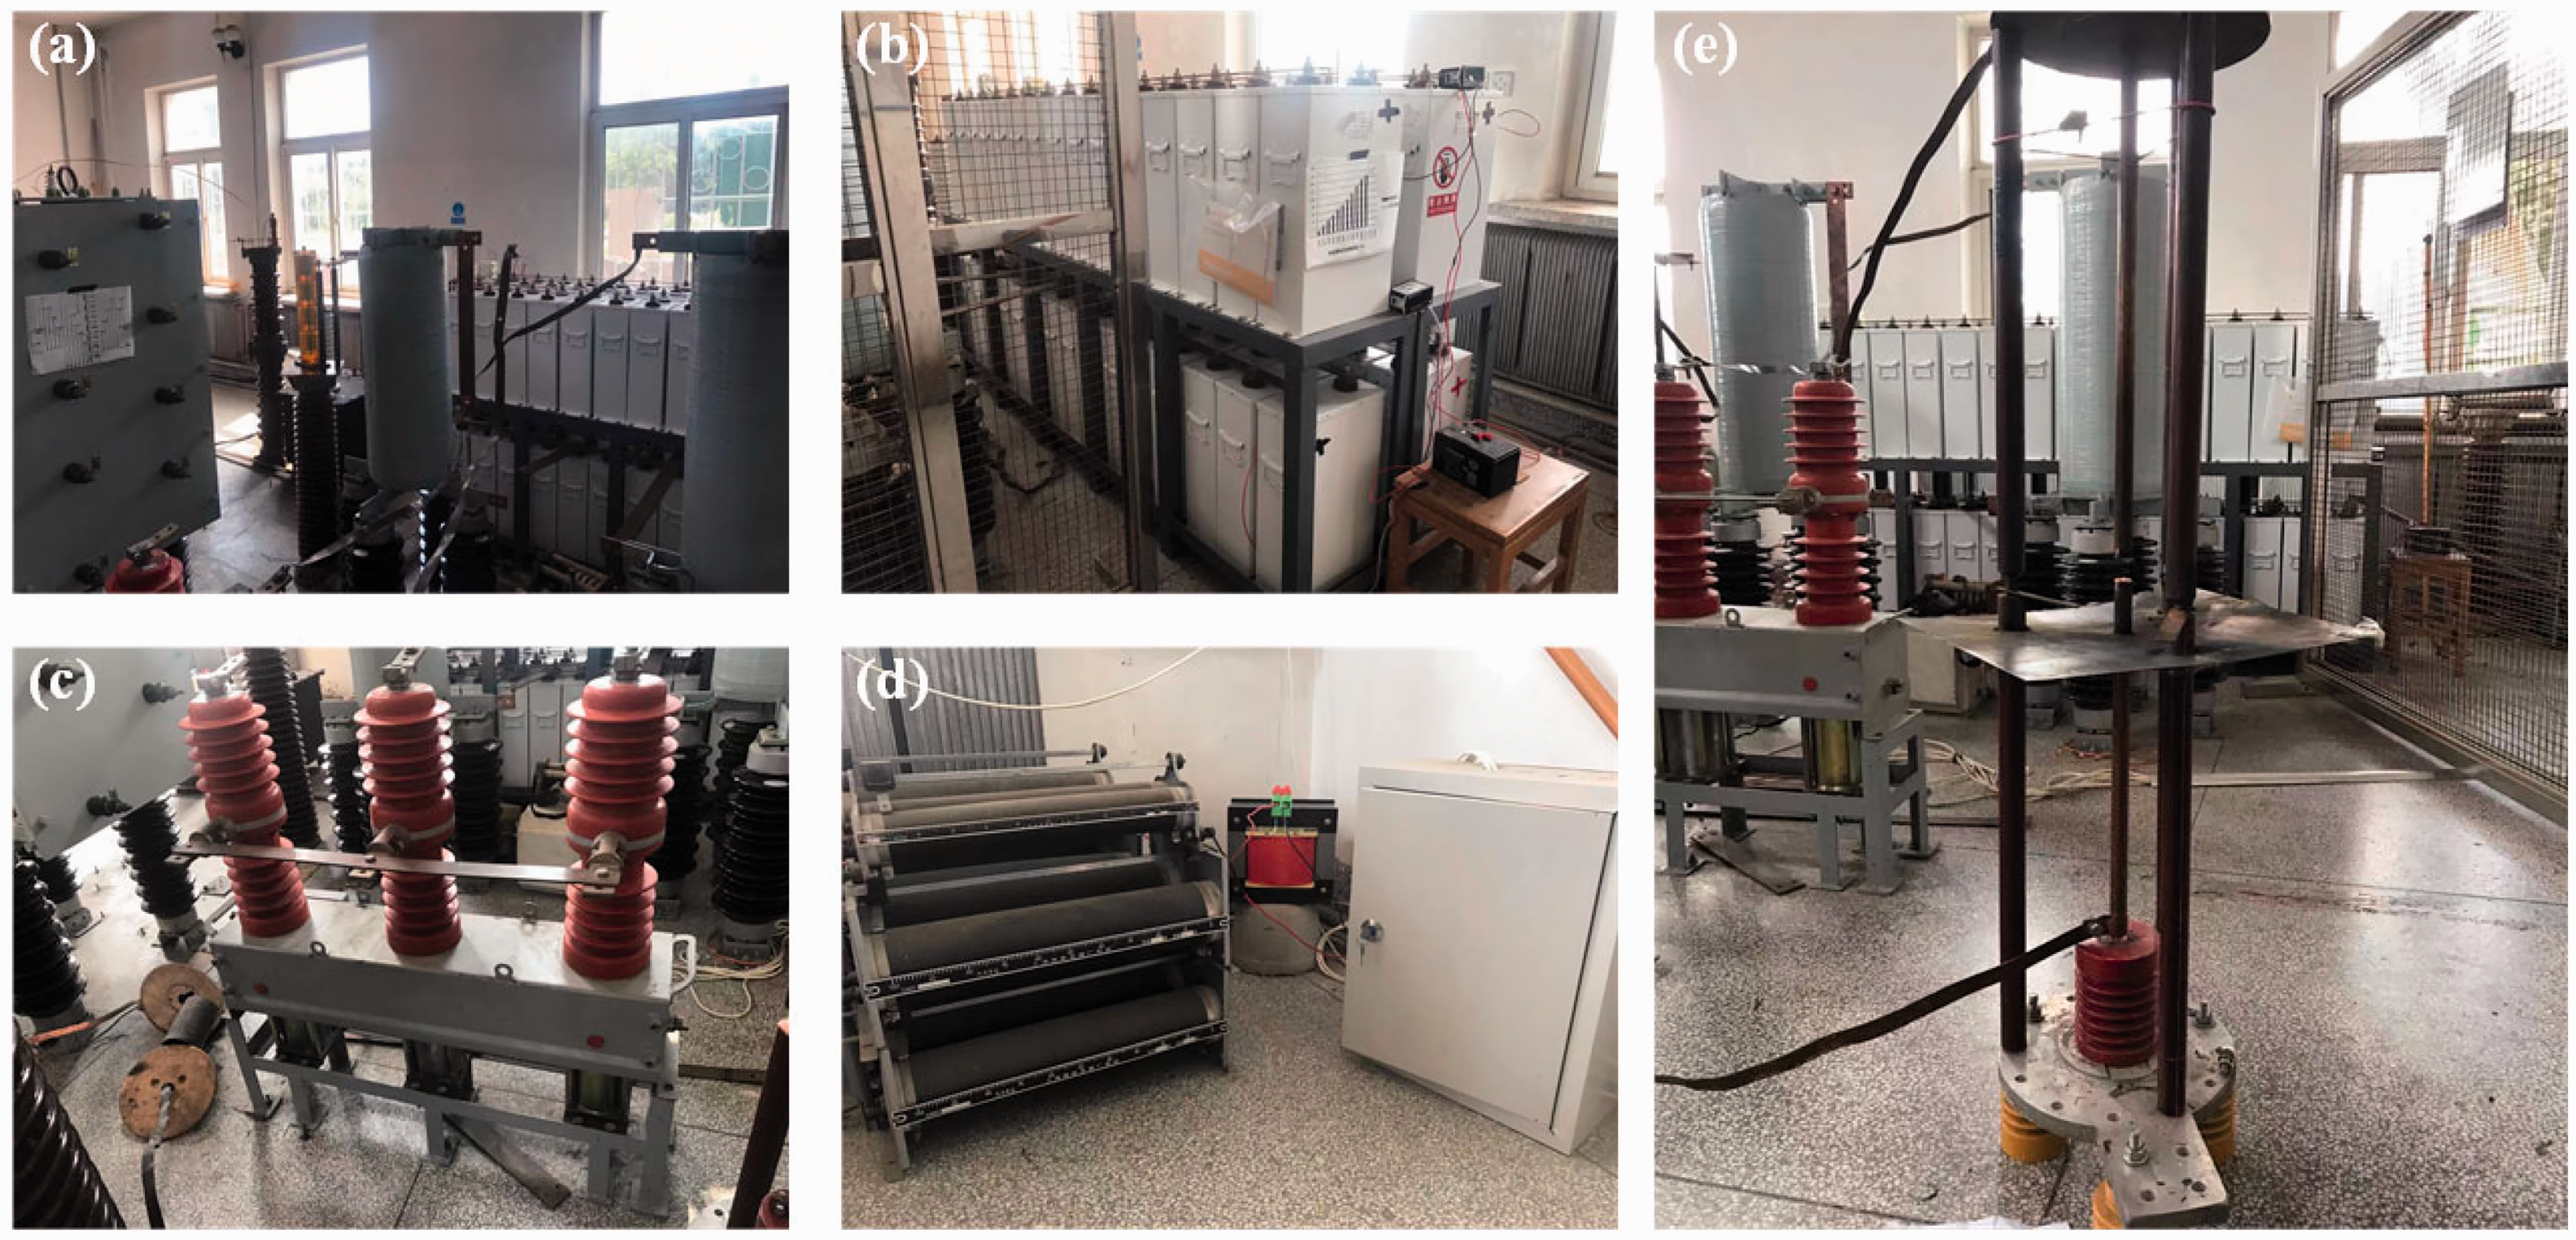
Arc test platform apparatus diagram: (a) inductor; (b) capacitor bank; (c) switch; (d) transformer and rectifier and (e) electrodes.
Calorimeter measurement system
A copper calorimeter was used as a sensor for arc energy measurements as described in ASTM F1959 and IEC 61482-1-1. The structure and test method of the calorimeter are shown in Figure 9. The calorimeter consists of a copper disk, insulation board (usually calcium silicate board), and thermocouple. The distance between the copper heat sensor and the electrode is called the measurement distance. When no arc-proof fabric was covering the sensor surface, the sensor measured the temperature rise data directly exposed to the arc. When the fabric was covered, the sensor measured the temperature rise data under the protection of the fabric.
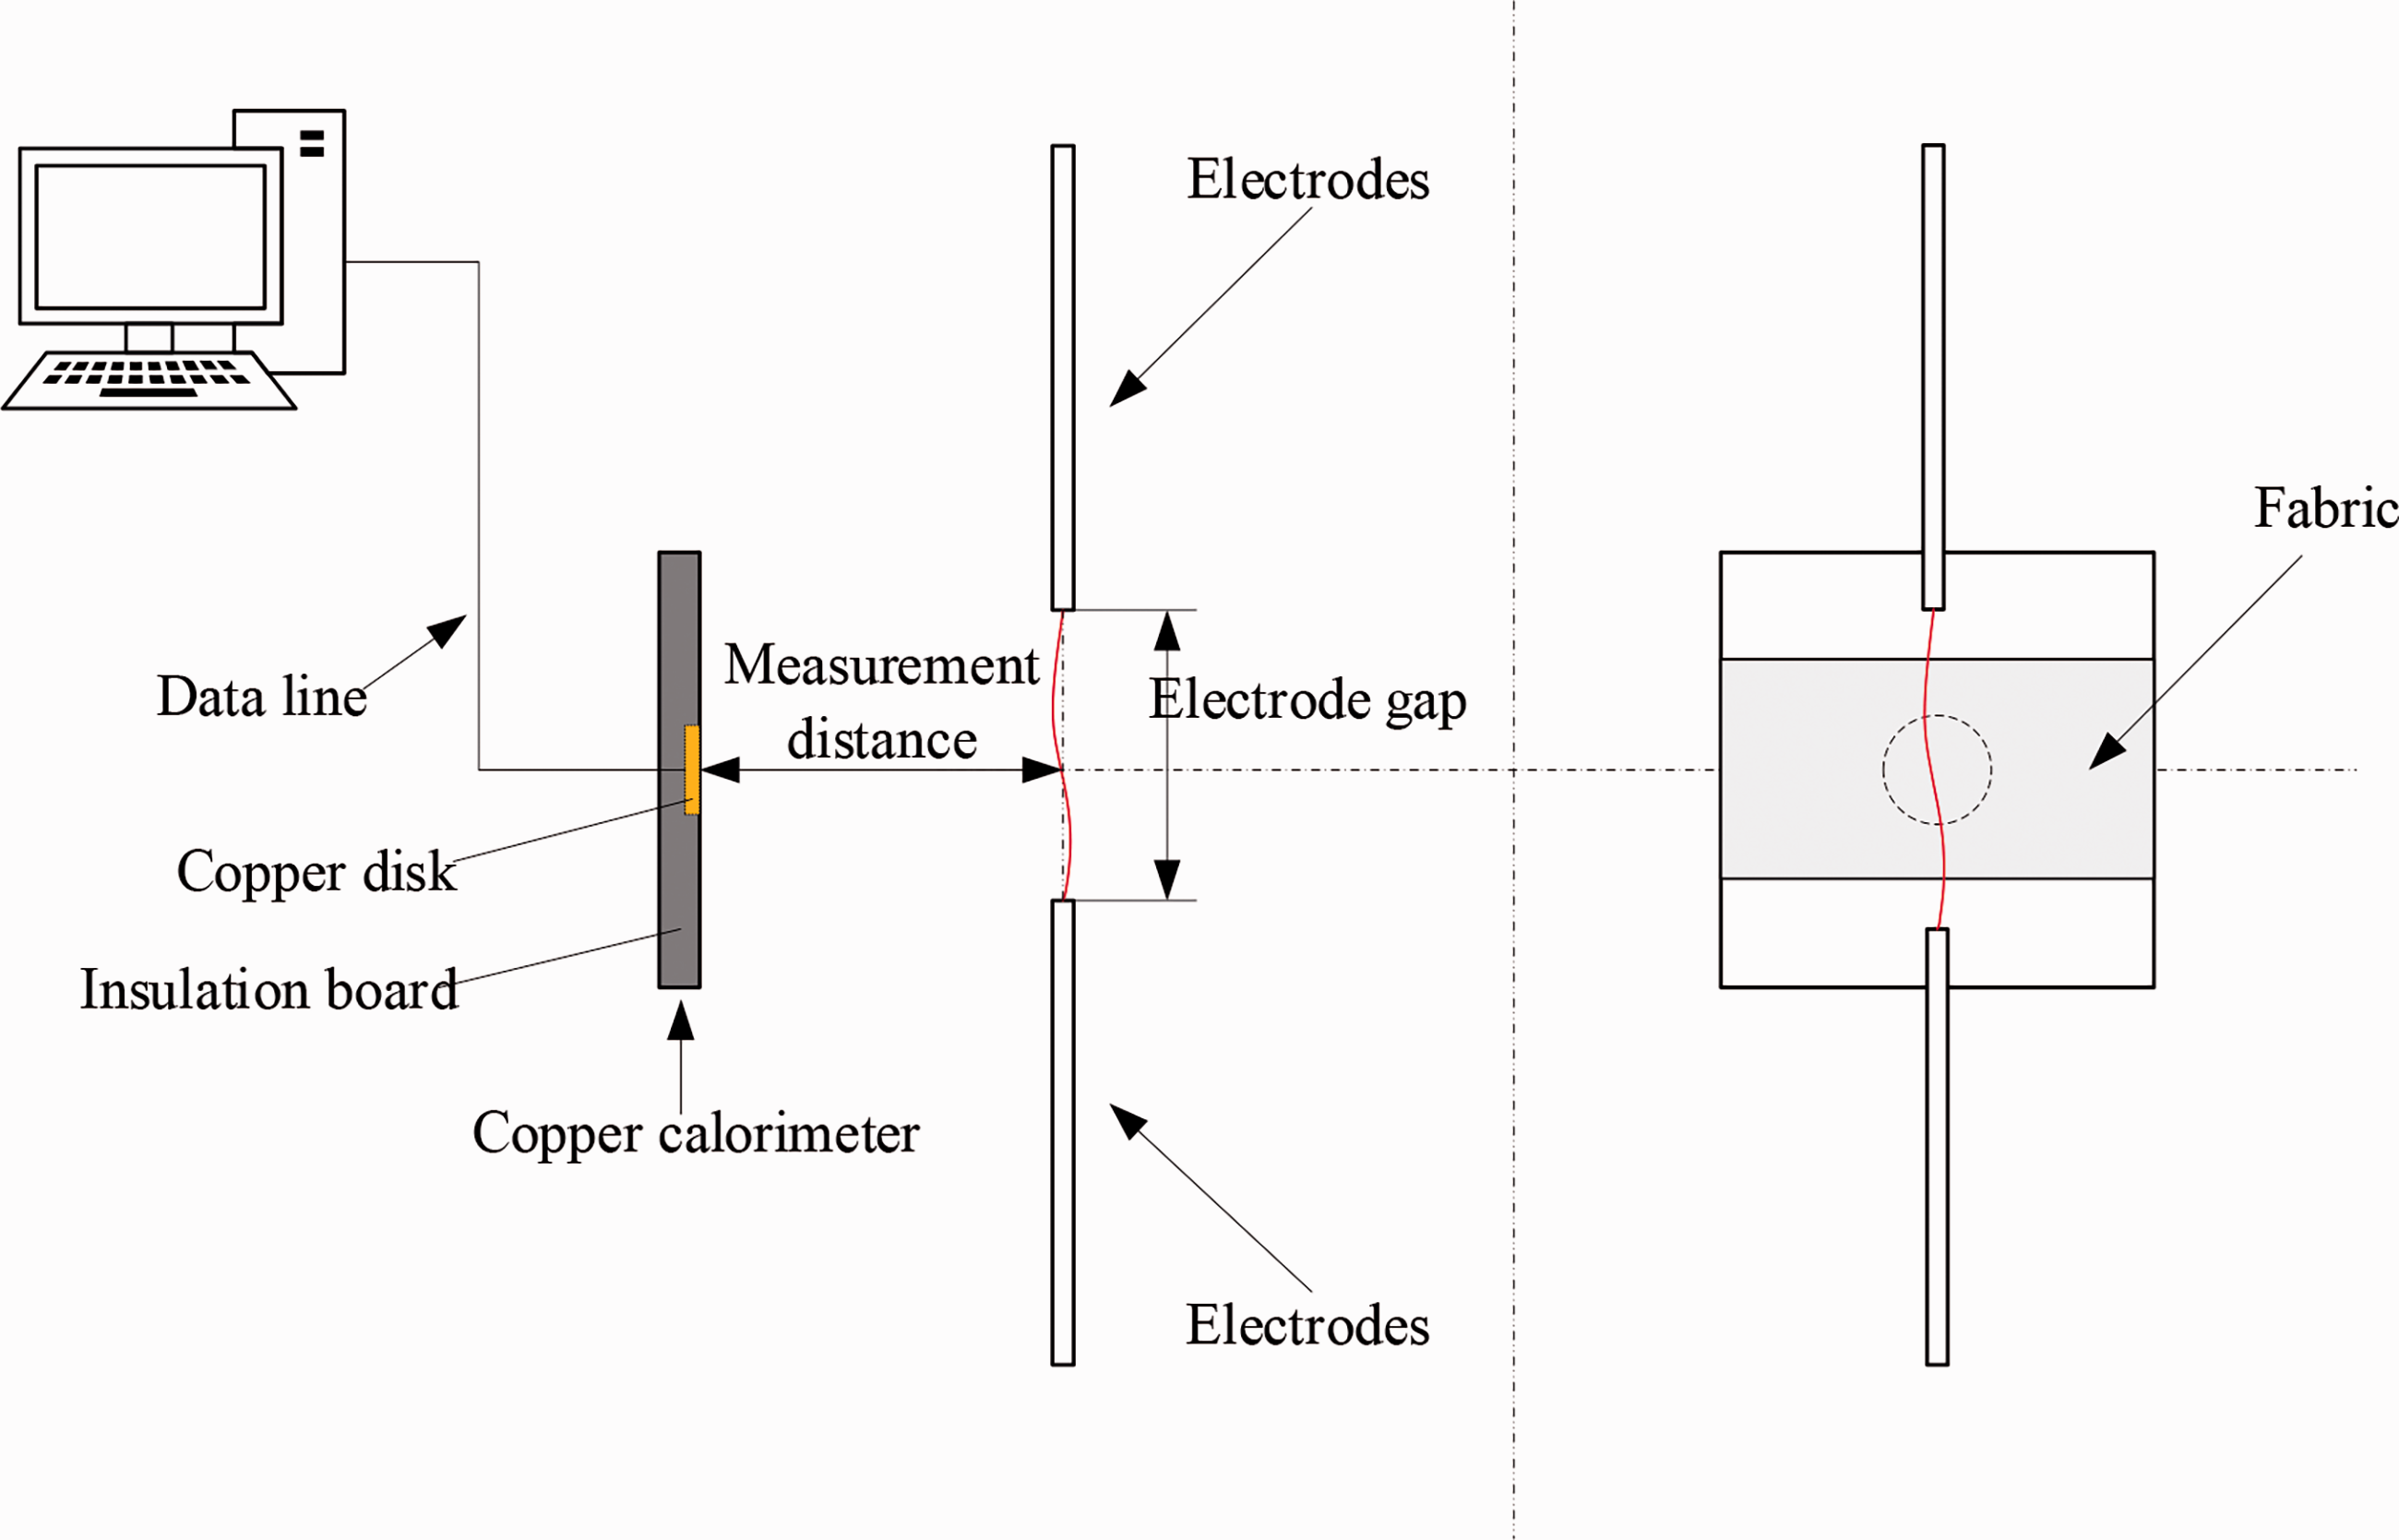
Calorimeter measurement system.
The principle of using a calorimeter sensor to measure arc energy was that the heat generated by the arc causes the temperature rise data of the sensor’s copper disk through thermal convection and radiation. The thermocouple was connected with the copper to sense the temperature change, and the temperature change data were obtained through the hardware data processing module. Finally, combined with the physical parameters of copper, the arc energy received by the calorimeter was calculated by using equation (3):

Evaluation method of skin burns
Regarding the damage to the human body caused by the heat energy generated by the electric arc, Stoll and Chianta have found a method that can predict human second-degree burns through a large number of burn experimental studies on animal skin, that is, the Stoll second-degree burn criterion.
13
By using equation (4), the ASTM E457-1996 standard conversion equation, two scholars converted the time t required for a second-degree burn of the human skin under different incident energy into the temperature rise data of the copper calorimeter sensor, and obtained the Stoll curve.

When the temperature rise curve of the calorimeter intersects the Stoll curve, it will cause second-degree burns to people.
Discussion and analysis of test results
This paper changed the received arc energy by changing the arc current and the measurement distance. Test conditions: at room temperature, the electrode gap was 20 mm, the measurement distance included 40 mm, 30 mm, 15 mm and 10 mm, the current level included 3 kA, 4 kA, 6 kA, 8 kA and 10 kA, and the temperature rise time recorded was 10 s.
The test procedure refers to ASTM F1959 and IEC 61482-1-1, the sensor and fabric were fixed, the arc was started and recorded the temperature rise data of the sensor. The materials used in the test were manufactured by Jiangsu Aoshen Hi-tech Materials Co. Ltd, China. The warp and weft yarn density of polyimide fabric is 285 pieces/10 cm × 210 pieces/10 cm, and a weight of 200 g/m2. The warp and weft yarn density of aramid fabric is 300 pieces/10 cm × 228 pieces/10 cm, and a weight of 231 g/m2.
Analysis of arc energy under different currents
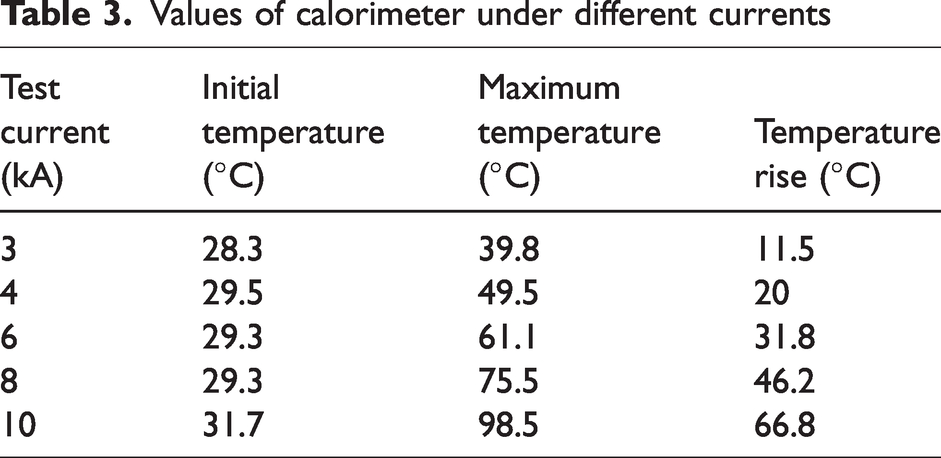
Table 3 shows the initial temperature and maximum temperature of the sensor under different currents when the measuring distance was 40 mm. The temperature rise data under the currents of 3 kA, 4 kA, 6 kA, 8 kA and 10 kA were 11.5°C, 20°C, 31.8°C, 46.2°C and 66.8°C, respectively. The data of Stoll's second-degree burns are that if the calorimeter temperature rise data was greater than 17.3°C within 10 s, it will cause second-degree burns to humans. It means that when the current is greater than 4 kA, the arc energy would be a threat to the body if the human does not wear personal protective equipment. This was also consistent with ASTM F1959 and IEC 61482-1-1, which require an arc test current greater than 4 kA. The arc energy test proved that the arc test platform built in the laboratory can produce the energy required for the test and can be used as an arc protection test.
Values of calorimeter under different currents
Comparing the temperature rise data of the calorimeter with the Stoll curve, we can more intuitively judge which current level would cause the second-degree burns. The combined results of the calorimeter and Stoll curve at different currents are shown in Figure 10.
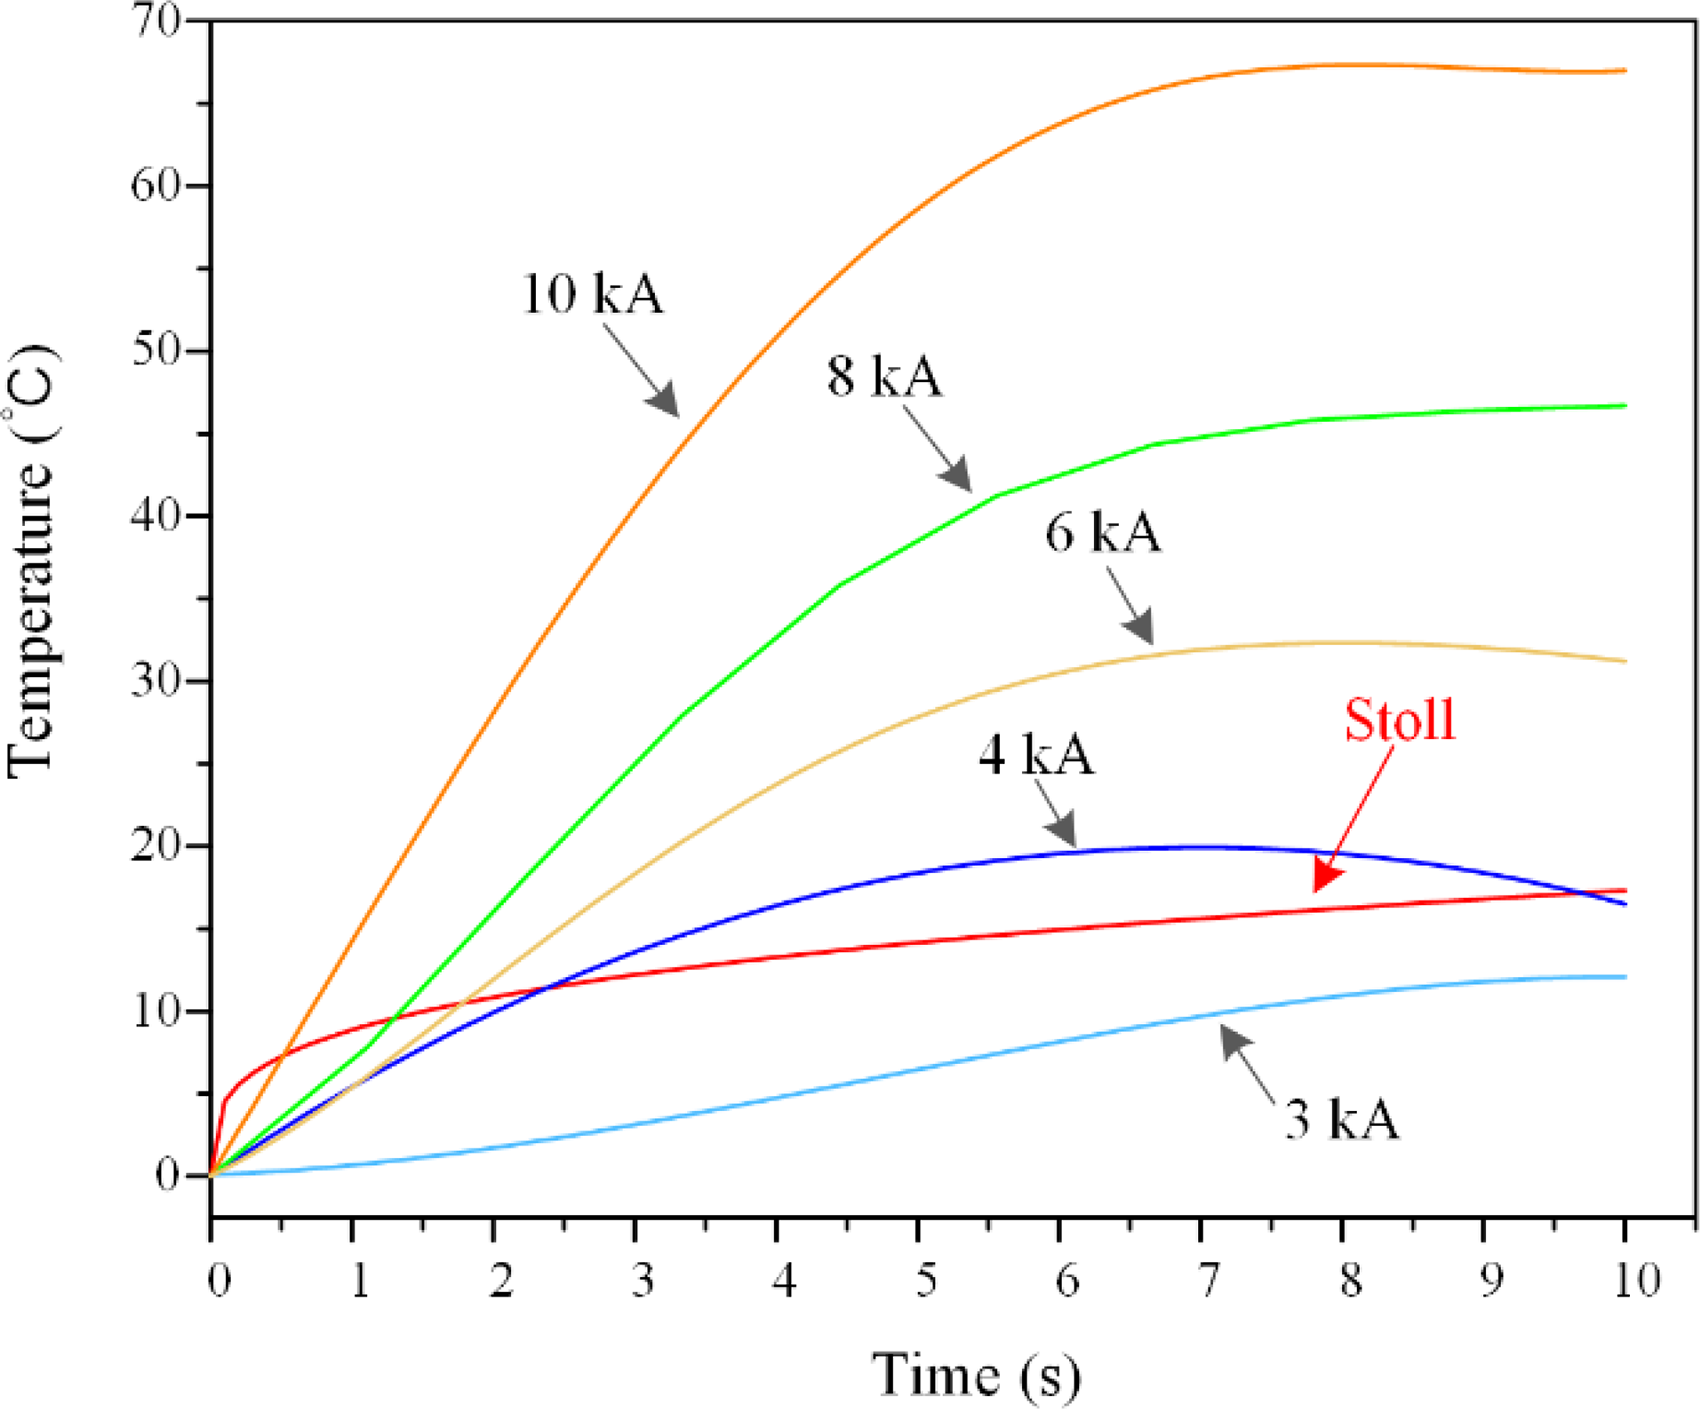
Comparison of temperature rise curve of the calorimeter and Stoll.
The calorimeter curve and Stoll curve did not intersect at the current of 3 kA, indicating that the heat generated by the arc is not enough to cause burns to the worker at the current level of 3 kA. At 4 kA, 6 kA, 8 kA and 10 kA, the calorimeter curve intersected with the Stoll curve, indicating that when the current level is greater than 4 kA, people would be burned when exposed to arc energy. The higher the current, the greater the arc energy, the faster the temperature rise of the sensor, the smaller the intersection time with the Stoll curve, the less the reaction time for the staff in the case of an arc accident, and the greater the accident probability of casualties.
Arc protection analysis of polyimide and aramid fabrics
Thermal protection analysis
The above section states that only when the current was 4 kA or above, people would experience second-degree burns when exposed to the arc. Thus, 3 kA current was no longer considered when studying the thermal protection properties of polyimide and aramid. The two fabrics were covered on the surface of the calorimeter during the arc test.
Figure 11 shows the temperature rise comparison between the sensor protected by the fabric and the sensor directly exposed to the arc under different currents. Polyimide and aramid in the figure represent the temperature rise of the sensor under the protection of polyimide fabric and aramid fabric, respectively. The arc represents the temperature rise of the sensor directly exposed to the arc, and Stoll represents the Stoll temperature value that causes second-degree burns within 10 s. When covered with polyimide and aramid fabrics, the temperature rise data of the sensor increased with the current, but it was significantly reduced compared with direct exposure to the arc. At the current of 10 kA, the maximum temperature rise data of the sensor under the polyimide and aramid fabrics were 9.7°C and 13.5°C, respectively, which was lower than the second-degree burns temperature rise data of the Stoll curve of 17.3°C, indicating that wearing polyimide and aramid fabrics can reduce the damage of the arc to the human body and play a protective effect.
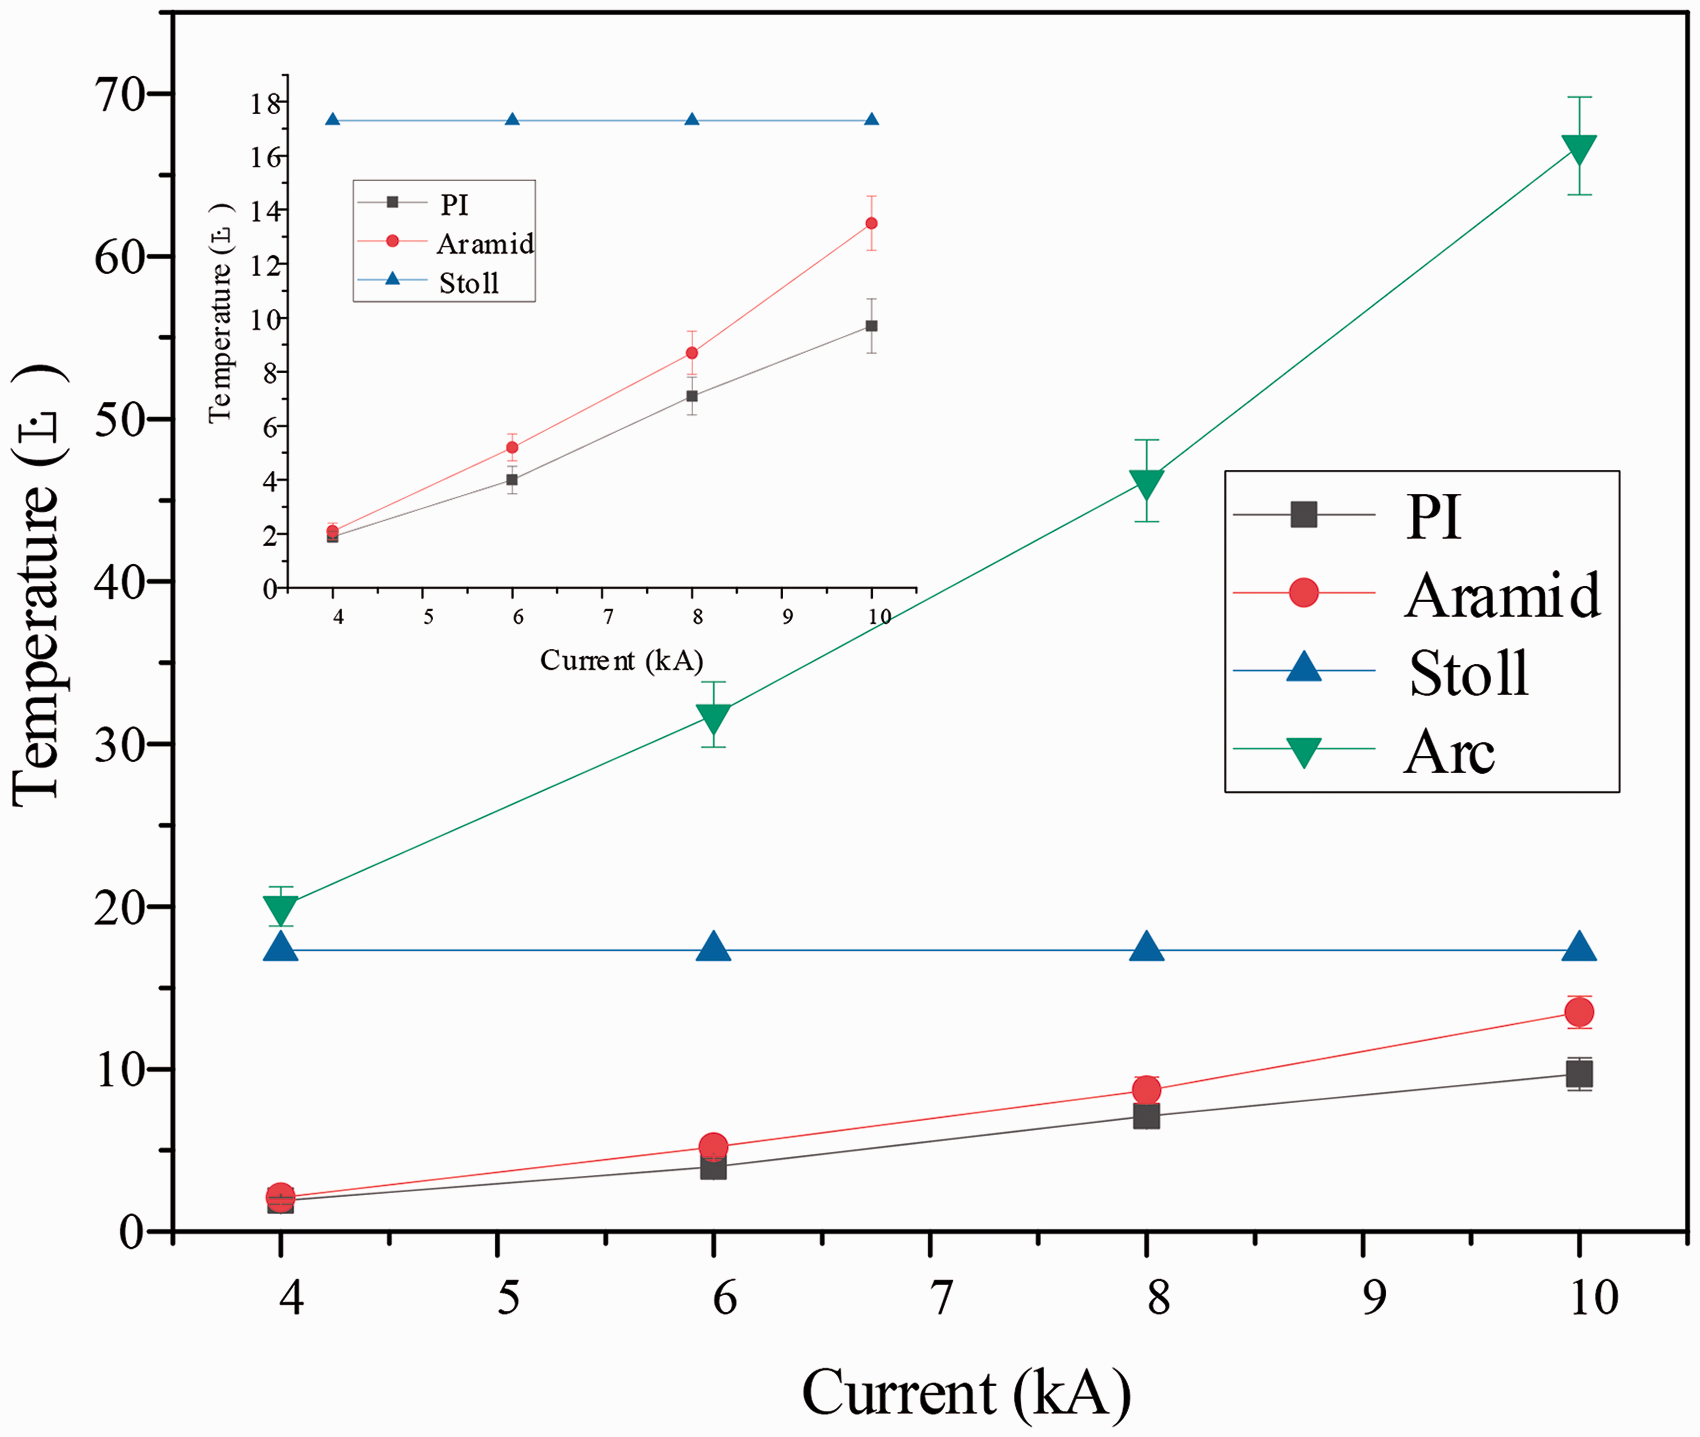
Temperature rise data of sensors covered with two fabrics under different currents.
Figure 12 shows the temperature rise comparison of sensors with or without fabric protection under different measurement distances. Under 8 kA current, when the measurement distance was 40 mm, 30 mm, 15 mm, and 10 mm, the maximum temperature rise values of the sensor exposed to the arc were 46.2°C, 67.4°C, 110.8°C and 138.2°C, respectively, which were much higher than the Stoll second-degree burns temperature.

Temperature rise data of sensors covered with two fabrics under different measurement distances.
When polyimide and aramid protective fabrics were covered, the temperature of the sensor increased with the decrease of the measurement distance. The maximum temperature rise value was reached when the measurement distance was 10 mm, which was 14.3°C and 16.7°C, respectively, but this value was still lower than the second-degree burns temperature. It showed that polyimide and aramid fabrics could effectively reduce the arc heat transfer.
According to the results of the arc test, under different measurement distances and arc currents, the temperature rise data of the calorimeter sensor at the protection of the fabric was greatly reduced compared with being directly exposed to the arc and lower than the second-degree burns temperature of the Stoll curve at 10 s. It shows that the two fabrics can block the arc energy received by the sensor in a great measure. At the same time, comparing the temperature rise data of the two materials, it was found that under different test conditions, the temperature rise data of the sensor covered with the polyimide fabric was less than that of aramid, indicating that under the same arc energy, the thermal protection performance of polyimide fabric is better than that of aramid.
Break open results analysis
Figure 13 shows the break open results of a fabric sample after five arc treatments at different measurement distances. At the test condition of 40 mm, both fabrics did not break open after five times of arc treatments. The measurement distance was reduced to 15 mm, the aramid fabric ruptured at the third arc and the polyimide fabric ruptured at the fifth arc. When the distance was reduced to 10 mm, it was found that the aramid fabric broke at the second arc, and the polyimide fabric broke at the fourth arc.

The number of times that two fabrics withstand arc.
With the decreasing distance from the arc, the arc energy borne by the material was increasing. Under the electric arc, the mechanical properties of aramid fibers were continuously reduced, resulting in a rapid decline in the protection capacity of aramid fibers. From the data, when the distance from the arc was 15 mm, polyimide can withstand 67% more arc treatment times than aramid. When the distance was 10 mm, the times of arc resistance of polyimide was twice that of aramid.
Figures 14 and 15 show the results of the first and second arc treatments at a distance of 10 mm. After the first arc test, only the surface of polyimide was ablated, the fabric color turned black, and a small degree of carbonization occurred, but the reverse side of the fabric was intact, the overall structure of the fabric was not affected. Aramid fiber carbonized after the arc test, and it was partially deformed by the impact of the arc (inside the circle), the overall structure was damaged to a certain extent. After the second arc test, the polyimide did not deform except for the increased degree of surface ablation. However, apart from the serious carbonization, aramid fabric has broken and no longer has the ability to protect.
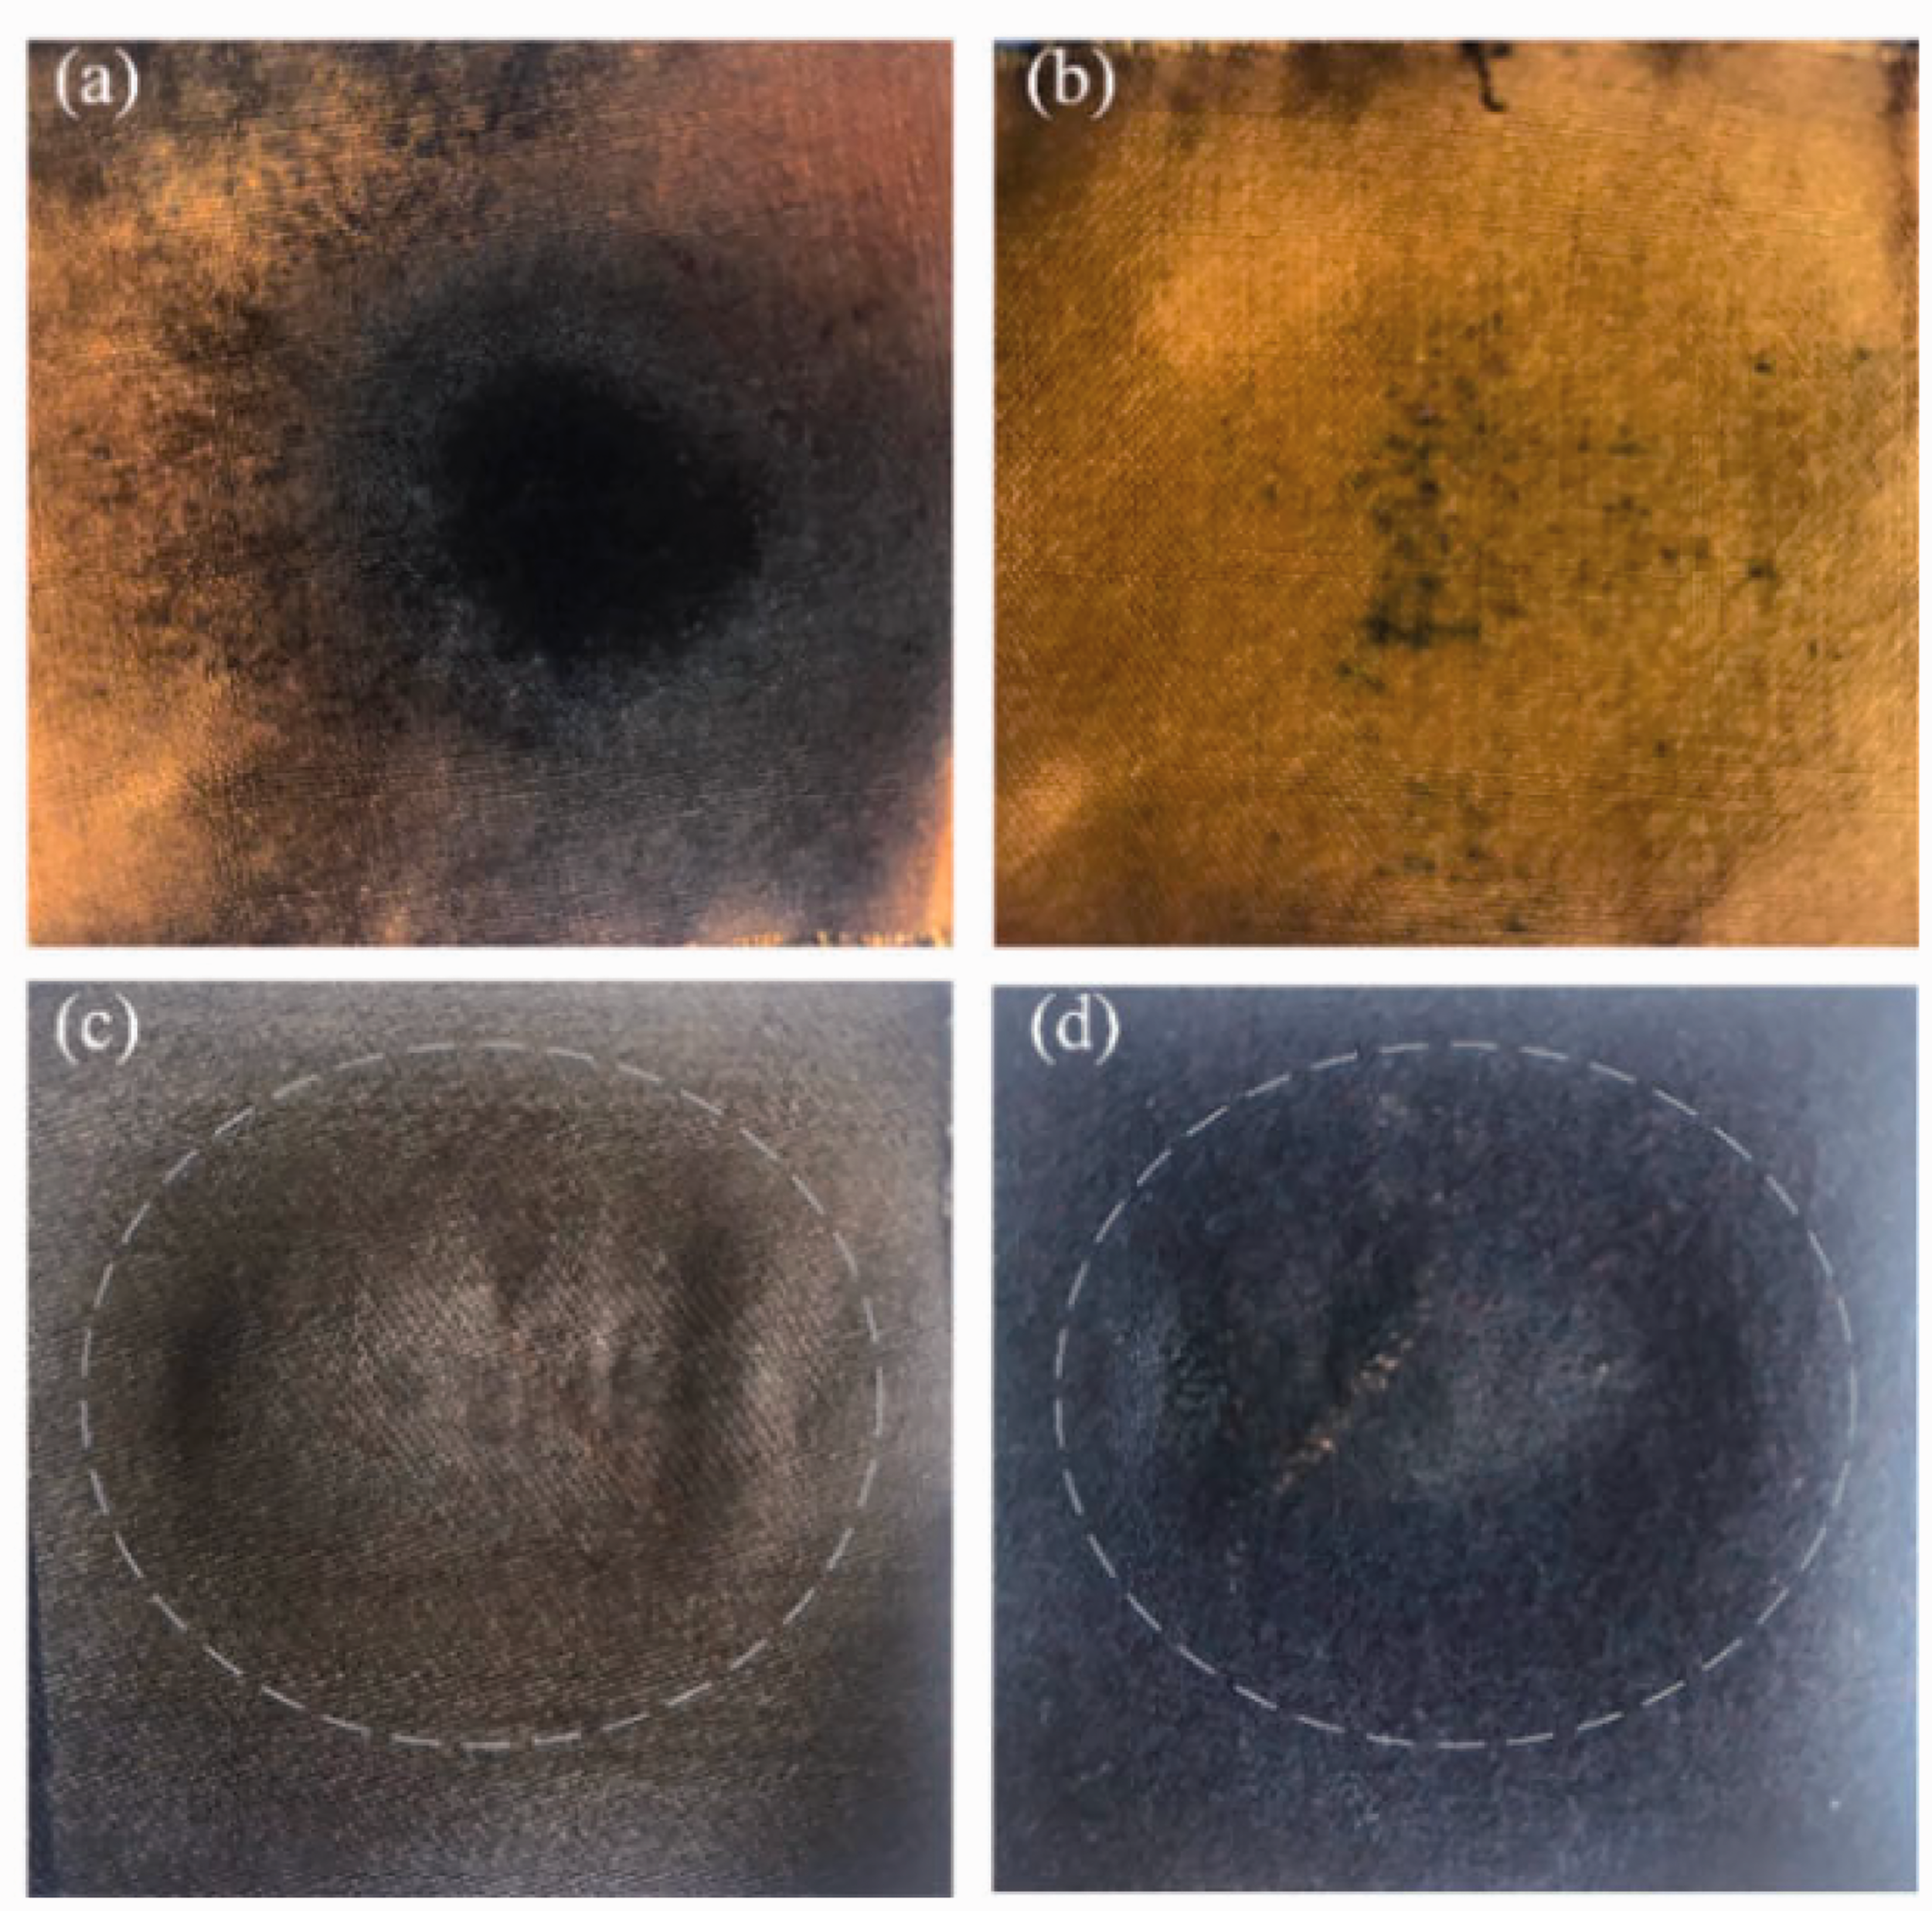
The first test results of the arc with a measurement distance of 10 mm: (a) the front of polyimide; (b) the back of polyimide; (c) the front of aramid and (d) the back of aramid.

The second test results of the arc with a measurement distance of 10 mm: (a) the front of polyimide; (b) the back of polyimide and (c) aramid fabric.
Taking polyimide for example, the microscopic damage pattern of the fabric was analyzed. The polyimide fabric fiber was carbonized under the high temperature of the electric arc. At the same time, the carbonized fiber cracked under the influence of the stress. Figure 16(a) shows the fiber morphology before arc treatment. The fiber is smooth and complete without cracks. After arc treatment, as shown in Figure 16(b), the fiber surface shows obvious fracture due to arc heat and stress, and the fiber surface is covered with a carbon layer, making the fiber no longer smooth. To a certain degree, the carbon layer can prevent the inner fiber from contacting oxygen and reduce the heat from transferring to the inside of the fabric. Although the surface of the fabric is carbonized, it still has some extent of protection ability.
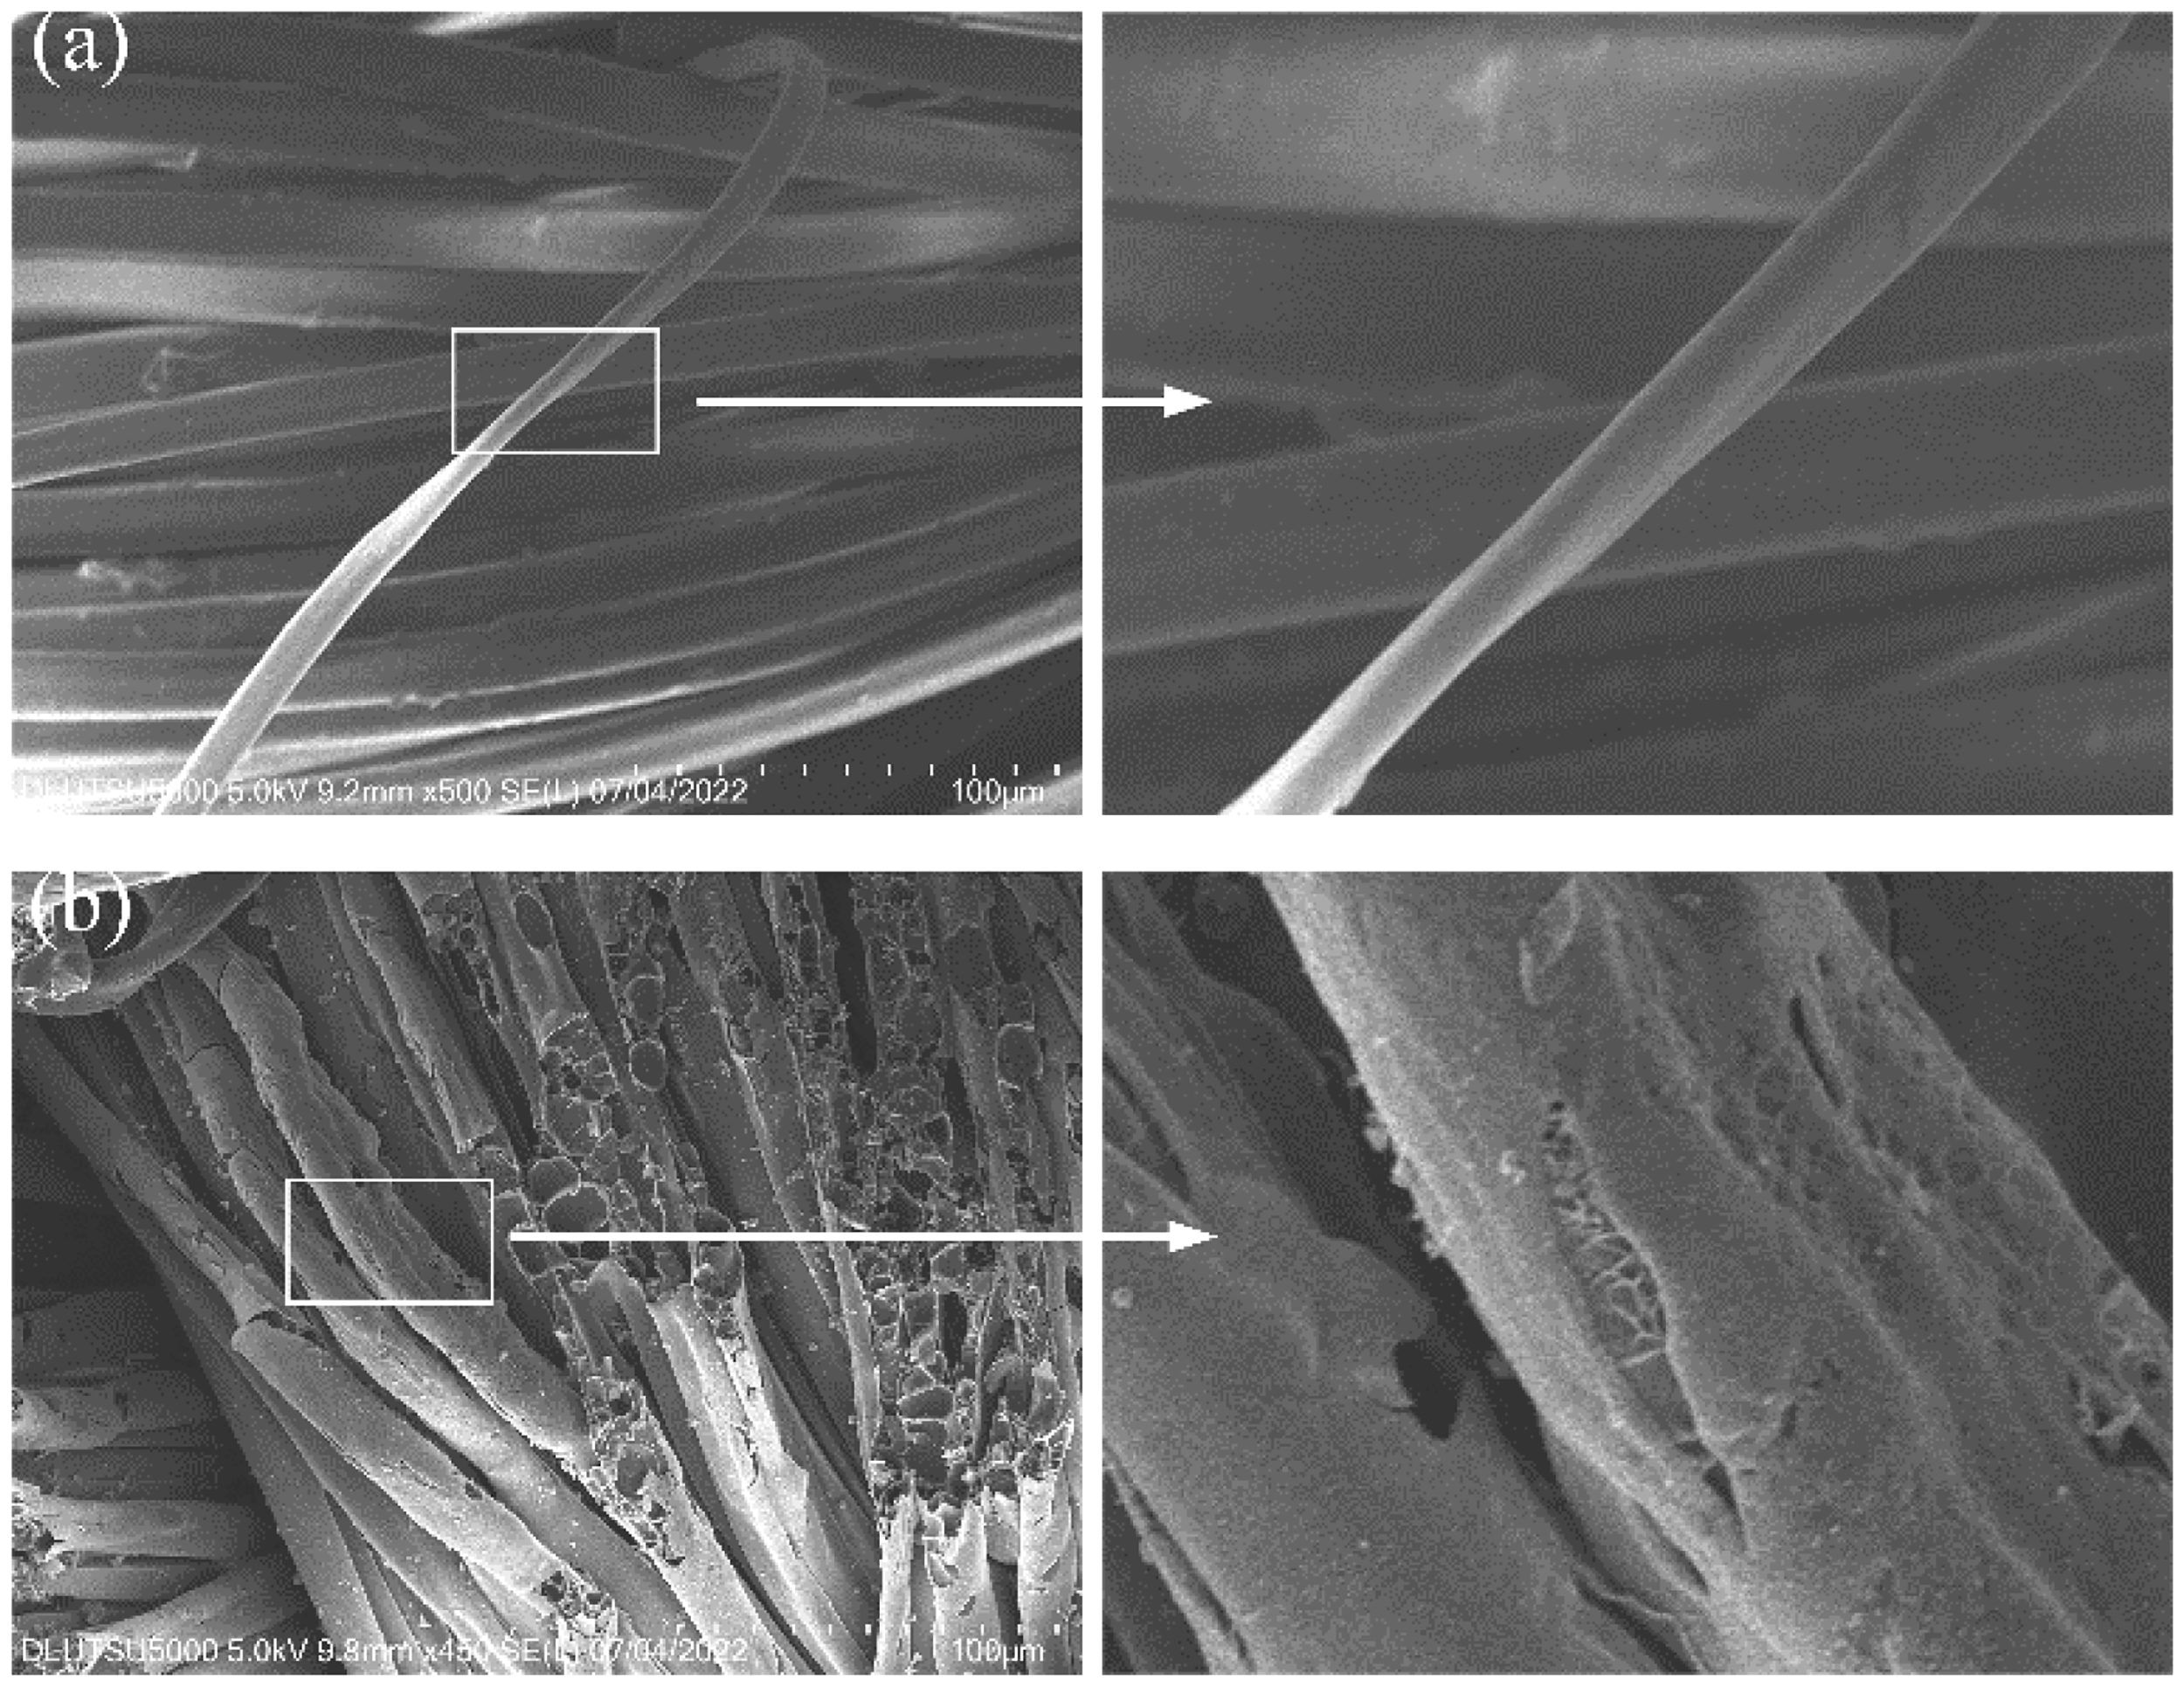
Fabric surface morphology before and after the arc: (a) before arc and (b) after arc.
Polyimide and aramid are high-strength fibers that can significantly increase the mechanical strength of fabric. They have a certain high breaking threshold in the face of arc explosion, so they can protect workers in the event of arc accidents. Comprehensive break open test results found that in the same test environment, the break open threshold of polyimide fabric was higher than aramid fabric, meaning that polyimide has a stronger mechanical property than aramid.
Protection failure mechanism analysis
After the arc generates, the surrounding temperature continues to rise. As shown in Table 1, the C–C bond in imide, the C–N bond between imide and aromatic ether, and the C–O bond in aromatic ether were broken first. The C–N bond order of the imine ring was 1.0431, which was easy to break to form the C–C bond and release a small amount of N2. The color of the polyimide fiber shown in Figure 14(a) changed from yellow to black, indicating that the imine structure of the chromophore group is destroyed. During the breaking of the molecular chain, the imide ring was broken along the C–N bond, and the decarbonylation reaction occurred. The O atom was mainly removed in the form of carbon dioxide (CO2) and carbon monoxide (CO). At the same time, the content of the carbon element in the fiber increases, and the fiber quality decreases. As the temperature continues to rise, the molecular structure continues to undergo the polycondensation reaction to form the benzene ring-type, aromatic heterocyclic compounds, noncarbon atoms were gradually removed. The network layer of the graphite-like structure increases until the fiber is completely carbonized and loses its protective properties. The carbonization process of aramid was similar to that of polyimide. Under the electric arc, the movement speed of the molecular chain was accelerated. The C–N bond and C–C bond in the amide bond were the first to break in the molecular chain. The C–N and C–C bonds at the chain end also broke with the temperature increase. After the molecular chain was broken, some compounds were cracked into hydrocarbons. With the escape of CO2, CO, ammonia (NH3), and other gases, the quality of the fiber decreases, finally the noncarbon elements in the aramid fiber were gradually removed, and the fiber was carbonized. However, the pyrolysis of the N–H bond in the amide bond will generate hydrogen cyanide (HCN) toxic gas, which is unfavorable to personnel wearing and working. The polyimide molecule contains an imide bond rather than an amide bond, so it will not produce toxic gas during pyrolysis. Moreover, polyimide has been used as a food-grade material that is harmless to humans. Therefore, from the perspective of health and safety, it is significant to apply polyimide to arc protection. The generation of the arc is accompanied by explosion impact force, the fabric fiber was simultaneously affected by the arc impact stress, and the internal structure of the molecule would break under the influence of the stress. The carbonized fiber produced cracks under the action of stress and expanded to the periphery, and finally macroscopically shown as fabric break open.
Abrasion resistance analysis
The abrasion resistance of the two fabrics was compared by the Martindale abrasion tester. The test temperature was 21°C, the humidity was 65%, the sample diameter was 38 mm, the nominal pressure was 12 kPa, and the friction times were 100. As shown in Figure 17, it can be seen that the surface of the polyimide fabric only changes slightly after friction, while the aramid fabric is covered with fiber balls, and the surface shape has been damaged. The abrasion resistance test results show that the abrasion resistance of polyimide fabric is better than that of aramid.
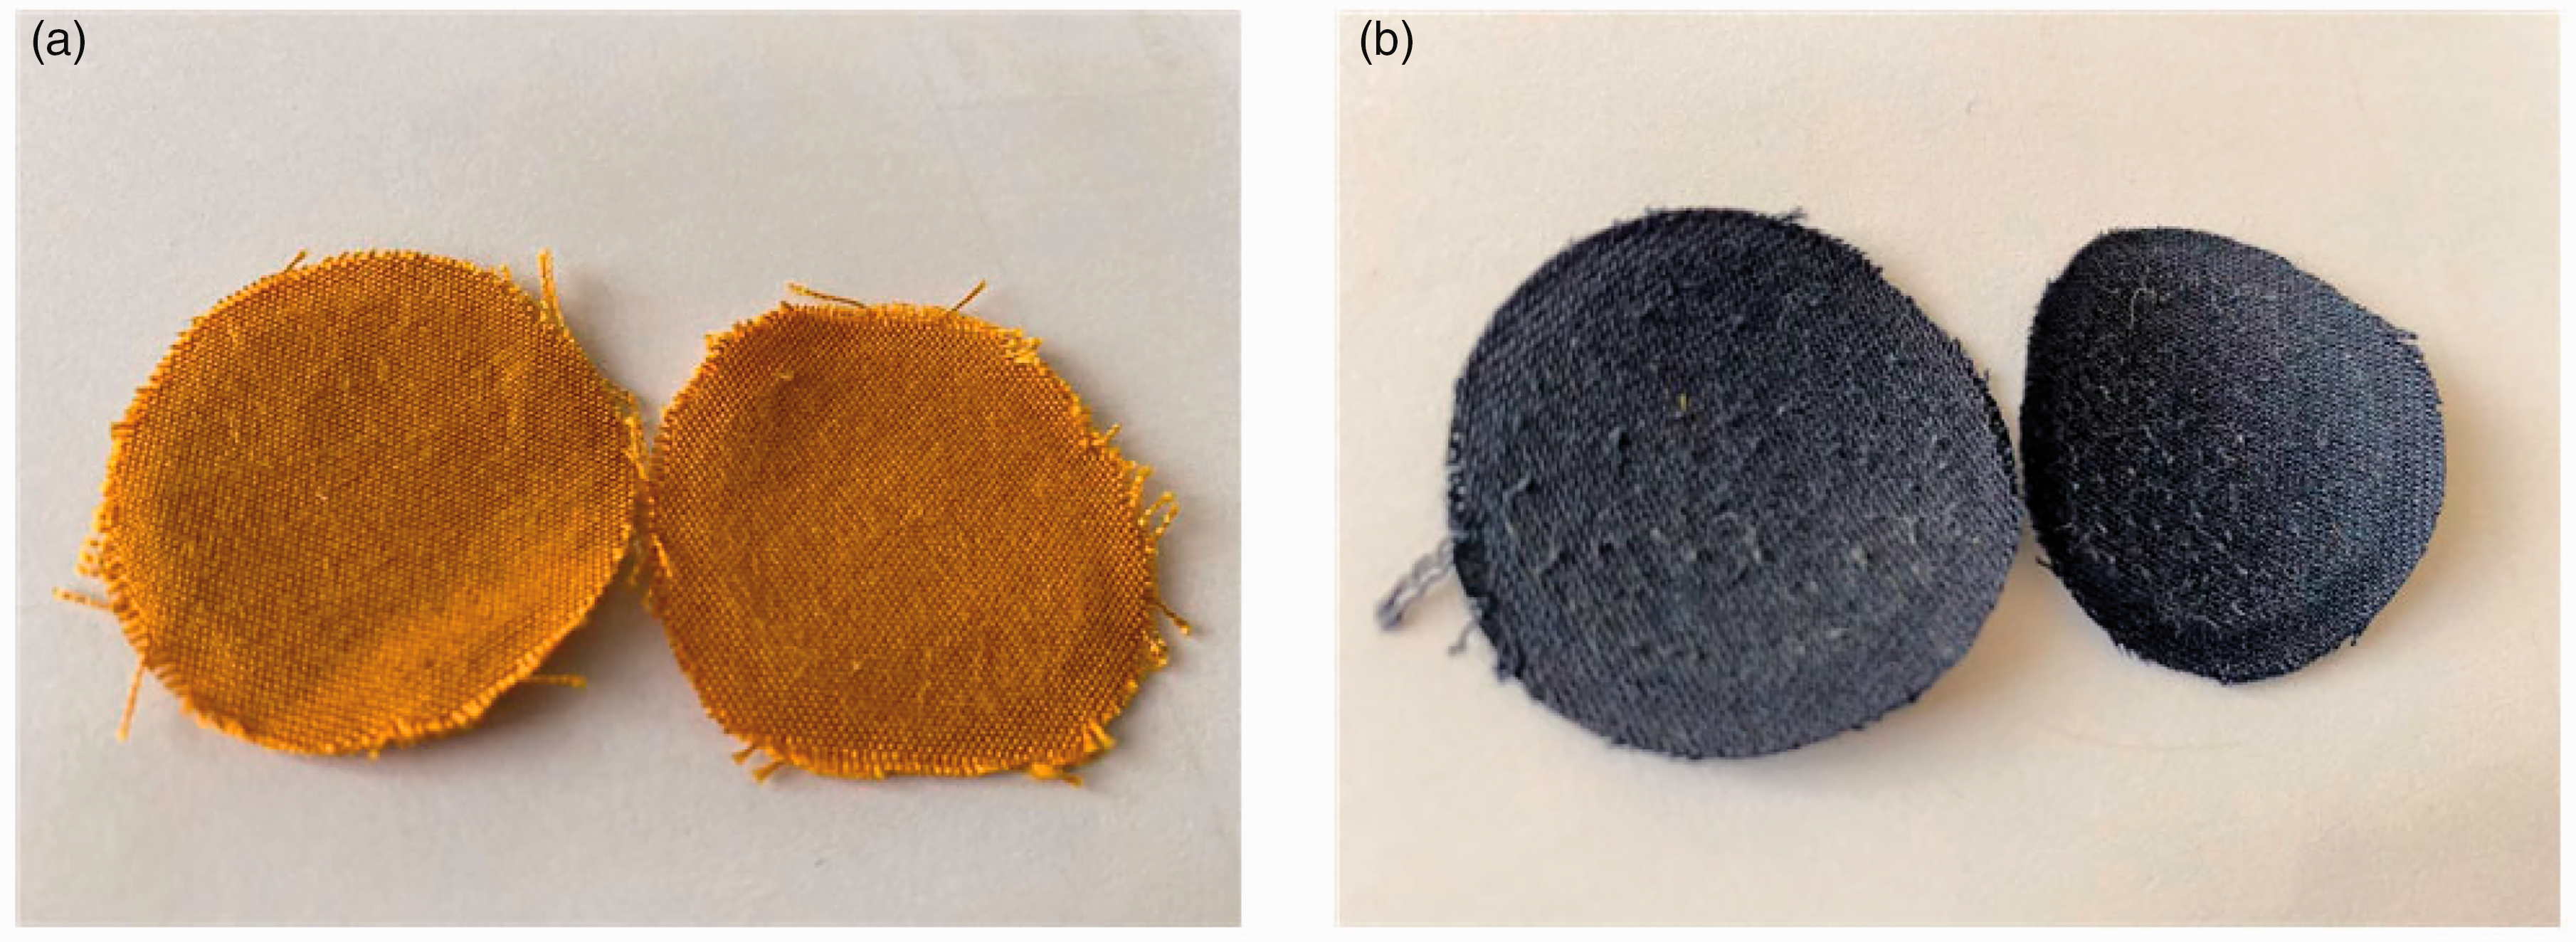
Polyimide and aramid fabrics after abrasion test: (a) polyimide and (b) aramid.
Conclusions
Through molecular dynamics simulation, the molecular modeling of polyimide and aramid was carried out, the bond order and glass transition temperatures of the two molecules was simulated and compared. The glass transition temperature of polyimide was 700 K and that of aramid was 540 K, the polyimide was higher than that of aramid. From the molecular point of view, the change trend of nonbond potential energy and CED was the same as that of the glass transition temperature. Polyimide has large molecular potential energy and intermolecular force, so it can keep the molecular chain structure unchanged at a higher temperature, showing better rigidity and heat resistance.
The arc energy at different currents was tested on the arc test platform in the laboratory. It was found that the temperature rise curve of the sensor at 3 kA current did not intersect with the Stoll curve, while the temperature rise curve of 4 kA and above current would pass over the Stoll curve, indicating that when the current level was 4 kA and above, people have the possibility of second-degree burns when exposed to the electric arc.
Electric arc tests were carried out on polyimide and aramid fabrics. In terms of thermal protection, the temperature rise data of the calorimeter sensor covered with polyimide fabric was less than that of aramid fabric; it demonstrated that polyimide has a better thermal insulation effect on arc energy than aramid fabric. As for rupture performance, polyimide fabric can resist the arcing action several times, meaning that the break open threshold is higher than that of aramid. The failure mechanism of the material was due to the carbonization and embrittlement fracture of the fabric under the action of arc high temperature and impact stress. The abrasion resistance test results show that polyimide has higher abrasion resistance.
Aramid is the most used material in arc protection at present. Compared with aramid, polyimide is better than aramid in both thermal protection and break open resistance. Therefore, it is proved that polyimide can be used as arc protection materials with better performance.
Footnotes
Acknowledgement
The author(s) acknowledge the support of Dalian University of Technology to the current work.
Declaration of conflicting interests
The author(s) declared no potential conflicts of interest with respect to the research, authorship and/or publication of this article.
Funding
The author(s) received no financial support for the research, authorship, and/or publication of this article.
