



Abstract
The purpose of this study was to analyze the influence of fabric properties and glove structure on the thermal protective performance of fire glove when exposed to a flash fire. Ten types of firefighting glove fabrics were selected, and nine types of gloves with four-layer fabrics were obtained for an orthogonal experiment. Different structures and sizes of gloves were also designed. The burn area and absorbed energy were tested using a flame hand system. Pearson correlations were established to analyze the relationships of fabric properties and absorbed energy, and of shrinkage rate and absorbed energy. The statistical analysis from these obtained data indicated that the thickness of fabric systems had no significant correlation for total absorbed energy (p > 0.05), while the flame retardancy, air permeability, and shrinkage rate of the outer shell fabric exhibited a strong relation (p = 0.033, 0.012, and 0.013, respectively). With the increase in glove looseness, the absorbed energy and burn area first decreased and then increased. The thermal protective performance was best at a looseness of 10 mm (by the largest absorbed energy reduction of 24%). It has been found that long gloves provide better thermal protection than short gloves. For short gloves, adding an elastic belt to the wrist can reduce the absorbed energy, while adding an elastic belt to the cuff for long gloves has a negative effect on the thermal protective performance.
Firefighters rely on their limbs to complete the rescue work during a fire rescue. In particular, hands are one of the most vulnerable parts,1,2 which often come in contact with objects at higher temperatures. Therefore, fire gloves are used to protect hands from high temperatures in a heat-disaster environment. To evaluate the thermal protective performance of firefighting gloves, international standards have been developed, mainly the EN 659 (Protective gloves for firefighters) and NFPA 1971 (Standard on protective for structural fire fighting and proximity fire fighting). Its construction is designed with multilayer fabrics, including outer shell, moisture barrier, and thermal liner. This kind of multilayer structure can provide high heat resistance, significantly improving the insulation performance of gloves. The methods for thermal protective property can be broadly classified into the bench scale test and the flame manikin test.
A thermal protective performance (TPP) test is widely used in most studies. However, only the fabric can be tested and only the heat transferred during heat exposure is considered. 3 The correlation between the bench scale test and flame manikin test has been discussed in some of the literature.4,5 Studies have shown that the structure, size of clothing, and body posture can affect the shrinkage level, and the thermal shrinkage of fabric can not fully reflect the shrinkage behavior of clothing.6–8 Therefore, there is no uniform conclusion on the correlation between the two test protocols. In addition, the air gap size is constant in the TPP test, while unevenly distributed when wearing gloves. Xiaohui et al. 9 extracted the size and distribution of the air gaps of the clothing using a three-dimensional (3-D) laser scanning facility. The TPP values of fabric in different air thicknesses and the air gap distribution under clothing were matched and integrated to obtain evaluation indexes for the clothing TPP evaluation. The above research indicates the necessity to explore thermal protection of gloves in wearing situation. In the actual wearing process, the thermal protection performance of gloves does not only depend on the properties of the fabric, factors such as cutting and design in the glove production process should also be considered.10–12 According to ISO 13506, testing a garment one size larger than the standard will reduce the total energy transferred and percentage body burn by about 5%. 13 Jun et al. 14 found that the more fitted the clothing, the worse the thermal protection performance under the same fabric condition. Mah et al. 15 found that the design of a tight elastic belt in fire clothing led to heat accumulation on the hips, which caused burns. The size and structure of gloves will affect the size and distribution of air gap, and make a great impact on heat insulation.16,17
Some work has been performed to understand the thermal protective performance of garments. Research on fire gloves has not been reported. To evaluate the thermal protective performance of fire gloves more comprehensively and objectively, the flame hand system was used to measure the secondary and third burn areas and the absorbed energy of different gloves. Analysis of the factors affecting the thermal protective performance was carried out, from fabric properties to structural characteristics of gloves. The findings of this study may provide references for the structure design, fabric, and size selection of thermal-protective gloves.
Experimental methods
Experimental materials and instruments
The commercially available, commonly used, and high performance fabrics in the fire gloves field were selected. Three types of outer shell fabrics (A1: aramid IIIA fabric, A2: aramid 1313 and aramid 1414-blended fabric, A3: double-layer fabric), three types of moisture barrier fabrics (B1: polytetrafluoroethylene (PTFE) membrane, B2: TPU coated nonwoven fabric B3: TPU membrane), three types of thermal liners (C1: aramid 1313 felt, C2: pre-oxidized fiber felt, C3: polysulfonamide felt) and one type of inner fabric (aramid 1313 and flame-retardant viscose-blended fabric) were chosen. The specification parameters of the single-layer fabric are listed in Table 1. The specification parameters of the nine types of glove combination fabrics obtained by the orthogonal experiments are listed in Table 2. All fabrics were preconditioned for 24 h under standard conditions of 21°C and 65% relative humidity before testing.
Specification parameters of single-layer fabrics

PTFE: polytetrafluoroethylene; TPU: thermoplastic polyurethane.
Specification parameters of multilayer fabric

The test devices included an electronic balance (Shenyang Longteng Electronics Co., Ltd) and YG(B) 141D digital fabric thickness gauge (Wenzhou Fangyuan Instrument Co., Ltd), YG026PC-250 electronic power machine (Wenzhou Fangyuan Instrument Co., Ltd), FFZ671 glove cutting resistance testing machine (Wenzhou Fangyuan Instrument Co., Ltd), YG026-III electronic strength machine (Wenzhou Fangyuan Instrument Co., Ltd), FX3300IV air permeability tester (Lippo Scientific Equipment Co., Ltd), YG(B) 815D-I vertical combustion apparatus (Wenzhou Dairong Textile Instrument Co., Ltd), TPP tester (Custom Scientific Instrument Corporation), and flame hand burn prediction system (Northwest Testing Technology Company) were used.
Size and structure of fire gloves
Common fire glove styles were selected. The simplest structure is that of a short mitten, which is represented as N1 in Figure 1 (the front of the glove is the palm side, and the back of the glove is the back of the hand). The other glove structures are illustrated in Figure 2. Compared with N1, an elastic belt was added at the wrists in N2, and sleeves were lengthened by 7 cm in N3. For N4, the sleeves were lengthened by 7 cm and had elastic belt at cuffs. The size of gloves has been selected, referring to the national standards of “GB/T 16252-1996. Adult hand size” and “GA 7-2004. Fire glove.” Using the length and width of the hand as the size division index and grading by 10 mm, four different looseness values of 0 mm, 10 mm, 20 mm, and 30 mm were set on the overall length (the length from the middle finger to the bottom of the sleeve) and circumference (wrist, palm, and cuffs) of the gloves with N1 structure. The glove that fits the flame hand is marked as M1, which has a looseness value of 0 mm, and the detailed dimensions of the glove are shown in Table 3. The gloves with increased dimensions of 10, 20, and 30 mm compared with M1 indicate M2, M3, and M4, respectively.

Structure of mitten short glove.

Style of different structure gloves.
Specifications and parameters of gloves

Test of fabric properties
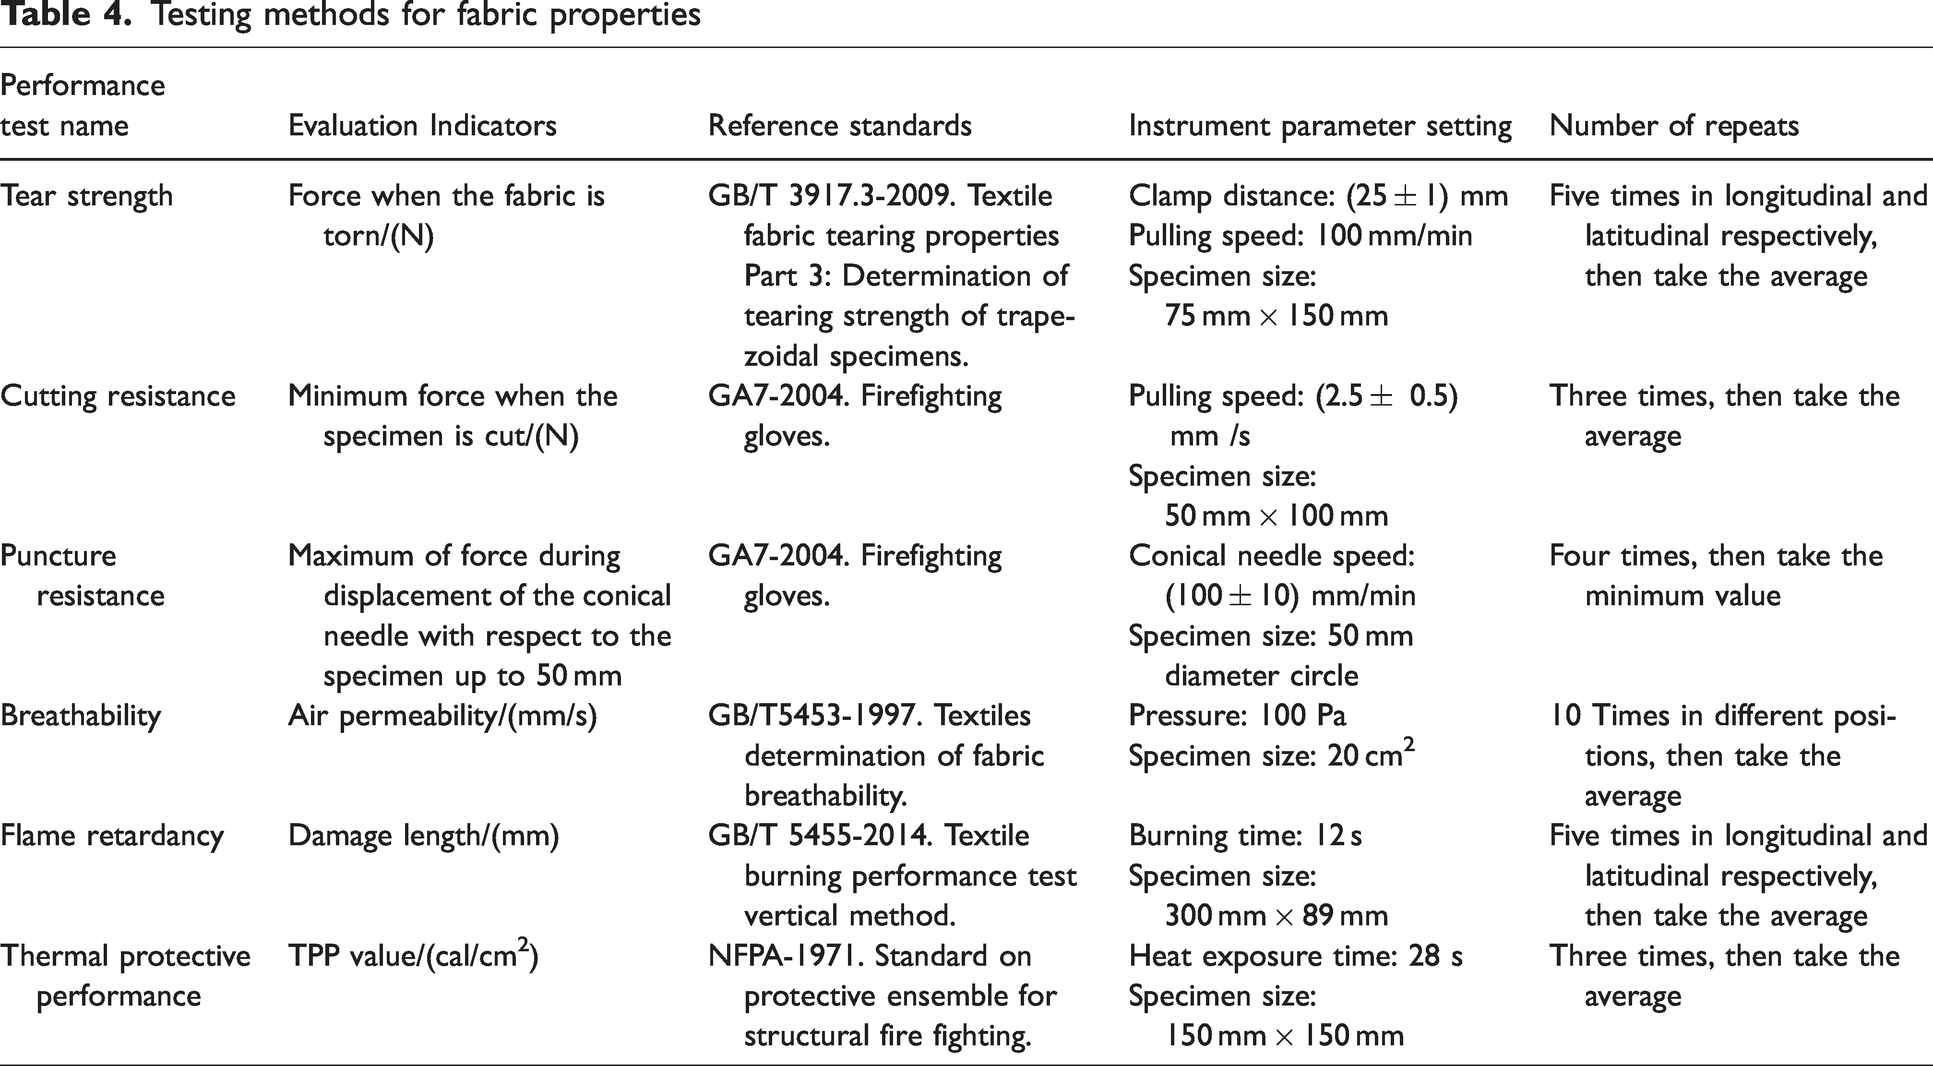
According to the requirements of “GA7-2004. Fire gloves,” the relevant properties of the fabric are tested, and the test method is shown in Table 4.
Testing methods for fabric properties
Test of thermal protective performance of gloves
According to ASTM F1930-11 and ISO 13506-2008, fire gloves were tested using a flame hand-burn prediction system, as illustrated in Figure 3. The flame hand was divided into 10 pieces, five pieces on the palm surface and five pieces on the back of the hand, each piece with a sensor. The heat-flux range of each sensor was 84 ± 15% kW/m2. The exposure duration for the samples was 12 s. The heat flux data of 10 sensors were recorded every 0.25 s by the data acquisition system and predicted the burn according to Henriques burn integral method. 14 The total absorbed energy, degree of burn, and burn area were obtained.

Flame hand system.
The overall shrinkage of the gloves in length and circumference was measured with a soft ruler after the burning test. The measurement sizes included the front glove length, back glove length, front thumb length, back thumb length, thumb circumference, palm circumference, wrist circumference, and cuff circumference. The size difference between these parts before and after burning was calculated, and the shrinkage of the different parts was obtained. The local shrinkage rate of the gloves was measured by the imprinting method,
18
in which a circular seal with a diameter of 5 cm was printed on the corresponding part of the sensor on the gloves. There are four directions on the seal: transverse, vertical, left oblique, and right oblique. The printed gloves are shown in Figure 4. The diameter change of marks in all directions after combustion was measured and the shrinkage rate of gloves at each sensor position was obtained. The shrinkage rate, S, was calculated according to equation (1)

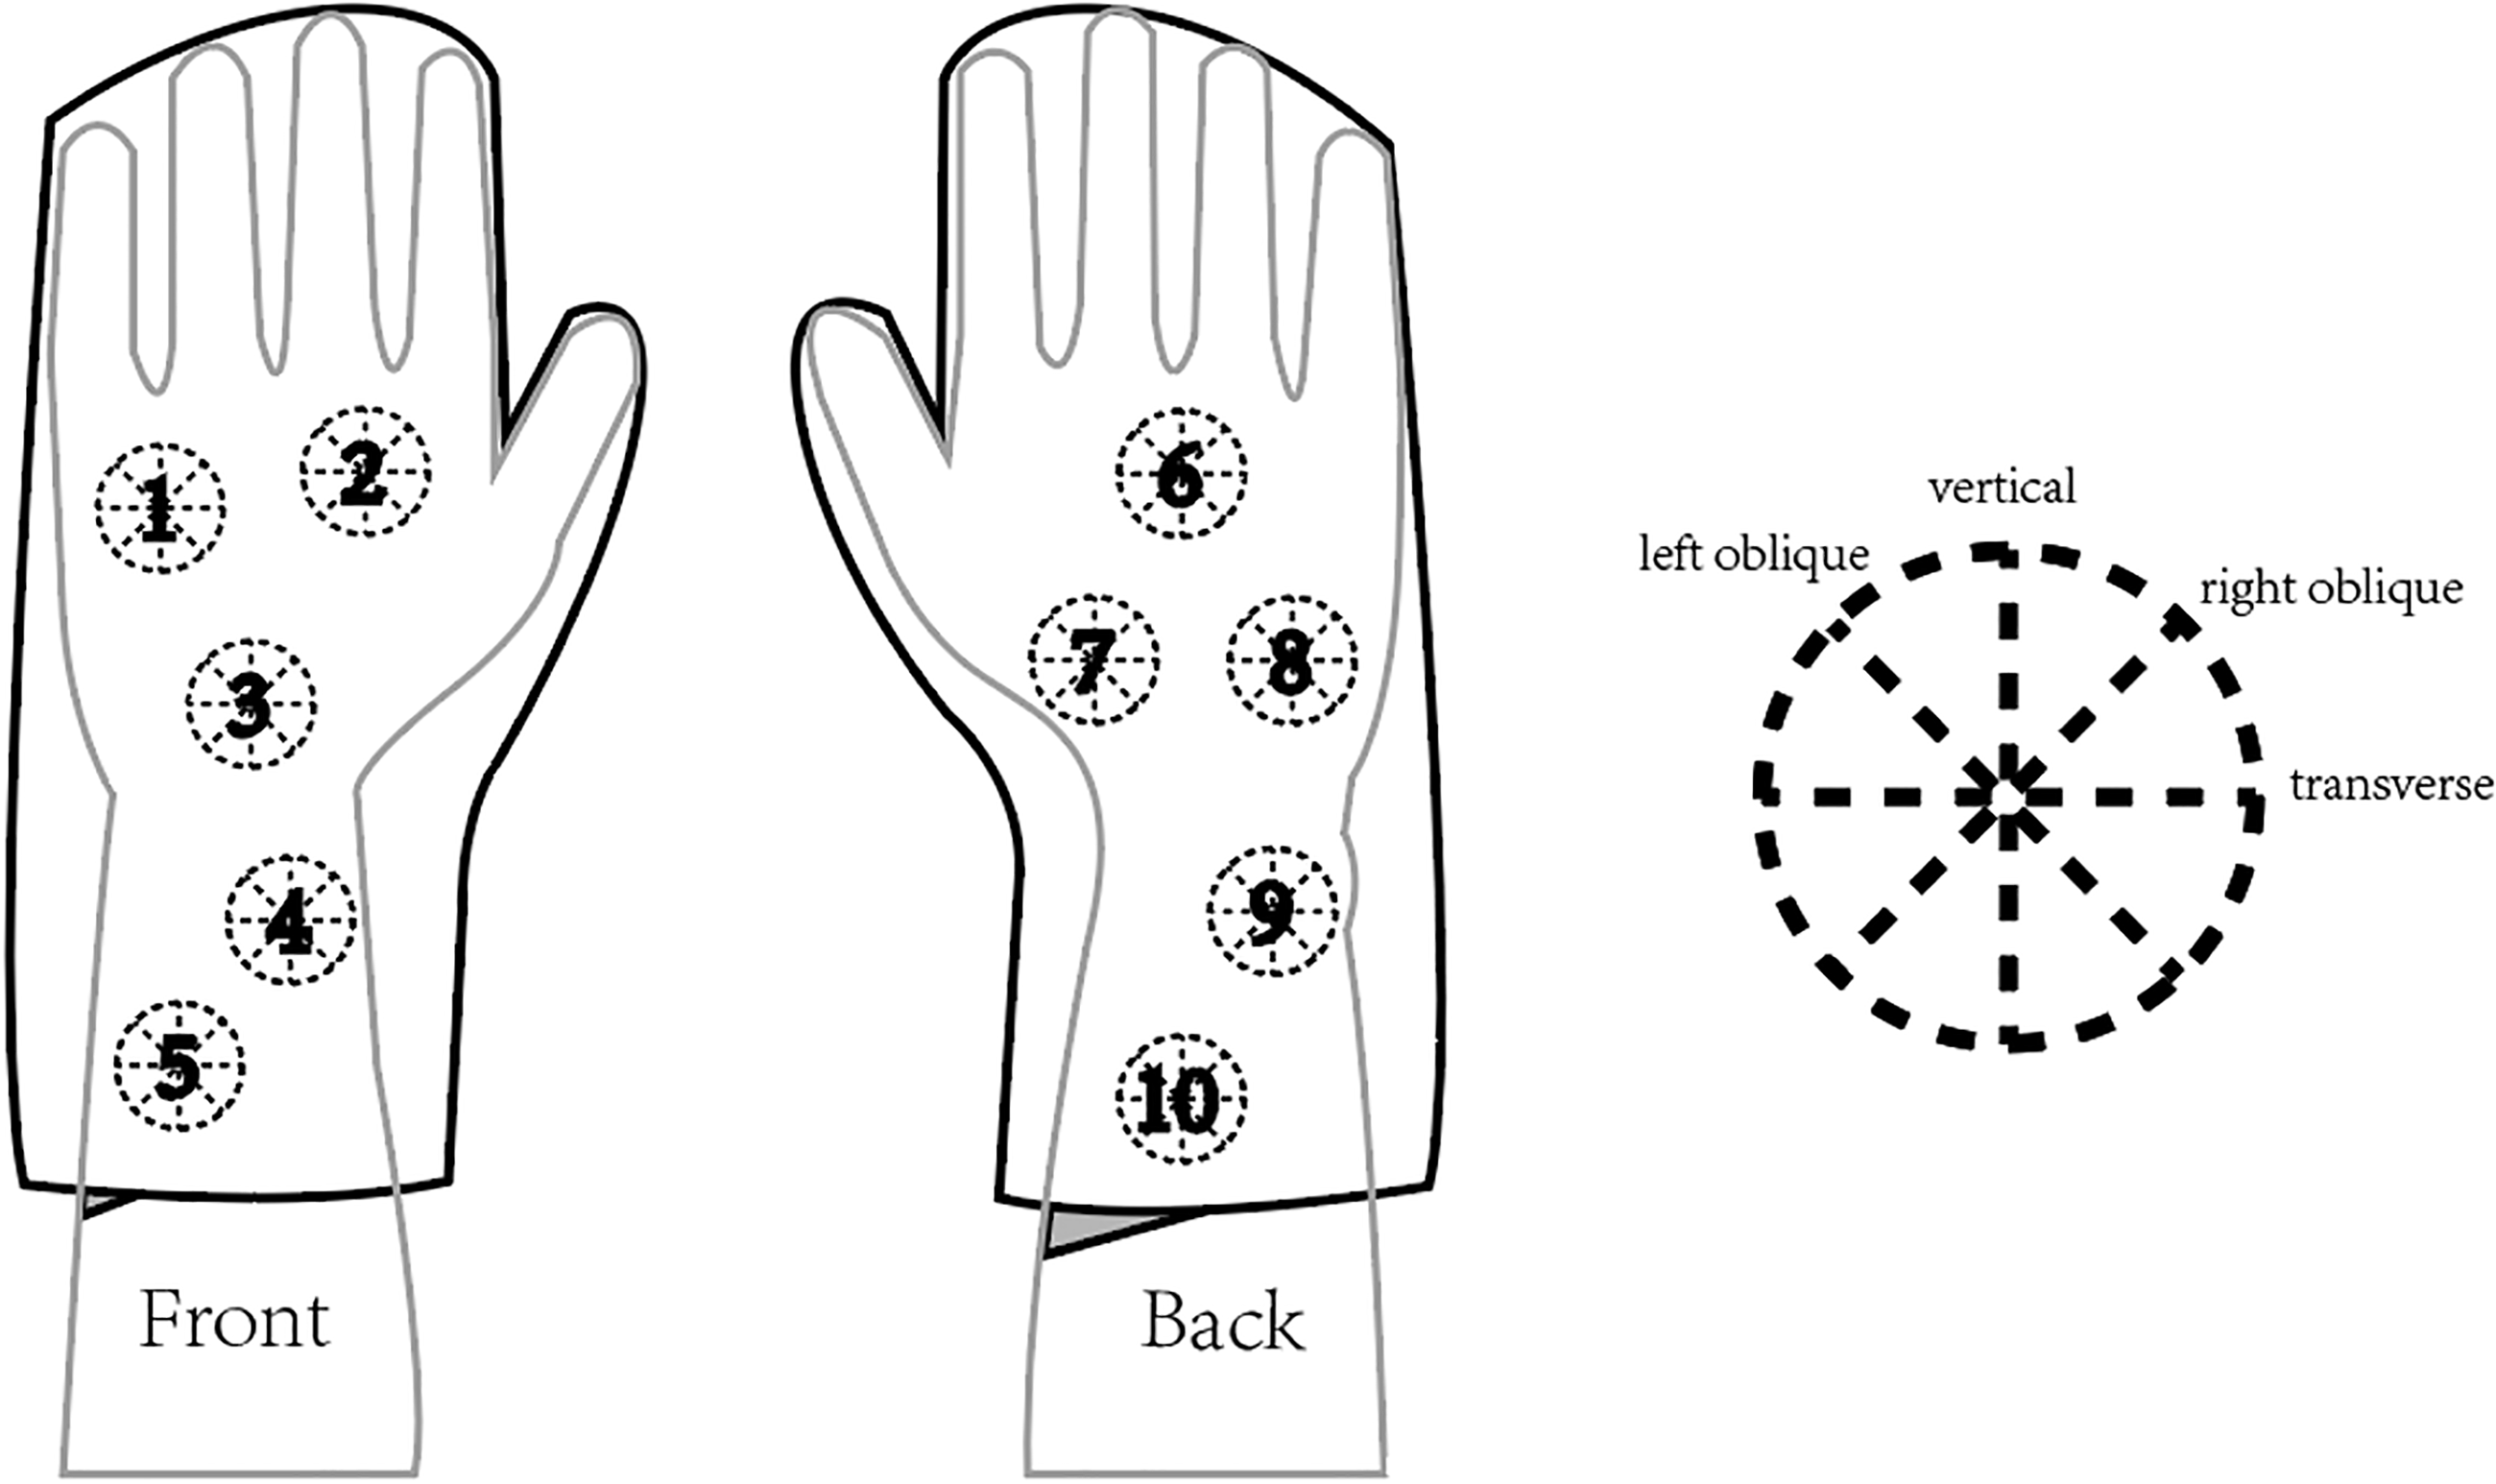
Seals on glove specimen.
The gloves were weighed before the combustion test and recorded as m0 (g). The gloves were weighed again after the combustion experiment and recorded as m1 (g). The mass loss rate (M) of the gloves after combustion was calculated using equation (2)

Results and discussion
Properties analysis of fabric
The test results of flame retardancy, air permeability, and mechanical properties of the three outer shell fabrics are shown in Table 5. All fabrics meet the requirements of “GA7-2004. Fire gloves.” In the flame retardancy test, A2 containing a large amount of Kevlar fiber has the smallest damage length. The fabric thickness and weight was identified as the main factor in mechanical properties. A1, lightest and thinnest, with the worst mechanical properties among the three fabrics.
Properties test results of outer fabric

SD: standard deviation.
The TPP values and second-degree burn time of nine four-layer assembly fabrics are shown in Table 6. The TPP value of each sample is concentrated between 30–45 cal/cm2, which is much higher than 28.0 cal/cm2 required by the second class of the “GA 7-2004. Fire gloves” standard. Except for Z6 and Z9, the rest meet the highest level of the third class requirements, and can provide good thermal protection for firefighters' hands. Z6 showed the smallest TPP value and Z8 provided the best thermal protection. Statistical results showed that the TPP value had significant correlation with fabric weight (r = 0.718, p < 0.05).
Test results of TPP and second-degree burn time

Performance analysis of gloves with different fabrics
Thermal protective performance
Different types of four-layer fabrics were sewn into the fitted gloves with an N1 structure. The appearance of the sewn glove is shown in Figure 5. The burn area and absorbed energy of the nine gloves after the flash fire exposure are shown in Figure 6 (grade I burns were not included in burn area statistics). The total absorbed energy includes the heat transferred from the heat source during exposure and the heat released during cooling.
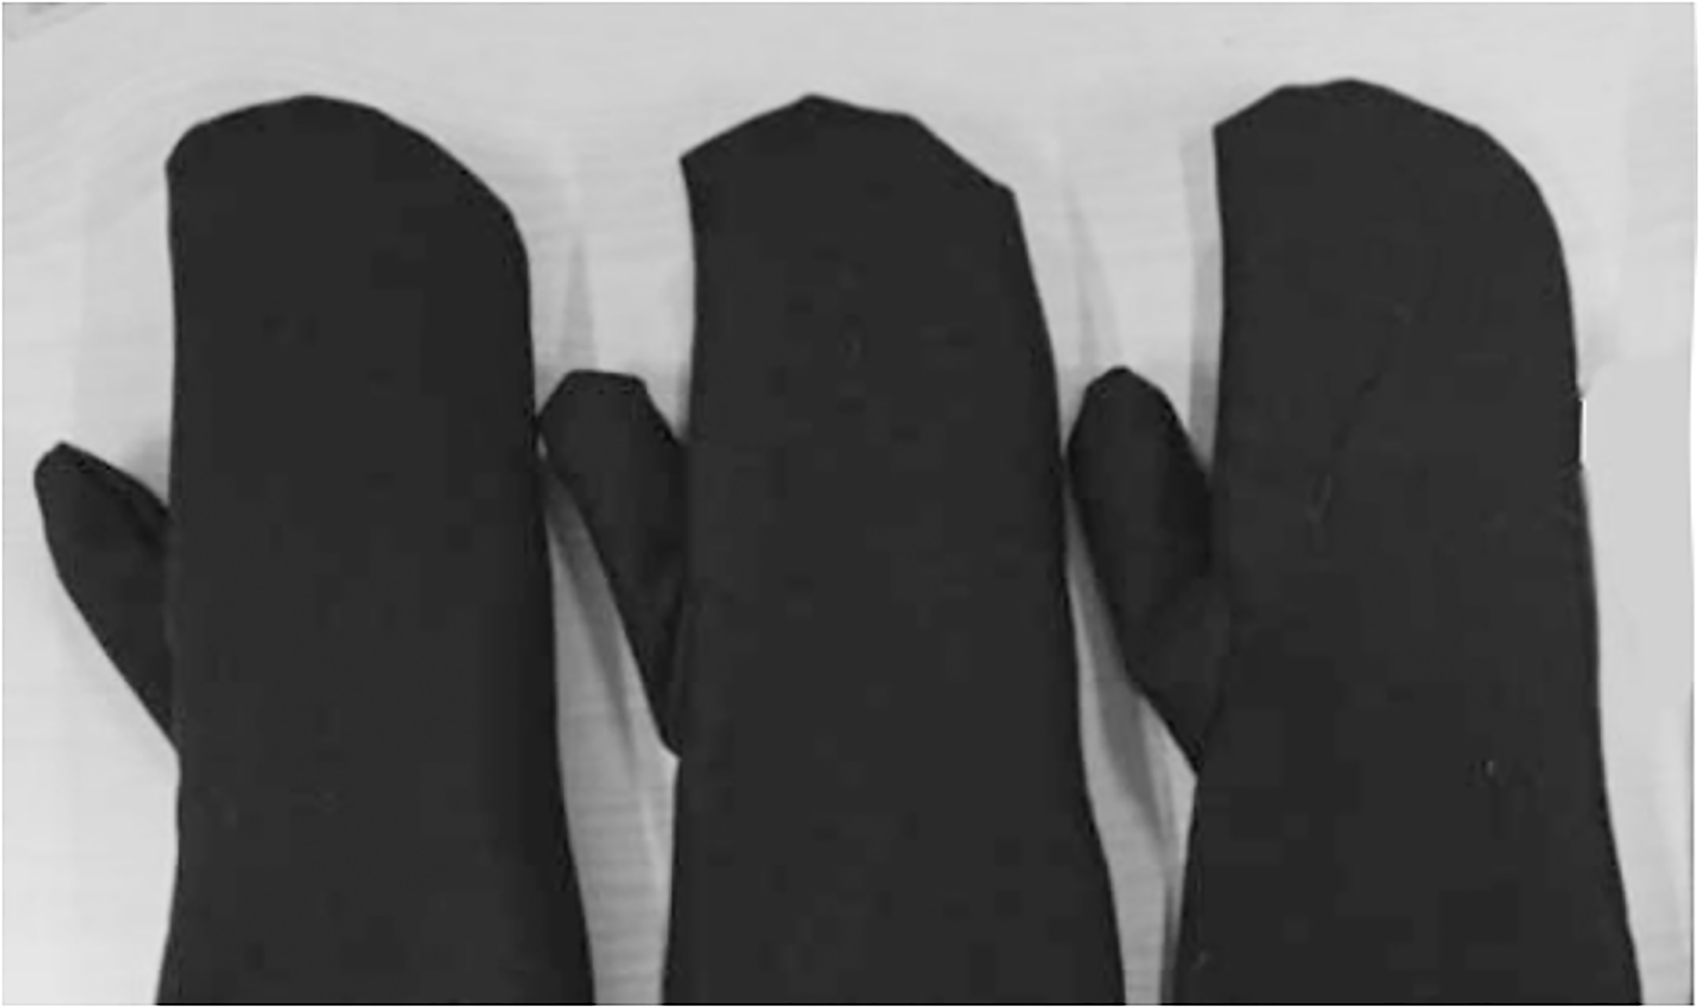
Appearance of sewn glove.

Absorbed energy and burned area for different fabrics gloves.
The thermal protective performance of fire gloves uses the total absorbed energy as an index. The higher the absorbed energy, the worse is the thermal protective performance. As can be seen from Figure 5, the total absorbed energy of nine gloves was in the order Z1 > Z8 > Z2 > Z7 > Z4 > Z9 > Z5 > Z6 > Z3. The total absorbed energy and burn area of Z1, Z2, and Z8 with the outer shell of the double-layer fabric were larger than those of Z3, Z4, and Z5 (the outer shell was aramid 1313 and aramid 1414-blended fabric) and Z6, Z7, and Z9 (outer shell aramid IIIA), indicating that the double-layer fabric had the worst thermal protection performance. Z3 exhibited the best thermal-protective performance with the lowest absorbed energy and lightest burn degree. This is different from the results of TPP test. This is because the air gap size remains constant throughout the TPP test process, while it may be changed in the flame hand test due to thermal shrinkage of the fabric. There is also the fact that only the heat transferred during heat exposure is considered in TPP test, while the total absorbed energy in the flame hand experiment includes the cooling stage.
Analysis of variance (ANOVA) of the total absorbed energy with the outer shell, moisture barrier, and thermal liner was used to explore whether the four-layer fabric has a significant effect on the thermal protective performance of gloves, is listed in Table 7. The results indicate that outer shells have a statistically significant effect on the absorbed energy (p = 0.001< 0.05), whereas changing the moisture barrier and thermal liner variety had no obvious effect on the absorbed energy (p = 0.467 and 0.720, respectively).
Multi-factor analysis of variance

Sig.: significance.
aR2 = 0.760 (adjusted R2 = 0.629).
We needed to further analyze the relationship between the thermal protective performance of the gloves and the fabric properties. According to the ANOVA results, the correlation between the total absorbed energy and fabric properties (flame retardancy, air permeability of the outer fabric, and the weight and thickness of the multilayer fabric) was analyzed, as shown in Table 8. The total absorbed energy was significantly positively correlated with the flame retardancy and air permeability of the outer fabric, and their Pearson correlation coefficients (r) were 0.747 and 0.789, respectively. When the outer shell fabric was A2, with good flame retardancy, the thermal protective performance of the gloves was better. In contrast, when the outer shell was A1 and A3, with poor flame retardancy, the thermal protective performance was lower. In particular, for A3, the air permeability is much higher than for A1 and A2, the fabric pores are larger, the heat penetrates the fabric more easily, and its thermal protection is the worst among the nine types of gloves. Therefore, improving the flame retardancy and reducing the air permeability of the outer shell fabric of the glove is conducive to improving the thermal-protection efficiency. The thickness and weight of four-layer fabrics did not significantly affect the total absorbed energy of the glove. The same conclusion has been found in some research.19,20 The fabric assemblies not only transmit heat from the source to the skin during exposure, they can also store thermal energy during exposure and release the energy to the skin after the exposure. Therefore, the shorter exposure time with the stored energy released can result in skin burn compared with the traditional TPP approach. The thicker the fabric, the better the heat insulation, which is beneficial to improve TPP. However, a large amount of thermal energy stored in the system can reduce significantly the level of protection expected from wearing a protective glove. As a result, when considering the stored energy, the thermal protective performance was not related to the thickness and weight of the fabric.
Correlation between absorbed energy and fabric properties

To further understand the heat transfer mechanism of the fire gloves, the heat flux profiles measured by the simulated skin sensors were examined. As shown in Figure 7, the heat flux curves of all gloves show a trend of first increasing and then decreasing. During the 12 s flash exposure, the heat flux increased slowly. The heat flux of most gloves was at a very low level after the gas burners were turned off. This indicates that many sensors had not yet reached burn. Based on the above analysis, the percentage of burn area and total absorbed energy were mainly determined by the change of heat flux after the gas burners were turned off. This comes from the heat accumulated in the glove. It is also a good indication that heat accumulation reduces the positive effect of glove fabric thickness and weight on thermal protection. The three stages are divided as follows.

Heat flux curves of gloves with different fabrics.
Stable period
The heat flux remains almost unchanged in the first few seconds. This is because it requires time for the fabric to absorb heat and transfer it to the simulated skin sensor. The heat flux curve of each glove begins to rise at a different time, mostly between 8–10 s; only Z2 was 24 s. However, Z3, Z4, and Z5 lack such a stage, and the heat in the flash fire reaches the simulated skin sensor quickly, which is related to the flame retardancy of the outer shell fabric. It can be seen from Table 5 that A1 and A3 have poor flame retardancy, and are easy to ignite in the flame. The burned outer shell removes the heat through smoke and carbonization, delaying the time for heat to reach the simulated skin. 21 Therefore, the gloves with the outer shell of A1 and A3 show good thermal insulation in the early stage under flash fire exposure. Z2, with the A3 outer shell and a moisture barrier of TPU laminated on a nonwoven cloth, a large amount of air in the nonwoven fabric improves heat insulation, the heat flux curve increases within 24 s.
Growth period
The fabric absorbs heat constantly, and heat is transferred to the simulated skin surface. And the heat flux continues to increase after the gas burners are turned off. This is mainly due to the slow heat loss to the confined non-ventilated environment of the flame hand tests, temperatures in the sealed room keep on increasing for a certain time period after the gas burners are turned off. The heat flux of all the gloves increased continuously within a few seconds after combustion and reached a maximum in approximately 20 s. The heat flux profiles of gloves with the outer shell of A3 exhibited a high and sharp peak (8.0–10.8 kW/m2). This is because of the poor flame retardancy and leads to fabric breakage during flash exposure. The damaged fabric cannot provide thermal protection, causing a reduction in heat insulation and heat quickly passes through the fabric to the simulated skin sensor. Z3, Z4, and Z5 maintain the integrity of the glove in the flame. They provided continuous thermal protection, and the heat flux curve increased slowly, with a peak of only 3.5– 4.0 kW/m2.
Decline period
The heat flux decreases rapidly after reaching the peak. This is due to the fact that only a small amount of stored energy is left in the fabric systems and the heat reaching the simulated skin sensor decreases.
Shrinkage analysis after fire exposure
Figure 8 shows the appearance of the glove before and after the exposure. We can observe that the surface of the fabric has a large area of fading, partial carbonization blackening and significant shrinkage after the burning experiment. The different parts of the glove exhibited different degrees of shrinkage deformation. 22 In this study, the thermal shrinkage of gloves was studied from two perspectives: size shrinkage and printing shrinkage. The measurement results of size shrinkage are listed in Table 9.

The protective glove (a) before the exposure and (b) after the exposure.
Shrinkage of gloves size (cm)

In the circumference direction, the palm and wrist had the most significant contraction, with an average of approximately 1.7 cm, followed by the cuff. The thumb circumference showed no obvious contraction. Comparing the glove size with the flame hand, it can be seen that the contraction at the palm circumference severely restricts the movement of the hands. In the length direction, the front glove length contracted significantly, and most of the contractions were 4–7 cm. The thumb length contraction was minimal, with an average contraction of 0.5 cm. Shrinkage in the length direction was greater than that in the circumference. This difference is caused by the available surface for shrinkage. The shrinkable amount is greater in the length direction under flash fire, whereas the shrinkable amount is relatively less in the circumference direction owing to the limitation of the flame hand size. There is no shrinkage on the back of all gloves. This may be related to the geometry of the hand, because the back of the flame hand is flat and raised, causing the fabric to be stretched in these areas. The loading force withstood by the fabric in these regions was higher, resulting in less shrinkage. 23 Therefore, fire gloves should focus on strengthening the front of the glove or splicing fabrics with better thermal stability to prevent thermal shrinkage deformation from restricting hand movement.
Size shrinkage reflects the change in the glove silhouette. Glove deformation occurred locally; therefore, the local shrinkage of gloves at various sensor sites was measured by means of imprinting (Table 10). No shrinkage was observed on the back, and only the front surface was recorded.
Shrinkage rate of seals

The gloves had different degrees of shrinkage with Nomex fibers in the outer shell. Z3, Z4, and Z5 with the outer shell of the Nomex/Kevlar blend, which have good thermal stability in flash fires and no shrinkage. This means that although Nomex and Kevlar are both high-temperature resistant fibers, the Kevlar fibers have better thermal stability and stronger resistance to heat shrinkage deformation. 24 In addition to the influence of fiber type on thermal shrinkage, fabric structure is also very important. 25 The average shrinkage rate of each glove was obtained by calculating the average shrinkage rate of the five parts of the glove. It can be seen that gloves with an outer shell of A3 (Z1, Z2, and Z8) exhibit more shrinkage. A3 is heavier and thicker than A1, but its air permeability is also much higher than that of A1, indicating that the fabric is fluffier and more porous. Therefore, if there is more space for shrinkage between yarns, then the fabric shrinks more under flash fires. From the perspective of different positions of glove, the contraction at positions 4 and 5 is more significant than other places because the fire source is closer to the arm, and positions 4 and 5 are close to the opening. Therefore, the absorption of heat is greater because they are vulnerable to the effect of air convection heat transfer, causing a significant contraction. From the perspective of contraction direction, the shrinkage rates in the transverse, vertical, left oblique, and right oblique directions of the gloves were obtained by taking the average shrinkage rate in the same direction in each of the five parts of the glove, as shown in Figure 9. The shrinkage rate of each glove is different in all directions. The difference was related to the unstable characteristics of the flame, geometry of the hand, and the structure of the fabric itself.

Shrinkage rate in four directions.
Mass loss analysis after fire exposure
The mass loss rates after the combustion tests of the nine gloves are shown in Figure 10. Z6 and Z9 had the highest value. Although there was similar mass loss rate between Z6 and Z9, different fabric properties were found. Therefore, these two kinds of fabric were also analyzed separately .They are likely to lose mass, both through moisture evaporation and by evolution of volatile degradation products. As for Z6, the thickness of the insulation layer is large, a large number of pores contain a lot of water, and the water evaporates after thermal exposure. For Z9, the thinnest fabric, poor resistance is shown to high temperature, and the fabric pyrolysis is serious at high temperature. Moreover, it was found that the gloves with B1 had a lower mass loss, indicating that it is not easy to pyrolyze in a high-temperature environment. The mass loss in gloves B3 and B2 was the largest when the outer layer was A1.
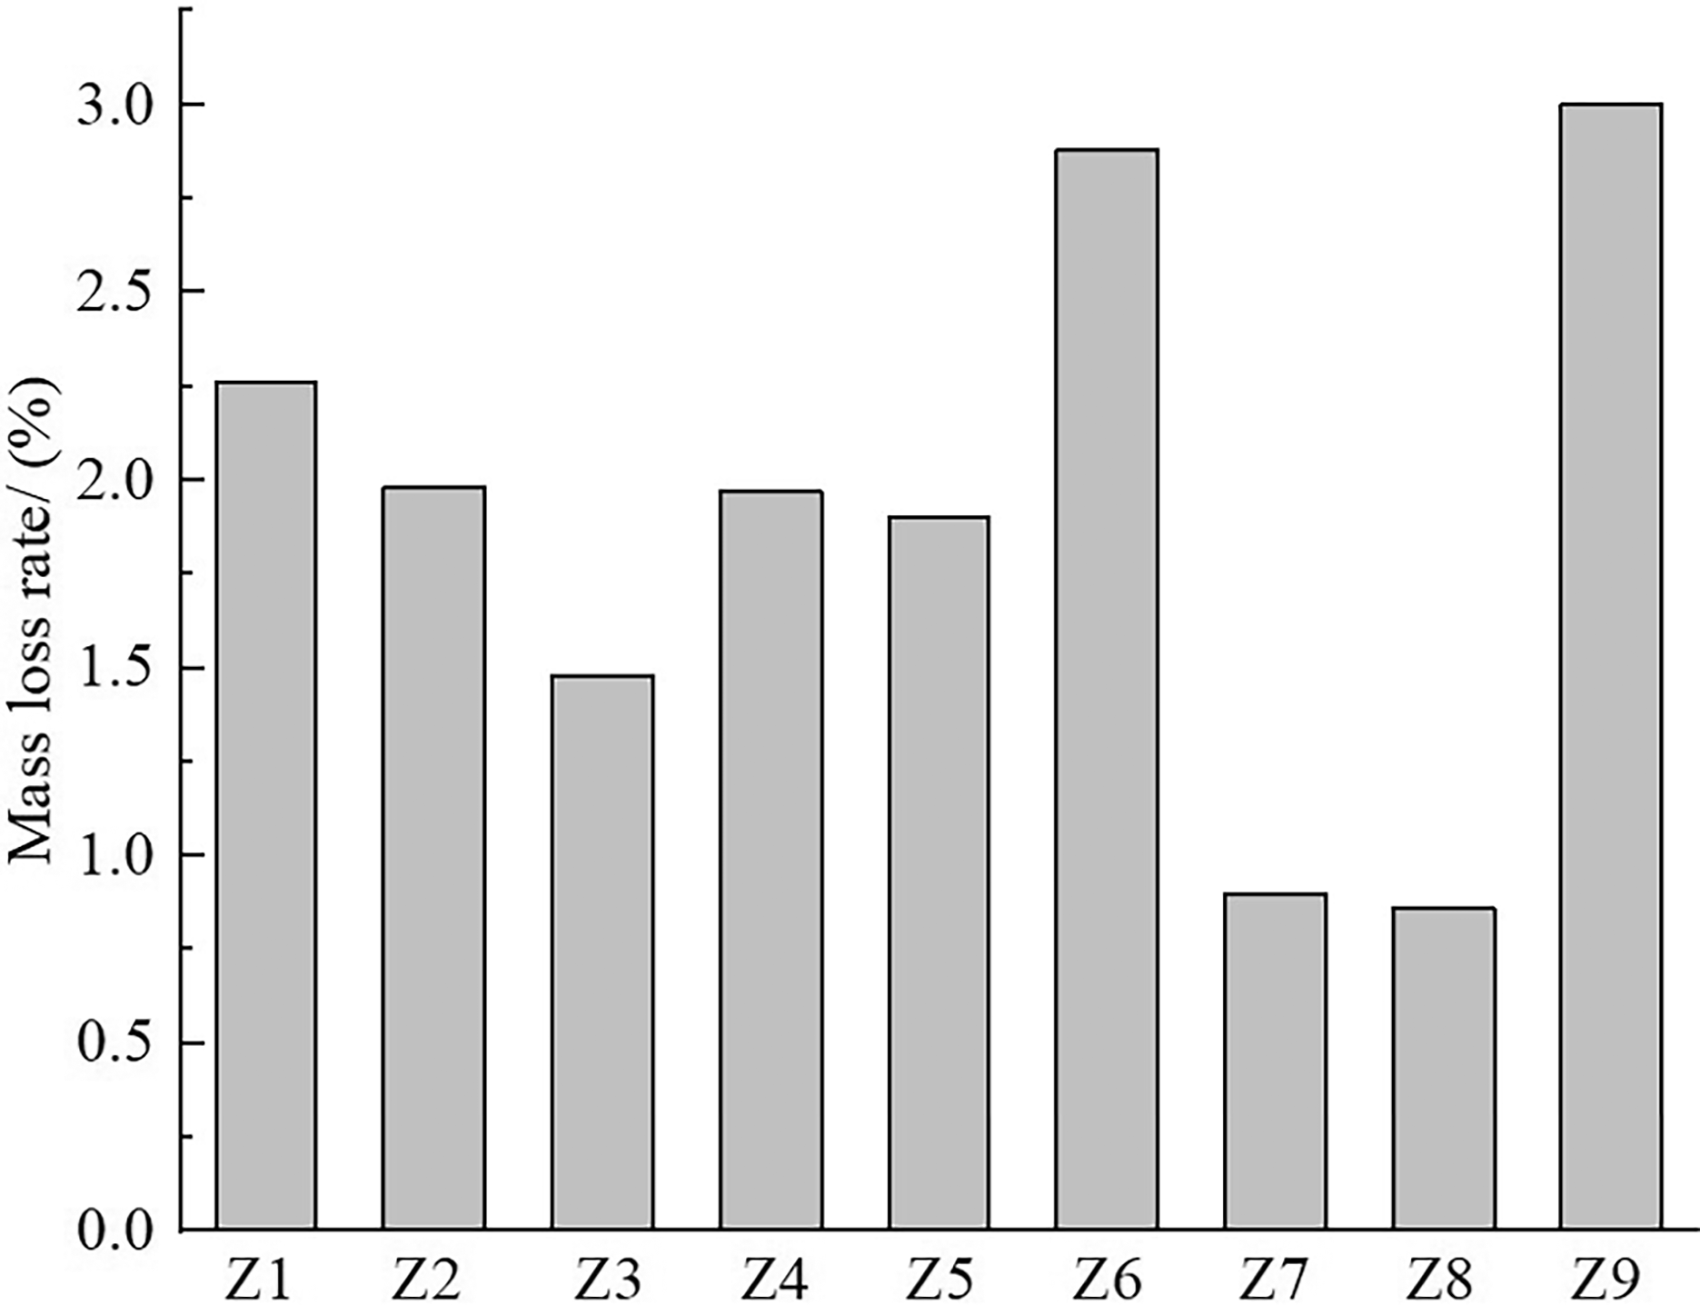
Mass loss results of gloves.
Relationship between absorbed energy and shrinkage and mass loss
The maximum shrinkage rate of gloves in four directions was taken for correlation analysis. The correlation between total absorbed energy during the experiment and shrinkage rate and the corresponding mass loss rate was analyzed. The results indicate that the shrinkage rate had a statistically significant effect on the total absorbed energy of the gloves (r = 0.782, p = 0.041 < 0.05). This finding suggests that the greater the shrinkage of the fire gloves, the more energy is absorbed, and the worse the thermal protective performance of gloves, which is consistent with previous research. 21 The fabric shrinkage leads to a decrease in the air gap under the gloves, reducing the heat insulation of the gloves. The thermal insulation will be further reduced if the shrinkage is large enough to cause the fabric to crack. There was no clear correlation between the absorbed energy and mass loss rate of gloves.
According to the correlation analysis results, the shrinkage rate (X) of the fabric was selected as an independent variable, and the total absorbed energy (Y) was considered as the dependent variable for the regression model. The results were obtained using the equation (3):

The adjustment coefficient, R2, for this model was 0.611. The significance test of the regression was 0.013, which is below the level of 0.05. Thus, the total absorbed energy of the gloves can be predicted using the shrinkage rate.
Effect of the glove size on absorbed energy
The above studies indicate that the shrinkage of gloves after the experiment leads to a decrease in glove size and an increase in absorbed energy. Therefore, it is necessary to increase the size to find the optimum size for fire gloves. In this study, multilayer fabrics of the Z3 glove (with the lowest absorbed energy) were selected to sew them into different looseness levels of gloves. The test results for the burn area and total absorbed energy of the four gloves are shown in Figure 11.
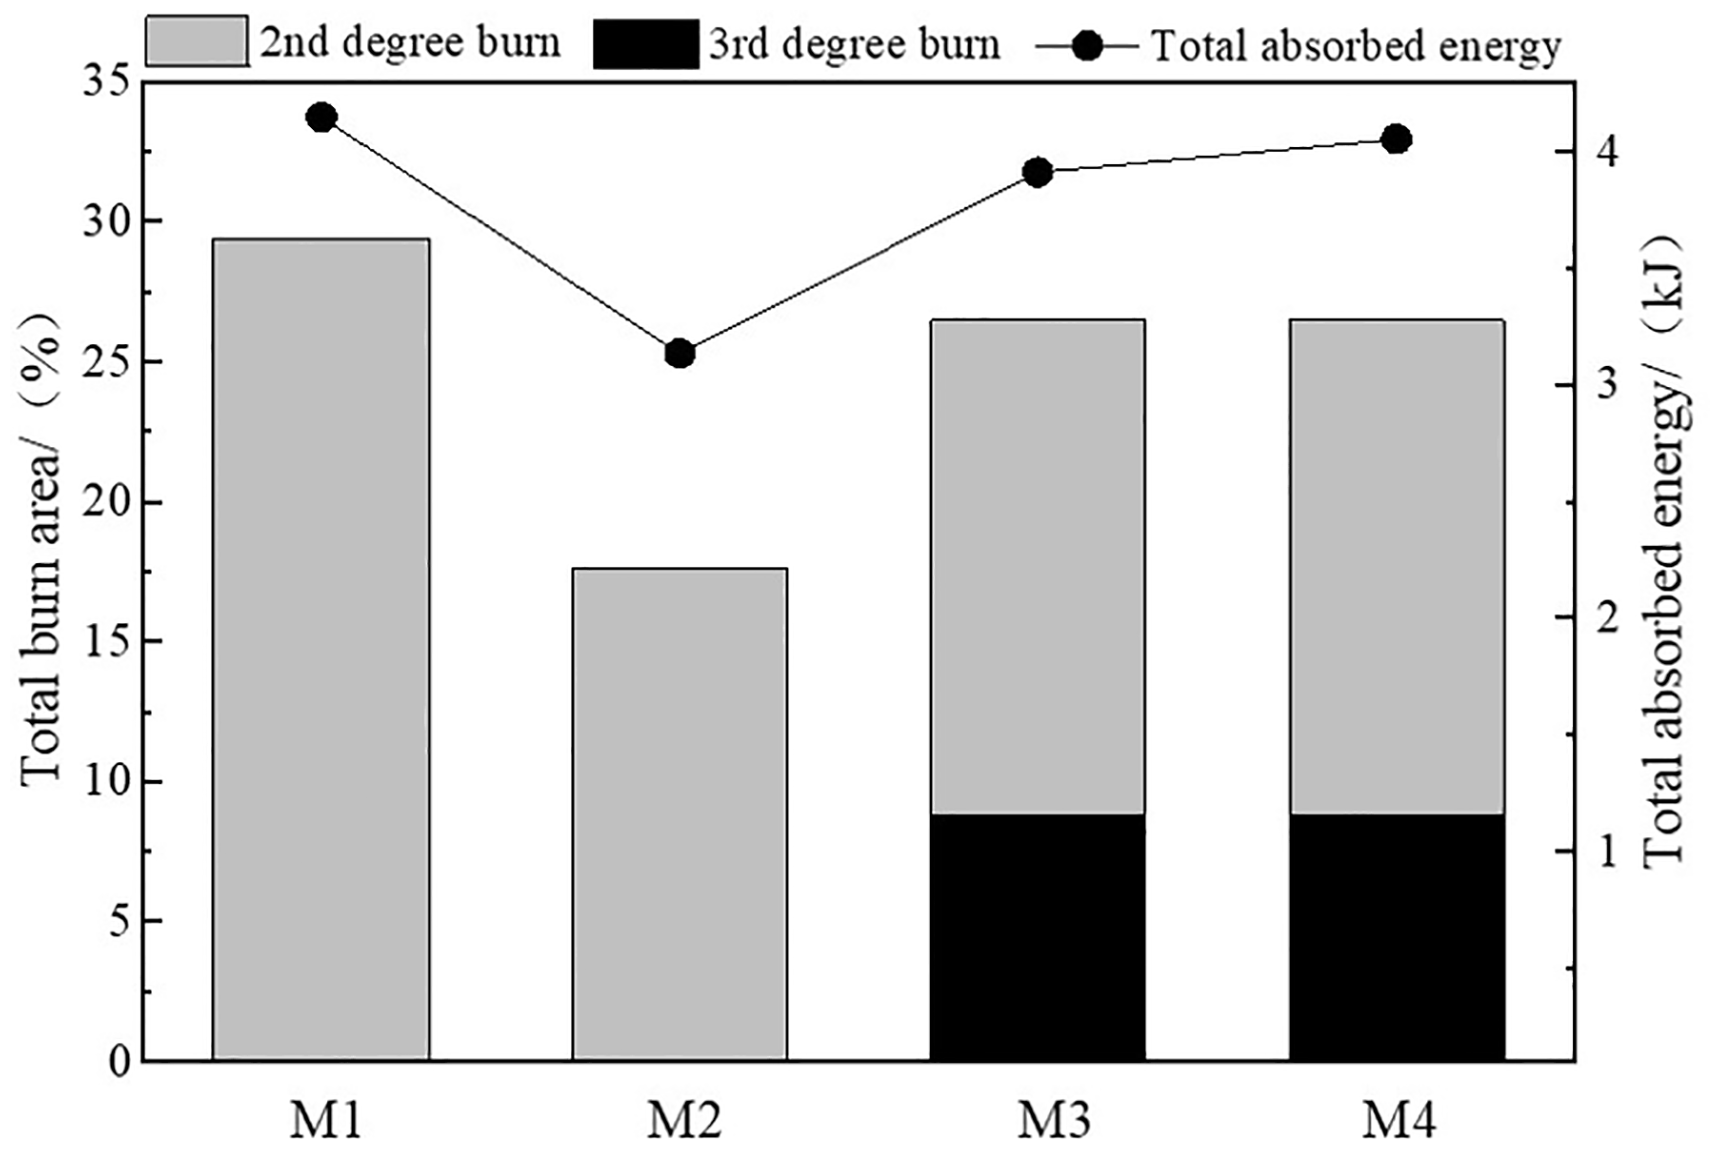
Absorbed energy and burned area for the gloves of different sizes.
It is clear that the absorbed energy first decreases and then increases with the increase in looseness between the hand and glove, with the minimum at 10 mm. This is inconsistent with the research conclusion of Wang et al. 26 on the thermal protective performance of fire clothing under flash fire. Since the flame enters gloves and clothing from the opening, it will directly contact the skin. The area of the flame hand (0.034 m2) is only 1.87% of that of the flame manikin (1.816 m2). Compared with clothing, the opening area accounts for a large proportion of gloves. Therefore, its thermal protective performance was significantly affected by the flame. Although clothing also absorbs a significant amount of heat at the opening, it is far less than the increased air gap size far away from the opening to reduce the heat reaching the manikin. When the looseness of the gloves is 10 mm, the increased air gap size between the gloves and skin delays the heat reaching the skin, reducing the absorbed energy during flame exposure. Compared with no looseness, the absorbed energy was reduced by 24% and the total burn area was reduced by 11.76%. As looseness continued to increase to 20 mm, the increased air gap size away from the opening reduces the absorbed energy. However, the opening in the glove cuff also increased. It is easier for the flame to enter the glove and the heat reaching the skin increases rapidly, which forms a comprehensive effect in which the absorbed energy increases by 25% compared with 10 mm, and the proportion of the burned area increases by 8.68%. In this situation, the thermal convection caused by the flame entering the glove is identified as the dominant factor, increasing the absorbed energy. When the looseness reaches 30 mm, heat convection is still the dominant factor. The total absorbed energy continues to increase, and the increase in amplitude decreases. This is due to the heat transferred to the sensor through the flame being limited and gradually becomes stable with the increase of the opening. During the gradual increase of looseness, a variety of heat transfer modes occurred in the interior and opening of the glove, such as conduction and convection, which have different changing trends, forming a comprehensive effect in which the total absorbed energy first decreases and then increases. The total energy absorbed from M3 to M4 increases by only 3.6%. That is, when the looseness of the gloves reaches 20 mm, the change in the thermal protective performance becomes stable. When looseness is maximum, the absorbed energy is only 2.3% lower than that of M1, and the burn degree increases. The above experimental results indicate that only increasing the size of the gloves does not improve the thermal protective ability of the gloves, while excessively large gloves may lead to the entry of flame and loss of its protective effect, and also affect the flexibility of the hands.
Figure 12 shows the burn distribution under different size gloves. The test results showed no burns on the back of the hand. This is most likely due to the flat back of the hand which helps the flame spread around and thus absorb less energy in the experiment, while the palm bends inward and tends to concentrate the flame. Therefore, only the palm side was analyzed for further discussion. It is clear that when wearing gloves M1 and M2, the flame hand has only secondary burns, whereas when wearing gloves M3 and M4, the flame hand has third-degree burns. The third-degree burns are all in part 4, that is, the wrist. This is because the opening of the cuff increases with an increase in looseness, and the flame enters gloves directly from the opening. According to the shape of the human hand, part 3 is the bulge of the palm; therefore, the heat transferred from the flame is blocked in part 3. This causes most of the heat to accumulate in part 4, causing severe burns in part 4. All burns occurred near the glove opening, and no burns occurred in parts 1 or 2 away from the opening. The findings indicate that fire gloves can effectively protect the hands from burns, but the protection of the opening should be strengthened.

Burn distribution map of different sizes gloves.
Effect of glove structure on absorbed energy
Four types of gloves with different structures were sewn with multilayer fabrics of the Z3 glove to explore the influence of the fire glove structure on the thermal protective performance. The burn area and total absorbed energy of gloves with different structures are shown in Figure 13.

Absorbed energy and burned area for the gloves of different structure.
According to Figure 13, when only elastic is added to N1 (N2), the proportion of burned area reduced by 40% and the absorbed energy reduced by 19%. When only the sleeve length increased (N3) compared with N1, the absorbed energy reduced by 33% and the burn area reduced to 0. When elastic is added and sleeve length is also increased simultaneously (N4), the proportion of the burned area is reduced by 70%, and the absorbed energy is reduced by 30%. The absorbed energy of all the gloves was lower than that of N1. Therefore, if the sleeve length is increased or an elastic band design is added, it can effectively block the external flame and improve its thermal protection. Among them, N3 does not reach the burn level and has the least absorbed energy; thus, only increasing the sleeve length is the best way to improve thermal protection among the four gloves. This is attributed to the relatively stronger ability of the longer sleeve to block the flame, which reduces the absorbed energy during the flash fire exposure. Compared with N3, N4 also had a long sleeve, but it had an 8.82% higher burn area and 3.4% higher absorbed energy than N3. This is because N4 has an added elastic band at the cuff, which is better for preventing the flame from entering. However, the thermal resistance increased with an increase in heat insulation, causing stored energy in the samples cannot escape in time. A large amount of thermal energy stored during flash exposure also contributed to burn injury after exposure, and the thermal protective performance of the gloves is reduced. Whether there is an elastic belt or not, the burn area and absorbed energy of the long version are lower than those of the short version. Therefore, sleeve length should be an important consideration in the design of fire gloves.
The distribution of flame hand burns under gloves with different structures is shown in Figure 14. Only N2 experienced third-degree burns. This is because the elastic band caused the excess fabric above the wrist to pile up and create a large air gap, causing the heat transferred by the flame to gather below the wrist, causing serious burns in part 4. Because of the increase of sleeve length, N3 effectively blocks the flame, and the heat accumulated in the glove can be released to the outside world after the gas burners are turned off. Thus it provides the best thermal protection and no burns occurred. N4 only suffered second degree burns at site 4, which was caused by heat accumulation not escaping the glove fabric system due to the elastic band of the sleeve during the cooling phase.
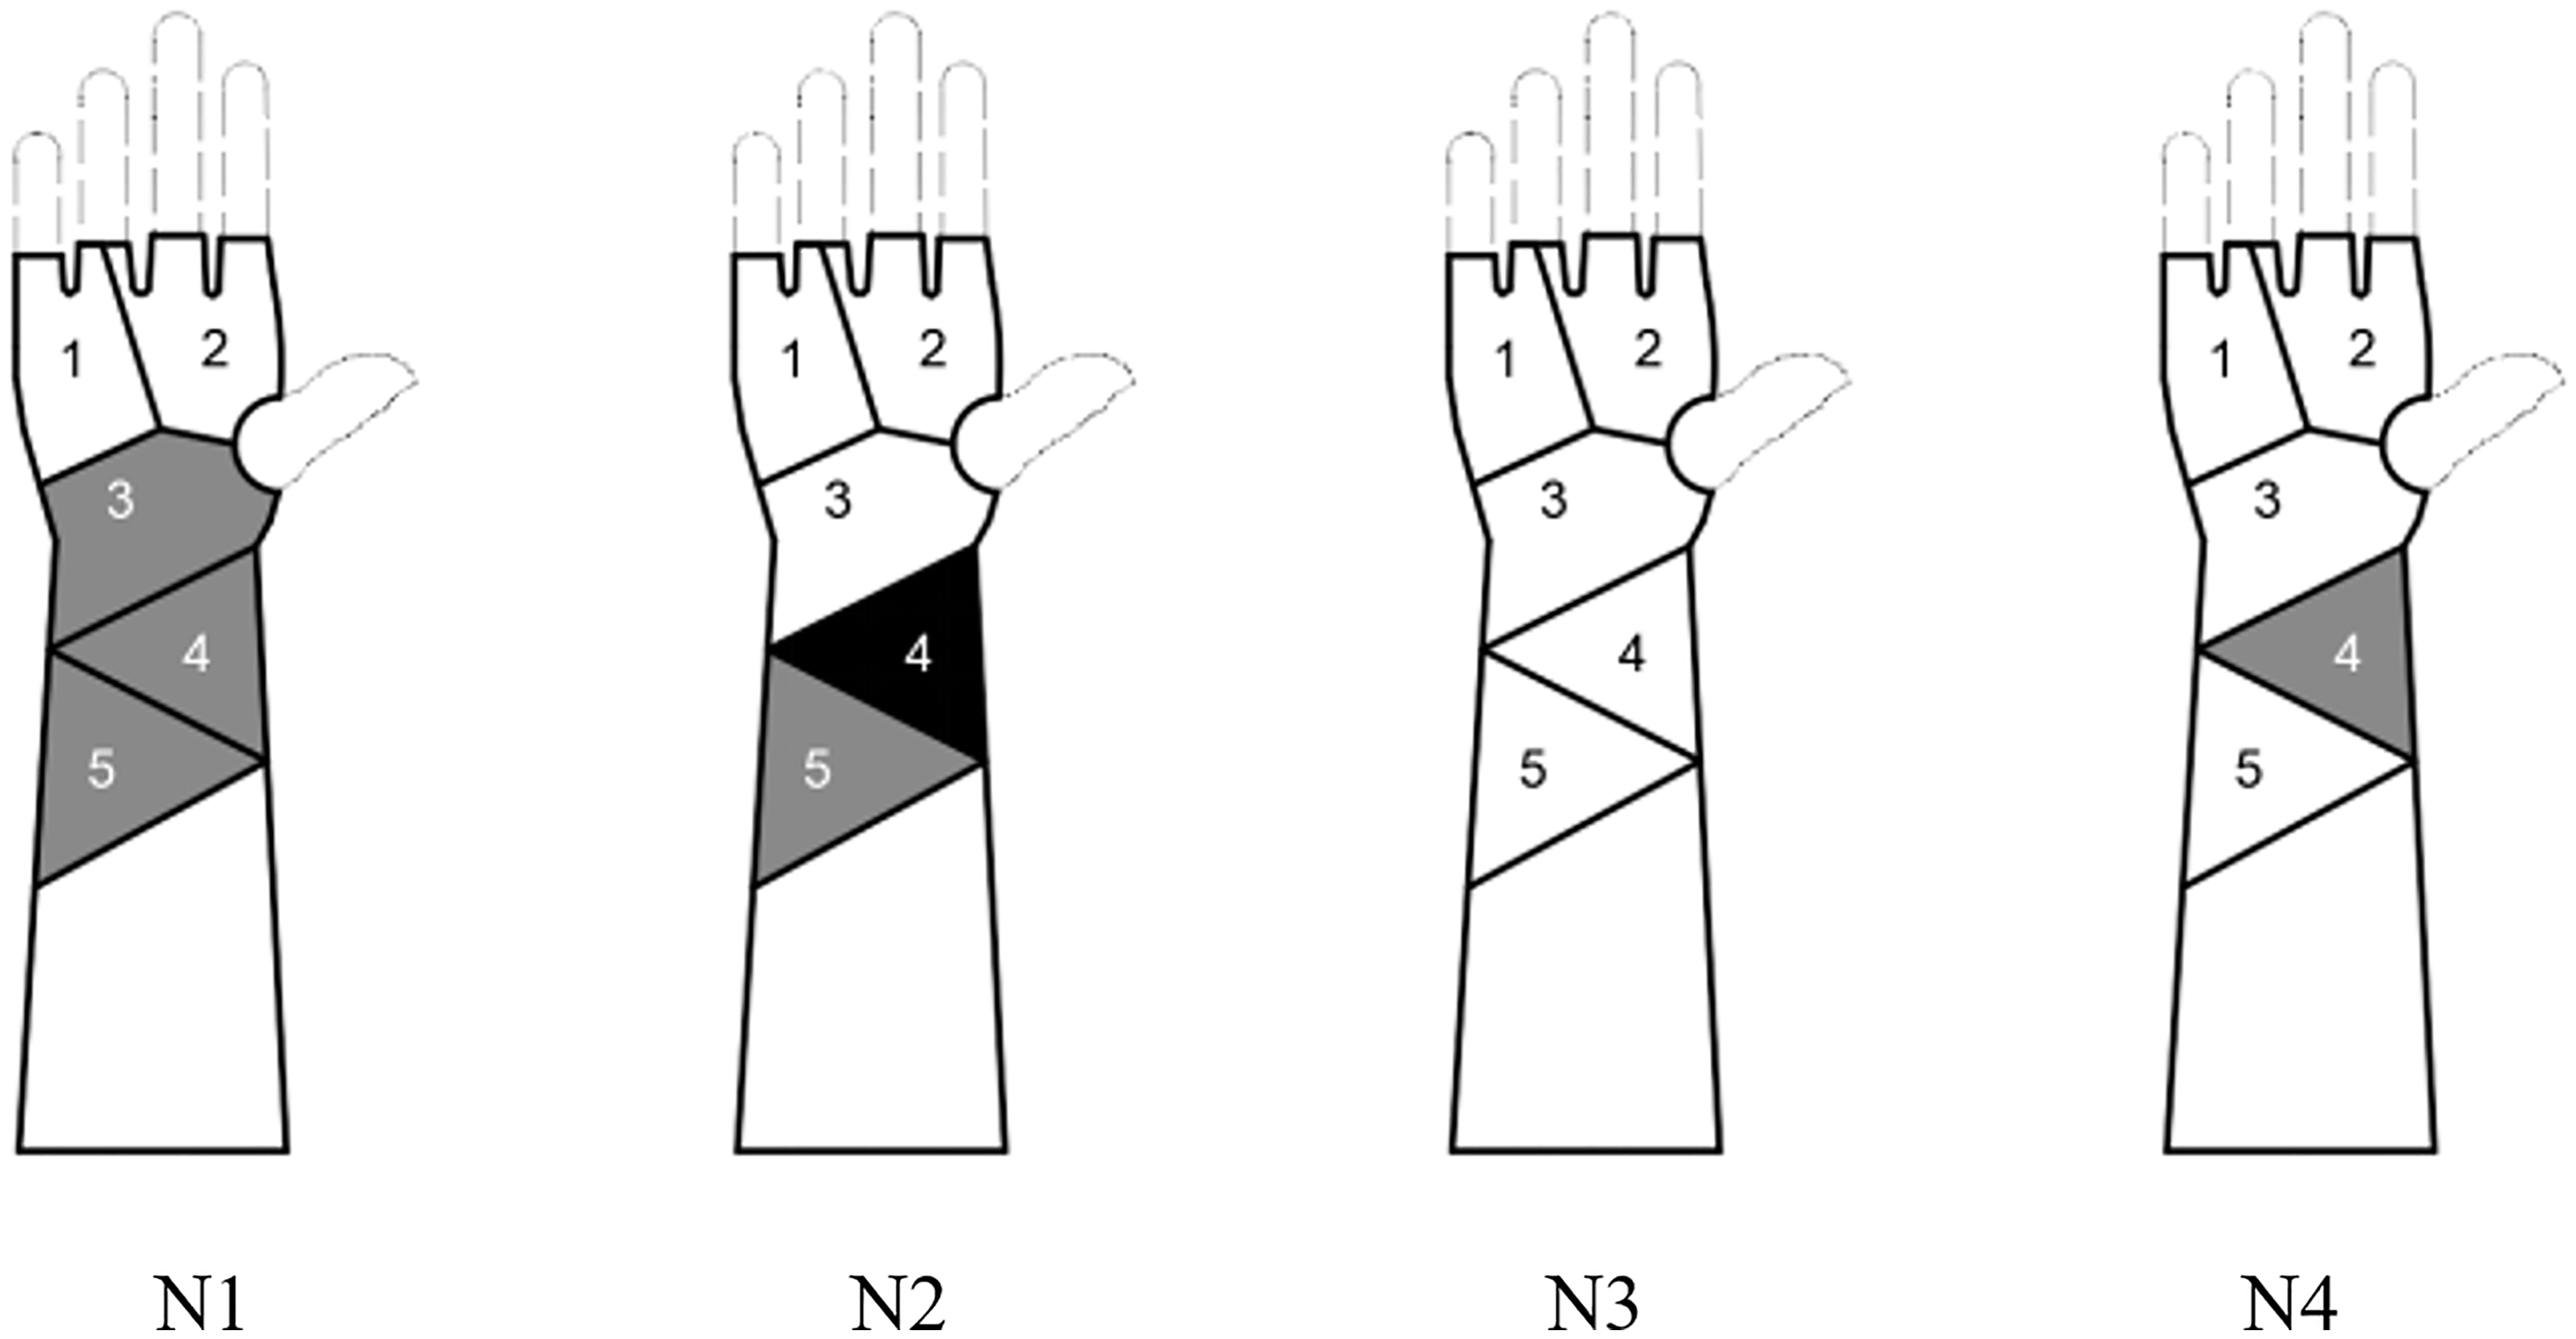
Burn distribution map of different structure gloves.
Summary and conclusions
In this study, different multilayer fabrics were selected and fire gloves of different sizes and structures were designed. The thermal protective performance of the gloves was tested by a flame-hand experiment, and the influence of fabric performance and glove structure on the thermal protective performance was analyzed. The following conclusions were drawn:
The thermal protective performance of fire gloves is closely related to the type of outer shell fabric, and is significantly affected by the flame retardancy and permeability of the outer fabric. In addition, studies based on full-scale flame hand tests revealed that glove shrinkage could greatly reduce the air gap and cause a significant decrease in thermal protective performance, and a regression model between the total absorbed energy and shrinkage rate was also obtained. It is very important to maintain the integrity of glove fabric in flash fire, and fire gloves should be selected with good flame retardancy and thermal stability. For protective performance and durability, the aramid 1313 and aramid 1414-blended fabric is better than the other two aramid fabrics in this study. As a result, the aramid 1313 and aramid 1414-blended fabric with the better flame retardancy and thermal stability is more appropriate for firefighter protective gloves under flash exposure.
Under the condition of the same glove combination fabric, the absorbed energy of the gloves first increases and then decreases with the increase in looseness, reaching the lowest value at 10 mm. Under the experimental conditions of using the Z3 fabric to sew four kinds of gloves with different structures, increasing sleeve length and adding an elastic belt can effectively prevent the flame from escaping into the gloves and reduce the direct contact between the heat flow and skin. Increasing only the sleeve length has the best thermal protective performance, outperforming the glove, which has an increased sleeve and an elastic band.
Footnotes
Declaration of conflicting interests
The author(s) declared no potential conflicts of interest with respect to the research, authorship, and/or publication of this article.
Funding
The author(s) disclosed receipt of the following financial support for the research, authorship, and/or publication of this article: This work was supported by National Science Foundation of China (11471287); China Textile Industry Association Project (J201801); Science Foundation of Zhejiang Sci-Tech University(17072191-Y); Science Foundation of Clothing Engineering Research Center of Zhejiang Province (2019FZKF09).
