



Abstract
This work investigates the thermal insulation performances of clothing based on down and a quilting method. The effect of several parameters was studied, including the amount of down, quilting number, and their geometry. An experimental study was combined with a geometrical model to confirm that a regular hexagonal geometry is the best to maximize the heat insulation properties. For the overall tiling, the best thermal resistance was obtained by using 8.67 g of down, and the thermal conductivity is the lowest when the filling was 5.14 g down. The heat resistance was also found to increase by decreasing the quilting number, but the effect is less significant as the number increases. Also, a lower amount of down in each quilting place resulted in higher heat loss. So, improving the filling down quality helped to increase heat retention. The correct space division and filling quality lead to improved warmth retention of cold protection down products.
Protective clothing is necessary for human beings to be able to live in cold environments. Over the years, several materials/fabrics have been used for this purpose, but today down is widely used in cold-proof apparel as a thermal insulation material. Down clothing refers to textiles made from down and feathers as fillers, usually in a multi-layer structure composed of fabrics, linings, and inner liners. Typical examples are jackets, quilts, sleeping bags, and pillows. The main purpose of the inner liner is to restrict down motion and prevent drilling velvet. In general, down is fixed in place by using spatial division via quilting.
Several investigations have been performed on the characteristics and design performance requirements of cold-proof clothing.1–3 The effect of clothing parameters, such as thermal insulation filler,4,5 wind,6–9 moisture,10–12 and movement,8,13 on the thermal properties have been studied. This also includes how clothing maintains the energy exchange between the body and environment,14,15 the different thermal insulation mechanisms and their effect on human thermal comfort,16,17 and three-dimensional (3D) quantification of the clothing microclimate volume to predict clothing insulation. 18
However, very few studies are available to determine the effect of quilting methods on the heat retention performance of cold-proof apparel. Presently, the spatial division of the inner liners is mainly done by quilting, and the differences lie in their division: geometry and size. Dai et al. 19 studied the influence of quilting form and number on the thermal insulation performance of down products. Yuying et al. 20 reported that the filling amount is the most important factor affecting thermal resistance. Huiying and Ranju 21 stated that the thermal performance of down will gradually increase up to a constant value by increasing the filling density, but the thermal performance will be affected if the space partitioning is too large or too small. However, the optimal space division and filling quality for good thermal insulation are still undetermined.
So, one important question still remains: how to divide the space to make the best heat retention for cold-proof down products, and what is the optimal filling amount? In this paper, a quilting method is used to divide the anti-fleece liner quilted down into rectangles and squares with different sizes and to explore the effect of this division on thermal performances. In particular, a relationship between the filling quality and the thermal property of the whole tiling method is further studied to determine the optimal mass. The results obtained are finally used to determine the optimal division method and filling quality, so that the least amount of down can provide the maximum thermal insulation, and provide a theoretical basis for the down-processing industry to make more efficient use of down.
Experimental details
Preparation of samples
The samples were made of 35 cm × 35 cm plain weave anti-fleece liner composed of 100% polyester (grams per square meter 35 g m−2, density 400 tex) and white duck down (80%). To avoid the effect of the filling mass difference on the thermal insulation property, the down mass was fixed at 5 g unless otherwise specified. Table 1 presents information on the samples prepared via quilting. The number of units is the number of small rectangles or small squares after quilting. The number of units for the whole tiling is always one. All the samples were humidified in a standard environment for 24 h before characterization.
Information on the samples produced
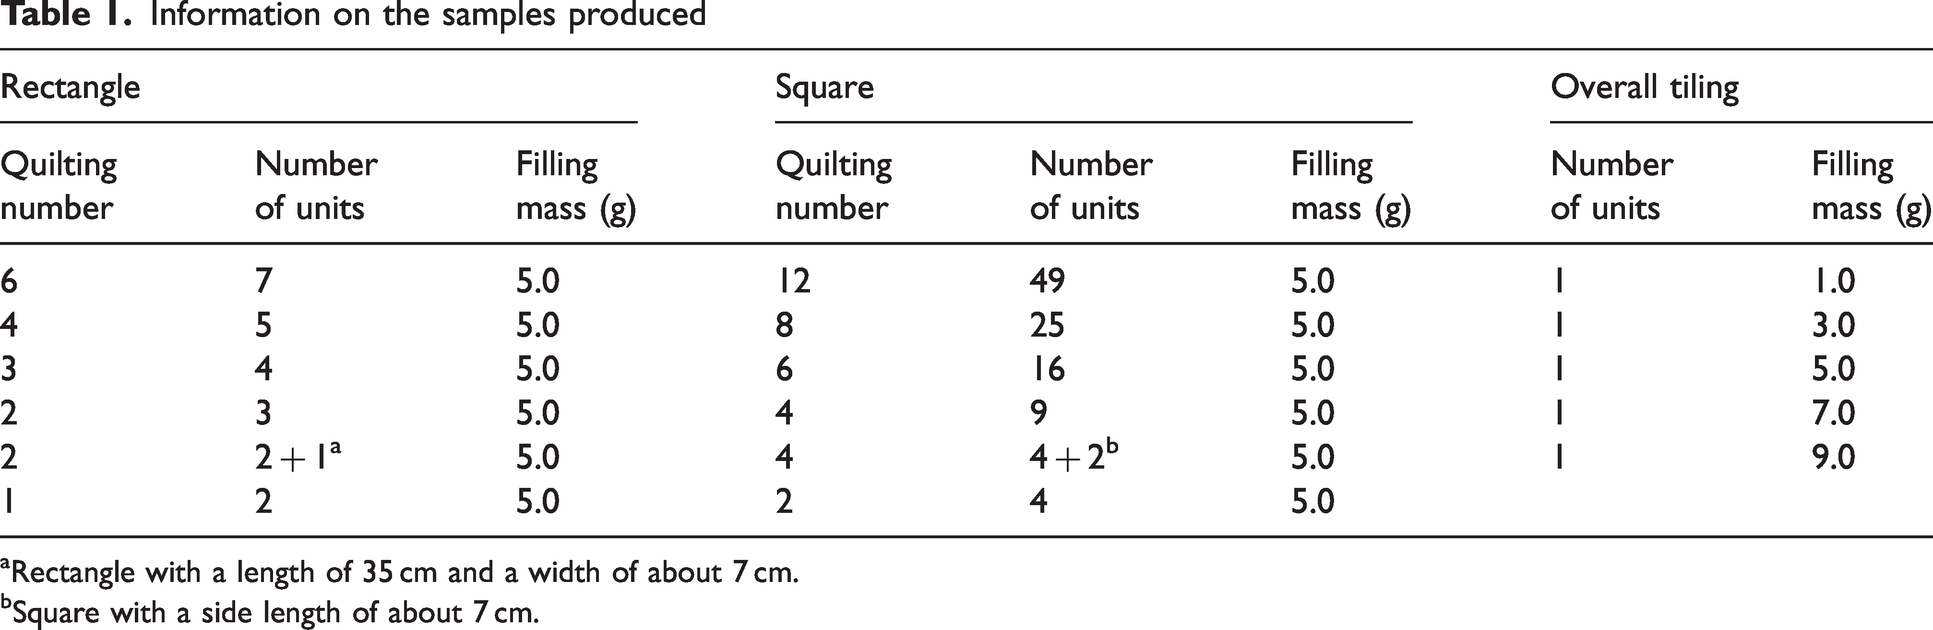
Rectangle with a length of 35 cm and a width of about 7 cm.
Square with a side length of about 7 cm.
Characterization
A scanning electron microscope (SEM, Hitachi TM 3000, Japan) at 5 kV (accelerating voltage) was used to characterize the microstructure of the down after low-vacuum sputter coating with platinum to achieve higher conductivity. Based on GB/T 11048-2018, 22 which is equivalent to ASTM D1518-14, 23 a textile thermal resistance tester (YG606E, Fangyuan, China) was used to characterize the heat insulation of each sample. The bottom and guard plate temperature was fixed at 35°C, while the preheat time and test time were set to 3600 s to record the thermal resistance and Clo value (1 Clo is the amount of insulation allowing a person at rest to maintain thermal equilibrium in an environment at 21°C in a normally ventilated room (0.1 m s−1 air movement)). Each sample was tested three times to make an average. A vernier caliper (0–500 mm, Xifeng, China) was used to measure the side length (l1 = longer side and l2 = shorter side) of a rectangular quilted sample. The prepared samples were characterized by an infrared thermal imager (Fluke thermography TiS 75, USA) at ambient (20°C) and hot plate (30°C) temperatures. Following GB/T 3820-1997, 24 which is equivalent to ISO 5084-1996, 25 a fabric thickness tester (YG141, Fangyuan, China) was used to determine the average value of 10 measurements taken at the presser foot area (20,000 ± 100 mm2), pressurization strength (0.0200 ± 0.0005 kPa), and time (30 ± 5 s).
Results and discussion
Morphological analysis
Down is not only a green and environmentally friendly protein fiber, but also has excellent thermal performance due to its unique multi-level bifurcated structure.26,27 Figure 1(a) shows that down has several barbs that are radially distributed with the calamus in the center. It can be seen that various barbules symmetrically grew on the barbs, as shown in Figure 1(b). Natural evolution makes down occupy the highest amount of space with the lowest number of barbs and barbules. However, finer structures, called nodes, are also shown in Figure 1(c) for each barbule. This complex structure contributes to the maximize the amount of air stored (voids), leading to good cushioning and thermal insulation. Based on these observations, calculations have been made to determine that for a down mass of 2–3 mg, the number of single down barbs is approximately 67–100 and the barb length is approximately 11.9–26.0 mm, with approximately 189,100 barbules. 26 The high number of barbs and barbules can store a high air volume to decrease heat transfer. 28 This special microstructure not only endows down with excellent thermal insulation properties, but also the highest heat retention ratio compared with other materials (such as cotton and wool 29 ) for the same weight.30,31

Scanning electron microscopy images of the down structure: (a) overall down structure; (b) barb structure and (c) node structure.
Rectangular division
On the premise that the multi-level bifurcation structure of down has excellent heat retention, it is necessary to explore the influence of quilting form and quantity on the heat insulation performance. A schematic diagram of an anti-fleece liner into multiple small rectangles for spatial division through quilting is shown in Figure 2(a). Figure 2(b) depicts the side profiles of samples with rectangular widths of 4.86, 6.88, 8.63, 11.56, 13.92, 17.41, and 34.94 cm to determine the effect of this parameter on the thermal insulation of down flakes. The results of the thermal resistance and Clo value for these samples are presented in Figure 2(c). As the width increases, the thermal resistance and Clo value increase from 0.270 to 0.396°C·W−1 and from 1.741 to 2.552, respectively. However, the rate of improvement of thermal insulation performance decreased gradually: the lower the quilting number, the better the thermal insulation. Heat can be transmitted through any position, but the rate is different due to uneven down distribution. Quilted areas with little or no down are where heat can easily pass through and reduce insulation.

The thermal insulation performance of the rectangular division method: (a) schematic diagram of the rectangular split sample (l1 and l2 are the side lengths after quilting, respectively); (b) schematic diagram of a sample outline with different widths (cm); (c) relationship among thermal resistance, Clo value, and rectangle width (split distance) of samples and (d) geometric diagram of the cross-section of an elliptical cylinder.
Since the thermal resistance curve is non-linear, the quilting location is not the only way for heat to escape. The thermal insulation of traditional insulation materials is mainly affected by the ability of the gas phase to transfer heat.32,33 The sample side profile is assumed to be elliptical (Figure 2(d)), the cross-sectional area of the elliptical is Sabcda (cm2), and the apparent volume of the rectangular quilting down is Vrectangle (cm3). The calculation process of Sabcda and Vrectangle is given by the following:



The results calculated from Equations (1)–(3) are reported in Table 2. The apparent volume and porosity of the sample also gradually increase with increasing the rectangle’s width. High porosity implies that a high amount of air can be stored, which is good for thermal insulation. Heat dissipated by thermal radiation also increases rapidly with decreasing porosity. So there is a positive correlation between the volume fraction of down and the amount of heat transferred by heat conduction. The increased width of a single rectangle also increases the contact area between the sample and the heat source, which becomes more conducive for better heat transfer. However, the effect of the contact area on the thermal insulation performance of cold-proof down batting is lower than that of the porosity and quilting number. The combined effect of these various factors makes the thermal resistance gradually decrease.
Results of the apparent volume
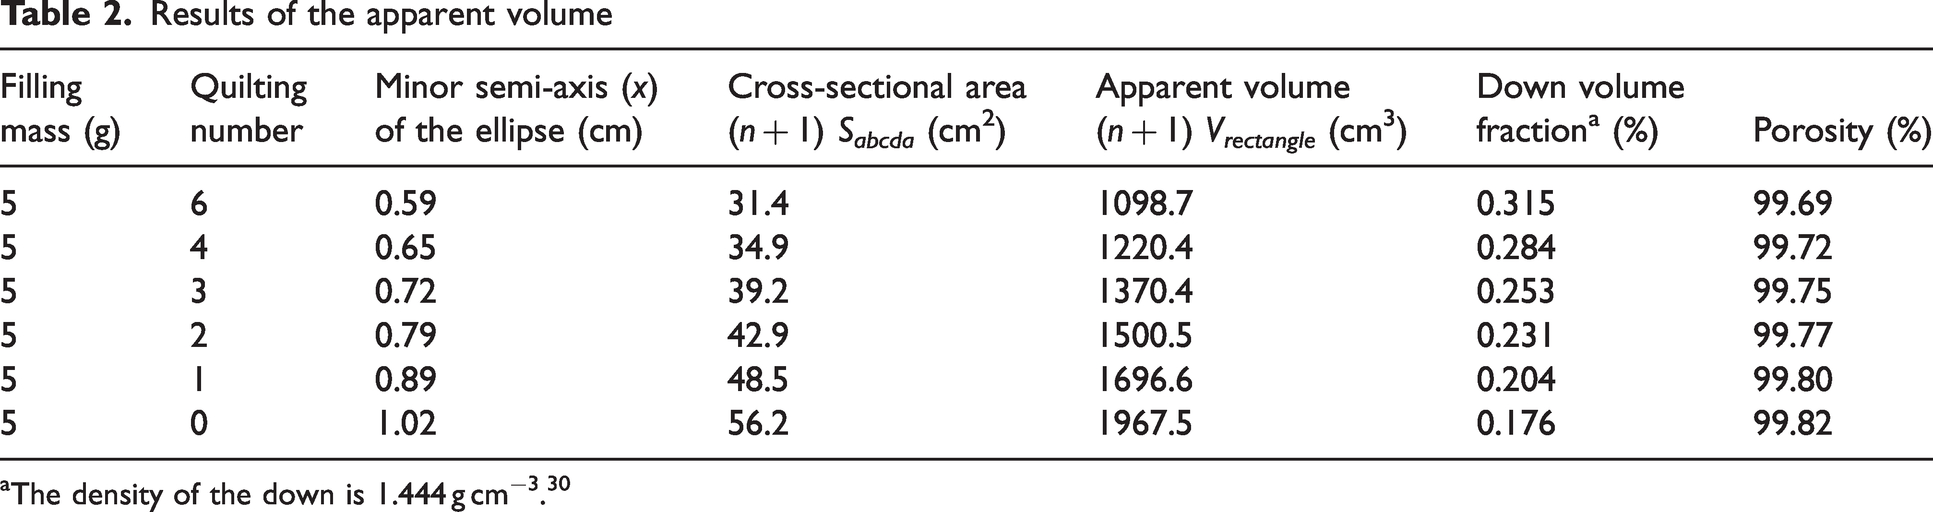
The density of the down is 1.444 g cm−3. 30
To investigate the heat distribution, we carried out infrared thermography tests on rectangular segmented samples. Figure 3(a) presents a schematic diagram of the experimental set-up, where the sample is placed on a constant temperature hot plate to record the temperature distribution. All the rectangular split samples are different only in terms of quilting number, and the down flake quilted four times is selected as representative to analyze the thermal energy distribution. The infrared image is shown in Figure 3(b) as a typical example. The high temperature is mainly concentrated in the quilting, which means that the heat loss is the highest for this position. To get more information on the energy distribution, a 3D diagram is reported in Figure 3(c). The temperature distribution of the side profile presents a sinusoidal regularity, while the temperature in the middle of the rectangle is lower than that at the edges. However, why does the thermal loss gradually increase from the middle of the oblong toward the edges? Figure 3(d) depicts the heat transfer process of a mixture of a single rectangular and air layer in the sample. It is believed that this phenomenon is due to three reasons. The first is the length of the heat transfer path, in which the thermal channel at the quilting is the shortest. The second is the amount of down in the heat transfer channel. There is almost no down in the quilting position, while the amount of down in the middle of the rectangle is the highest. Last but not least, the middle part of the oblong is in close contact with the heat source, so the heat is directly transferred to the sample without being dissipated by the surrounding air. The rectangular edges, due to buckling caused by quilting, prevent the sample from being in good contact with the thermal source, so an air layer is acting as a thermal insulator. The combined effect of these three factors leads to lower heat dissipation in the middle of the rectangle compared to that at the edges.

Heat distribution analysis for a rectangular division sample: (a) schematic diagram of the infrared imaging; (b) two-dimensional and (c) three-dimensional infrared images of a sample quilted four times and (d) heat transfer process of a single rectangular division sample.
Square division
After analyzing the influence of the rectangular division of cold-proof down flakes, the relationship between the square division and heat retention can be studied. Figure 4(a) presents a schematic diagram of the square division, and the influence of the side length on thermal insulation is analyzed. The thermal resistance and Clo value increase from 0.227 to 0.396°C·W−1 and 1.463 to 2.552, respectively, with increasing the side length of the square as depicted in Figure 4(b). The relationship between both parameters can be divided into two stages. When the square side length is below 8.67 cm, a sharp linear increase is observed, while a lower increasing trend is obtained when the side length is above 8.67 cm. The total heat loss by the quilted position decreases with increasing side length, while a larger contact area improves the heat dissipation. The influence of quilting numbers and the contact area for a side length of 8.67 cm seems to be a critical point for which the heat transfer is balanced so that the thermal resistance and Clo value of the sample show a different linear increase in both stages. Similar to the rectangular division, Figures 4(c) and (d) present infrared images of the square division to display the temperature distribution more intuitively. It can be seen that the heat is mainly focused on the quilting, and the thermal distribution of the contours on both sides is sinusoidal. The heat loss mechanism of the square geometry is the same as that of the rectangular division, which is also the result of the interaction among the length of the heat transfer path, the amount of down, and the air layer.
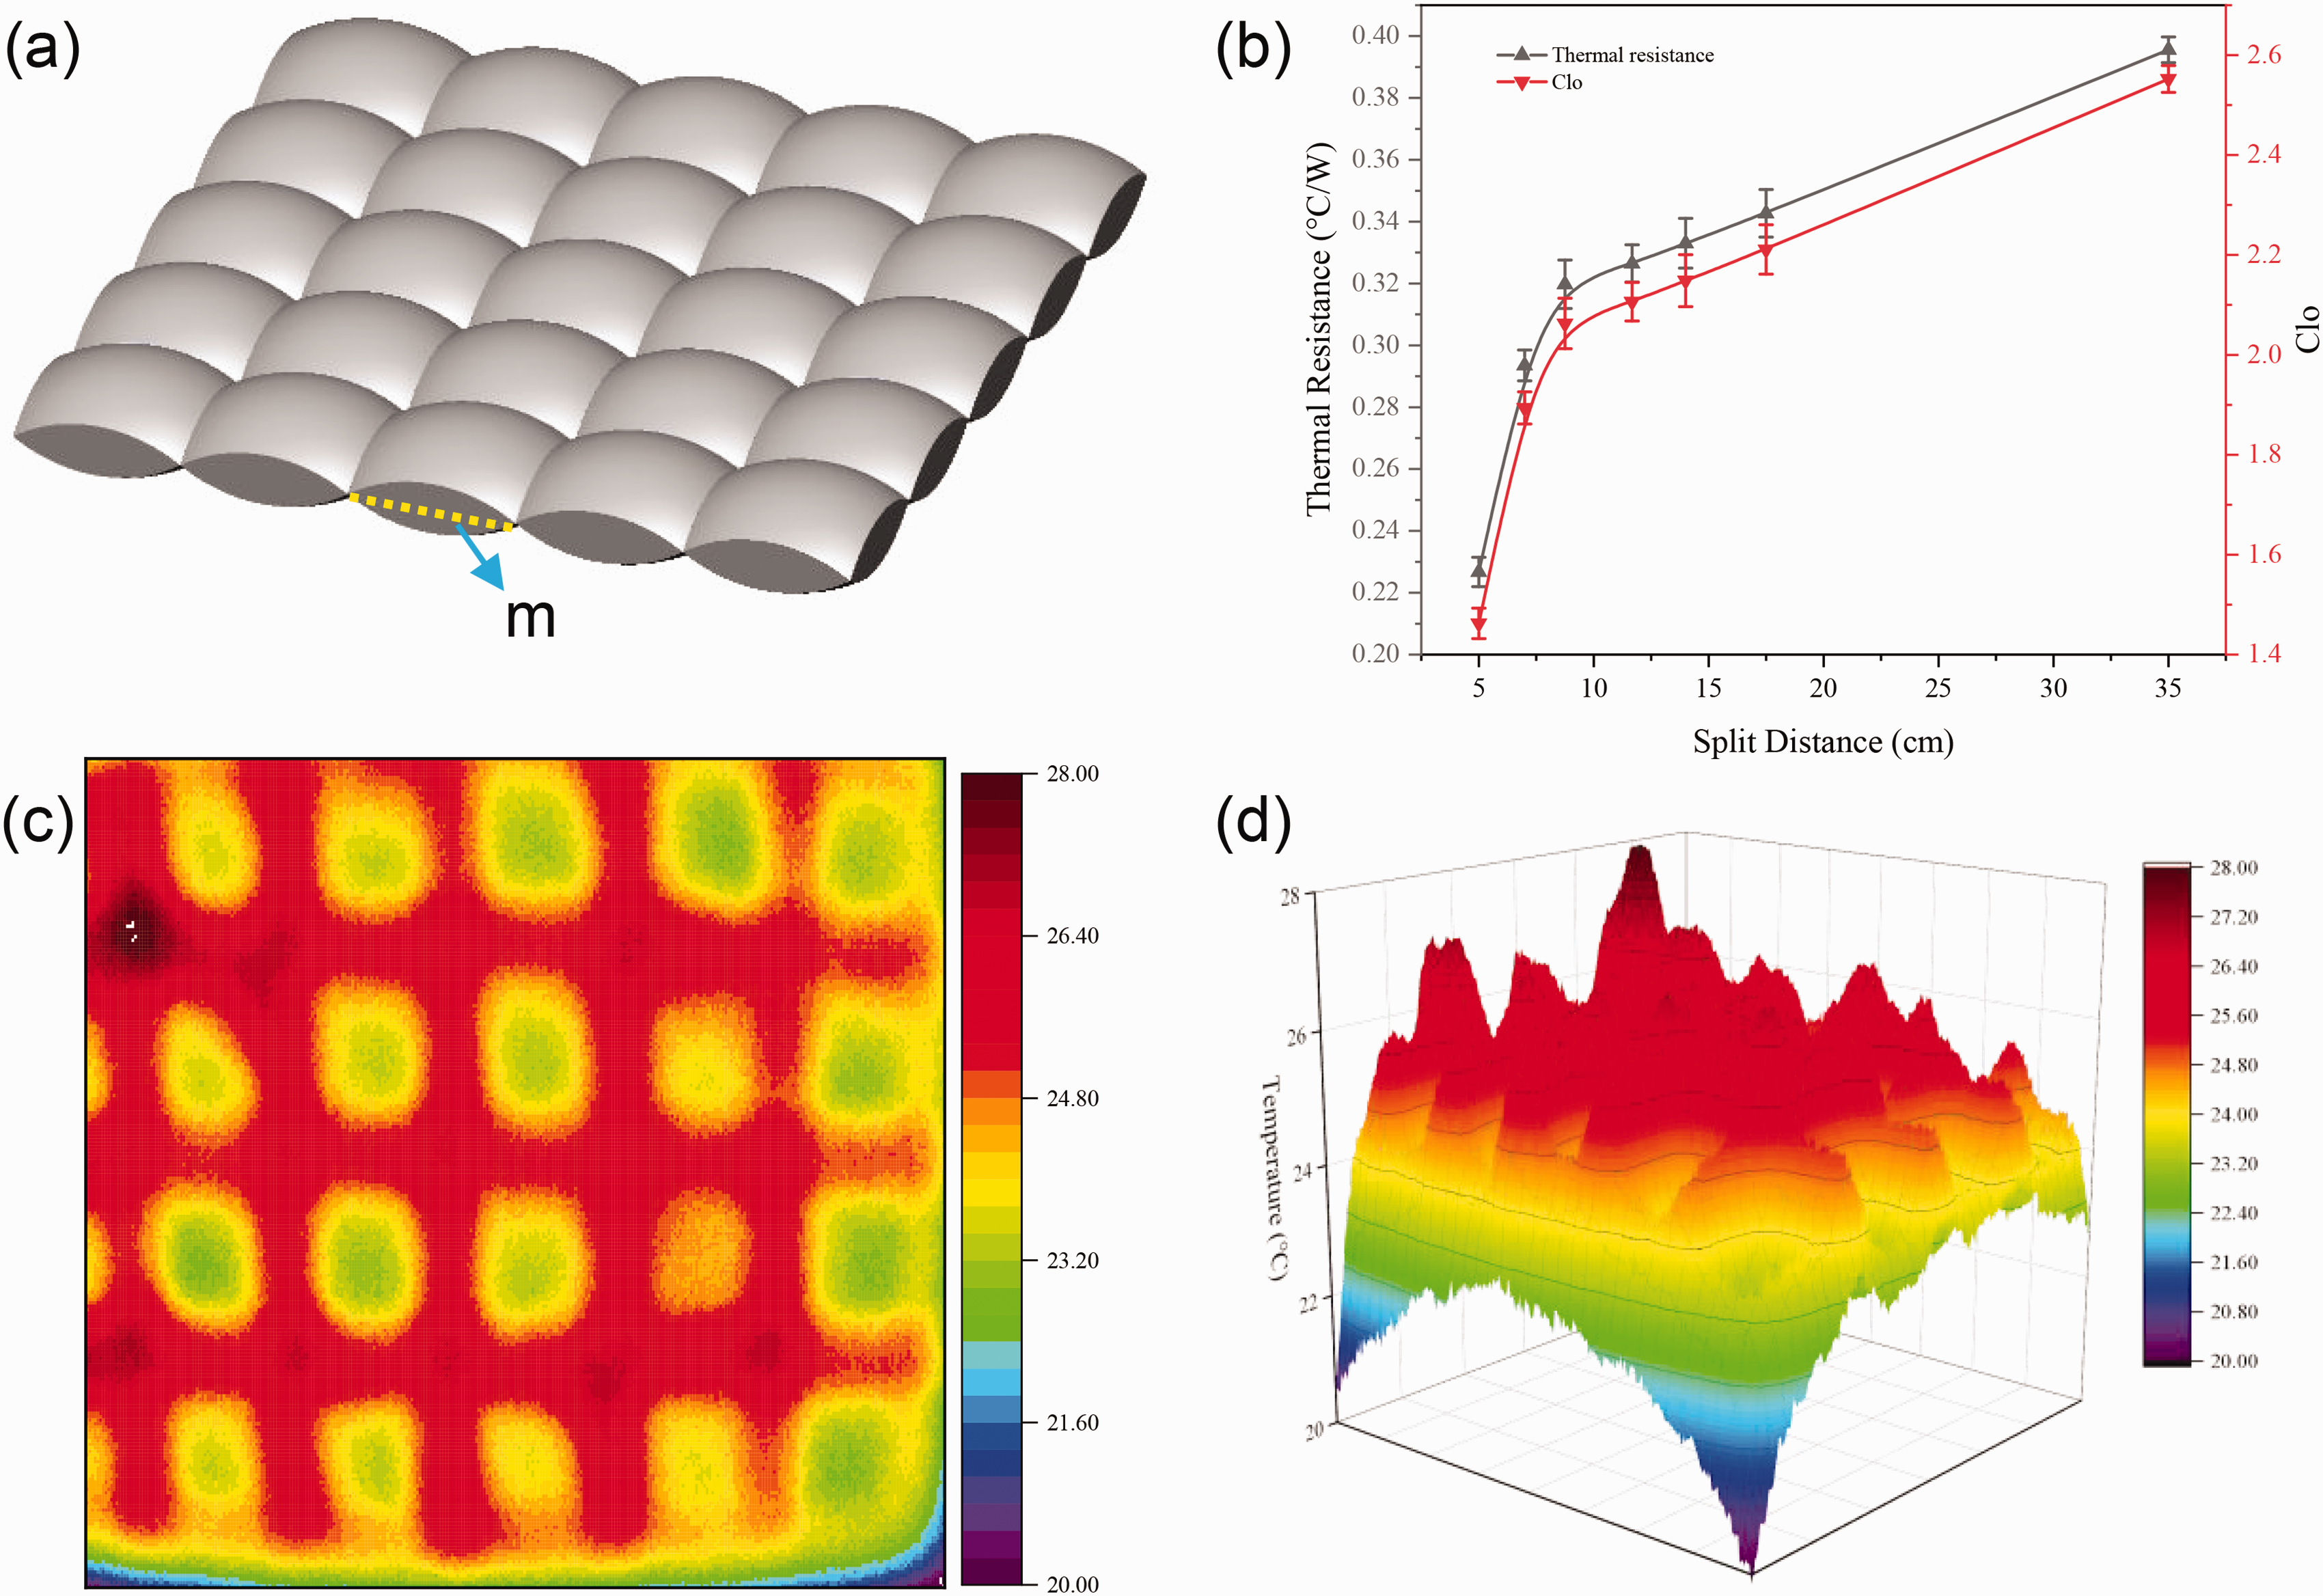
The thermal insulation performance of square division samples: (a) schematic diagram of the square division (m = side length); (b) thermal insulation performance of samples with different side lengths; (c) two-dimensional and (d) three-dimensional infrared images.
Overall tiling
Based on the research and analysis of the rectangular and square division cold-proof down flakes, it was found that the quilting number is inversely proportional to the thermal resistance of down and the Clo value. Therefore, more analysis on the influence of filling down quality on thermal insulation performance in an overall tiled manner (without quilting) is performed. Figure 5(a) presents a schematic illustration of the whole filling method without quilting within the sample. The relationship between thermal insulation performance and down-filling quality is illustrated in Figure 5(b). With the filling mass increasing from 1 to 9 g, the thermal resistance and Clo values increase from 0.168 to 0.434°C·W−1 and from 1.084 to 2.802, respectively. A high amount of down could improve the volume fraction and decrease the porosity, so the thermal resistance will gradually increase as heat cannot transfer within this more complex heat channel. This thermal resistance improvement tends to be low because the effect of porosity reduction on heat transfer is gradually reduced; that is, a higher filling mass generates more contact between the down to create heat transfer channels that are available for heat conduction.

The thermal insulation performance of the overall tiling: (a) schematic diagram of the sample; (b) relationship among thermal resistance, Clo value, and filling mass; (c) two-dimensional and (d) three-dimensional infrared images.
To visualize the heat distribution inside a sample, two-dimensional (2D) and 3D infrared images are shown in Figures 5(c) and (d), respectively. It can be seen that the temperature distribution is more uniform than that of the rectangular (Figure 3) and square (Figure 4) divisions. Since the down is more evenly distributed in the anti-fleece fabric, the heat transfer is more uniform without obvious temperature concentration. Nowhere is there a main channel for heat transfer, so the overall tiling sample has the best thermal insulation. Although the down is filled by the overall tiling method, these results show that complete heat transfer uniformity is difficult to achieve. Figure 5(d) shows that differences in the temperature distribution on the surface of the sample exist, but the difference is smaller compared to the rectangular and square divisions. However, a method to prepare evenly distributed down flakes would be a meaningful and essential research direction in the future.
Comparison between the different spatial divisions
To more clearly compare the effects of spatial divisions on the thermal performance of cold-proof clothing, Figure 6(a) presents the thermal resistance from the area of a single rectangle and square as the minimum repeating unit. The heat resistance is positively correlated with the area of repeating units, but the increasing rate tends to be low. To perform a more quantitative analysis, the data are fitted to get predictive models for a combination of rectangles and squares (c):


(a) Relationship between the repeated area and thermal resistance of rectangular and square divisions; the relationship between filling mass and thermal resistance (b), thickness (c), and thermal conductivity (d) for the whole tiling.
The theoretical value obtained by Equation (4) is 0.38°C·W−1 when the area is 1225 cm2, which is relatively close to the measured value of 0.39°C·W−1. Increasing the area of repetitive units is beneficial to improve the thermal insulation of cold-proof clothing. The warmth retention property of an anti-velvet cloth without quilting as a whole is the best under the same conditions.
Based on determining the overall tiling as the optimal method, the data are fitted to get predictive models about the thermal resistance (tr) and thermal conductivity (tc) of the overall tiling:


Figure 6(b) shows that the thermal resistance is proportional to the filling mass. According to Equation (5), the maximum thermal resistance is 0.44°C·W−1 when the filling mass is 8.76 g. The thermal resistance is not related to the thickness, and the thermal conductivity is used to characterize the thermal insulation performance when considering lightweight material. Figure 6(c) depicts the non-linear increase in thickness with increasing filling mass for the samples by the overall tiling method. The relationship between thermal conductivity and filling mass is illustrated in Figure 6(d). Calculated by Equation (6), the minimum thermal conductivity is 0.025 W m−1°C−1 when the filling mass of down is 5.14 g. The optimal filling quality obtained by thermal resistance (Equation (5)) and thermal conductivity (Equation (6)) evaluation is different. When the thickness is given priority, the filling down weight is 5.14 g. In contrast, the best filling amount is 8.76 g.
Best division prediction
The relationship between the quilting number (excluding edges) and the thermal resistance is presented in Figures 7(a) and (b) when the space is divided into rectangles and squares, respectively.

Relationship between the quilting number and thermal resistance for (a) rectangular and (b) square divisions; (c) the four patterns investigated (rectangle, square, circle, and regular hexagon).
Based on the results of Figure 7, the data can be fitted to polynomial models to obtain a relation for rectangles (r):


Figures 7(a) and (b) show that the thermal resistance gradually decreases with increasing the quilting number for both divisions. However, quilting technology (or other methods) is necessary to stabilize the position of the down. From the results obtained, the best conditions must be determined. Due to the heat and temperature distribution, different parts of the human body will feel different conditions.34,35 So, the quilting position and quantity of cold-proof down products can be selected according to a simple criterion: keep the heat and improve the thermal comfort performance (uniform temperature distribution). To complete the analysis, three patterns (rectangle, square, and circle) were selected as shown in Figure 7(c) to determine which pattern has the smallest perimeter for a fixed area (A). The perimeters (P) of rectangles (r), squares (s), and circles (c) are calculated as follows:



By fixing A = 1, the values calculated by Equations (10) and (11) are Ps = 4 and Pc = 3.54. This leads to the following:

When 
When the area is fixed, the circumference of the circle and the rectangle are the minimum and maximum, respectively. However, the circle cannot densely cover the whole plane, which is why a regular hexagon is used instead of a circle. The formulas for the area and perimeter of a regular hexagon (h) are as follows:


Again imposing A = 1, 
Therefore, it is recommended that cold-proof down clothing be divided into regular hexagons during production to reduce the number and length of quilting. Since there is a high amount of heat loss related to the quilting position, the reduction of the quilting length is beneficial to improve the insulation performance. So, based on these results, regular hexagonal quilting should be used for high heat insulation, while rectangular space division should be used for heat dissipation. This geometric analysis can be used to optimize comfort based on the final application.
Conclusions
This work analyzed the thermal insulation performance of cold-proof down flakes. From the range of conditions investigated for the overall tiling sample, the best thermal resistance was obtained by using 8.67 g of down, and the thermal conductivity is the lowest when the filling was 5.14 g down. Although the thermal resistance of the overall tiling method is the highest under the same conditions, it is inevitable to use the quilting process to stabilize the down in practical applications. Based on a geometrical analysis, the results showed that the thermal resistance of a hexagonal quilting pattern is more efficient than a rectangular one, with a square pattern being between them, for a fixed area under constant conditions (temperatures imposed). The heat resistance was also found to increase by decreasing the quilting number, but the effect is less important as the number increases. Also, a lower amount of down in each quilting place resulted in higher heat loss. So, improving the filling down quality helped to increase heat retention. Finally, optimizing the quilting method and filling quality can lead to limited down use, more efficiency, and improve the economic value of down.
Footnotes
Declaration of conflicting interests
The author(s) declared no potential conflicts of interest with respect to the research, authorship, and/or publication of this article.
Funding
The author(s) disclosed receipt of the following financial support for the research, authorship, and/or publication of this article: This work was supported by the National Key R&D Program of China (2016YFC0802802). The authors are also sincerely grateful to the China Scholarship Council (CSC) for the state scholarship (202106630067) that enabled the first author (Yu W.) to study abroad.
