



Abstract
The fall arrest belt as a piece of personal protective equipment is one of the primary methods of protection against falls. This paper uses pressure-sensitive paper to test the pressure distribution of six parts at different hanging points in static suspension and dynamic fall. The ordinary seat belt is improved by developing a wide–narrow changing belt, which promotes uniform pressure distribution. The results show that the front hanging point is better than the back hanging point, as it can minimize the pressure of the seat belt on the human body during static suspension. Using a wide–narrow changing belt to increase the contact area of the heavily compressed parts can significantly reduce the pressure and promote uniform pressure distribution. The variable coefficient of pressure distribution p of ordinary seat belts and wide–narrow changing seat belts decreased from 0.68 to 0.28. The force discrepancy in different parts fell from 143.7 to 34.8 N.
Falling from height (FFH) is one of the most severe occupational hazards, causing significant injuries and deaths worldwide.1,2 Unfortunately, accidents due to falls from height remain one of the leading causes.3,4 According to a survey in Australia, FFH at workplaces was one of the major causes of injuries, with a fatality rate of 14%. 5 FFH is also the cause of the most significant number of deaths in the USA, especially for construction fatalities (about 36.9%).2,6 Furthermore, FFH accounted for 42.3% of serious and 25% of fatal accidents in Spain. 4 A total of 5379 falls from height were reported, 70 of which led to severe injury and 38 to death, just in 2017 in Poland. 6
The use of personal protective equipment, including safety seat belts, is one of the primary methods of protection against falls. 6 Many kinds of seat belts are available, such as car seat belts, fence seat belts, climbing seat belts, and wheelchair seat belts. Among them, the fall arrest belt is one kind of protective material for aerial workers, such as construction, electric power, and oil exploration. Long-term research and analysis on the dynamic mechanical properties of the falling suspension seat belt in extreme weather and corrosive environment has been carried out.7–9 It shows that the increase in temperature and humidity increases the elongation of the seat belt. The corrosion of acid mist leads to the decline of mechanical properties, which may affect the safety of people working at high altitudes.8,10 Therefore, seat belt inspection is crucial for protection.11,12
As an essential index to evaluate the safety protection ability of seat belts, the static and dynamic mechanical properties have been widely studied by researchers. Dummies can be used as subjects to test the impact change of seat belts during a collision13–15 to avoid the risk of injury in actual experiments. The high-speed camera is also widely used to monitor the falling process of the dummy while wearing a falling seat belt. 16 Most researchers take the whole seat belt as the research object17–21 during the static suspension and falling process. The force of seat belts in different scenes has been systematically obtained. At present, most seat belts can meet the load requirements. However, little attention has been given to the damage to the human body caused by excessive local pressure.
This paper used the pressure-sensitive form to analyze the force distribution on the different parts of the dummy under the static suspension and falling process to find the effects of the hanging point position and webbing width.
Materials and methods
Preparation of the fall arrest belt
Polyester fiber is used as the warp and weft yarns to prepare the fall arrest belt. The specific structural parameters of the warp and weft yarns and ribbon used in the seat belt are shown in Table 1.
Parameter information of the fall arrest seat belt

PET: polyethylene terephthalate.
The weave structures of seatbelts include plain weave, twill weave, multi-layer, and tubular weave. 22 Plain weave is more robust and firmer than twill weave for more interweaving points. 20 In this paper, plain weave is selected as the weave structure of the webbing. The weaving process of the belt is shown in Figure 1. The organization chart × is known as “high” or “upper,” while the ○ is widely known to represent “low” or “lower.” The fifth warp yarn in the weave is a suture, mainly used to connect the upper and lower layers and support the webbing. The heddle is divided into two zones by the zonal method. Pictures of the conventional ribbon and wide–narrow ribbon are shown in Figure 1(f).
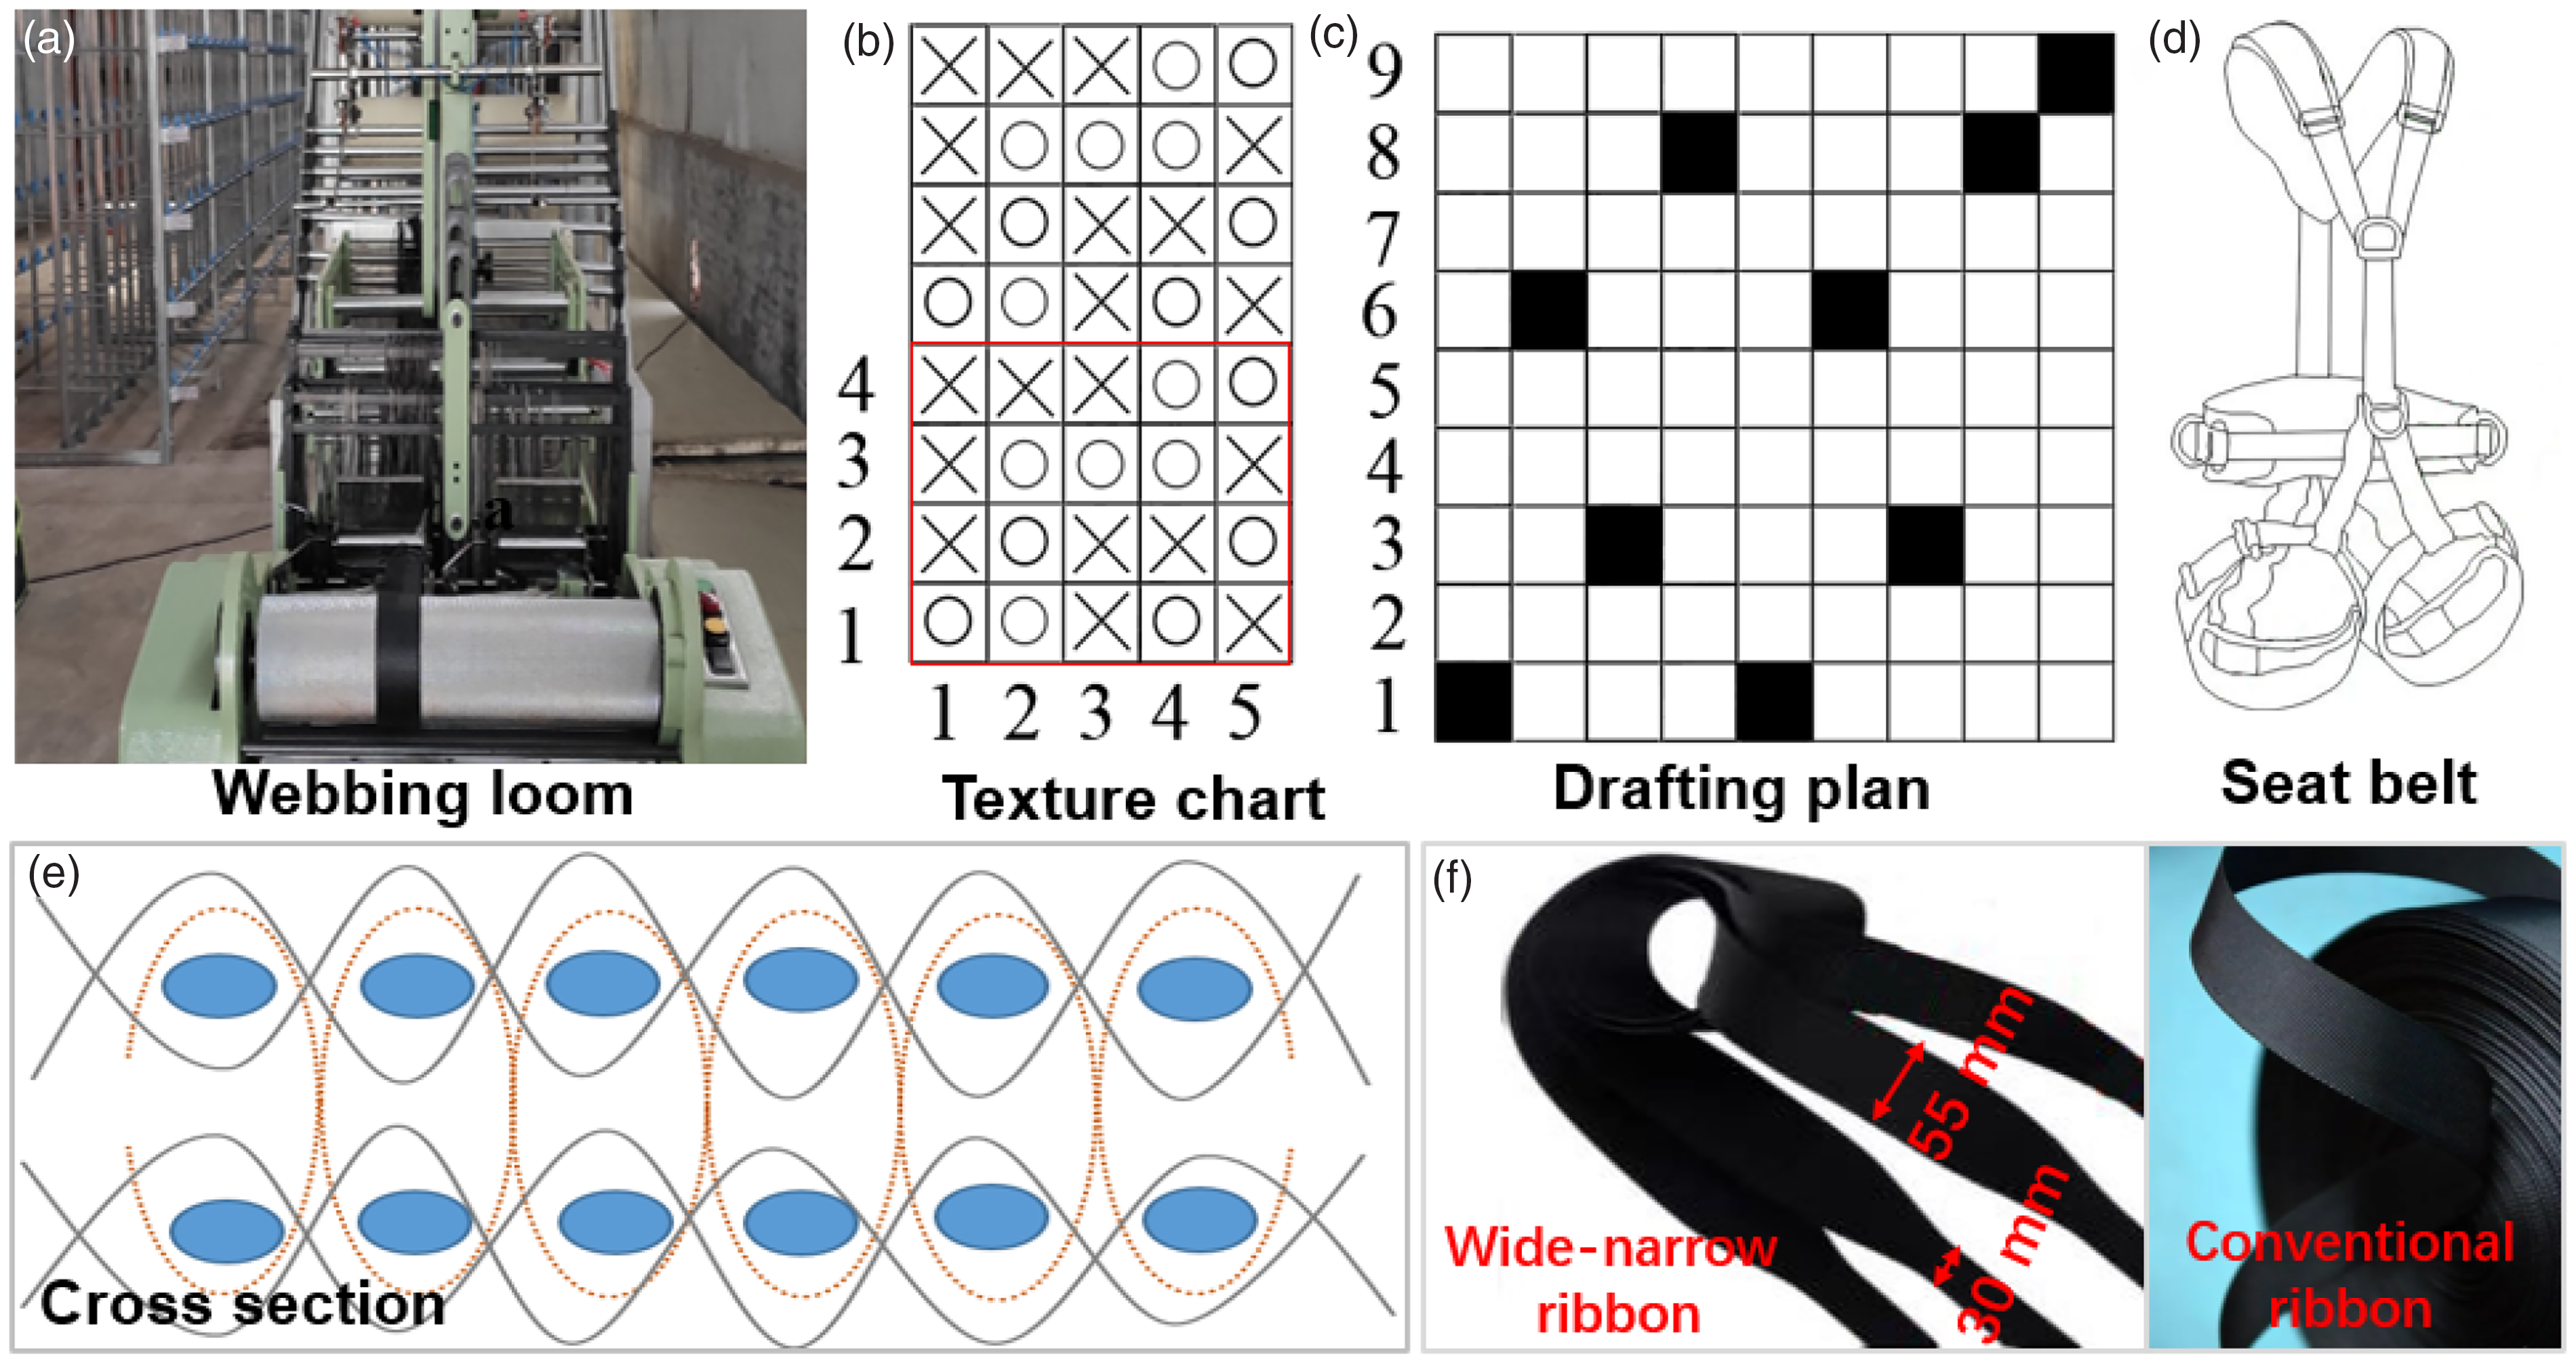
The weaving process of the belt: (a) weaving machine; (b) organization chart; (c) drawing; (d) seat belt; (e) cross-section of the ribbon and (f) two kinds of ribbon.
Pressure distribution test
The force distribution process of seat belts tested by the pressure-sensitive paper is shown in Figure 2. The ambient temperature is 20–25°C. The relative humidity is 40–75%. The paper size is 45 mm × 45 mm. Seat belts include shoulder belts, waist belts, and leg belts, so the main contact parts between the seat belts and dummies are at the shoulders, waist, and hips. According to the structural characteristics of the seat belt, six test points are preliminarily selected on the dummy's front (F) and back (B). The pressure-sensitive paper was stacked on the back of the seat belt.
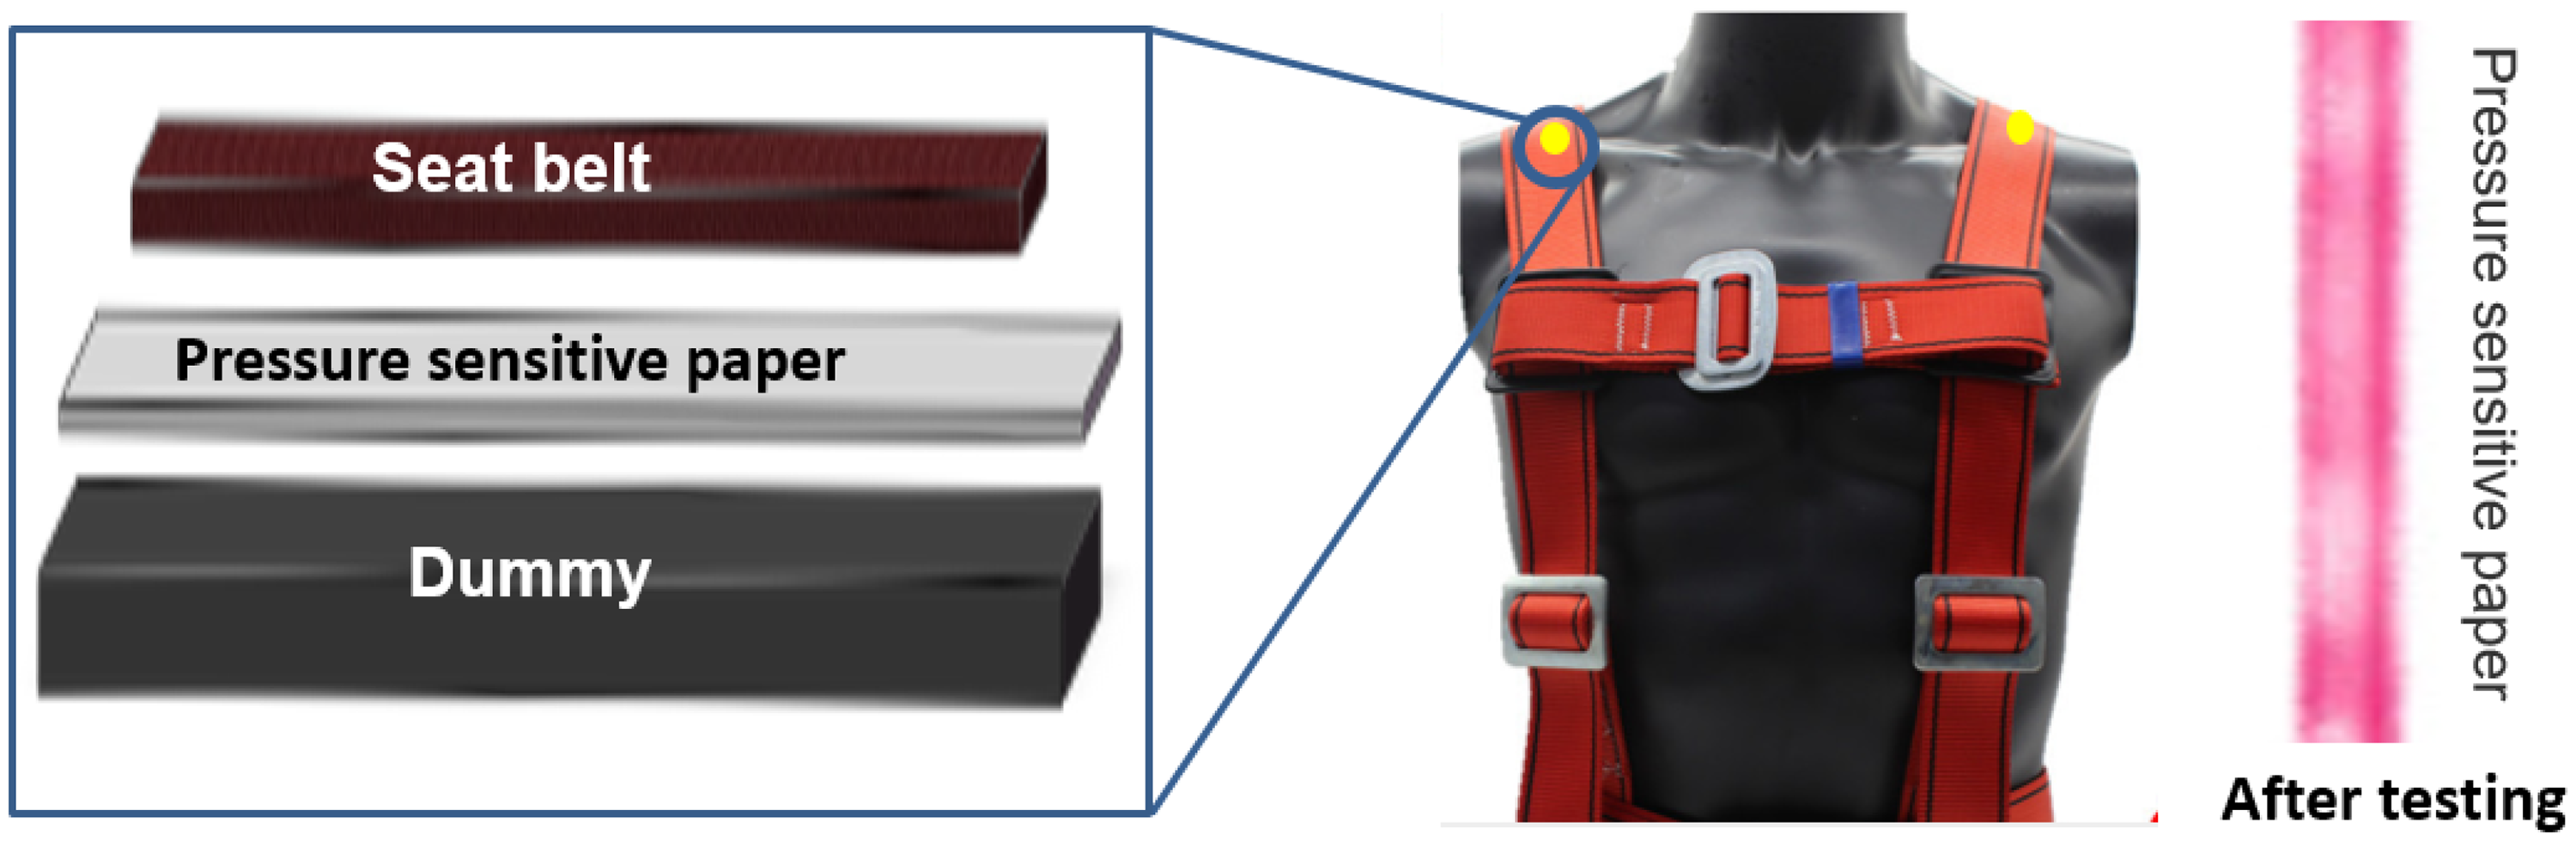
Schematic diagram of stress distribution in different parts based on the pressure-sensitive paper test.
The seat belt's different front and back hanging points are determined to analyze its effect on the force distribution. The seat belts are shown in Figure 3, with the distance between adjacent test positions of 5.08 cm. For the front hanging point, the armpit lines are point A of the front (FA), point B of the front (FB), point C of the front (FC), and point D of the front (FD) and are defined as every 5.08 cm from FA between the armpit and waist. Here, BB is the armpit line for the back hanging point. Point A of the back (BA) and point C of the back (BC) are 5.08 cm above and below the threshold point B of the back (BB), respectively.
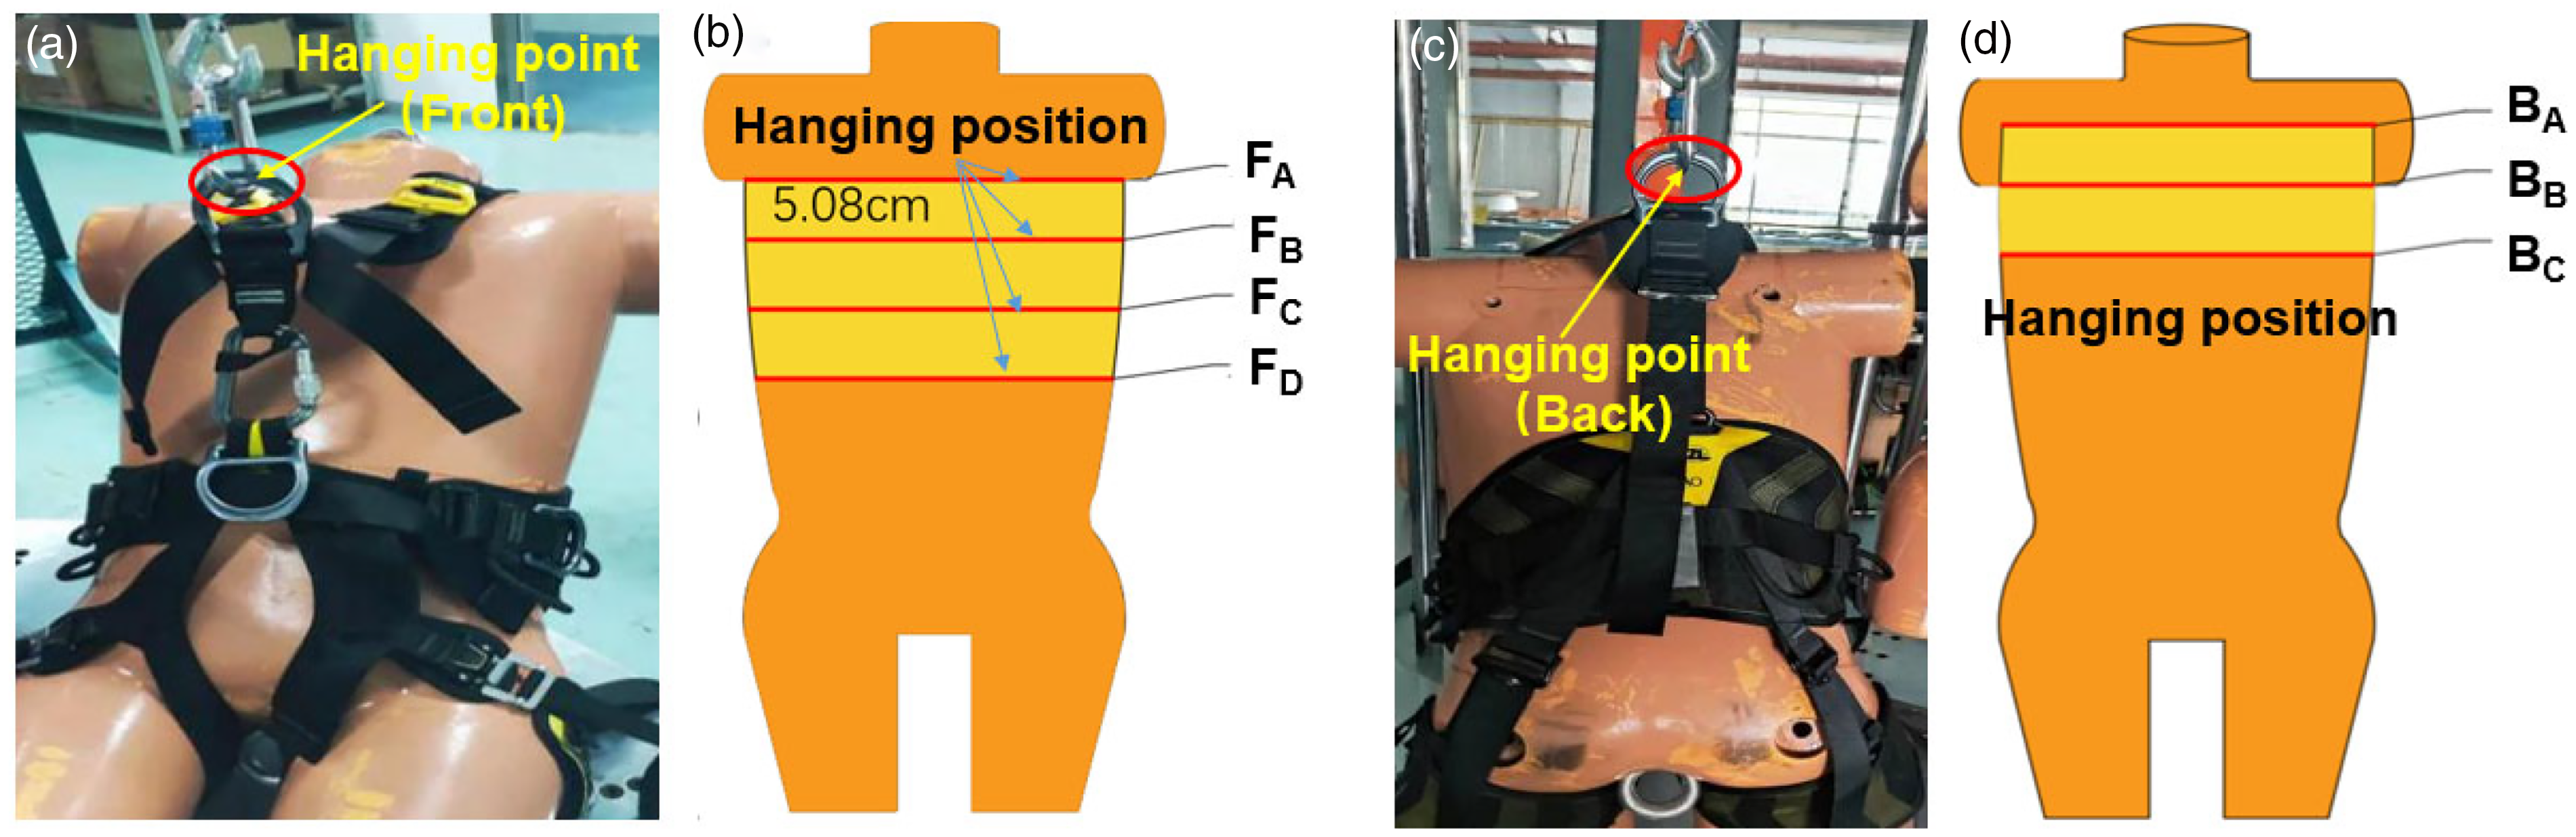
Stress analysis of the suspension state: (a) front hanging point; (b) test position on the front; (c) back hanging point and (d) test position on the back.
Test data from six different parts were collected. For the front hanging points, the six points are the left trapezius muscle (LTM), right trapezius muscle (RTM), left lateral abdominal oblique muscle (LLAOM), right lateral abdominal oblique muscle (RLAOM), left biceps muscle (LBM), and right biceps muscle (RBM). The back hanging points are the LTM, RTM, LLAOM, RLAOM, left pubic muscle (LPM), and right pubic muscle (RPM). Further, the damage thresholds of different test sites were determined according to Ning. 23 The selection of mannequins is based on GB6095-2009.
In order to evaluate the uniformity of seat belt pressure distribution, the uneven coefficient p of pressure distribution and the maximum pressure difference ΔFmax of each test part is introduced. Equation (1) provides the maximum pressure difference among the six test parts. Equation (2) provides the uneven coefficient of pressure distribution of the six test parts:


Dynamic drop test
The seat belt dynamic fall tester was used to test the dynamic mechanical properties of wide and narrow seat belts, as well as ordinary seat belts, as shown in Figure 4. The dynamic seat belt fall tester consists of five components: the frame, data acquisition system, software system, data processing system, and fall test system.
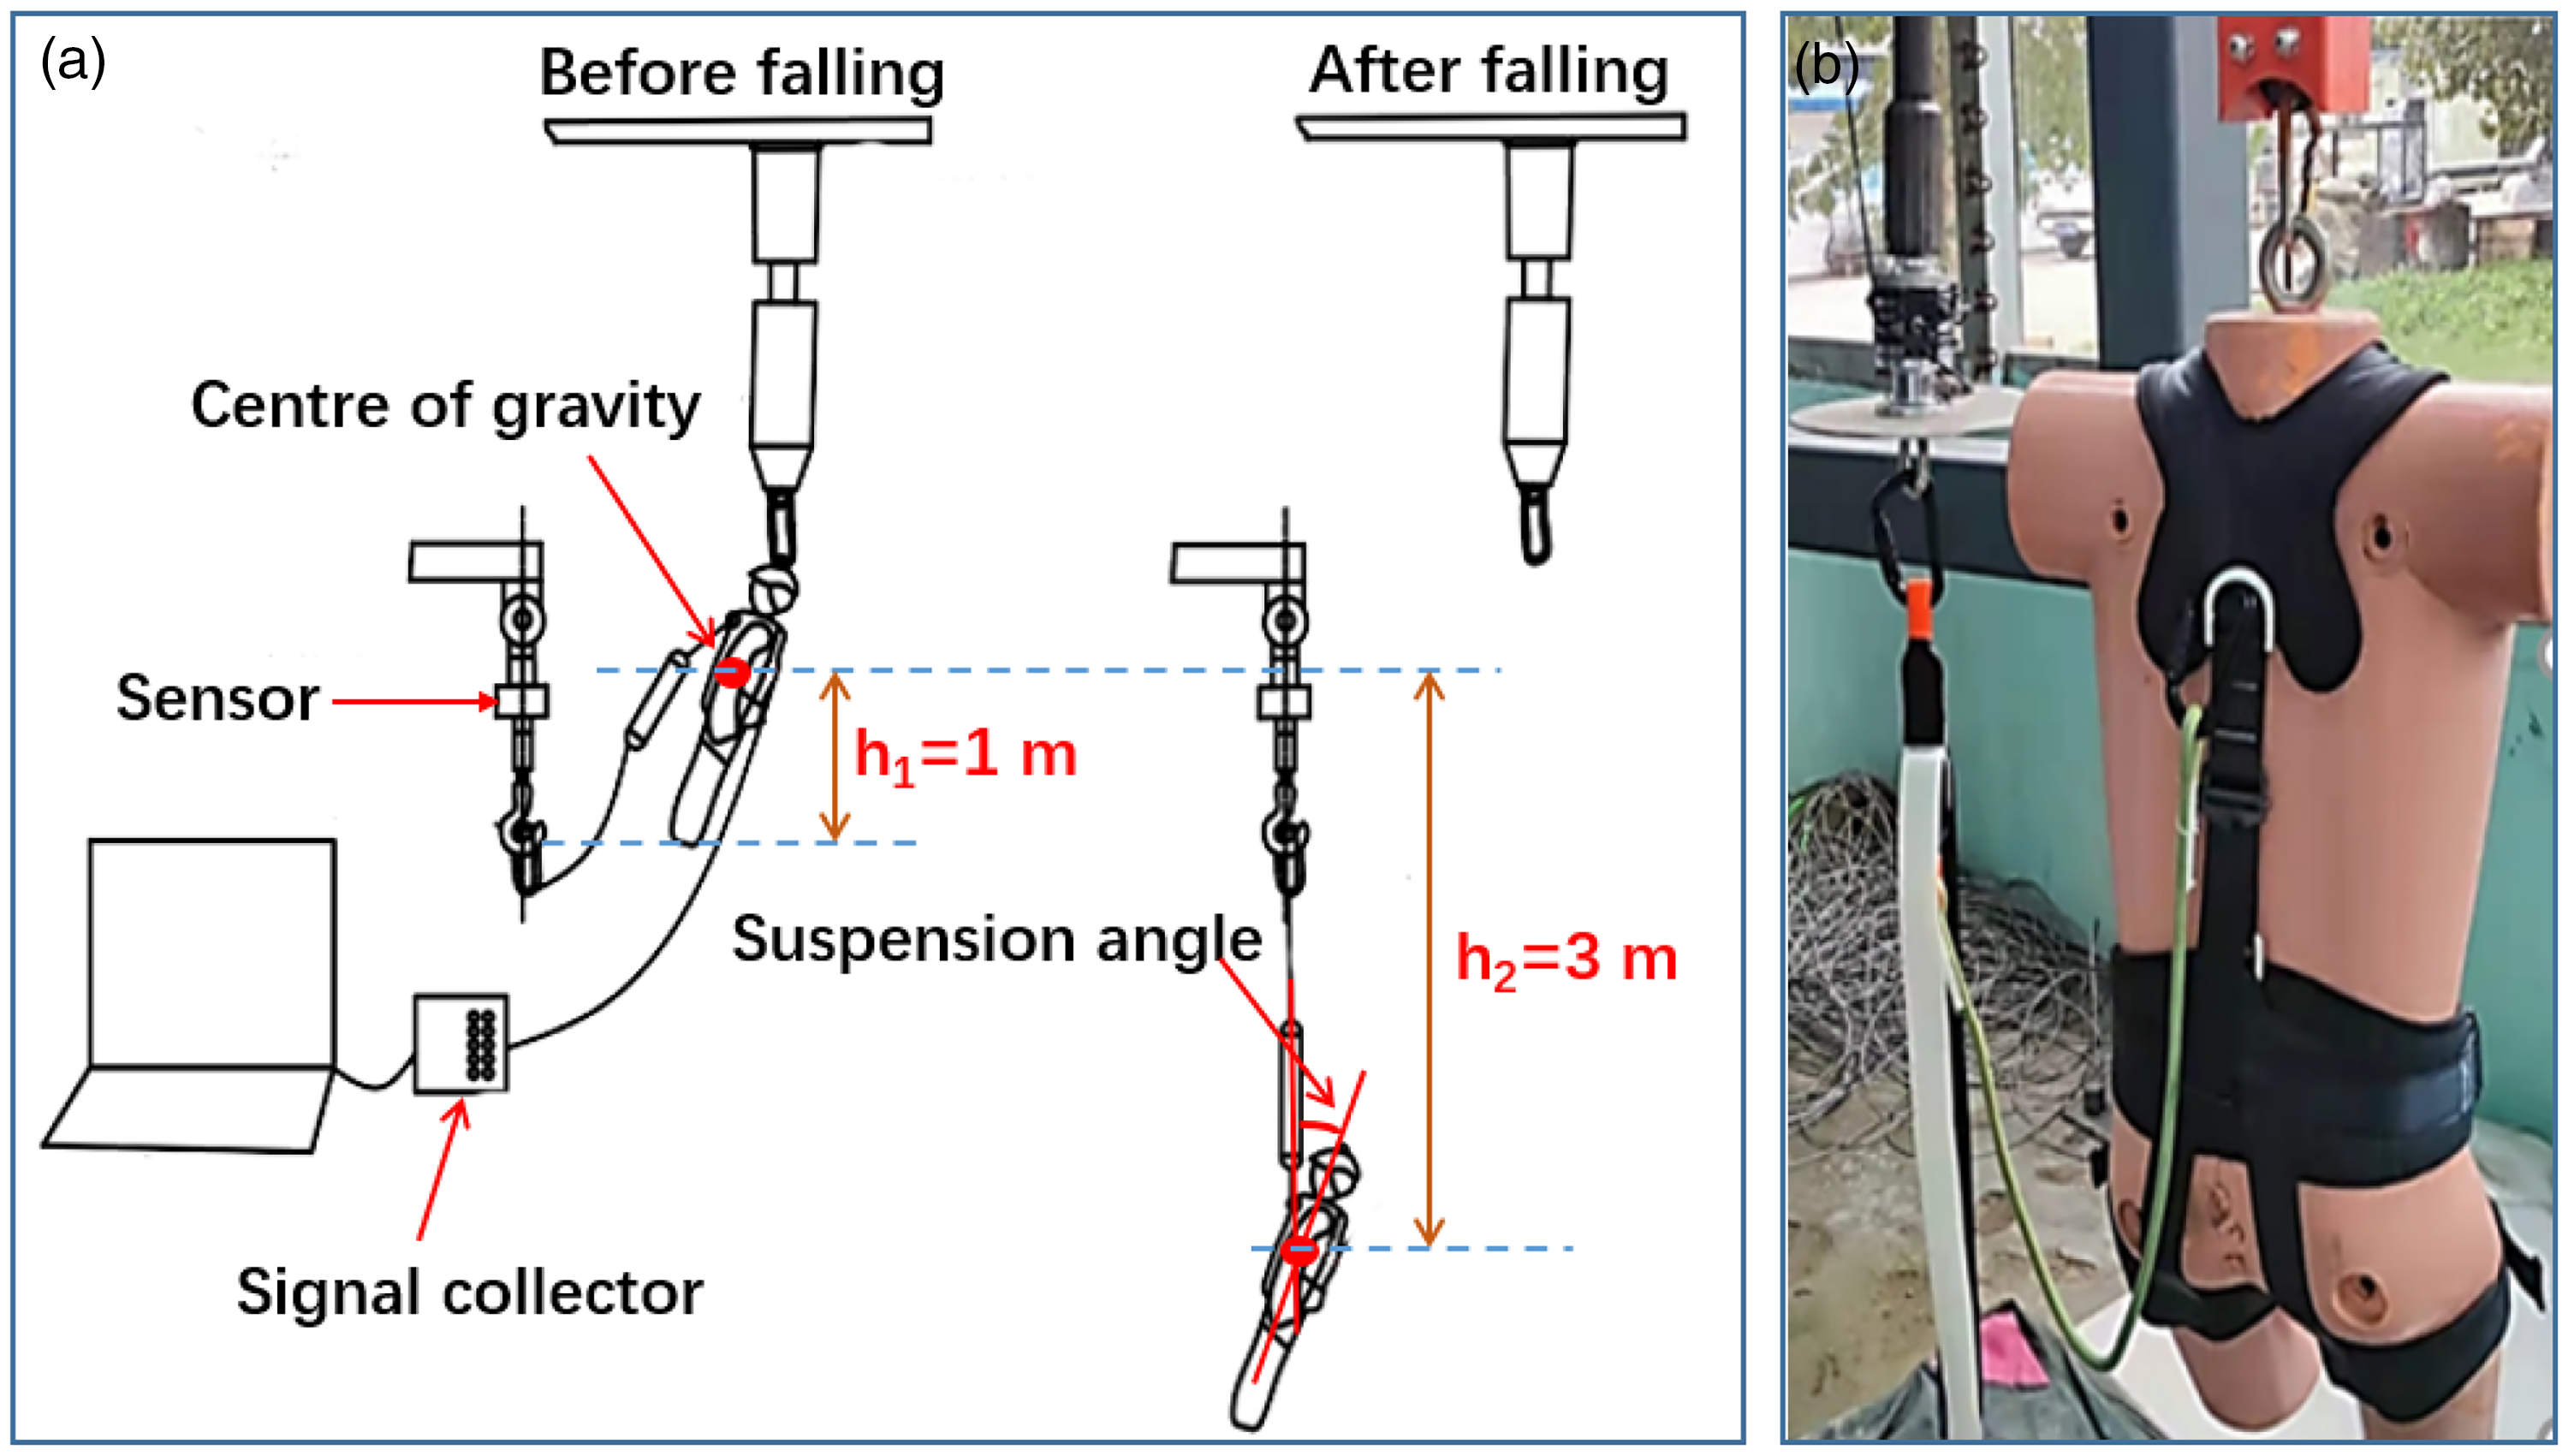
Dynamic fall test: (a) schematic diagram of the dynamic fall test process and (b) dummy test site.
Results
Pressure analysis of the front hanging point
Jinyue Liu 23 studied the maximum pressure when the different parts of the human body feel uncomfortable, which is taken as the critical value in this paper. The pressure distribution results of seat belts at different hanging points are shown in Figure 5. Figure 5(a) shows the pressure of different front hanging points. The force reached 57 N, exceeding the critical value (55 N) at FA. The hanging point position FA made the center of gravity of the human body move from the abdomen to the waist. Therefore, the seat belt exerts most external forces on the core. However, the LLAOM protects most internal organs. The pressure value at this part must be below the critical value.
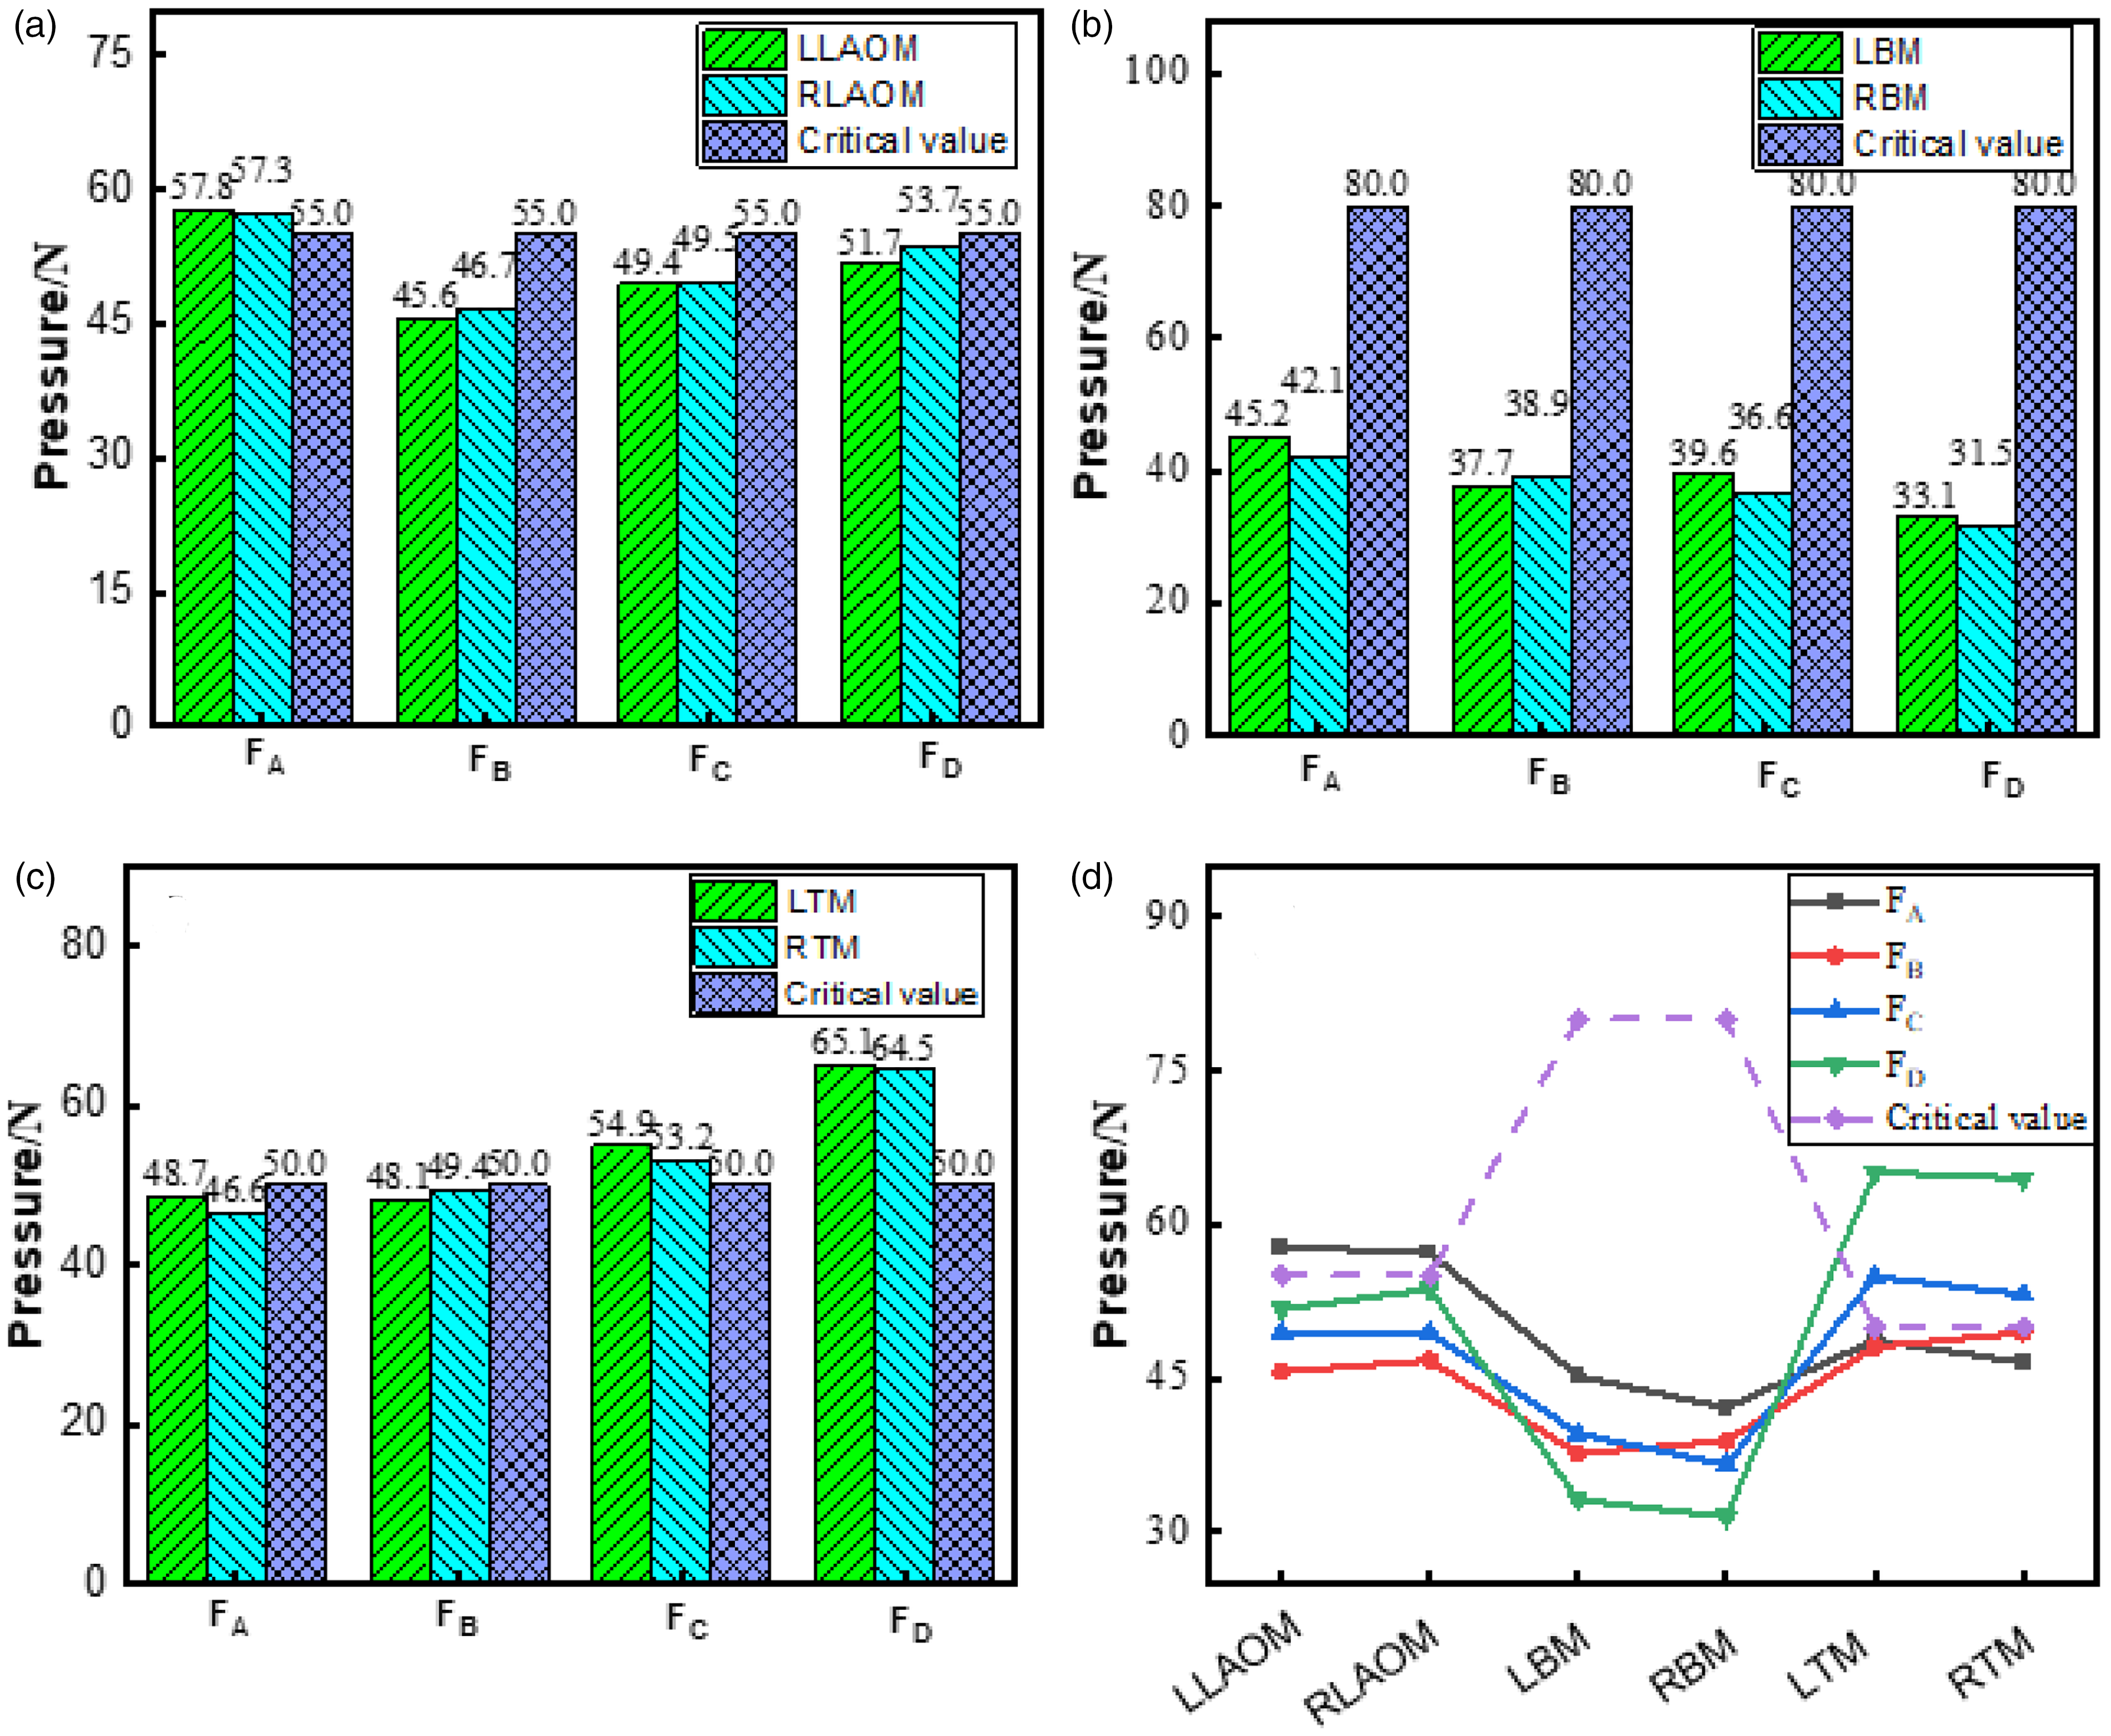
Test results of the pressure distribution at different front hanging points: (a) pressure distribution of the left lateral abdominal oblique muscle (LLAOM) and right lateral abdominal oblique muscle (RLAOM); (b) pressure distribution of the left biceps muscle (LBM) and right biceps muscle (RBM); (c) pressure distribution of the left trapezius muscle (LTM) and right trapezius muscle (RTM); (d) comparison of pressure values and critical values at various parts.
The pressure values at the four locations for the LBM and RBM are below the critical value in Figure 5(b). The pressure value at FA of 45.2 N is the largest. The pressure value of the LBM increases and reaches the maximum value when the position of the hanging point moves from FA to FD. The LTM and RTM bore forces of 65.1 and 64.5 N, respectively, much higher than the critical value of 50 N (Figure 5(c)). The center of gravity of the human body moving to the waist and abdomen resulted in more pressure on the trapezius muscle. Here, FB is the best among the four hanging points, as all the pressure on the muscles was under the critical value when all the results were compared.
Table 2 further analyzes the pressure distribution results of seat belts at different front hanging points. The results showed that the p value and ΔFmax value of position FB are the smallest among the four positions, indicating that the pressure distribution of the seat belt in position B is the most uniform. The closer the front hanging point position is to the armpit baseline of the human body, the more the center of gravity of the human body moves below the abdomen. As a result, the decreased suspension angle increased the uniformity of pressure distribution in all parts of the seat belt.
Results of pressure distribution uniformity at four front hanging points

Pressure analysis of the back hanging point
The pressure distribution results of seat belts at different back hanging points are shown in Figure 6. Point BC was the only position with pressure, which is 47.8 N, on the LLAOM under the critical value of 55 N, while the pressure values of points BA and BB both exceed the critical value, with 61.1 and 56.7 N, respectively. Figure 6(b) shows the pressure of the LTM and RTM of the human body at different back hanging points. Unfortunately, the pressure values at the three points, BA, BB, and BC, all exceed the critical importance of the pubic muscle (38 N). This shows that choosing back hanging points is less comfortable than front hanging points. Figure 6(c) shows that the LPM and RPM pressure value at each hanging point is below the critical value (50 N). When the hanging point moves from BA to BC, the pressure on the trapezius muscle gradually increases. The closer the hanging point is to the trapezius muscle, the shorter the action arm and the greater the pressure on the trapezius muscle. When the back hanging point is at point BC, the pressure is less than that of the other two positions.
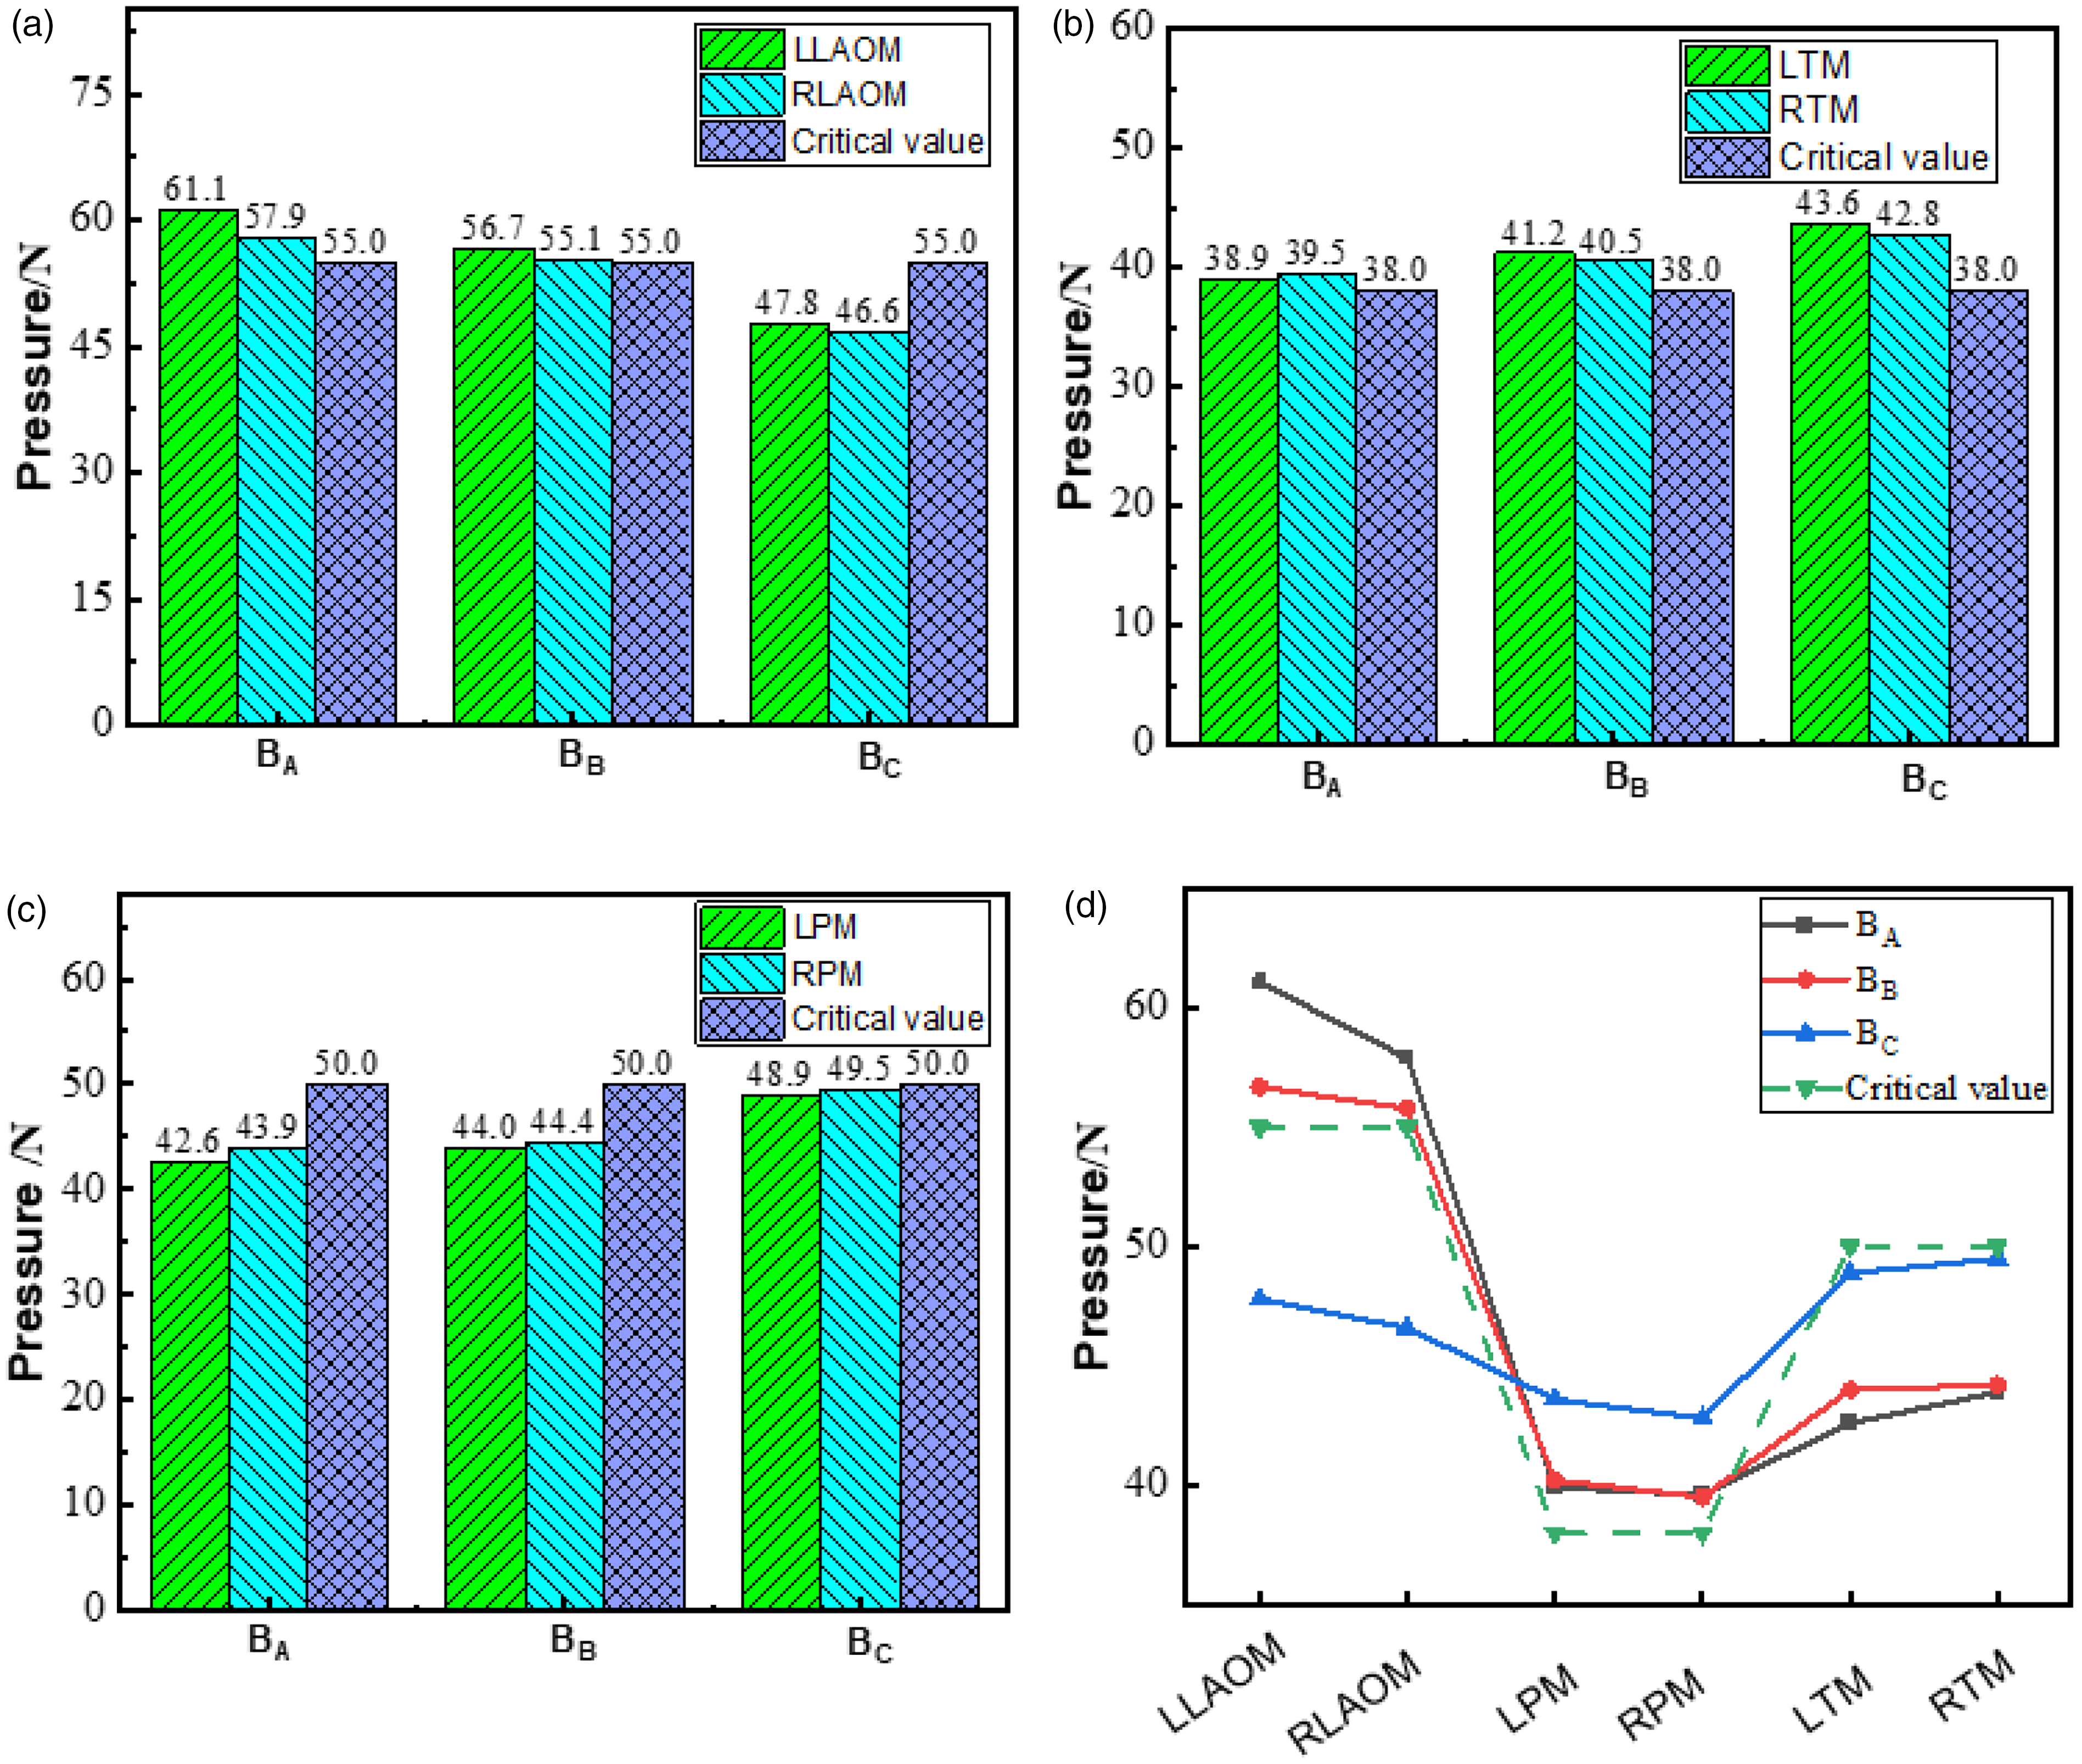
Test results of pressure distribution at different back hanging points: (a) pressure distribution of the left lateral abdominal oblique muscle (LLAOM) and right lateral abdominal oblique muscle (RLAOM); (b) pressure distribution of the left pubic muscle (LPM) and right pubic muscle (RPM); (c) pressure distribution of the left trapezius muscle (LTM) and right trapezius muscle (RTM) and (d) comparison of pressure values and critical values at various parts.
The uneven coefficient p and the maximum pressure difference ΔFmax under different back hanging points are shown in Table 3. The p value and ΔFmax value at position BC are the smallest, indicating that the pressure distribution of the seat belt at position BC is the most uniform. The farther the position of the hanging point is from the trapezius muscle, the more the center of gravity of the dummy moves from the hip to the waist. With the increases in the suspension angle, the degree of the dummy's forward tilt increased. This will cause pressure accumulation at the core of the human body, such as in the oblique muscles of the external abdomen, aggravate the uneven distribution of seat belt pressure, and cause serious consequences, such as injury of the lumbar vertebrae or internal organs.
Results of pressure distribution uniformity at three back hanging points

Pressure analysis of seat belts with different ribbon widths
The pressure distribution at the front and back hanging points of ribbons with different widths is shown in Figure 7. When the width of the ribbon increases from 33 to 45 and 55 mm, respectively, the LLAOM pressure decreases from 66.4 to 55.9 and 49.5 N, and the pressure reduces by 13.2% and 23.1%, respectively. The RLAOM pressure decreased from 53.1 to 46.3 and 41.3 N, and the pressure values fell by 12.8% and 22.2%. Biceps pressure decreased from 37.3 to 33.9 and 33.1 N, and the force dropped by 6.7% and 9.1%, respectively. The trapezius muscle is the most stressed part in the three kinds of seat belts. This is because the center of gravity of the dummy is located in the middle and upper part of the human body when the front hanging point is suspended. However, among the three seat belts, the seat belt with a width of only 55 mm is below the critical value, which indicates that the wider the ribbon width of the seat belt, the greater the contact area between the seat belt and the human body, thus reducing the pressure on this part and improving the overall comfort of the seat belt.
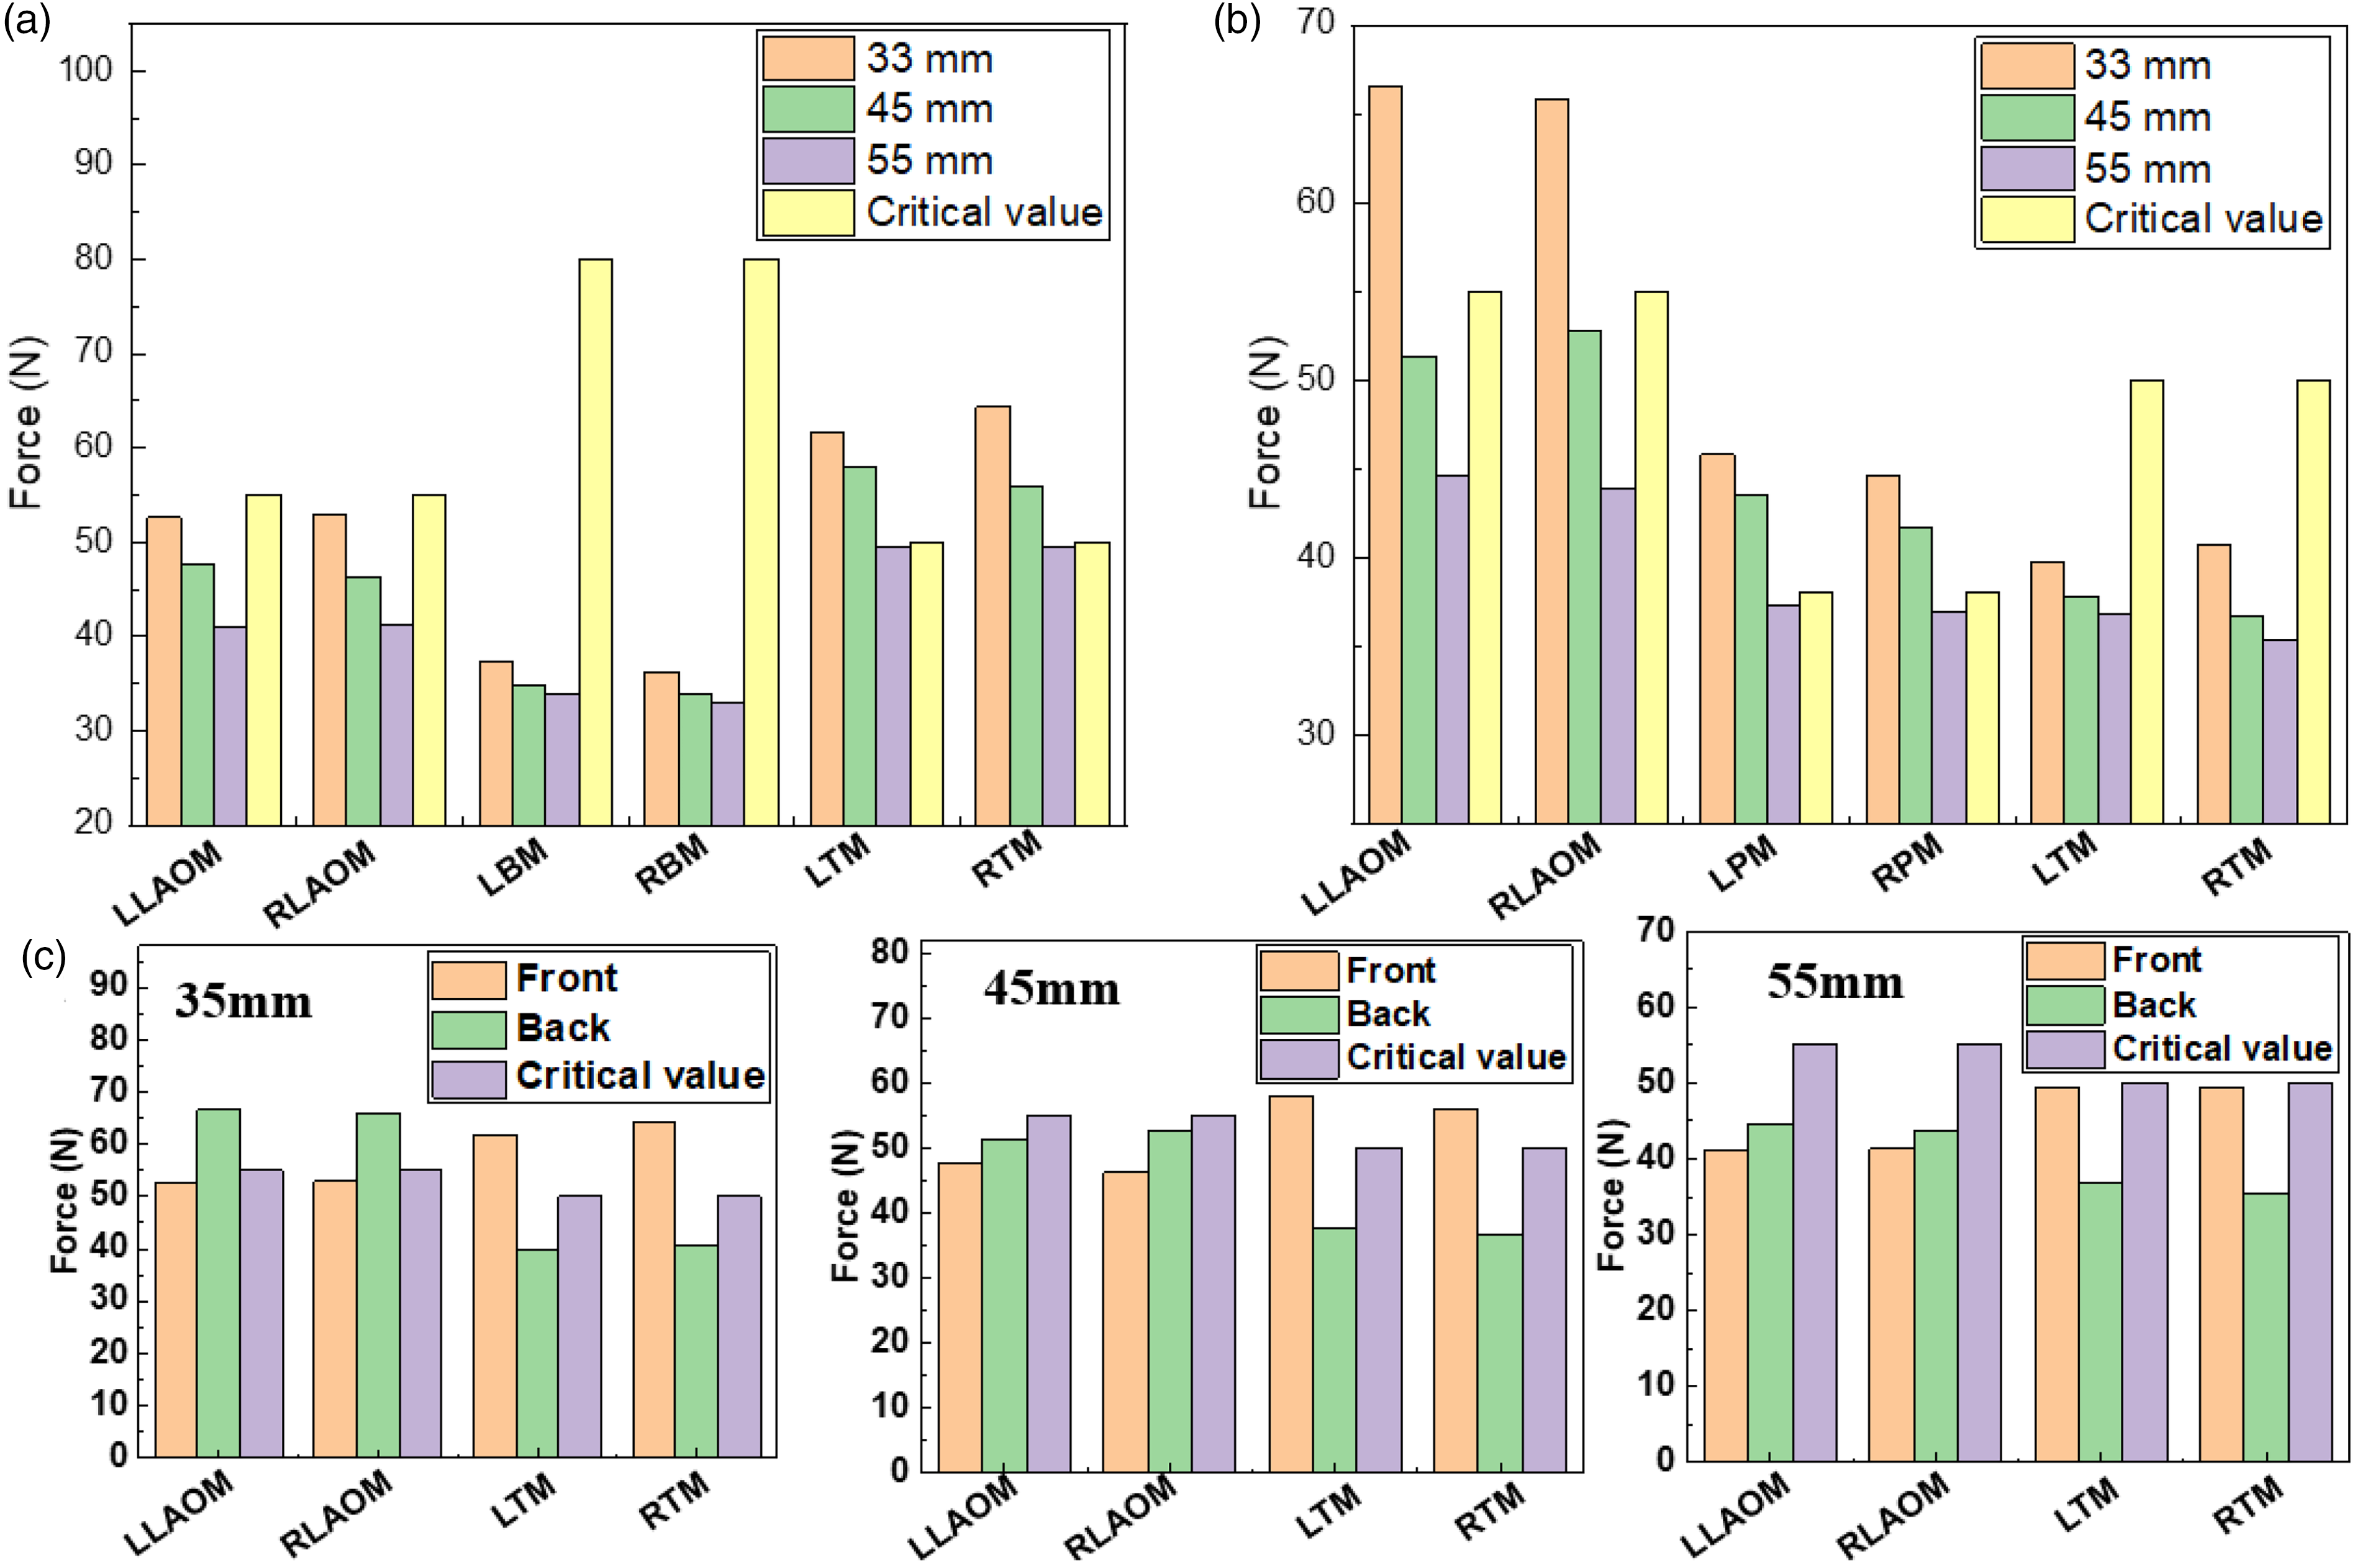
Static suspension force distribution of different ribbon widths: (a) front suspension point force distribution; (b) back suspension point force distribution; (c) force comparison of front and back hanging points of the fall arrest belt with different widths. LTM: left trapezius muscle; RTM: right trapezius muscle; LLAOM: left lateral abdominal oblique muscle; RLAOM: right lateral abdominal oblique muscle; LBM: left biceps muscle; RBM: right biceps muscle.
The pressure distribution test of the back hanging point is shown in Figure 7(b). The pressure values of the trapezius muscles of the three kinds of seat belts are all below their critical value (50 N). When the widths of the ribbon were increased from 33 to 45 and 55 mm, the pressure values of this part decreased from 40.8 to 36.7 and 35.4 N, and the pressure decreased by 10.0% and 13.2%, respectively. With a ribbon width of 33 mm, the pressure of the seat belt exceeds the critical value (55 N). The pressure of the lateral abdominal oblique muscle is below the critical value of 38 N only when the safety belt has a ribbon width of 55 mm. The wider the ribbon width of the seat belt, the better the comfort. It is feasible to use a wide belt to improve the test scheme of the seat belt structure.
For fall arrest belts of varying widths, the force experienced at both the front and back hanging points tends to follow a similar trend. However, for LLAOM and RLAOM areas, the force is greater at the back hanging point. Nonetheless, when the belt width exceeds 45 mm, people will not feel any discomfort. On the other hand, for the LTM and RTM areas, the back mounting point can significantly reduce force, even for a 35 mm wide belt.
Dynamic fall analysis
The falling process of the fall arrest seat belt can be divided into four stages, as shown in Figure 8. Falling begins in the first stage with the seat belt not completely straightened. In the second stage, the safety rope is deployed while the buffer is not. In the third stage, the buffer starts to work to absorb the energy. In the last stage, the speed gradually decreases to 0.
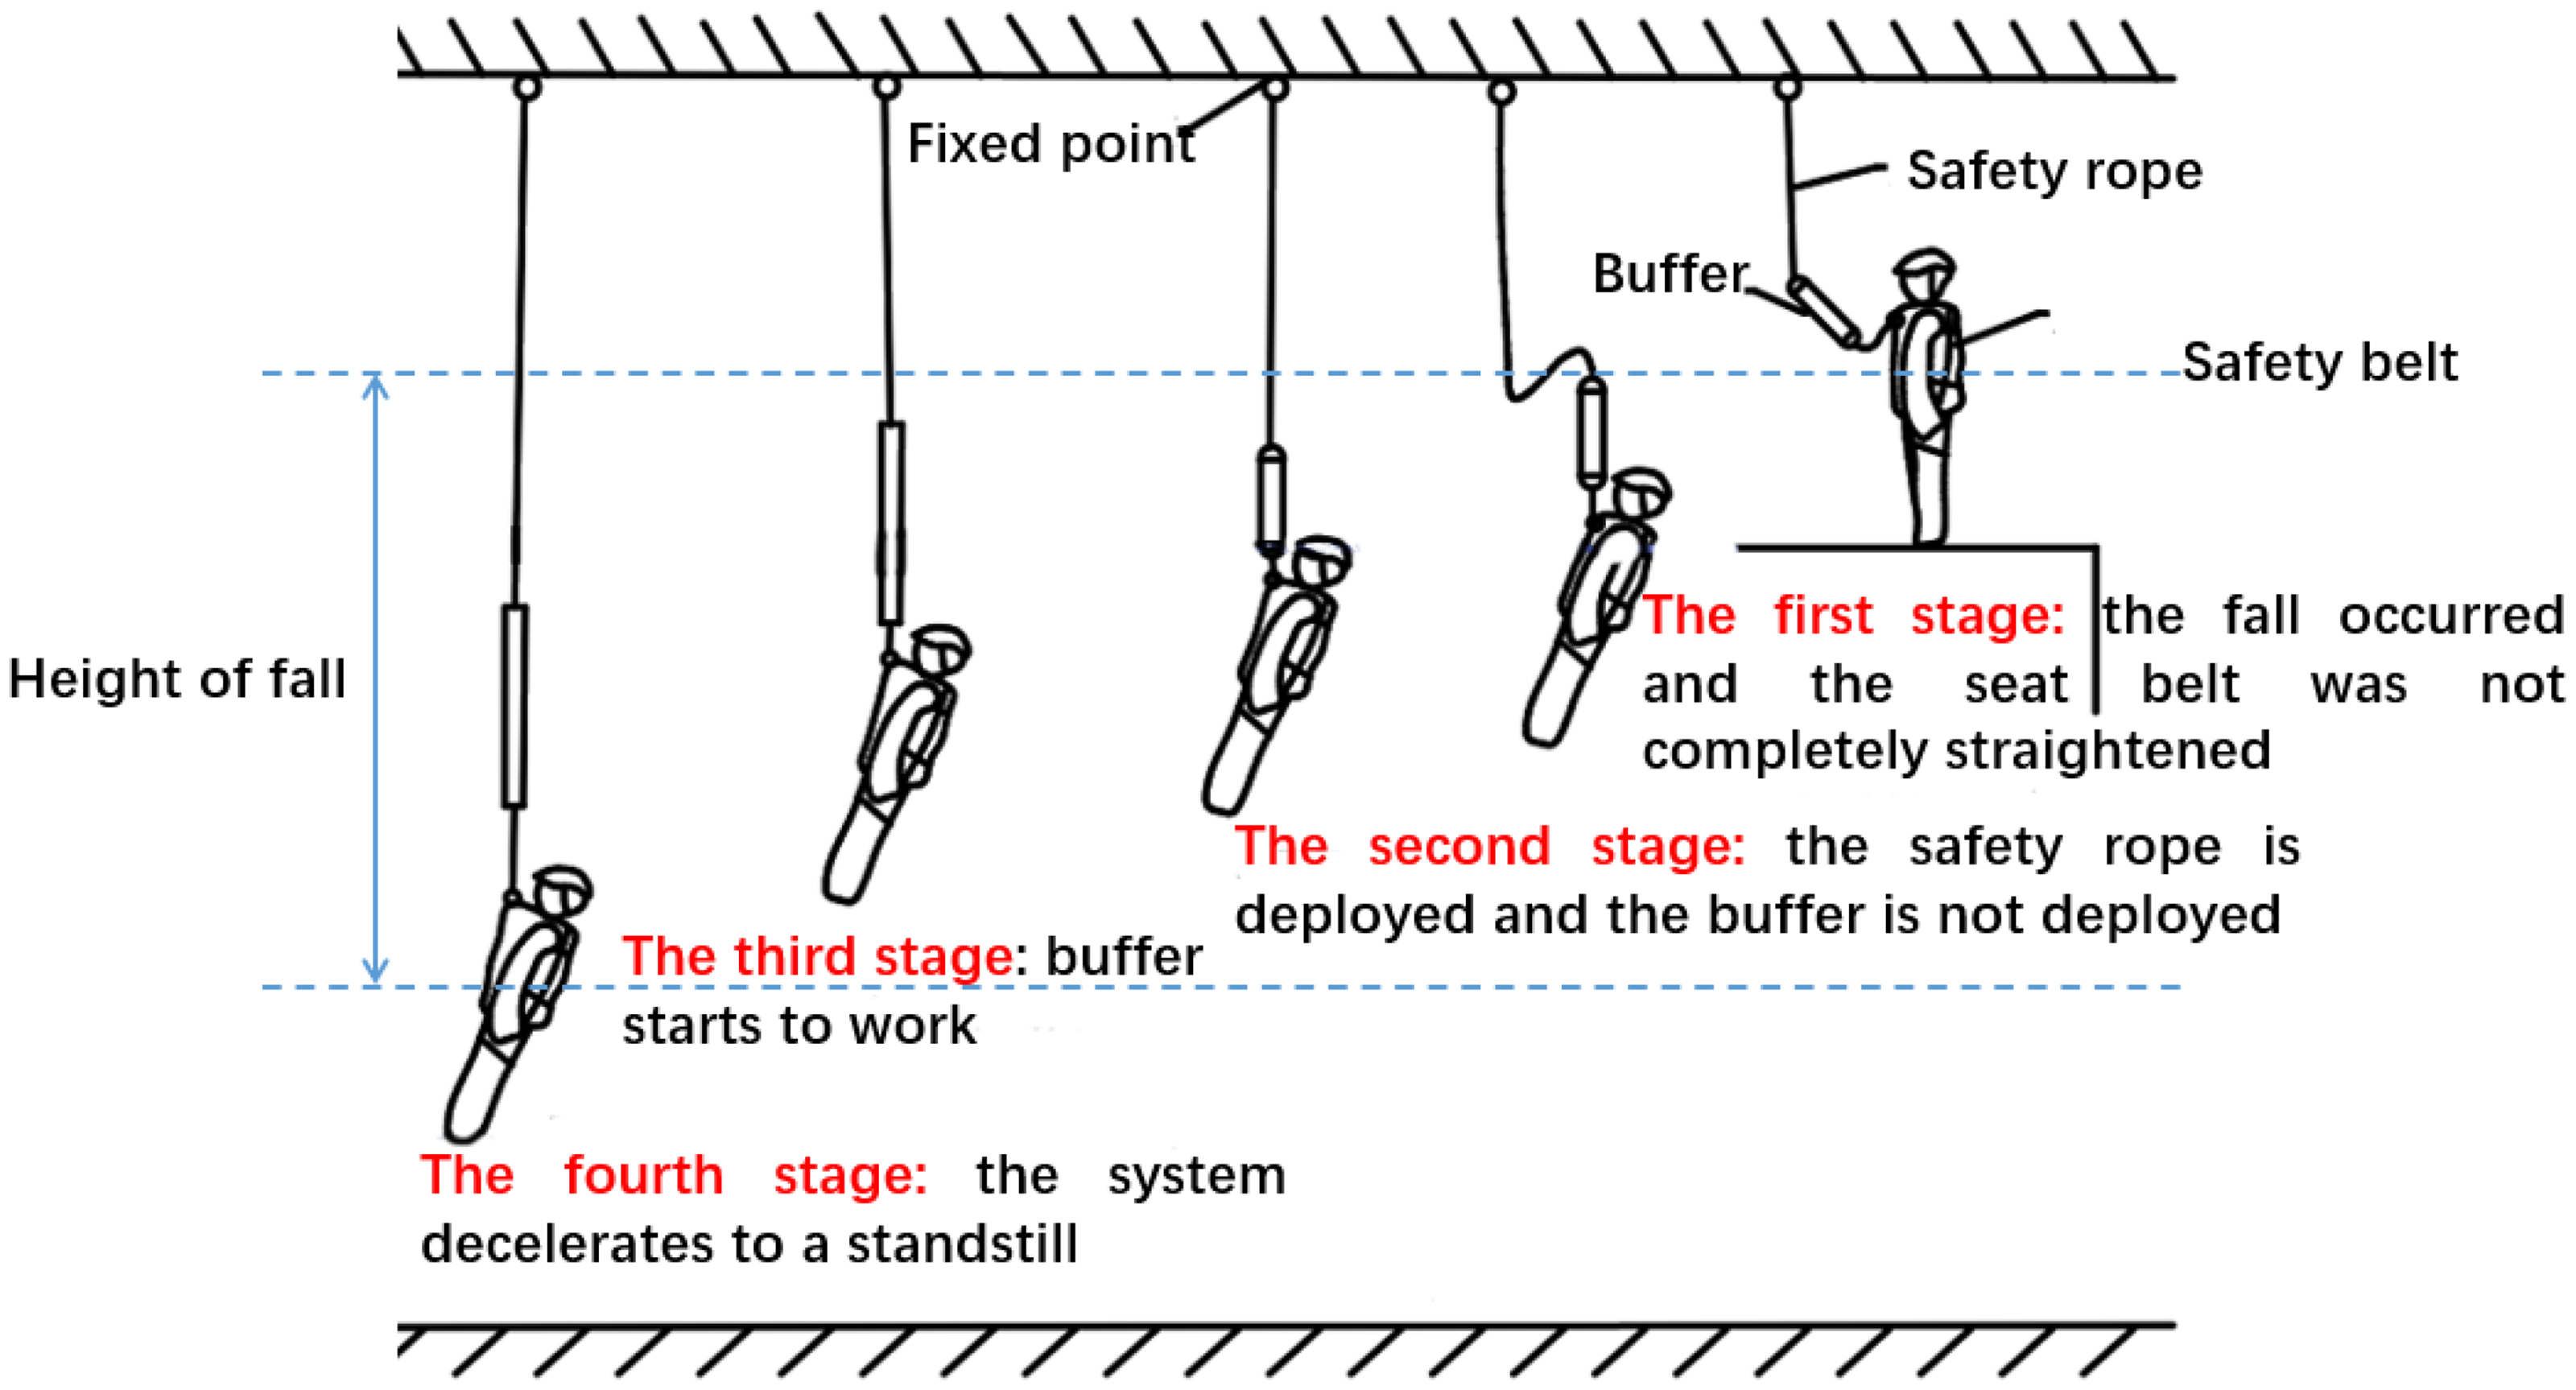
The falling process.
The dynamic fall of wide–narrow changing seat belts and ordinary seat belts is tested, and the results are shown in Figure 9. The braking force–time curve of wide–narrow changing seat belts in the process of dynamic falling showed that the braking force is kept at 0 N within about 750 ms. This corresponds to the first stage of the dummy's dynamic falling process. Then the braking force gradually increased from 0 kN to the maximum value of 4.6 kN at 750–1050 ms. After that, the curve began to fluctuate up and down. Working the safety rope and buffer contributed to the change of braking force. After the system buffering is completed, the curve begins to decline gradually until reduced to 0 kN. That is, the falling is stopped. It can be seen that the maximum braking force and acceleration of wide–narrow changing belts in dynamic falling are smaller than those of ordinary belts.
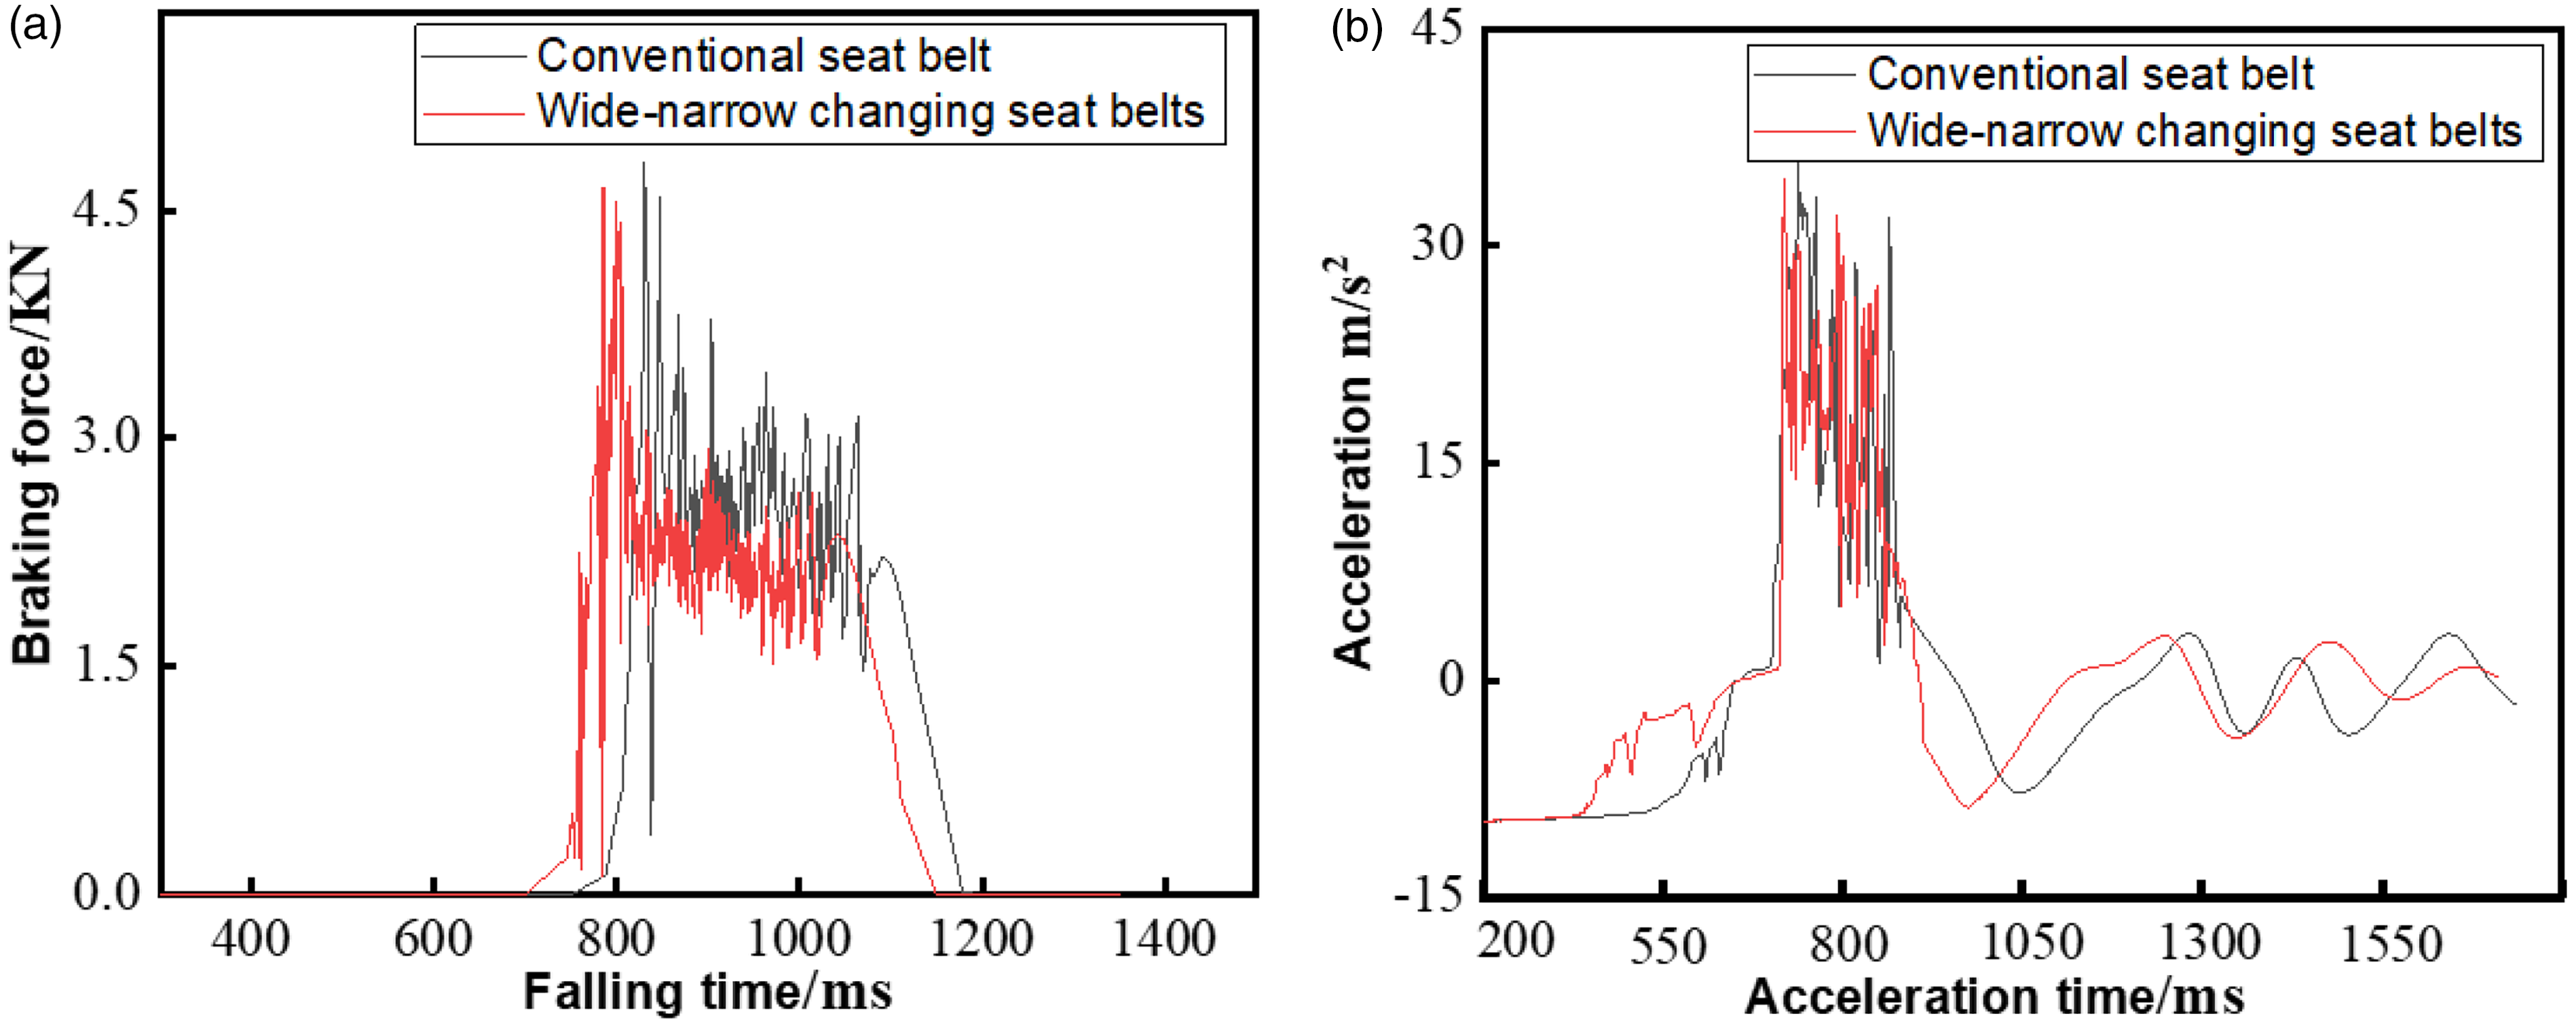
Dynamic force analysis of falling: (a) falling time and (b) acceleration.
The acceleration–time curve of wide–narrow changing belts during a dynamic fall can be seen in Figure 9(b). The acceleration value of belts during a fall gradually increases from –9.81 to 0 m/s2, more than 750 ms. After 750 ms, the acceleration gradually increased to the maximum value of 34.7 m/s2. The acceleration fluctuates up and down in the buffer stage. Then it drops to 0 m/s2 around 1050 ms. After that, the acceleration curve fluctuates slightly around 0 m/s2 because the seat belt swings left and right after falling and stopping. The acceleration–time curve of regular seatbelts is similar to that of wide–narrow changing seatbelts. However, the maximum acceleration value of normal seatbelts during falling is 36.3 m/s2, 1.6 m/s2 larger than that of wide–narrow changing seatbelts. The full braking force of ordinary seatbelts is also 200 N larger than that of wide–narrow changing seatbelts.
Figures 9 and 10 show the dynamic pressure values of the two kinds of seat belts. The force of the two types of seat belts in the process of falling reached the peaks of 4.8 and 4.6 kN, respectively. The RTM is the primary stress site of the two kinds of seat belts, with force values of 211.8 and 123.2 N, respectively. The LLAOM is the least stressed, with force values of 68.1 and 88.4 N, respectively. The stress on the LTM and RTM of the ordinary belts is much higher than that of the wide–narrow changing belts. The results show that a slight change in ribbon width can significantly improve the protection effect.

Stress analysis in the falling process. LTM: left trapezius muscle; RTM: right trapezius muscle; LLAOM: left lateral abdominal oblique muscle; RLAOM: right lateral abdominal oblique muscle; LBM: left biceps muscle; RBM: right biceps muscle.
The results of dynamic pressure distribution uniformity of different seat belts are shown in Table 4. The variable coefficient of pressure distribution p of ordinary seat belts and wide–narrow changing seat belts are 0.68 and 0.28, respectively. The ΔFmax values of the six test sites were 143.7 and 34.8 N, respectively. The coefficient p and the maximum pressure difference ΔFmax of ordinary seat belts are more than twice those of wide–narrow changing seat belts. This shows that the wide–narrow changing seat belts are more conducive to the uniform distribution of pressure.
Analysis results of dynamic pressure distribution uniformity of different seat belts

Conclusions
This paper proposes a method to assess the pressure distribution in various parts of a seat belt using pressure-sensitive paper. The static and dynamic hanging points and ribbon types are tested for their pressure levels. The visual examination of the stress distribution on the fall arrest belt helps to quickly identify areas with high or excessive stress, guide optimal design decisions, and enhance safety and comfort. The hanging positions significantly impact the pressure distribution, with the front hanging point having much lower pressure than the back hanging point. When the suspension point is point B of the front, all the detection points display pressures below the comfort threshold, indicating that the overall level of comfort is currently at its highest. When the width of the ribbon increases from 33 to 55 mm, the pressure decreases by approximately 20%. The LTMs and RTMs of ordinary belts experience 200% the stress as those of wide–narrow changing belts. A minor variation in ribbon width can significantly improve the protection effect. The maximum acceleration value of normal seatbelts during falling is 36.3 m/s2, 1.6 m/s2 larger than that of wide–narrow changing seatbelts. The variable coefficient of pressure distribution p for ordinary seat belts and wide–narrow changing seat belts decreases from 0.68 to 0.28.
Footnotes
Declaration of conflicting interests
The author(s) declared no potential conflicts of interest with respect to the research, authorship, and/or publication of this article.
Funding
The author(s) disclosed receipt of the following financial support for the research, authorship, and/or publication of this article: This work was supported by the Key Laboratory of High Performance Fibers & Products (23D110632/011), the Key Laboratory of Textile Science & Technology (Donghua University) (2232023G-01), the Basalt Fiber and Composite Key Laboratory of Sichuan Province (XXFC-2201), the National Engineering Laboratory for Modern Silk (SDGC2244), and the National Natural Science Foundation of China (51776034).
