



Abstract
The construction of 3D (three-dimensional) human model is the key link to the development of intelligent technology in garment engineering. In order to establish more convenient and efficient 3D human reconstruction methods based on semantic-driven parameters, we study semantic parameter prediction and 3D human reconstruction. Based on the self-collection database, we adopt the semantic parameter prediction method combining strong and weak correlations, and innovatively realize the automatic prediction of the remaining 12 parameters by entering the two parameters of height and weight. Then, the mapping relationship between the 14 semantic parameters and the 3D human template model is established to complete the personalized 3D human body reconstruction. Results show that the reconstruction error of each part of personalized 3D human body reconstruction is basically within ±1.5 cm, which meets the requirements of 3D human modeling for clothing size design. Further studies can use these results for the development and intellectualization of digital garment engineering
The clothing industry is developing from the traditional production and sales mode in the digital and intelligent direction, such as in online virtual fitting, personalized clothing customization, etc. The efficient and accurate establishment of a three-dimensional (3D) human model that conforms to the size of the human body is the key to show the effect of fitting. Therefore, a precise 3D human body reconstruction method must be established that is suitable for the garment industry and capable of restoring its own characteristics.1,2
Existing 3D human modeling methods involve 3D scanning technology, specific software, visual imaging, and semantic parameter (human body size data) driven parametric modeling.3 –5 The equipment used to establish a 3D human model based on 3D scanning technology has a large volume and comes at high cost. Building a 3D human model based on specific software requires sufficient expertise and time. Furthermore, the establishment of a 3D human model based on visual images has multiple requirements for the shooting background and subject. In short, the above three methods not only rely on specific equipment, but also have high requirements for the used methods, so the efficiency of establishing a human body model is low, making it difficult to meet the rapid development needs of virtual fitting and other technologies in the clothing industry. A personalized 3D human model based on semantic-driven parameters can be established and customized through high-quality body shape dataset learning models and the input of body size data. This represents a convenient and low cost method for consumers. Multiple researchers have conducted studies on this technology. For example, Liu et al. 6 used the traditional optimization algorithm depth frame to fit the Shape Completion and Animation of People (SCAPE) parameter space to generate the 3D human model. Yao et al. 7 drove the pose and shape parameters of the skinned multi-person linear (SMPL) model to deform the 3D human body based on the Kinect sensor. The above methods efficiently deform the human posture and shape as well as muscle details, although the operation time is long. Huang et al. 8 used the principal component analysis (PCA) space of the fully connected network regression characteristic curve to reconstruct a 3D human body based on a female model dataset. Several scholars have designed a mechatronics sensor network based on the characteristic curve to further optimize and establish the upper torso model of the human body. 9 Although the error of these two methods is small, their use population is limited. Xie et al. 10 reconstructed a 3D human body using five anthropometric parameters based on the graph convolution neural network algorithm. Among them, the circumference parameter was obtained based on a human slice ring to improve the reliability of the reconstructed data; however, a small number of dimensional parameters are difficult to accurately express in a personalized 3D human body.
Based on the above research, the current semantic parameter-driven 3D human body modeling method is relatively convenient in hardware, but there are still problems such as complex parameter acquisition and inadequate personalized representation of human body modeling. Human body modeling based on semantic parameters generally requires more size parameters to drive more accurate deformation of the human body, while in fact, most consumers only know their height and weight, and do not know many other parameters. Therefore, this article proposes a semantic parameter prediction method combining strong and weak correlations, and realizes the automatic prediction of the remaining 12 parameters by entering the two parameters of height and weight. Then, based on the SPRING 3D human body dataset, the mapping relationship between the 14 semantic parameters (for the 14 parameters, please refer to the annotation in Figure 1) and the 3D human template model is established to complete the personalized 3D human body reconstruction and deformation. Finally, it is verified by the comparison of model dimensions. This method will provide theoretical support for 3D human reconstruction technology for clothing.
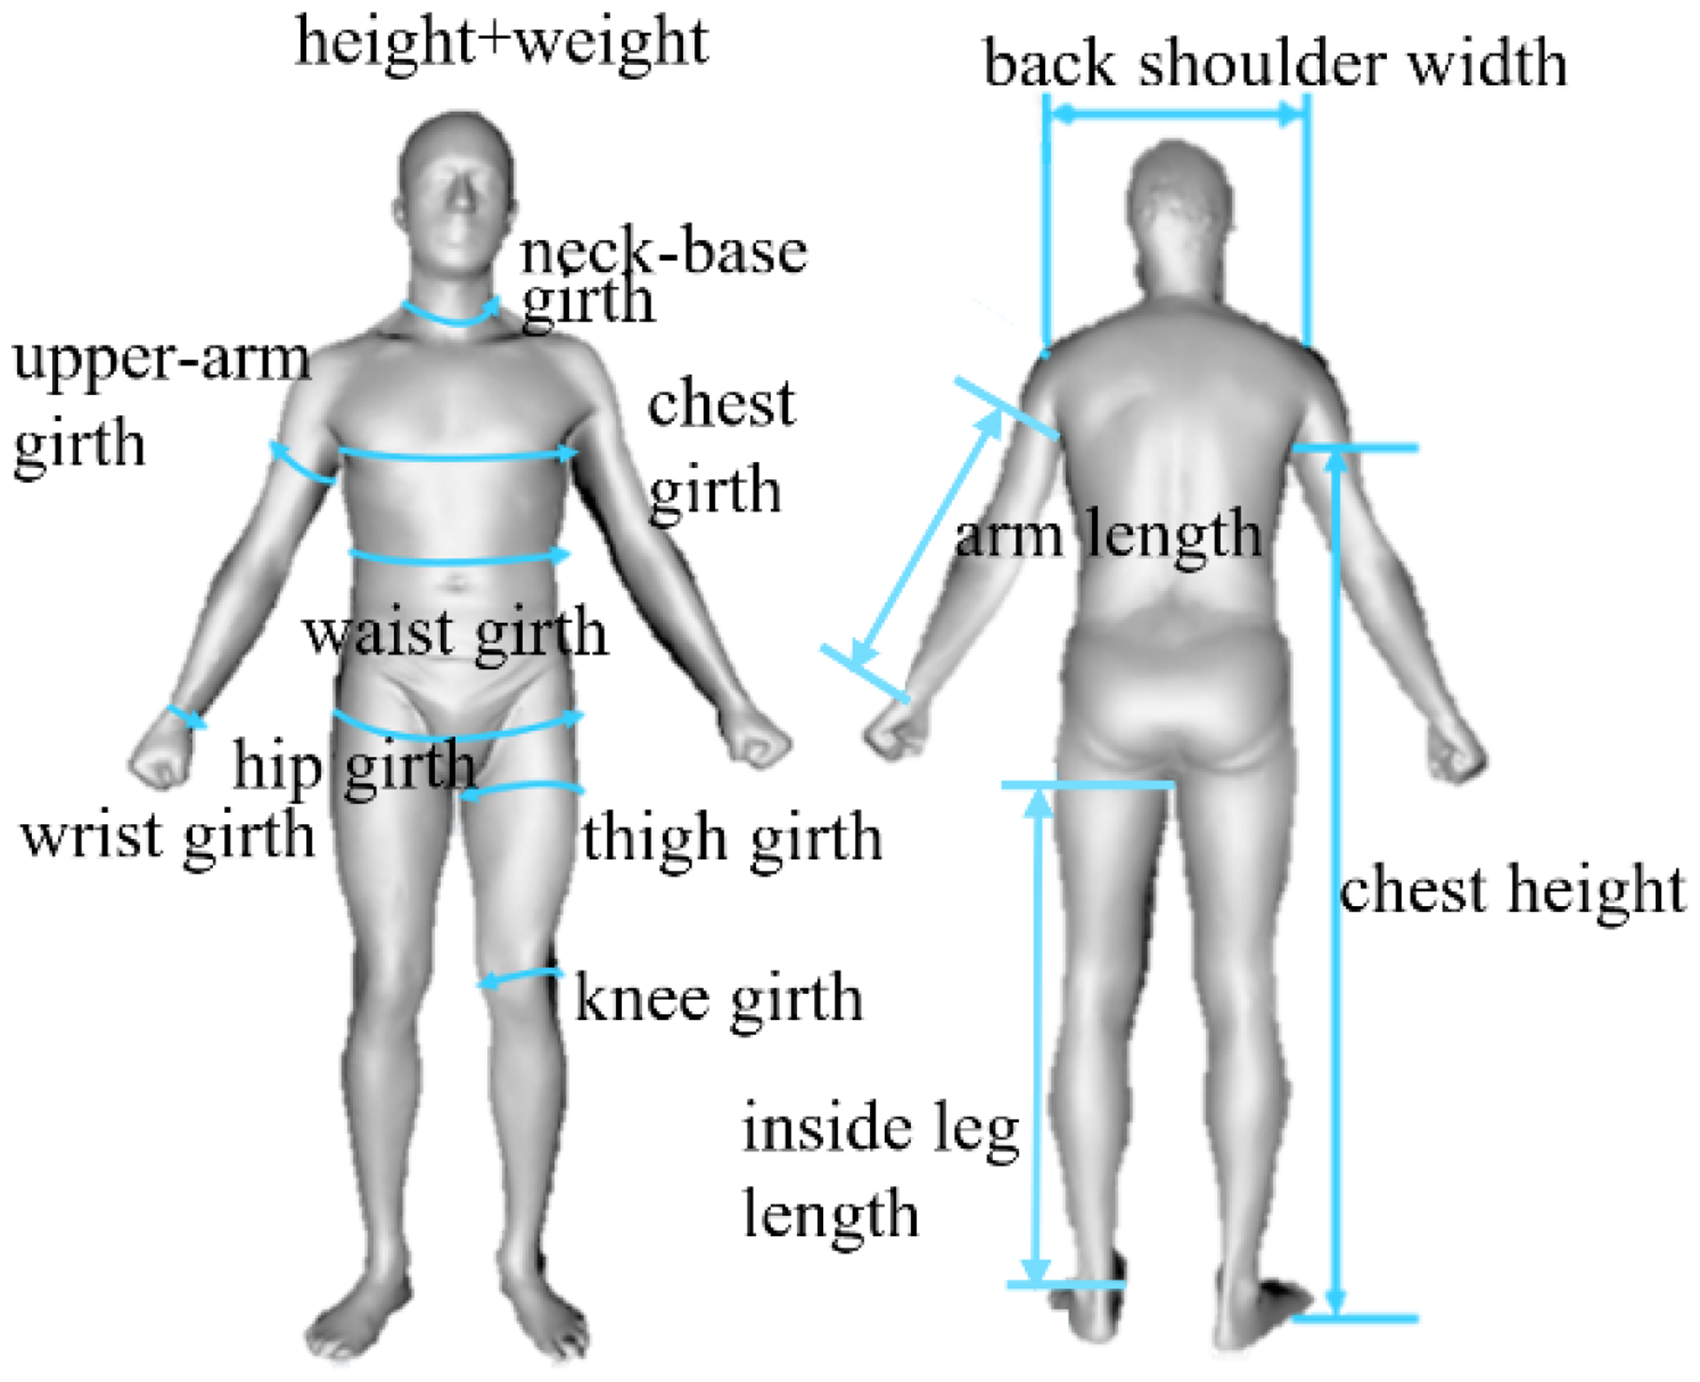
The 14 semantic parameters of the human body.
Construction of a parameterized three-dimensional human body model
Semantic-driven 3D human body model
Parametric human reconstruction consists of two parts, one is semantic parameters and the other is a 3D human dataset that can drive deformation. Human body reconstruction is used to establish the correlation between semantic parameters and the 3D human model to realize the deformation of the human model. For semantic parameters, according to the collection method in China's current national standards, 11 we manually collected 14 size parameters of 130 young men aged 18–23 living in northern China, and then trained the relationship between each parameter. The results of the training can realize semantic parameter prediction, so that users can enter the two parameters of height and weight to obtain the other 12 semantic parameters for human body reconstruction. The mapping relationship between the body part sizes of young men is obtained. This relationship is used for the linkage between body parts when the 3D model is deformed. Currently, European and American human body datasets are widely used,12 –14 and there is no practical Asian human body dataset. Nevertheless, the datasets are universal, and the human body structure remains the same, with only small differences in body shape due to regions and habits. Therefore, we use the SPRING body model datasets as the source of the statistical analysis of the 3D human body model. These are high-resolution model datasets constructed by the combination of the SCAPE and Civilian American and European Surface Anthropometry Resource (CAESAR) datasets The datasets have point-to-point correspondence, and have been processed by loopholes and noise. The dataset of the human body model in a standard standing posture is represented by triangular mesh with consistent mesh topology, 15 as shown in Figure 2.
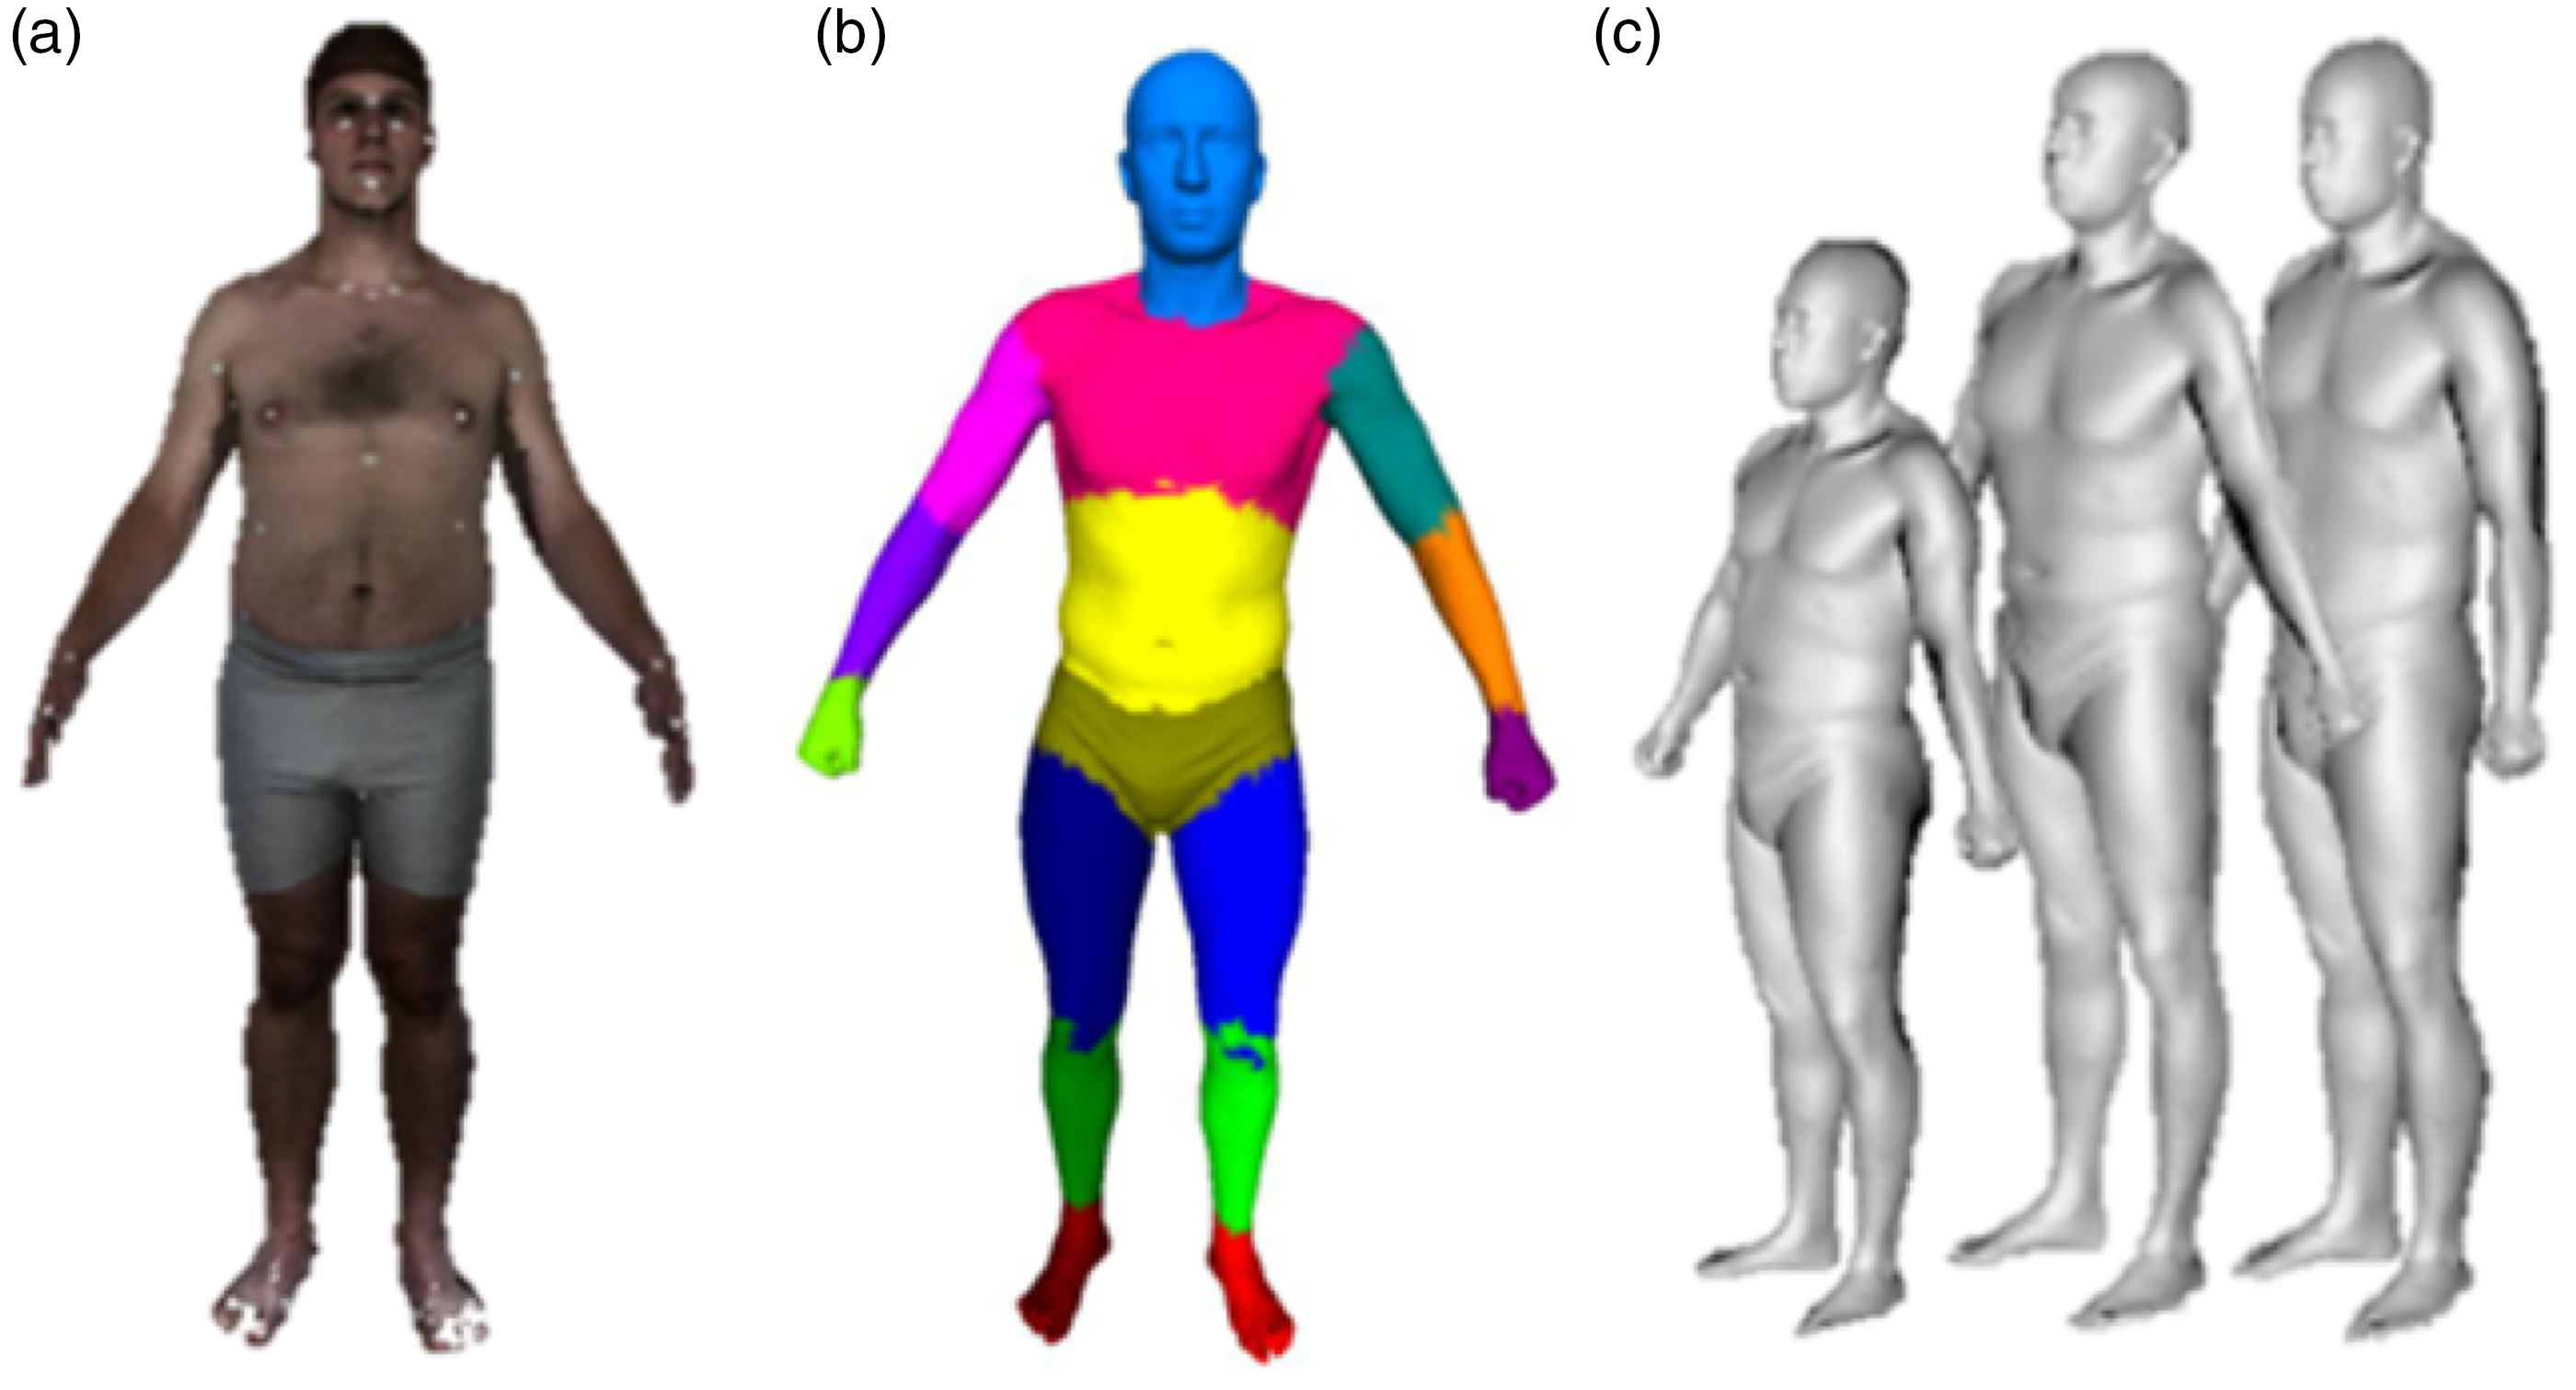
Human model of each dataset. CAESAR: Civilian American and European Surface Anthropometry Resource; SCAPE: Shape Completion and Animation of People.
Based on Python programming, the 3D human body model and corresponding size data can be used for virtual fitting, intelligent garment factories, and mass customization to realize an entirely data-driven process. The workflow of the personalized 3D human reconstruction system driven by semantic values is shown in Figure 3. The semantic parameter prediction and 3D human reconstruction is introduced in detail below.
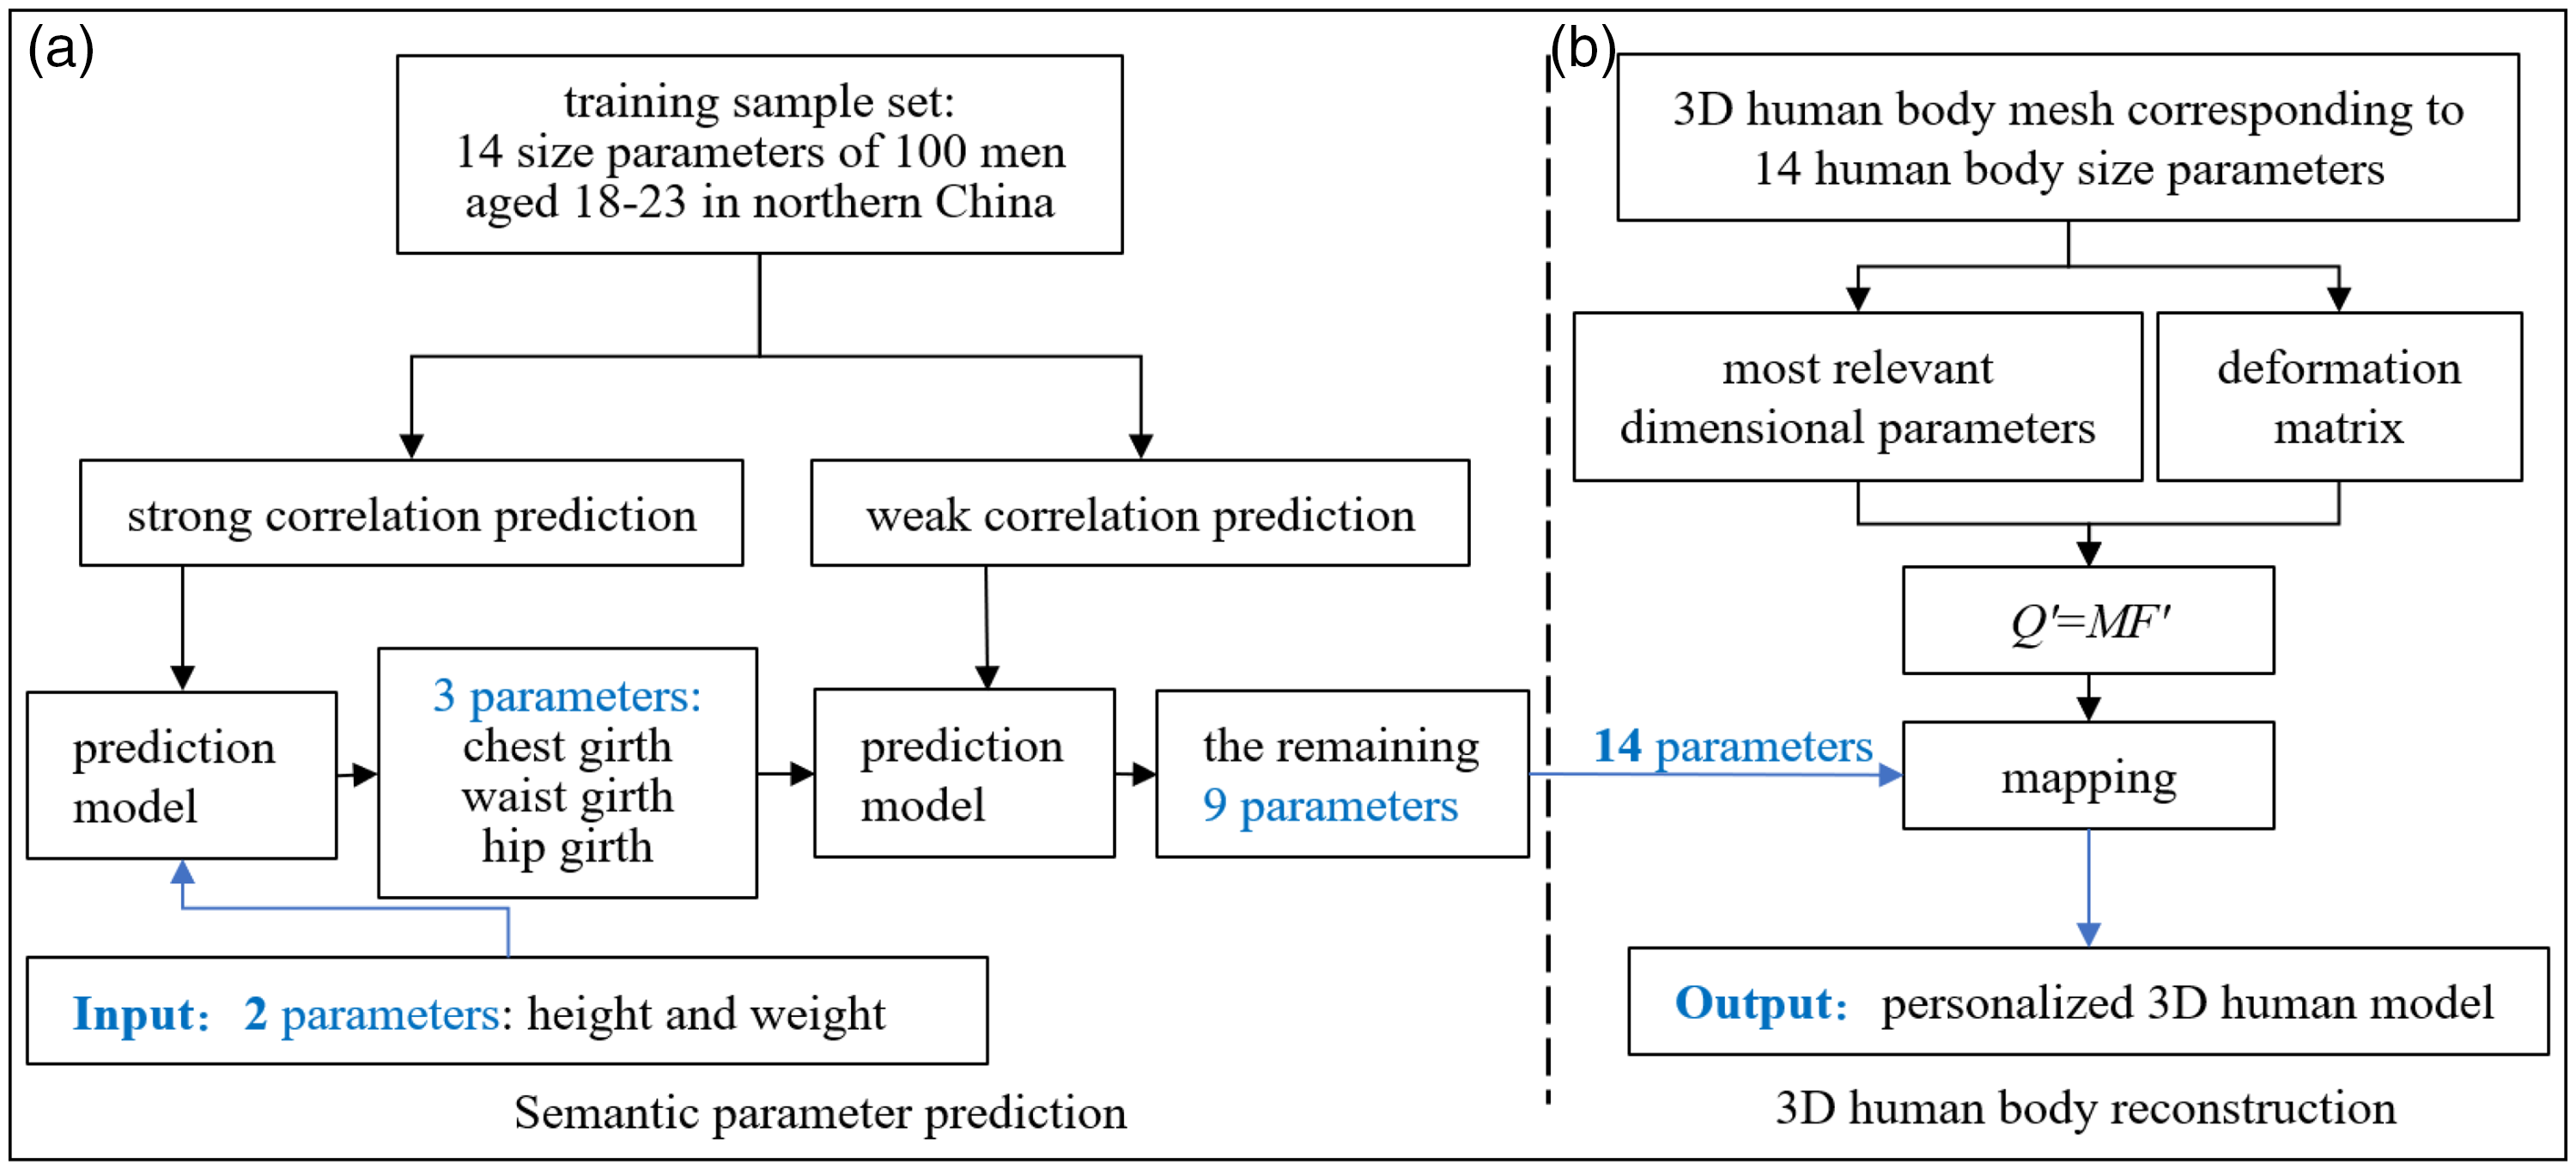
Flow chart of the three-dimensional (3D) human reconstruction system.
Semantic parameter prediction
The semantic parameter prediction takes 100 sets of size data from the self-collection database as the training set, and carries out prediction through strong correlation prediction and weak correlation prediction methods, respectively. This is performed to obtain the remaining 12 human semantic parameters required for modeling by only inputting the body height and weight.
To control the generation of the 3D human model by inputting dimension parameters, the correlation among the dimension parameters must be established first. From the manually collected data, 100 sets of data were randomly selected as sample sets for semantic parameter training to obtain the relationship among the 14 semantic parameters, while the remaining 30 sets are used as the verification sets to measure the accuracy of the predicted semantic parameters and the established 3D human model, The semantic parameters required for specific modeling are shown in Figure 1. The name of each part in the figure refers to the current national standard GB/T 16160-2017, Anthropometric definitions and methods for garment. 16
Before establishing the linear regression model for prediction and analysis, we first must establish the linear relationship among the size parameters. If

By establishing the correlation between the two parameters by Equation (1), Pearson correlation coefficient, it can be found that the chest girth, hip girth, and waist girth have a strong linear relationship with the body weight and body mass index (BMI), while other size parameters showed a weak linear relationship. Some correlation coefficients are shown in Tables 1 and 2.
Pearson coefficient of strongly correlated parameters
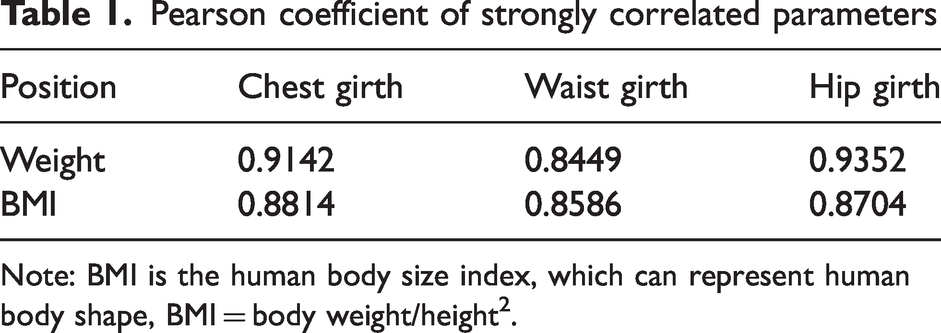
Note: BMI is the human body size index, which can represent human body shape, BMI = body weight/height 2 .
Pearson coefficient of some weak correlation parameters

Note: BMI is the human body size index, which can represent human body shape, BMI = body weight/height 2 .
After obtaining the linear relationship among the semantic parameters to more accurately predict the semantic parameters, we use the combination of strong and weak correlation prediction and use the linear regression algorithm to predict the chest girth, waist girth, and hip girth based on the two parameters of height and weight, and then use K-nearest neighbor (KNN) algorithm to predict the remaining nine parameters based on these five parameters, so as to establish the correlation among the 14 parameters and realize the prediction of various size parameters.
Strong correlation prediction
The strong correlation prediction associates the height, weight, chest girth, waist girth, and hip girth into a linear system, and uses the linear regression method to fit the semantic value function of the size parameters of the chest, waist, and hip girth. To achieve a better prediction effect, we select two parts in Table 1, where the number of the Pearson correlation coefficient is closer to 1, as the regression model for linear fitting. Hence, the chest girth and weight, hip girth and weight, waist girth and BMI are combined into three linear relationships, respectively. The regression formula 
Finally, the linear regression prediction model of the chest girth, hip girth, and waist girth can be obtained, as shown in Table 3.
Linear regression prediction model of the chest, waist, and hip

Herein, x1 denotes weight, x2 represents the BMI value, and the P-value indicates the significance of the regression model (the regression model is considered valid when the P-value is less than 0.05). 18 After linear regression analysis, the value of the judgment coefficient R2 is larger than 0.9, and the significance of the P-value is below 0.05. Therefore, the regression model is considered effective.
At this point, the mapping relationship among the chest, waist, and hip girth of Asian people and their height and weight has been established. By inputting the height and weight, the strongly correlated girth dimension parameters of the chest, waist, and hip can be obtained, and these five dimension parameters are represented by the dataset Ain.
Weak correlation prediction and verification
For other size parameters with a weak linear relationship, represented by the dataset Aout, the complete training sample set can be represented by
Interpolation is used to predict the missing variables in the dataset through statistical analysis of the dataset. This paper implements and evaluates five common interpolation methods applicable to this dataset based on the Python language, as follows: the mean interpolation and variable interpolation in the machine learning (scikit-larn) package, IterativeImputer algorithm, KNN algorithm, multiple imputation by chained equations (MICEs) algorithm, and SoftInput algorithm in the fancysimple package.
We use the drawing tool Matplotlib to display the mean square error of each algorithm to intuitively evaluate the accuracy of each interpolation algorithm on the dataset; the results are shown in Figure 4.
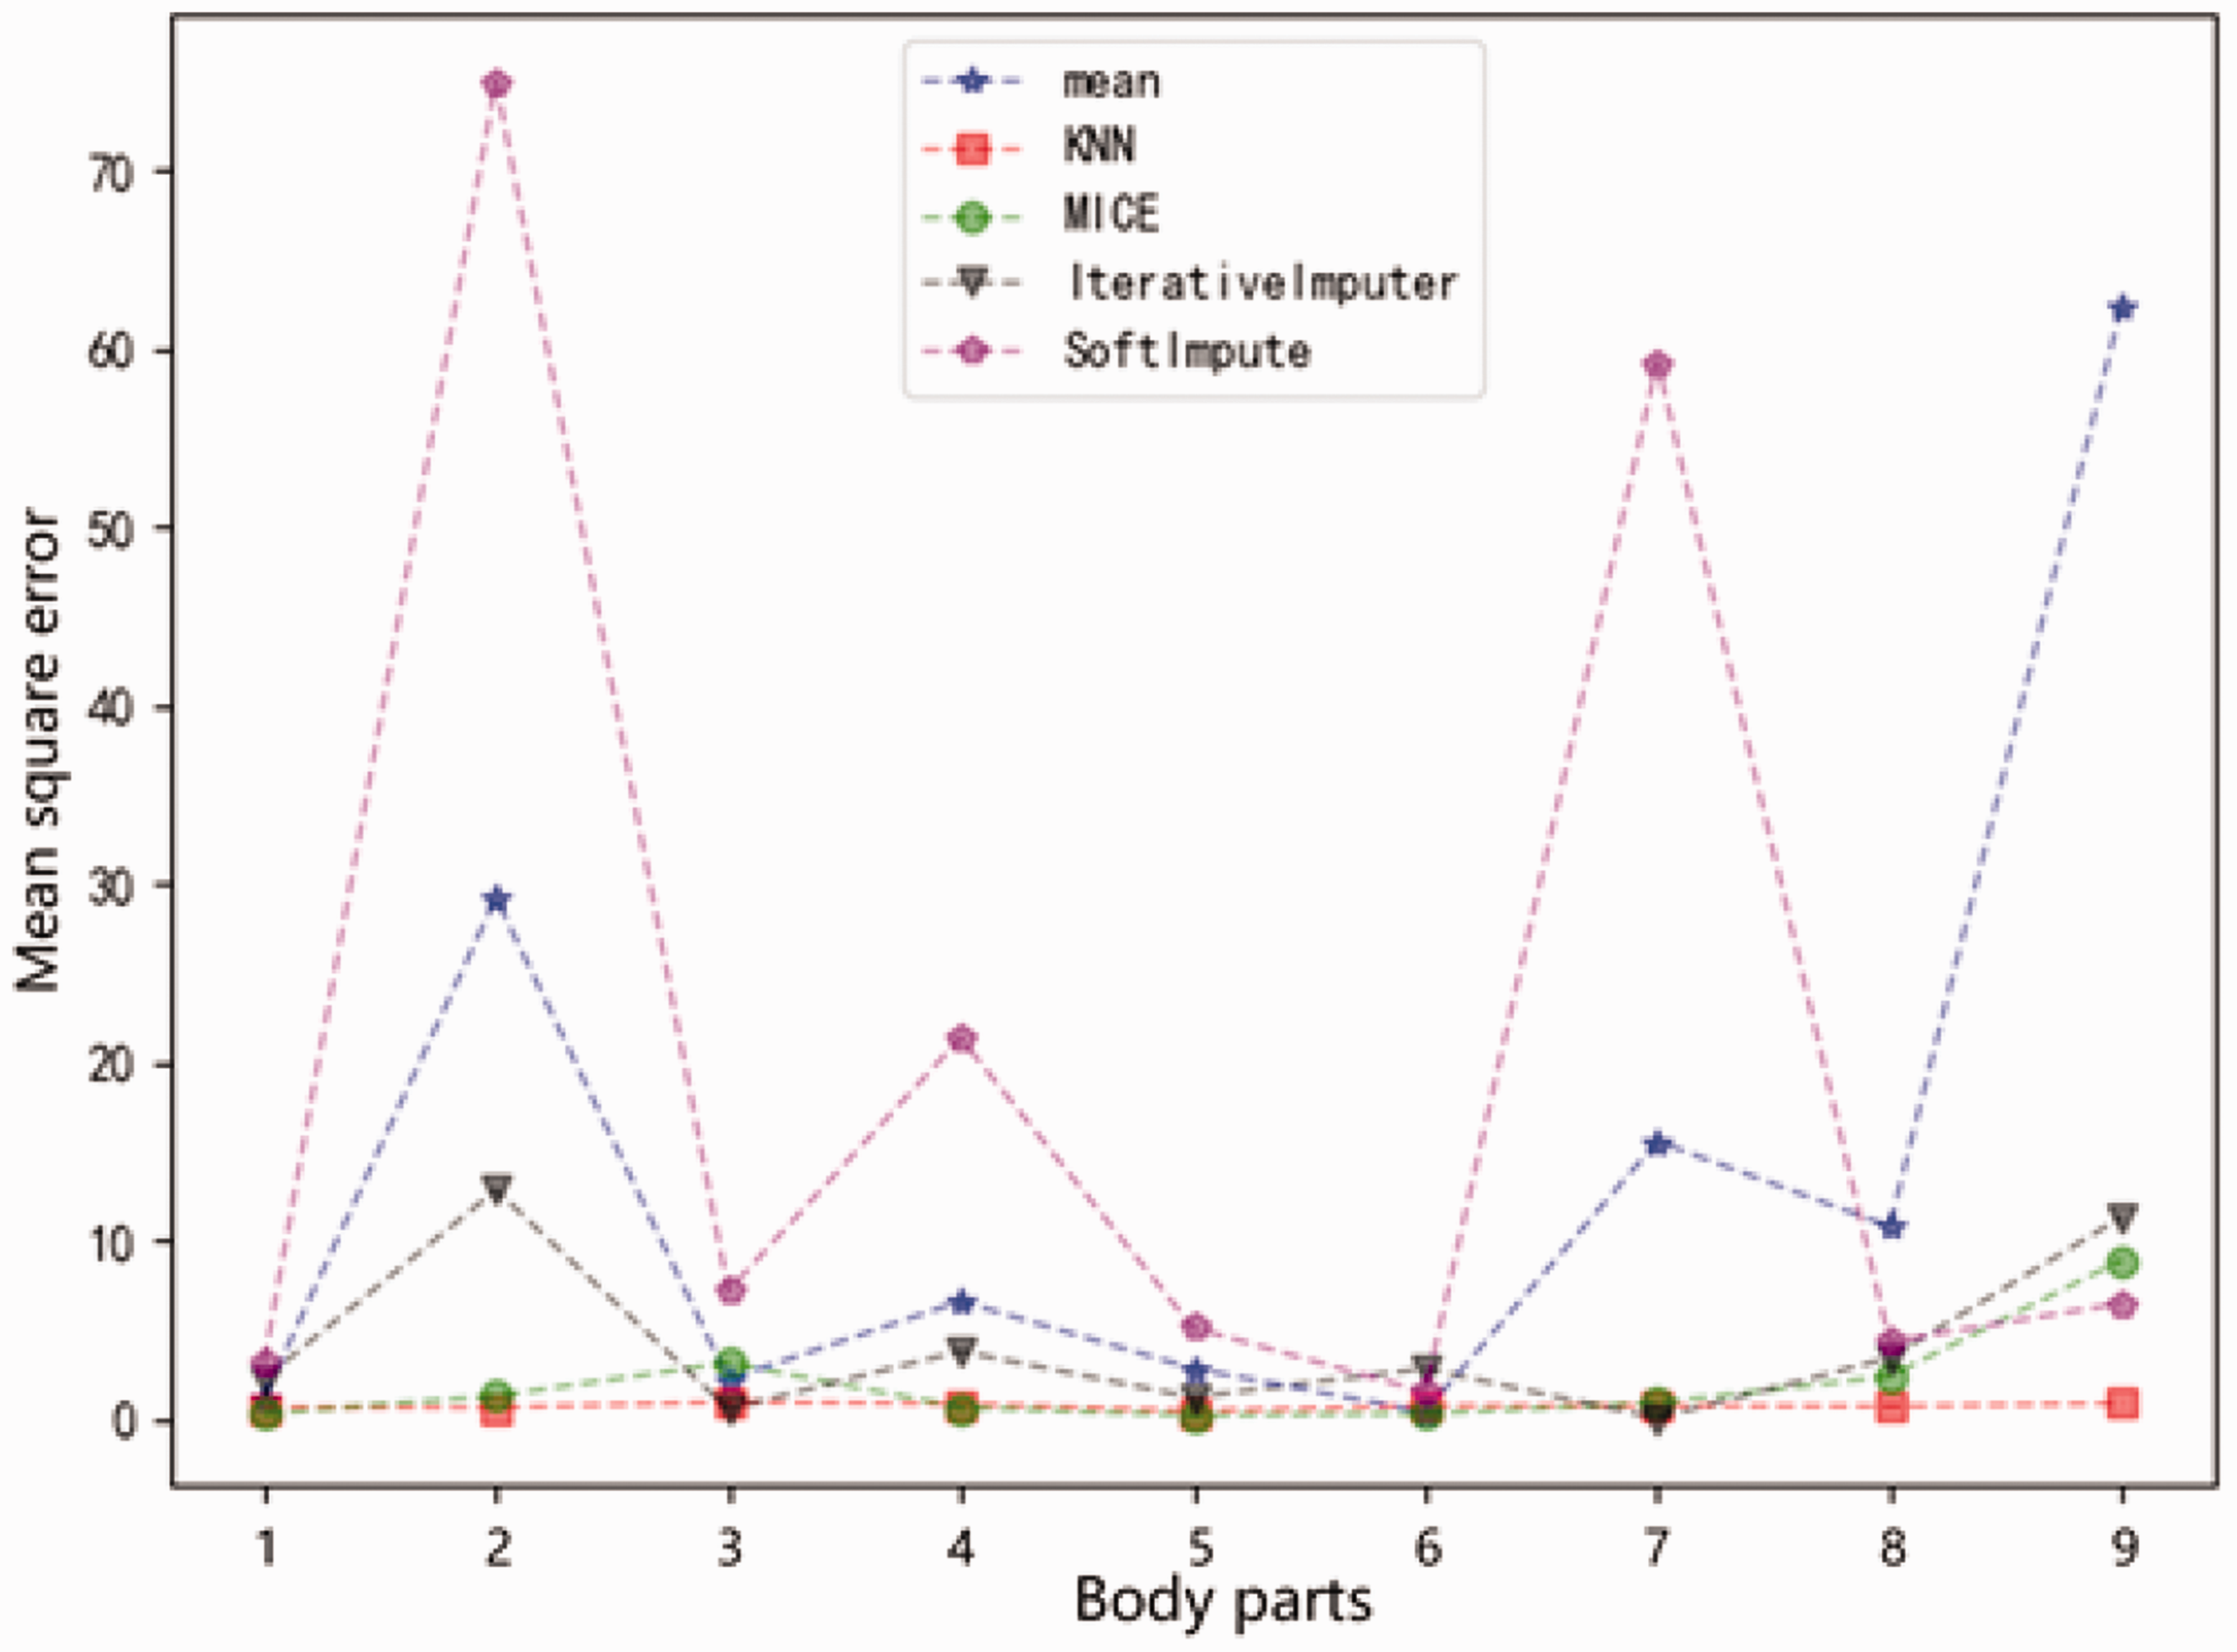
Comparison of five interpolation methods.1: Neck-base girth; 2: inside leg length; 3: back shoulder width; 4: arm length; 5: upper-arm girth; 6: waist girth; 7: chest height; 8: knee girth; 9: thigh girth. KNN: K-nearest neighbor.
It can be seen from the comparison in Figure 4 that the KNN algorithm has high stability on the dataset. Therefore, this article uses the KNN algorithm to perform weak correlation prediction on nine parameters, including the neck-base girth and inside leg length.
If the predicted parameters are discrete variables, the KNN classifier is used to vote for the most parameters in K neighbors for filling. If the prediction parameter is a continuous variable, the KNN regression is used to fill it with the average value of the variable in K neighbors. 20 Because the anthropometric size parameters, such as height, weight, and circumference, are continuous variables, we choose the KNN regression for prediction and interpolation. This process is based on the statistical analysis of the training sample set Ai. The algorithm is as follows.
Input – feature space:

In the training sample set, each data has a label, such that the corresponding relationship between the data in the sample set and the classification is clear. In the above feature space T,
Output – the predicted value of the vacancy characteristic variable to which a label belongs.
To illustrate the process, we build a model where X is a complete data matrix, and X_incomplete has the same value as X, except for several numeric variables that are replaced by NaN. Take the numerical variable x as an example in the following.
Firstly, according to the selected distance measure, k samples closest to x are found in the training set. The related neighborhood of x covering these k points is denoted as Nk(x). Determine x in Nk(x) to category y according to the classification rules:

where I is the indicator function, I is 1 when yi = cj; otherwise, I is 0, i = 1, 2,···,n.
3. The variable values of K samples are used for the weighted average to estimate the missing data of samples. This method is the same as the mean interpolation and is single value interpolation. The difference is that it first uses the hierarchical clustering model to predict the type of missing features, and then fills the predicted values into the original dataset.
From the above process, we see that there are three important factors in the prediction and interpolation of missing values using the KNN algorithm: the selection of the K value, distance measurement, and decision rules.
Selection of the K value: the selection of the hyperparameter K has a significant influence on the algorithm. If the value of K is too small, the complexity of the model increases and the estimation error increases, leading to the over-fitting of the prediction results. The selection of a large K value can reduce the estimation error of training, but it will lead to a large training sample neighborhood, and distant samples will also participate in the decision-making and prediction process, which increases the approximate error and leads to under-fitting.
21
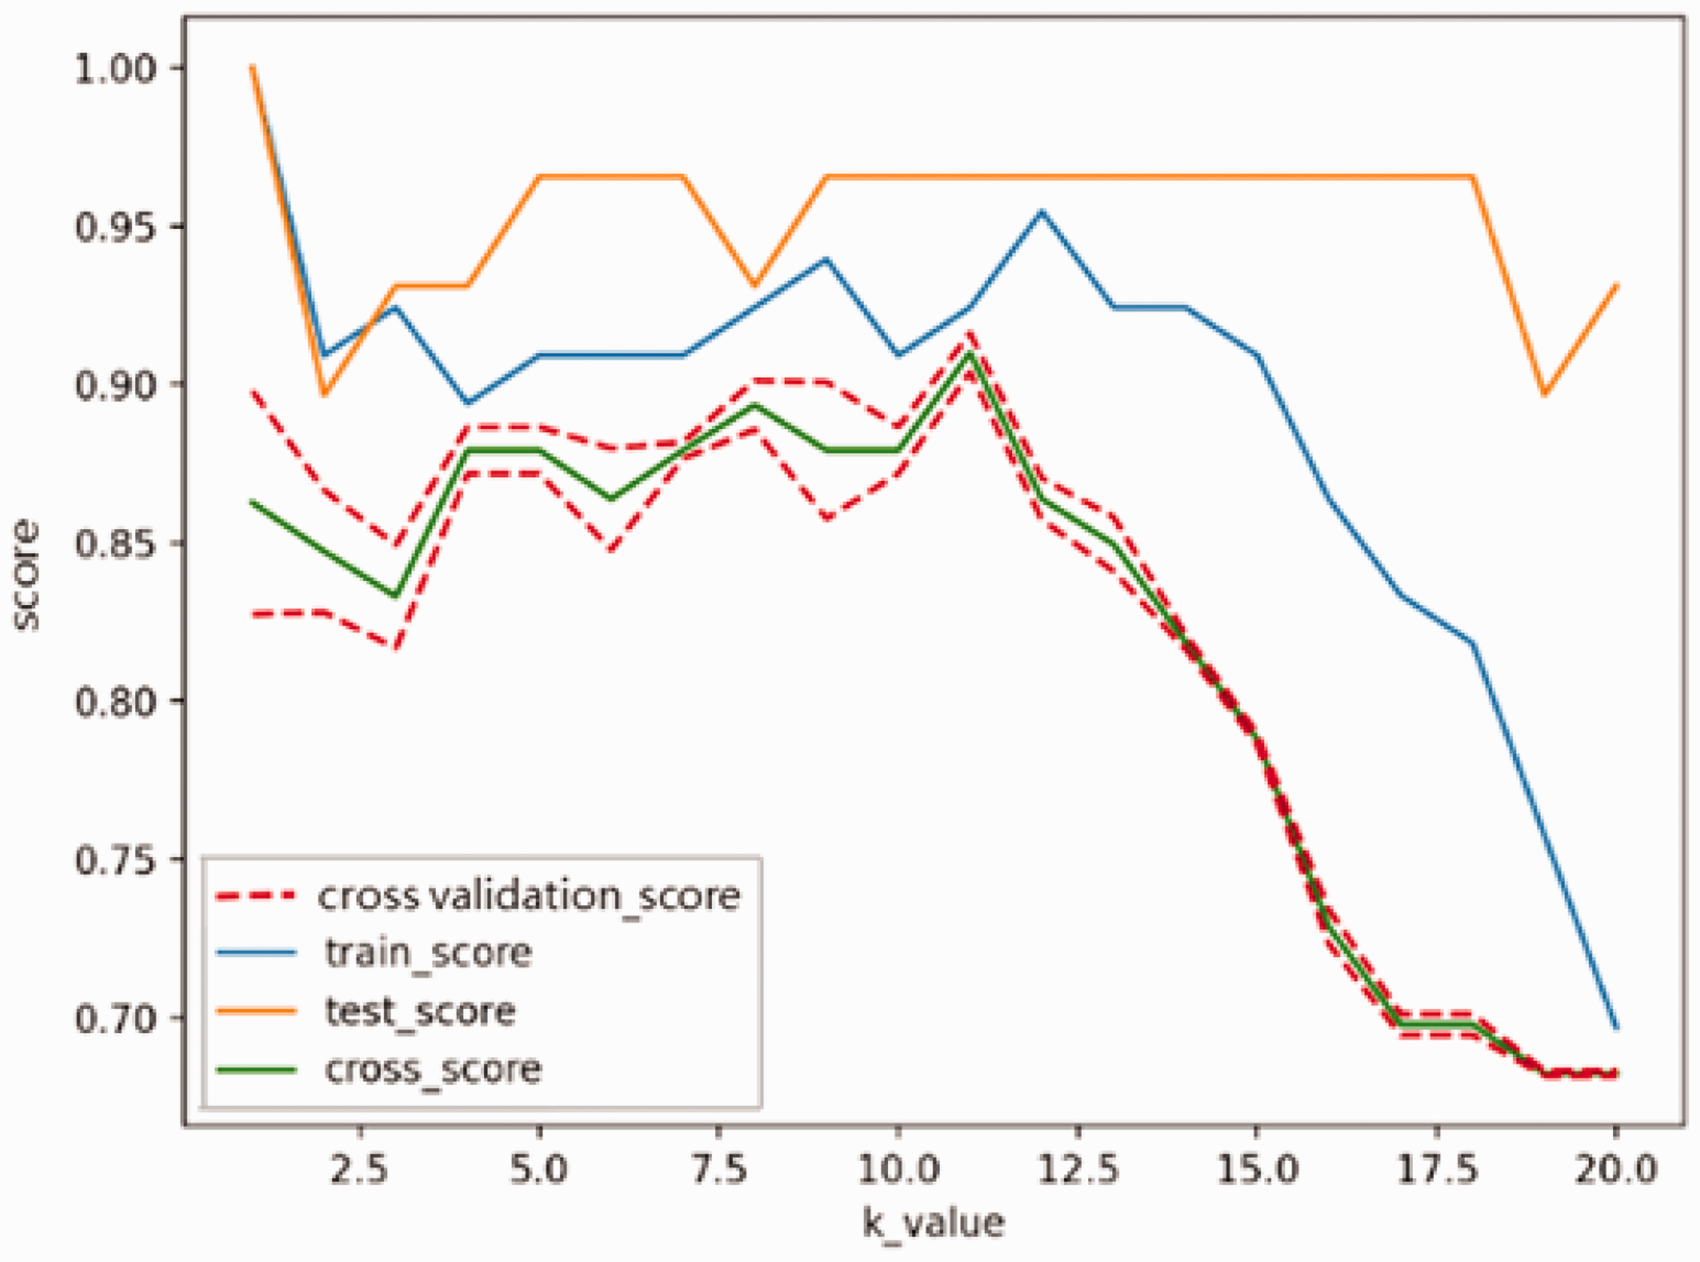
To solve the above problems, we adopted the cross-validation method to determine the appropriate K value, as shown in Figure 5. Firstly, the entire training set X is divided into k disjoint subsets. Assuming that the number of training samples is m, each subset has m/k training samples. Then, one sample is selected from the subsets as the test set each time, such as the striped square in Figure 5, and the other k–1 as the training set, such as the blank square in Figure 5. Finally, we tested the test set based on a five-fold cross-validation, and constantly changed the K value to re-model, re-train, and evaluate it to obtain the score of the five models. The optimal K value of 11 was obtained by averaging the five scores and the corresponding score was 0.909890, as shown in Figure 6.
The cross-validation process. Optimal K value and corresponding score. Distance measurement: our continuous variable selects the Euclidean distance as the measurement, assuming that the two points in the n-dimensional space are X and Y:



Then, the Euclidean distance is as follows:
Decision rules: the weighted average method is used for prediction interpolation:


where Di represents the distance between the nearest neighbor i and the value to be predicted x, Wi represents its weight, and f(x) is the numerical result of the prediction.
After determining the factors of the strong correlation prediction and weak correlation prediction methods, the nine parameters obtained by the KNN algorithm and the previous five parameters will be used to drive the deformation of the 3D human modeling subsequently. Finally, based on the test set, the size of the deformed human modeling will be compared with the size of the test set, and the size error of the established 3D human modeling will be analyzed to verify the accuracy of the strong and weak correlation prediction methods.
Three-dimensional human body reconstruction
After obtaining 12 human body sizes from the semantic parameter prediction part, and combining the two parameters of height and weight, we obtain the mapping relationship between the semantic parameters and the model grid based on the 3D human body grid and the corresponding human body size and completed the semantic-driven 3D human deformation. The human body geometric mesh is composed of multiple triangular surfaces, where each surface is represented by V, the deformation of a single triangular surface is represented by the 3 × 3 linear transformation matrix Q, and the human body geometric mesh is represented by Si. Currently, there are two classical methods to represent human body shape changes. One is the relationship between dimension parameters obtained by Ji
22
using linear mapping and the PCA weight, namely the global mapping method. The process is expressed in the following equations:



In Equation (6), vector Ui represents the variation of human body geometry and 
The random forest algorithm measures the importance of feature according to Gini index and OOB error calculation rate.
24
Because there are both continuous and classification variables in our sample training set, and as there is correlation between continuous variables, we choose the OOB error calculation rate 
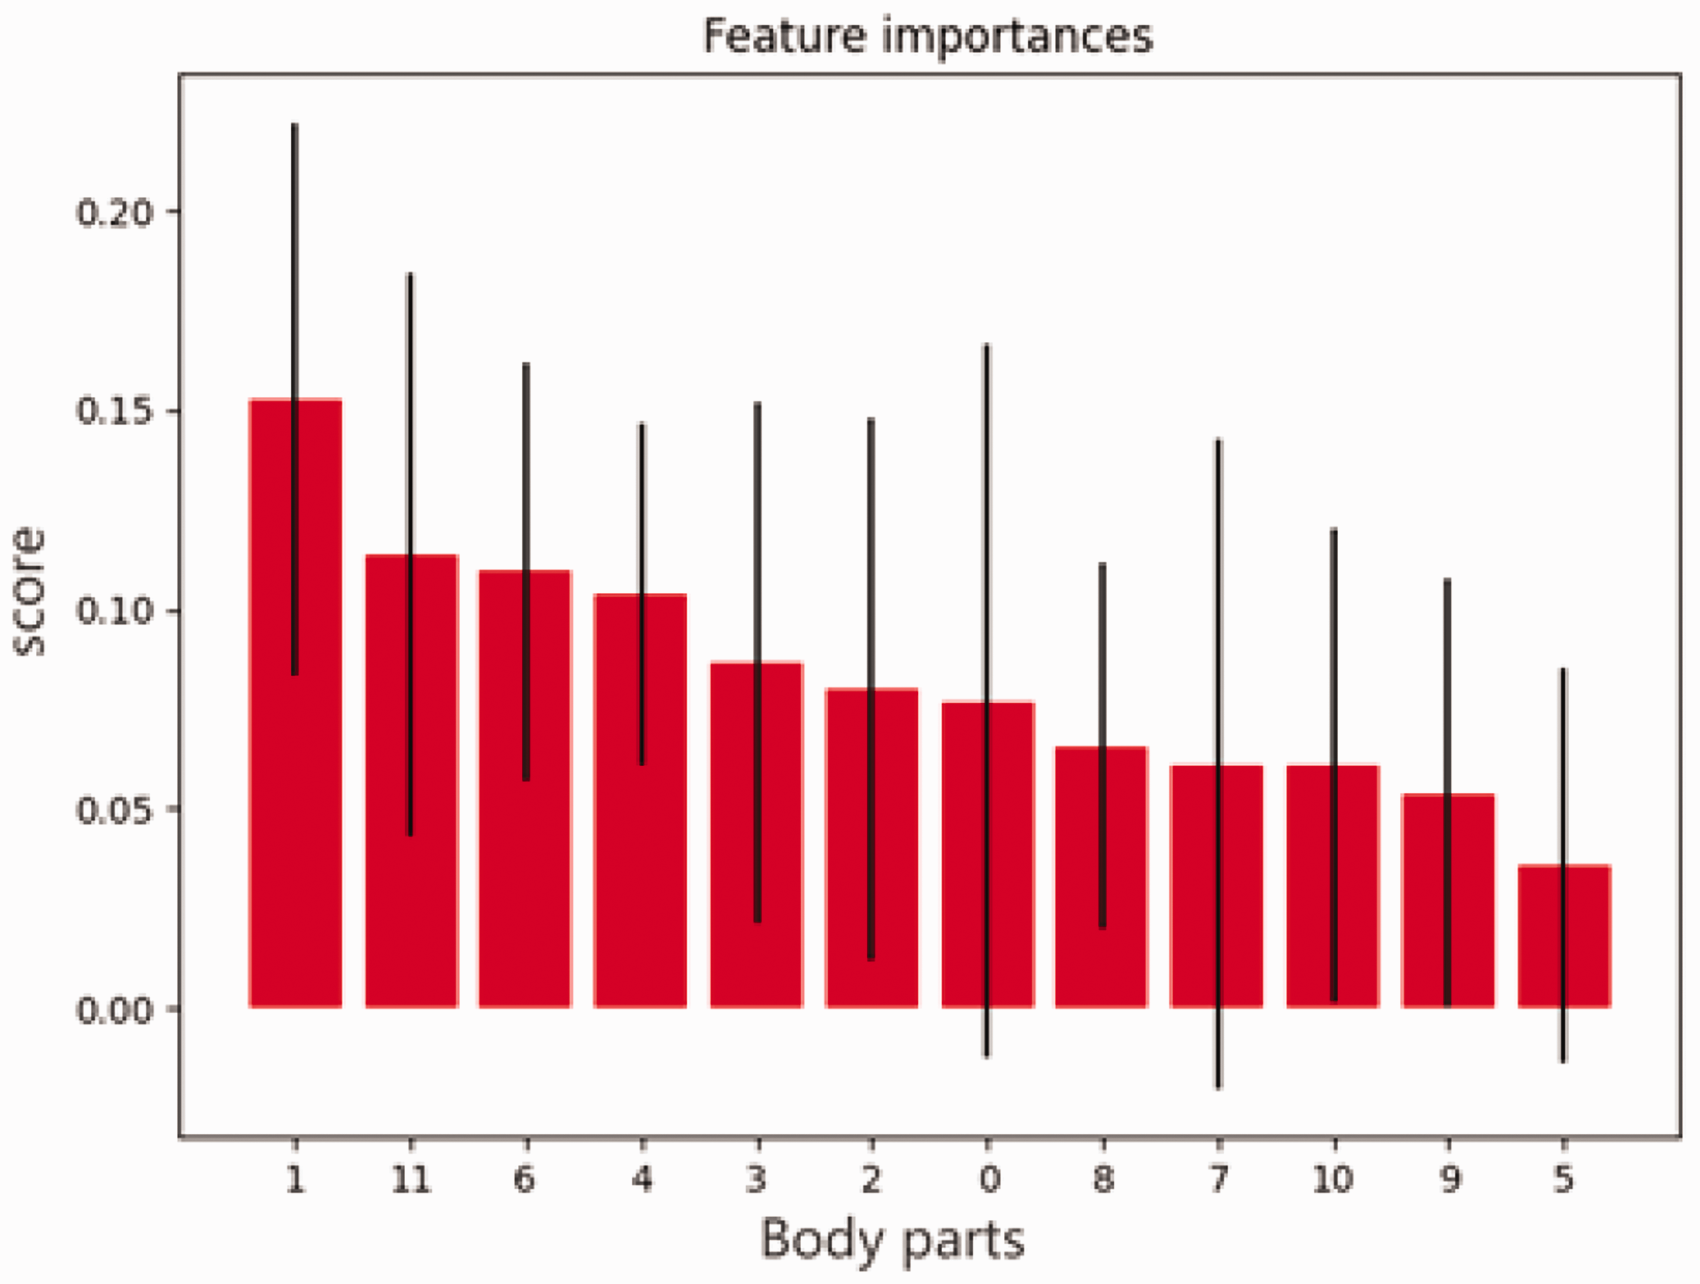
Ranking of feature importance in a grid at the hip. The meanings of each designation in the abscissa are, from left to right: weight, chest height, waist girth, chest girth, arm length, upper-arm girth, wrist girth, inside leg length, neck-base girth, height, back shoulder width, thigh girth.
Similarly, the importance score is obtained by the random forest algorithm for each face, and t parameter vectors F′ that are most relevant to each face are obtained in descending order:

Finally, we learn the linear regression model Q′ = MF′ between the deformation matrix M and the most relevant parameter F′ of each face. The deformation
Results and discussion
Analysis of results
To verify the accuracy of using semantic values to establish 3D human models based on our method, the verification is divided into two aspects: on the one hand, we use the Anthroscan M4 Plus 3D human scanner to scan 30 men in the verification set to obtain 3D human models. We also compare the 3D human model obtained by scanning with the 3D human model established by our method (taking two people with different body types as an example), as shown in Figures 8 and 9. On the other hand, based on the method in this paper, the height and weight of 30 men in the verification set are input, and the remaining 12 dimensions are obtained. The body size parameters of the two examples are listed in Table 4, so as to realize the comparison between the semantic-driven model size and the original size data of the verification set. Finally, the distribution of Size errorr epresentation of various parts of the human body in 30 groups is shown in Figure 10, and the predicted values are statistically analyzed in Table 5.
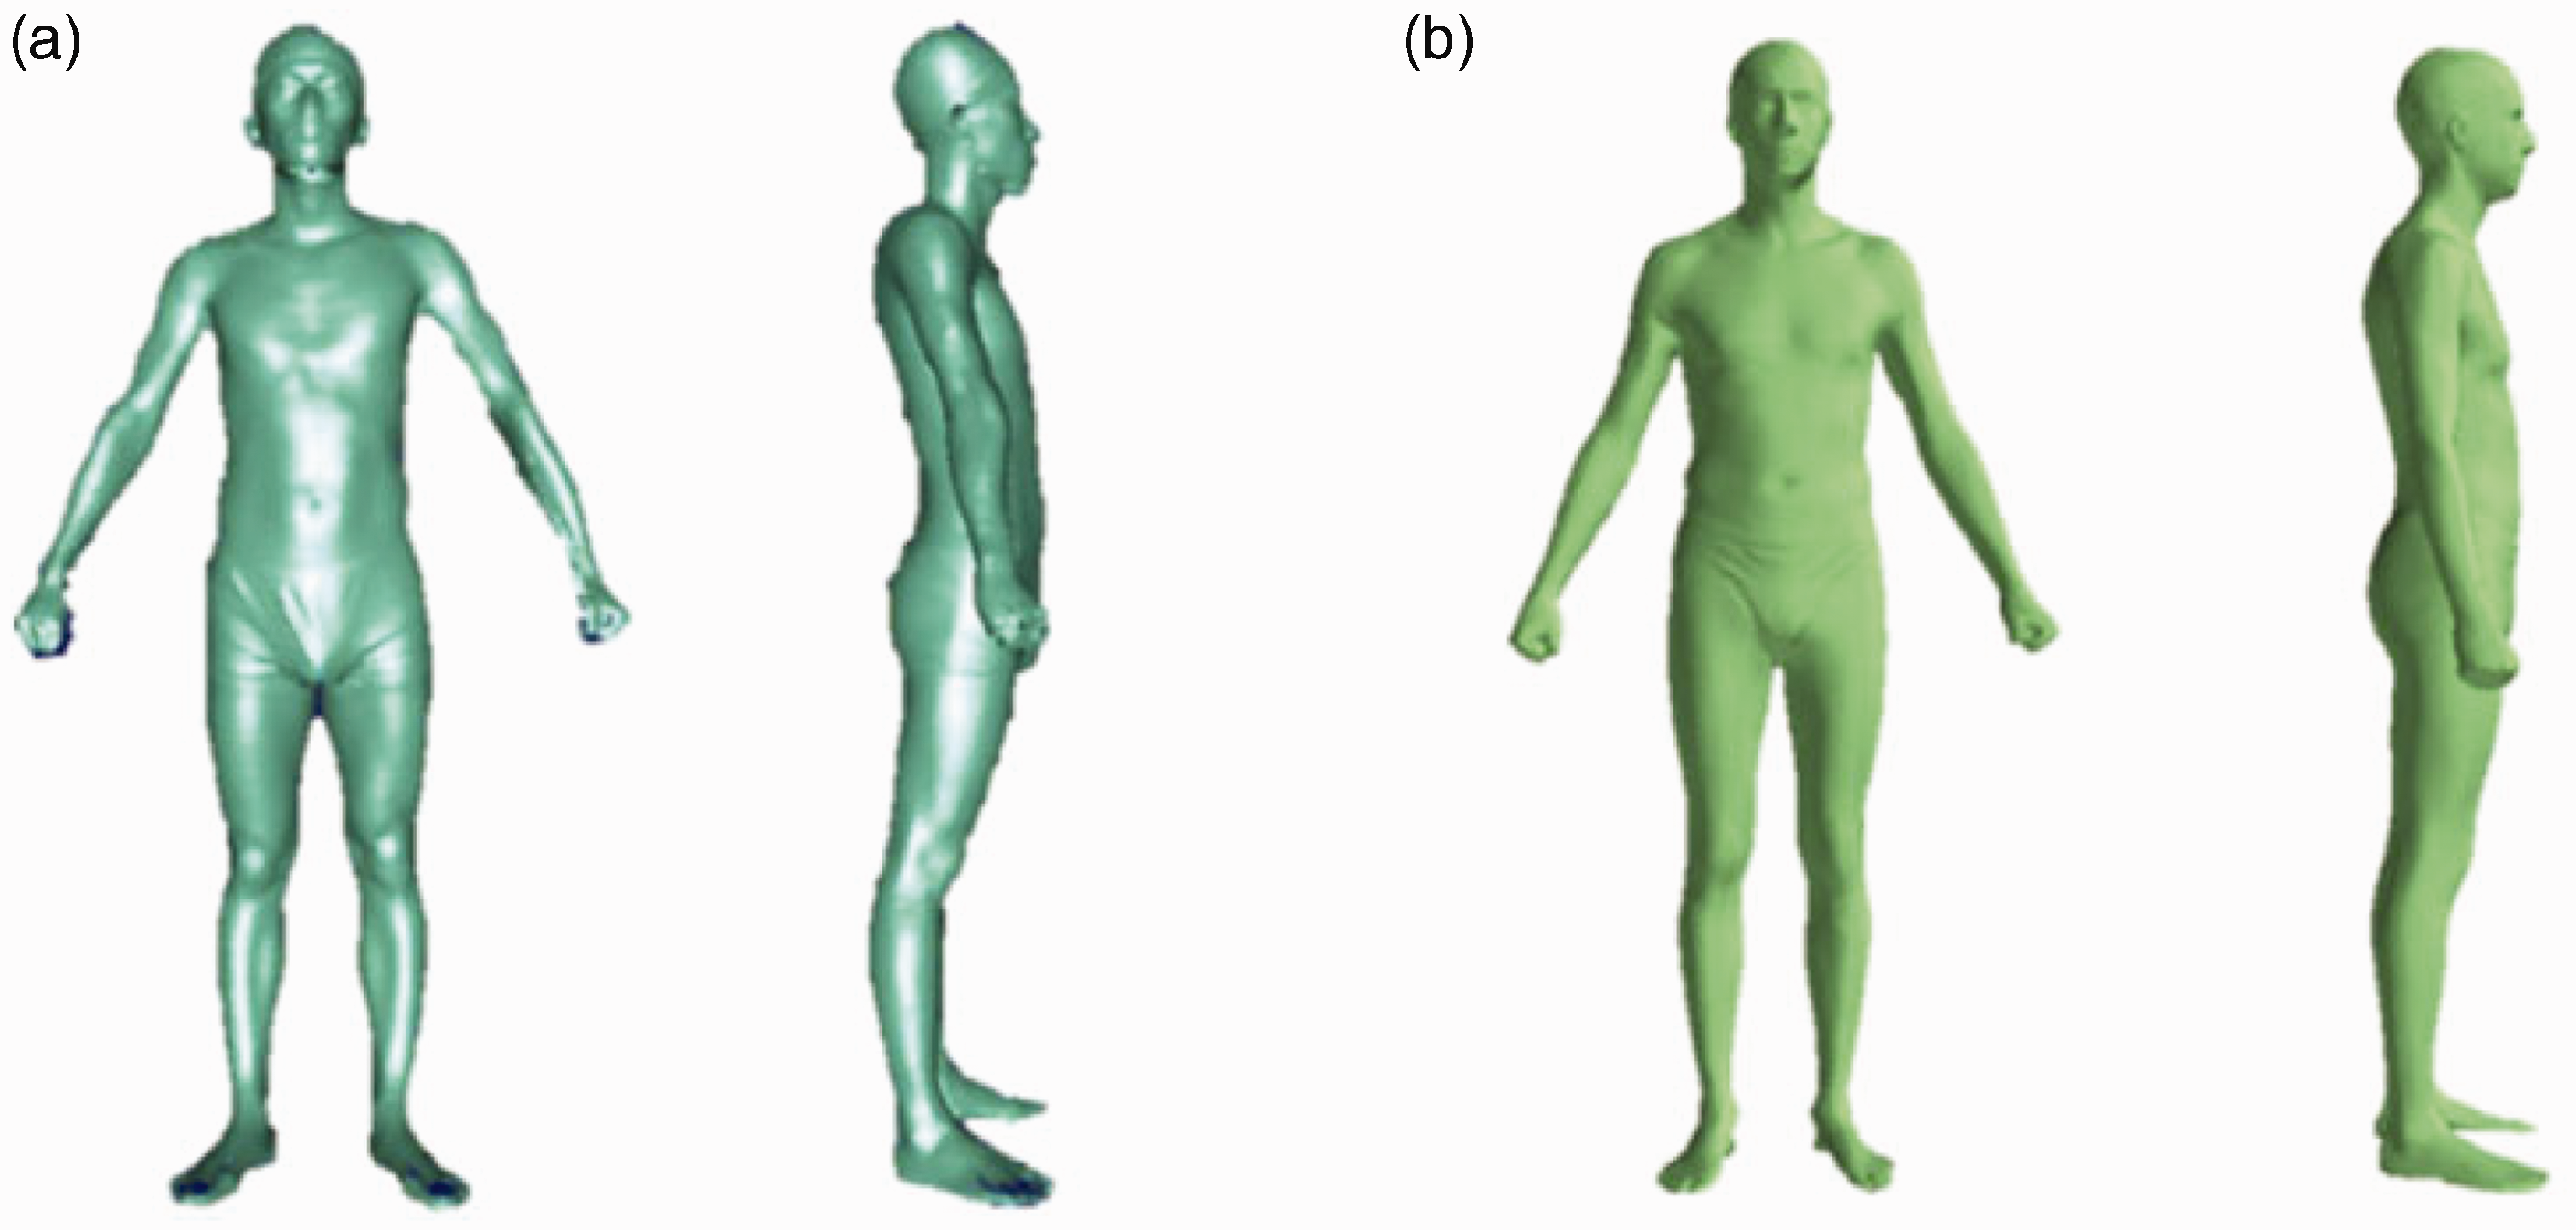
Comparison between the scanned and established three-dimensional (3D) human body (example 1: normal body shape).
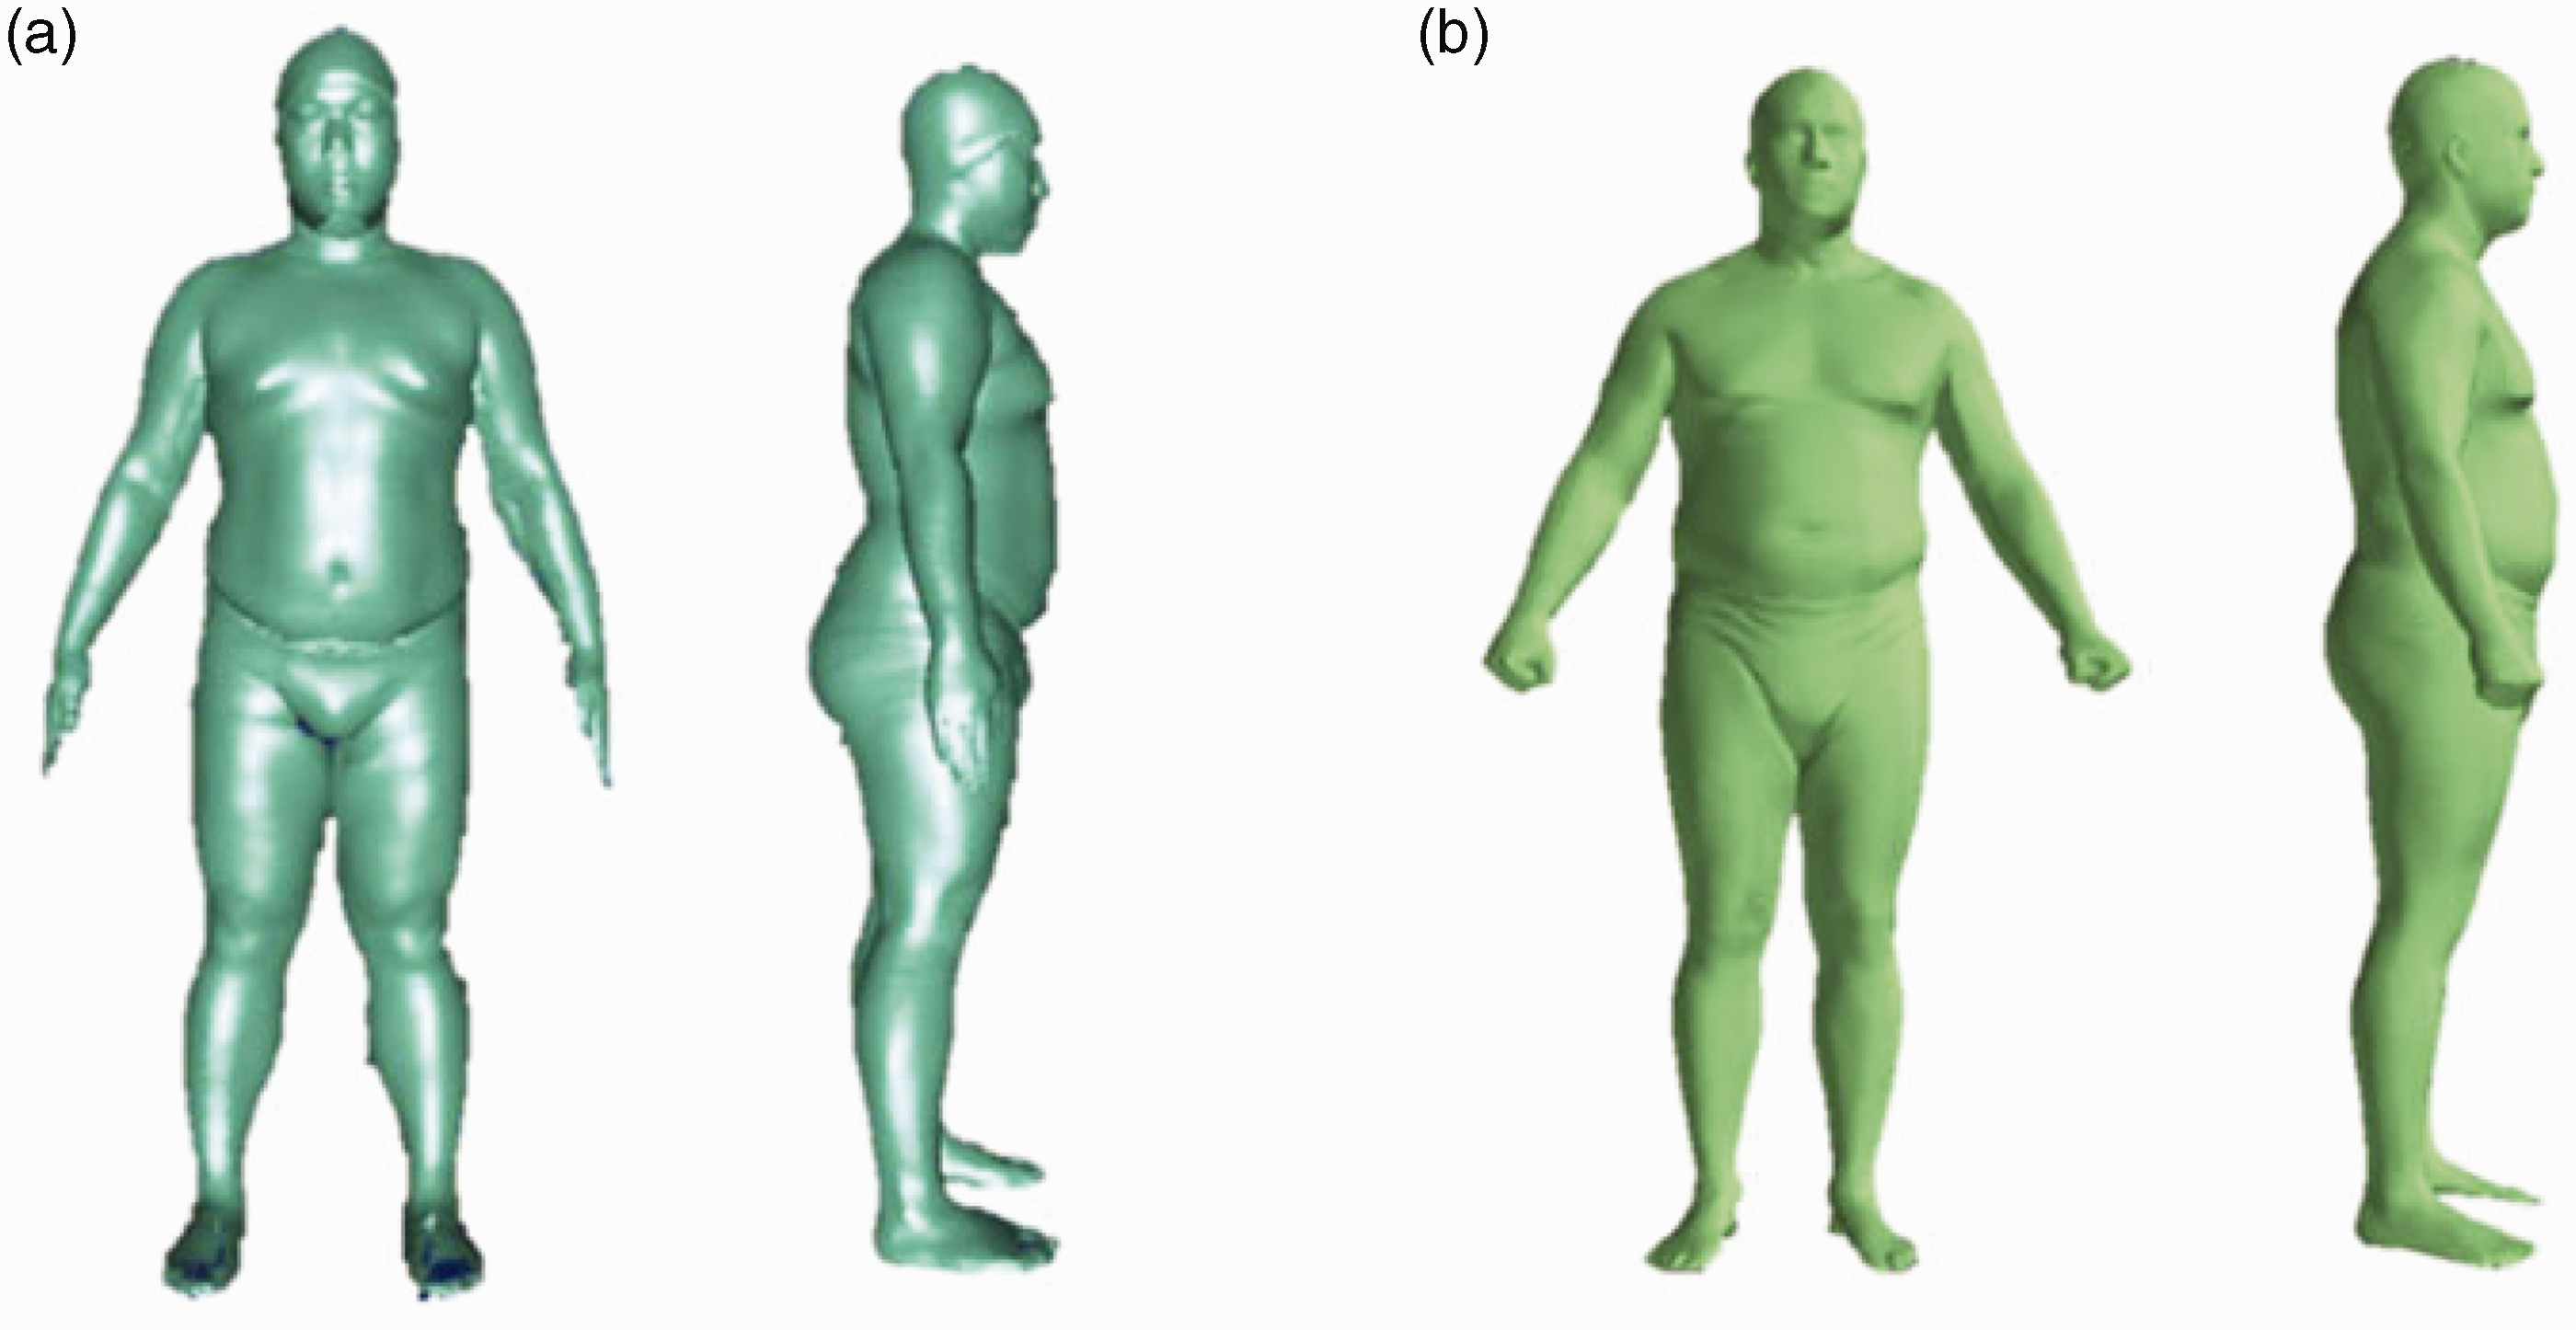
Comparison between the scanned and established three-dimensional (3D) human body (example 2: obese body shape).
Input and predicted dimension parameters

Analysis of the prediction error of various parts of the body

Note: the error analysis method refers to Gu et al. 25
From the comparison in Figures 8 and 9, it can be found that the semantic human model and the real human model have a high similarity in the overall posture. For the Table 4 statistics data and the Figure 10 data, the accuracy rate of each part of the human body within ±1.5 cm reaches an average of 91%, which basically meets the anthropometric requirements and can represent a personalized 3D human model.26,27
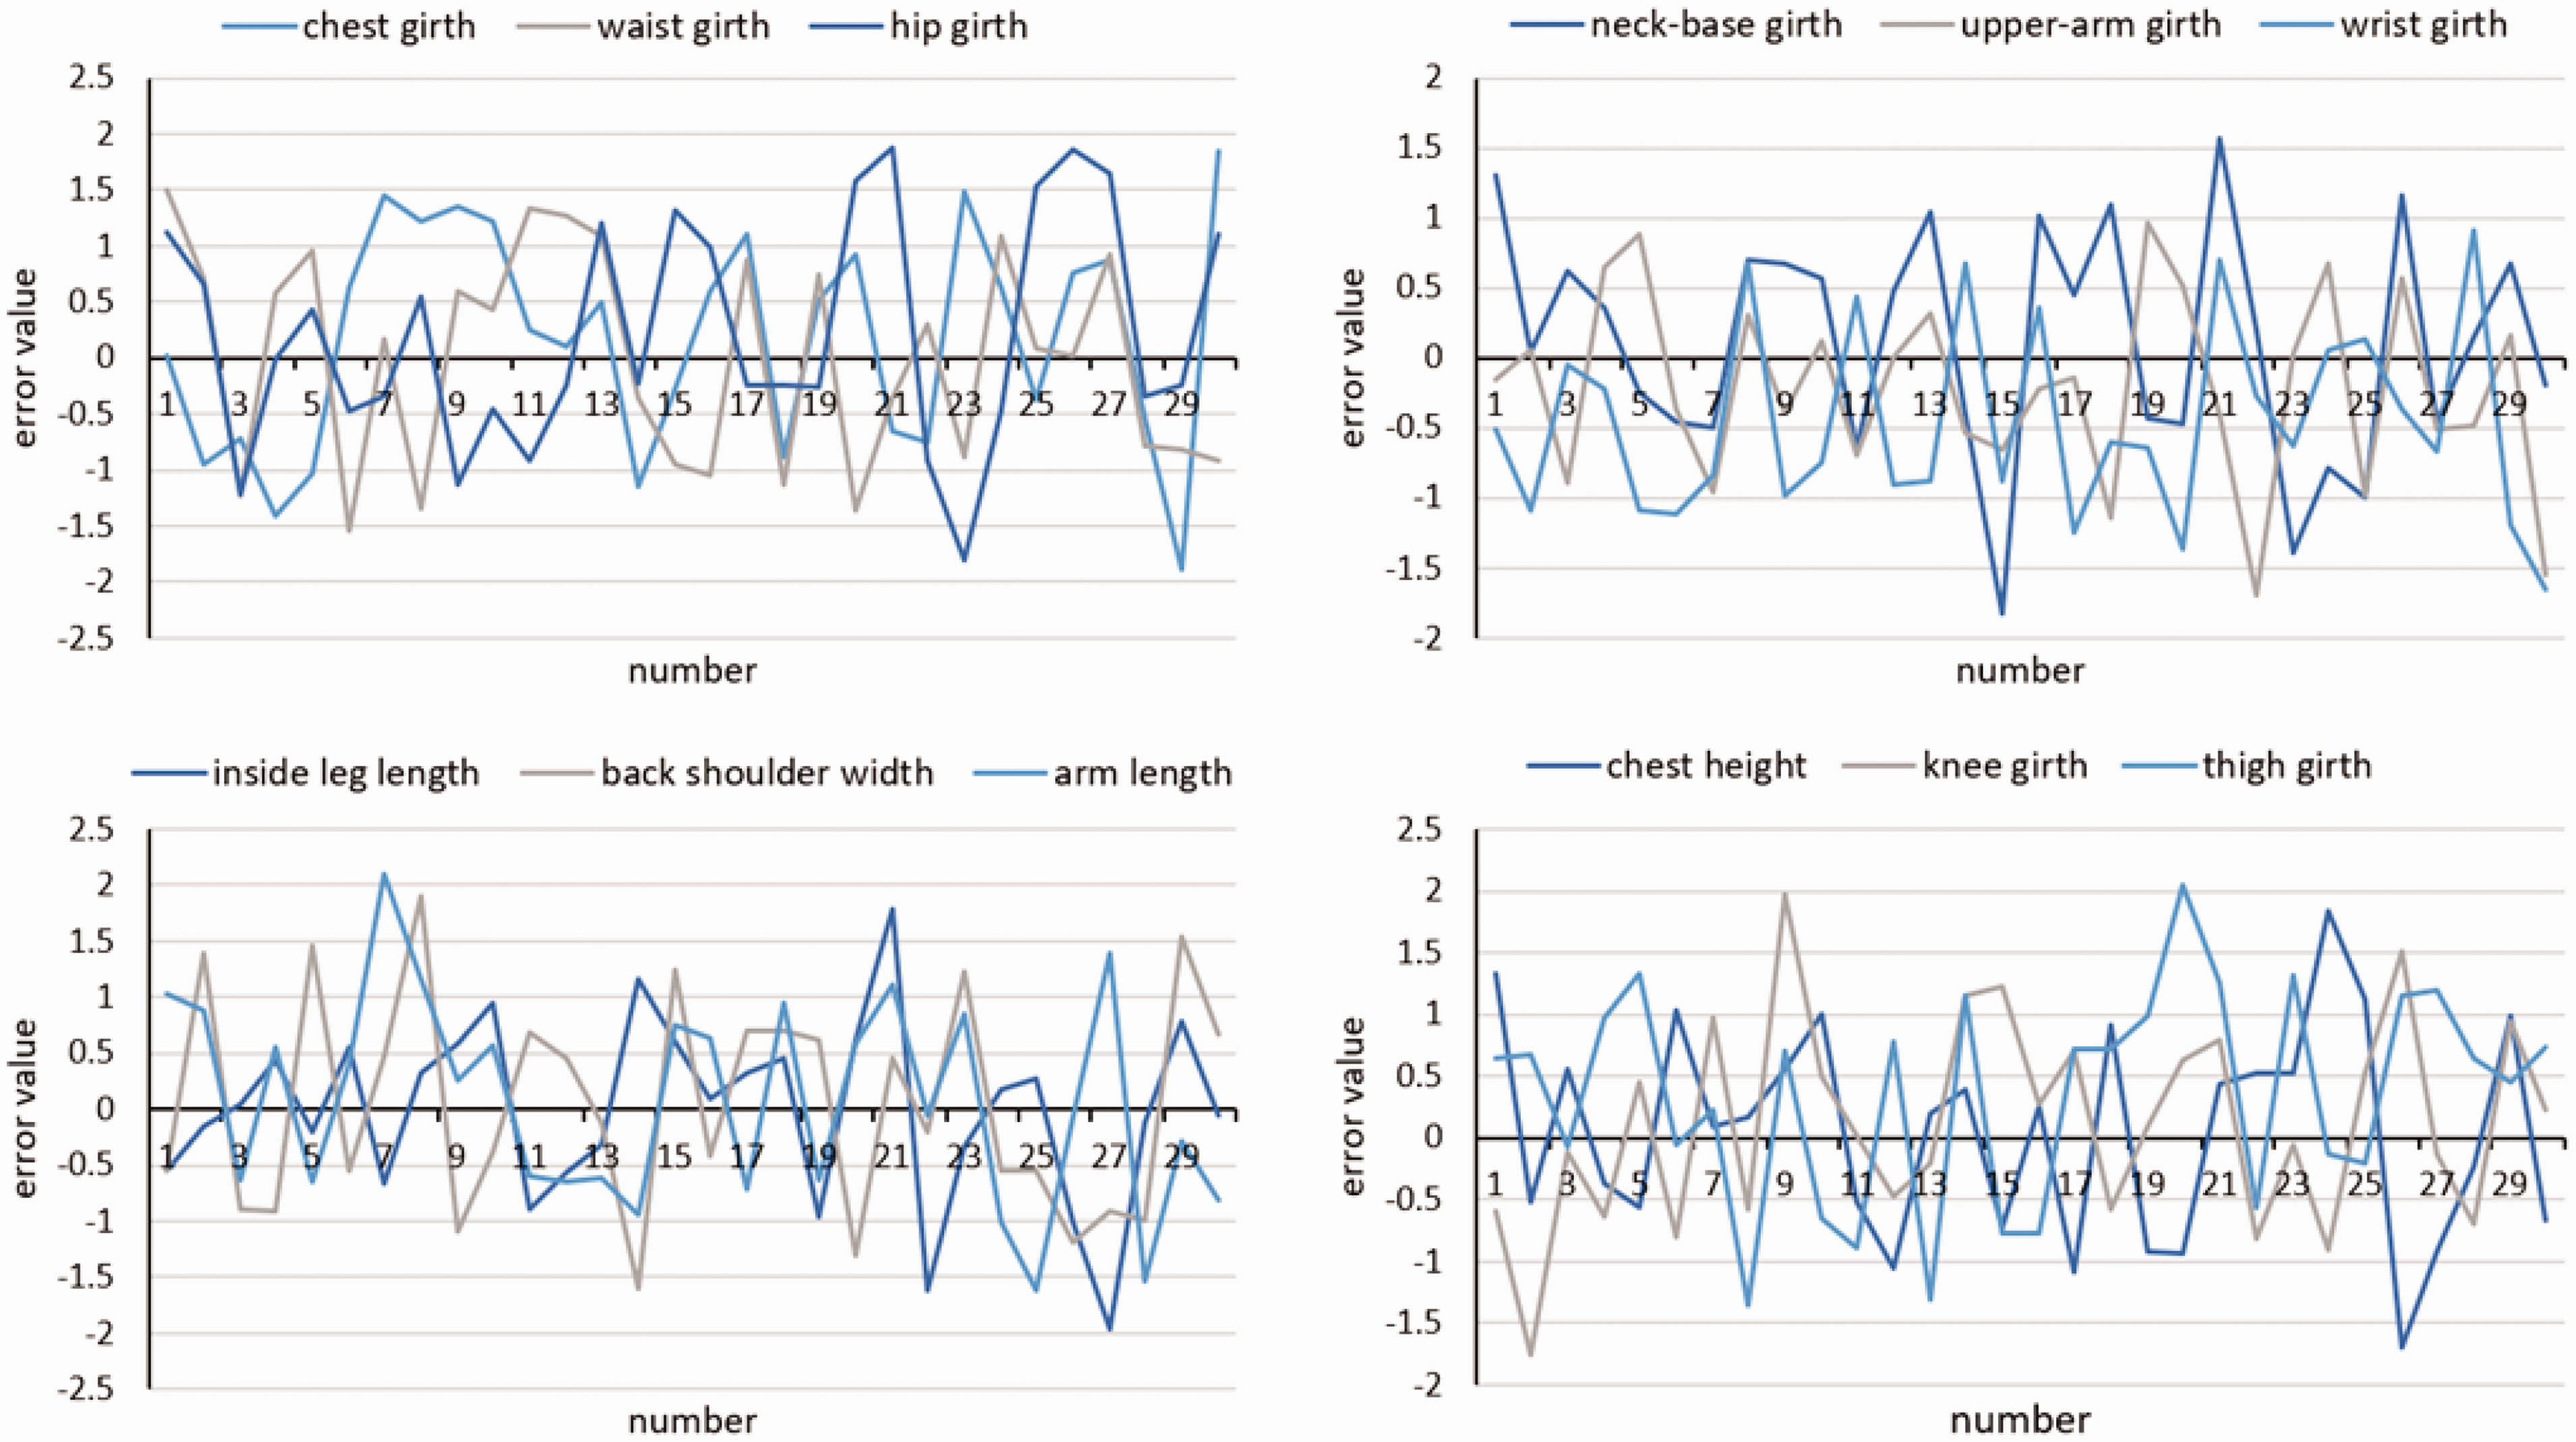
Size error representation of various parts of the human body in 30 groups.
Limitations and further improvements
Since this study is based on the semantic human model generated by the European and American human body parametric models, it is still different from the real Asian human model. Therefore, the contours that can best reflect the shape features of the two human models are compared, and the Figure 11 shows the 3D human contour information extracted based on the contour detection algorithm.

Comparison of the outer contours of the human body.
From the figure, it can be seen that although there are differences in the human standing posture, differences can also be seen in the chest and waist, indicating that even if the predicted circumference data has few errors, the shape of the human body is still different. Subsequent corrections to the human form will not be discussed in this article. In addition, this study will continue to collect human data of different body shapes and different age groups, increase the amount of data, and improve the scope of application of this research method. The important parameters affecting the fit of clothing are analyzed and discussed to improve the applicability of the virtual fitting of clothing.
Conclusion
Aiming at the problem that human parameters are difficult to obtain and that it is difficult to establish personalized human models with a small number of parameters, this paper proposes the research idea of predicting the remaining 12 parameters with the two parameters of height and weight, so as to realize the accurate modeling of multiple parameters. Using the correlation among human body size parameters, this study employs the concept of combining strong and weak correlation predictions, that is, the linear correlation and KNN algorithm, to predict the 12 human semantic body size parameters. Then, the mapping relationship between the semantic parameters and the 3D model mesh is established to realize the deformation of the 3D human model. The accuracy rate of each part of the human body within ±1.5 cm reached an average of 91%, the 3D human body reconstruction is well completed, and we can establish a 3D human model with highly restored user characteristics for the garment industry through a small number of parameters, which has a certain practical value.
Although we made some progress in the prediction of human body size parameters and the construction of the semantic-driven 3D human model, the method has room for improvement. On the one hand, the amount of data collected in this study is limited, and the next step will continue to collect human body data of different ages and different human shapes, and classify human body shapes to improve the accuracy of semantic parameter prediction. Furthermore, a modification part of the 3D human body model could be added to refine the 3D human body model and make it more reducible to the user's own characteristics to further improve the accuracy and applicability of the 3D human modeling system based on semantic driving.
Footnotes
Declaration of conflicting interests
The authors declared no potential conflicts of interest with respect to the research, authorship, and/or publication of this article.
Funding
The authors disclosed receipt of the following financial support for the research, authorship, and/or publication of this article: This work was supported by the 2021 Industrial Technology Basic Public Service Platform Project of the Ministry of Industry and Information Technology of the People's Republic of China – Building a Public Service Platform for Testing and Verification of Intelligent Manufacturing Standards “Building a Public Service Platform for Testing and Verification of Intelligent Manufacturing Standards Around the Textile Industry” (2021-0173-2-1) and the National Key Research & Development Program of China, “Key common technologies of robot automation production line for sports shoes and clothing industry” (project no. 2018YFB1308801).
