



Abstract
A pandemic caused by airborne pathogens raises a great need for N95 respirators and surgical masks. Subsequently, the risk of undersupply becomes a primary challenge requiring the prioritization of those masks for healthcare workers. Health agencies recommend wearing cloth masks in low-risk groups to reduce the demand. Unlike N95 respirators and surgical masks, cloth masks can be made from various fabrics, and their filtration performance becomes material-dependent. However, the existing literature presents limited and contradictory results on the property-performance relationship of fabrics used for cloth masks. Thus, the fundamental parameters determining the effectiveness of the fabrics remain unknown. Herein, we investigated the effects of yarn properties and multilayering on the filtration performance of single jersey fabrics. The fabrics performed up to 45% particle filtration efficiency, with the range of air permeability from 110–330 ft3/min/ft2. The results revealed that while the structural differences associated with the yarn choice had a smaller impact on the particle filtration efficiency of the fabrics compared to air permeability, their effects were great enough to yield statistically significant differences between the fabrics. In addition, our findings demonstrated that multilayering effectively improved the filtration performance of fabrics but resulted in a greater increase in airflow resistance than particle filtration efficiency. To limit the tradeoff between air permeability and particle filtration efficiency, yarn properties should be considered in the material selection of multilayer masks. We anticipate that our work will be a starting point for a guide on cloth masks with minimal filtration and breathability requirements.
Respiratory protection strategies center around the control of hazards and exposure. 1 When a hazard posed by airborne pathogens cannot be entirely removed, personal protective equipment (PPE) such as N95 respirators and surgical masks can help confine the exposure. N95 respirators aim for respiratory protection with at least 95% particle filtration efficiency (PFE), while source capture is intended with surgical masks.1,2 In the event of a pandemic caused by airborne pathogens, a significant number of N95 respirators and surgical masks are needed, not only for healthcare workers but also for the public. In return, PPE supplies are likely to fall short of meeting high demands.3–5 Using N95 respirators and surgical masks can be associated with discomfort due to various physiological reactions such as facial irritation, headache, and fatigue.6–8 Furthermore, limitations on PPE's reusability and cleaning process raise serious concerns about environmental pollution related to waste generation from a single use.9,10 Considering all the issues regarding PPE, cloth masks may be a convenient alternative for protecting low-risk individuals within the public due to their easy accessibility, affordability, reusability, and washability. 11
Cloth masks, generally made from knitted and woven fabrics, have been utilized in different forms for some level of respiratory protection and source capture against airborne pathogens since the early 20th century. 12 The COVID-19 pandemic also showed an urgent need for cloth masks for public use while prioritizing PPE for healthcare workers.13,14 However, there were no standardized/certified cloth mask designs and guidelines for proper material selection at the beginning of the pandemic.15–18 The majority of the filtration studies have centered around nonwovens, which are used in surgical masks and respirators, and the developed filtration theories and models are based on the single fiber theory. 19 Since knitted fabrics are formed using tangled yarns, the knowledge of the filtration capability of nonwovens could not be directly adopted for knitted fabrics. Researchers conducted many studies investigating the filtration performance of available materials to prepare cloth masks.14,20 However, the lack of an established test method designed explicitly for cloth masks caused researchers to mainly focus on either modifying the available test methods for PPE or developing a new test method.20,21 In response to the need for a standard, American Society for Testing and Materials (ASTM) established the F3502-21 specifications, which is a modified version of the National Institute for Occupational Safety and Health (NIOSH) method used for N95 respirators.21,22 Since it was released almost a year after the pandemic's beginning, many studies were already published without using this standard.
The urgency of the studies to determine the filtration performance of the available materials led researchers to test easily accessible products such as clothing and household textiles.14,20,23,24 As a result, the researchers were able to provide only limited information on commercial products, including brand name, product type, and fiber composition. In some studies, the air permeability of the products was also measured as an indicator of breathability. The studies showed a wide variation in the filtration performance, even for the same product types. The lack of details on fabric properties prevented researchers from explaining the reasons behind the variation. 20 For example, Rengasamy et al. tested penetration levels of three sweatshirts from different brands, and the results varied from 40–80% against polydisperse particles with a face velocity of 5.5 cm/s. The researchers reported no explanation for the variation since there was insufficient information on the fabric characteristics. 17
Several researchers noticed the need for detailed fabric specifications, particularly for thickness and weight.20,24–26 Drewnick et al. stated that fabrics with higher weight and thread density tended to exhibit higher PFE. However, there was no noticeable trend between thread density and PFE. 24 Hao et al. supported the positive relationship between fabric weight and PFE. 26 Contrarily, Freeman et al. found a weak correlation factor (r) of 0.33 between fabric weight and PFE. The results also exhibited that fabric thickness had a positive and relatively strong correlation with PFE (r = 0.49). 25 Similarly, Zhao et al. mentioned the lack of a clear relationship between fabric weight and PFE. 23 Overall, the detailed fabric characterization was still limited to weight and thickness, and it was insufficient to provide an in-depth understanding of the filtration capability of fabrics. Considering the hierarchical structure of textiles, fabric characterization should have included yarn properties such as count, hairiness, and evenness that can directly impact the pore formation of fabrics.27–30 In addition, there was no information on the fabric treatments, which may have caused a variation in the filtration capability and air permeability of the materials tested.
Herein, we prepared single jersey fabrics made from different yarns without any fabric treatments and investigated the role of yarn selection in the filtration performance of the same fabric structures. The differences in yarn characteristics can alter fabric properties. Accordingly, we characterized the yarn and fabric properties together before testing the PFE of the fabrics. In addition, we conducted air permeability testing to assess the breathability of the fabrics.
Materials and methods
Yarn and fabric characteristics
A series of different cotton, cotton/polyester (polycotton) blends, silk, and wool yarns were selected. The yarns were ring-spun except for one of the cotton yarns, which was compact-spun to achieve relatively lower hairiness. The selected yarns were tested for hairiness and evenness using an automated yarn inspection system (Tester 5, Uster Technologies, Greenville, South Carolina, USA) following the ASTM D1425 standard. 31 Three bobbins were selected for each yarn and 1 km of yarn was tested for each bobbin with a velocity of 400 m/min. The measured coefficient of mass variation (CVm, %) and Uster Hairiness index indicated the variation in the yarn evenness and level of yarn hairiness, respectively. In addition, a skein method was conducted based on the ASTM D1907 standard to verify the linear density of the yarns. 32 One hundred and twenty yards per bobbin was tested for three bobbins of each yarn.
Nine single jersey fabrics were knitted using cotton, cotton/polyester, wool, and silk yarns on 14- and 15-gauge weft knitting machines and a 28-gauge circular knitting machine. Thicker yarns were required to be knitted on a lower gauge knitting machine due to the yarn count and machine compatibility. The yarn selection was based on the optimization of the yarn parameters to investigate the influence of fiber content, hairiness, evenness, and linear density on the filtration performance of single jersey fabrics.
Before conducting yarn and fabric characterization, all yarns and fabrics were conditioned at 21 ± 2°C and 65 ± 2% relative humidity for at least 24 h. Also, the fabrics were washed with 1 g/l Tergitol (non-ionic surfactant) and 1 g/l soda ash at 80°C and rinsed for 20 min. For fabric characterization, the weight of the fabrics was measured based on the ASTM D3776 standard, and the results were reported in grams per square meter (g/m2). 33 Wale and course numbers per inch were counted using a magnifying thread counter based on the ASTM D8007 standard. 34 After that, fabric thickness was measured with a thickness gauge following the ASTM D1777-96 standard. 35 For loop length measurements, the fabrics were cut at a distance of 10 cm from the edge of the fabric, parallel to the wale direction. Then, the number of loops per 10 cm was counted, and the yarn was ripped off along one course. The ripped-off yarn was stretched on a ruler, and the length of the yarn was measured. Dividing the length of the stretched yarn by the number of loops per 10 cm gave the loop length. For each fabric, 10 specimens were tested using the characterization methods.
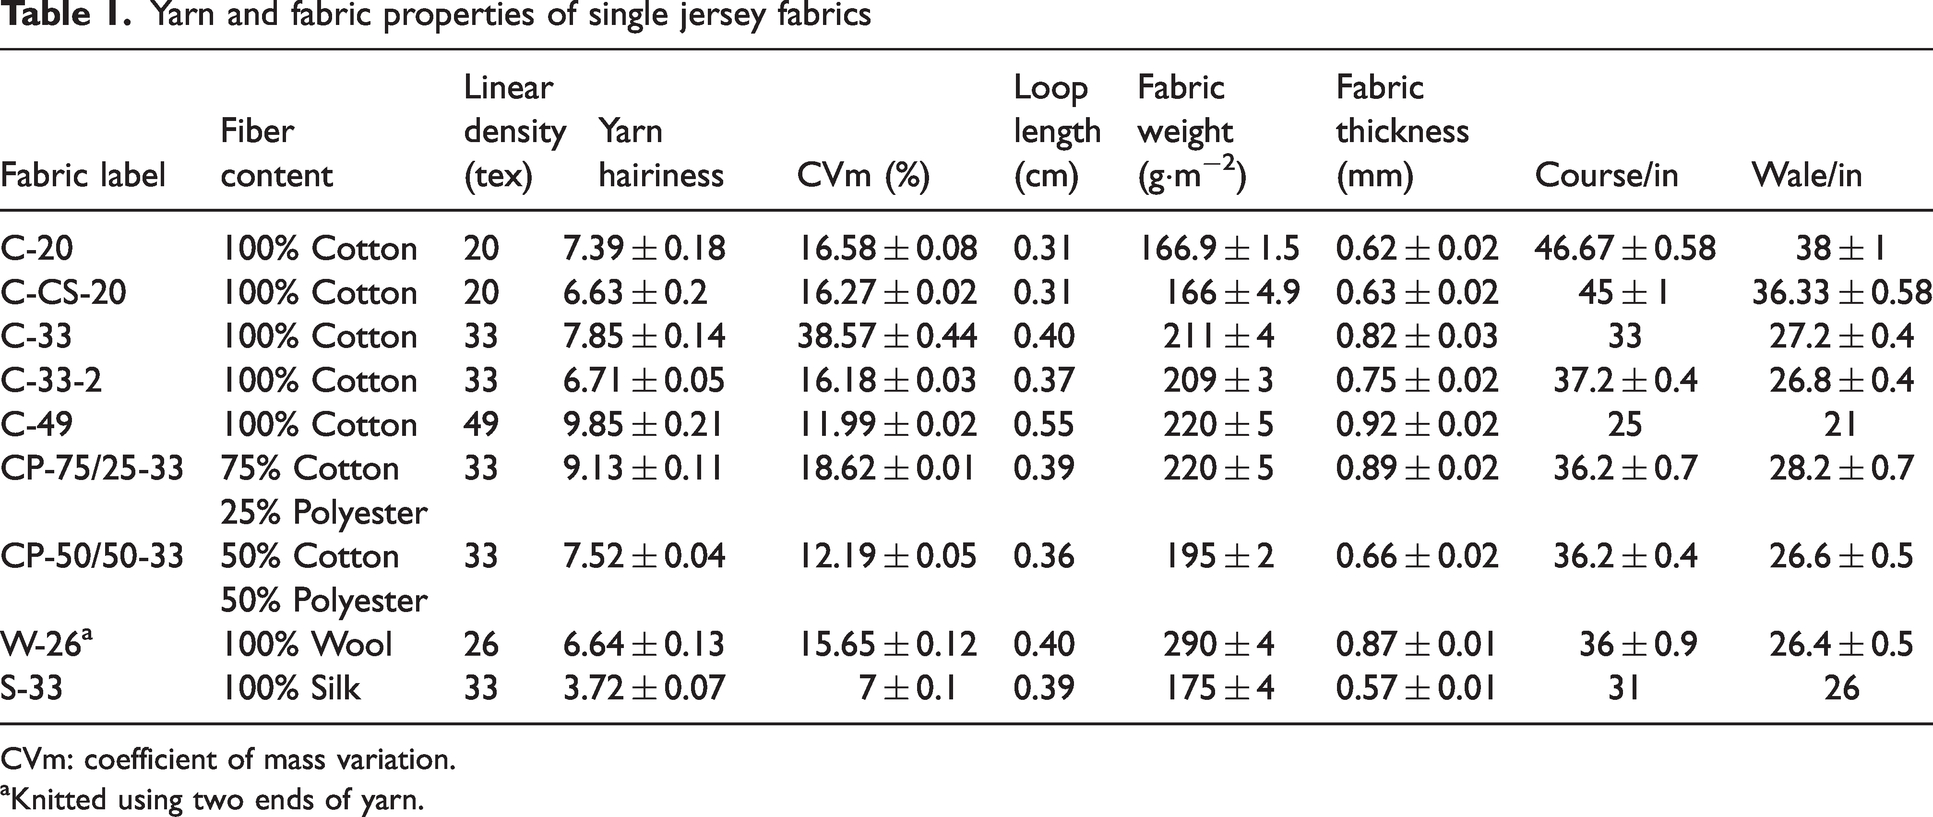
Table 1 displays the yarn and fabric properties of the single jersey fabrics. Each fabric was labeled based on its yarn properties. The labels were used to refer to the fabrics in the rest of the paper. The label's first letter corresponds to the fiber type's initial. C, CP, W, and S refer to cotton, cotton/polyester, wool, and silk, respectively. CS corresponds to compact-spun on the label C-CS-20. For cotton/polyester samples, 75/25 and 50/50 indicate the blend ratio of the yarn. Finally, the last digits at the label's end show the yarn's linear density except for C-33-2. Since we had two 100% cotton yarns with the same linear density but different yarn evenness, “2” was added at the end of the cotton yarn with the lower yarn evenness.
Yarn and fabric properties of single jersey fabrics
CVm: coefficient of mass variation.
Knitted using two ends of yarn.
Microscopy analysis
Digital microscopy enables high resolution and user-friendly adjustment of the image settings before capturing images. A digital microscope (VHX-7000, Keyence, Illinois, USA) was used to visualize the yarn formation of each fabric. Epi-illumination was turned off, and transmitted illumination was turned on. Unlike epi-illumination, transmitted illumination did not cause reflections on the fabric surface. Then, the “increase image quality” tool of the digital microscope software was used to provide a good level of contrast on the micrographs. Next, the images were optimized with the sharpening image mode, and micrographs were captured using the live depth composition mode. For image analysis, the images were imported into ImageJ. The scale bar on the images was used to set the scale, and then it was excluded from the images by cropping (Figure 1(a)). After that, the brightness/contrast of images was adjusted by a trained eye to highlight pores (Figure 1(b)). The image type was set to 8-bit to convert the images to grayscale images. Subsequently, a threshold was set to obtain binary images (Figure 1(c)). The threshold was adjusted for fabrics of different shades to prevent overestimating the pore sizes. Finally, the “analyze particles” tool was used to measure each pore area (Figure 1(d)). Pores smaller than 150 µm2 and those at the edge were excluded from the dataset to avoid image noise and an underestimation of the pore size, respectively.
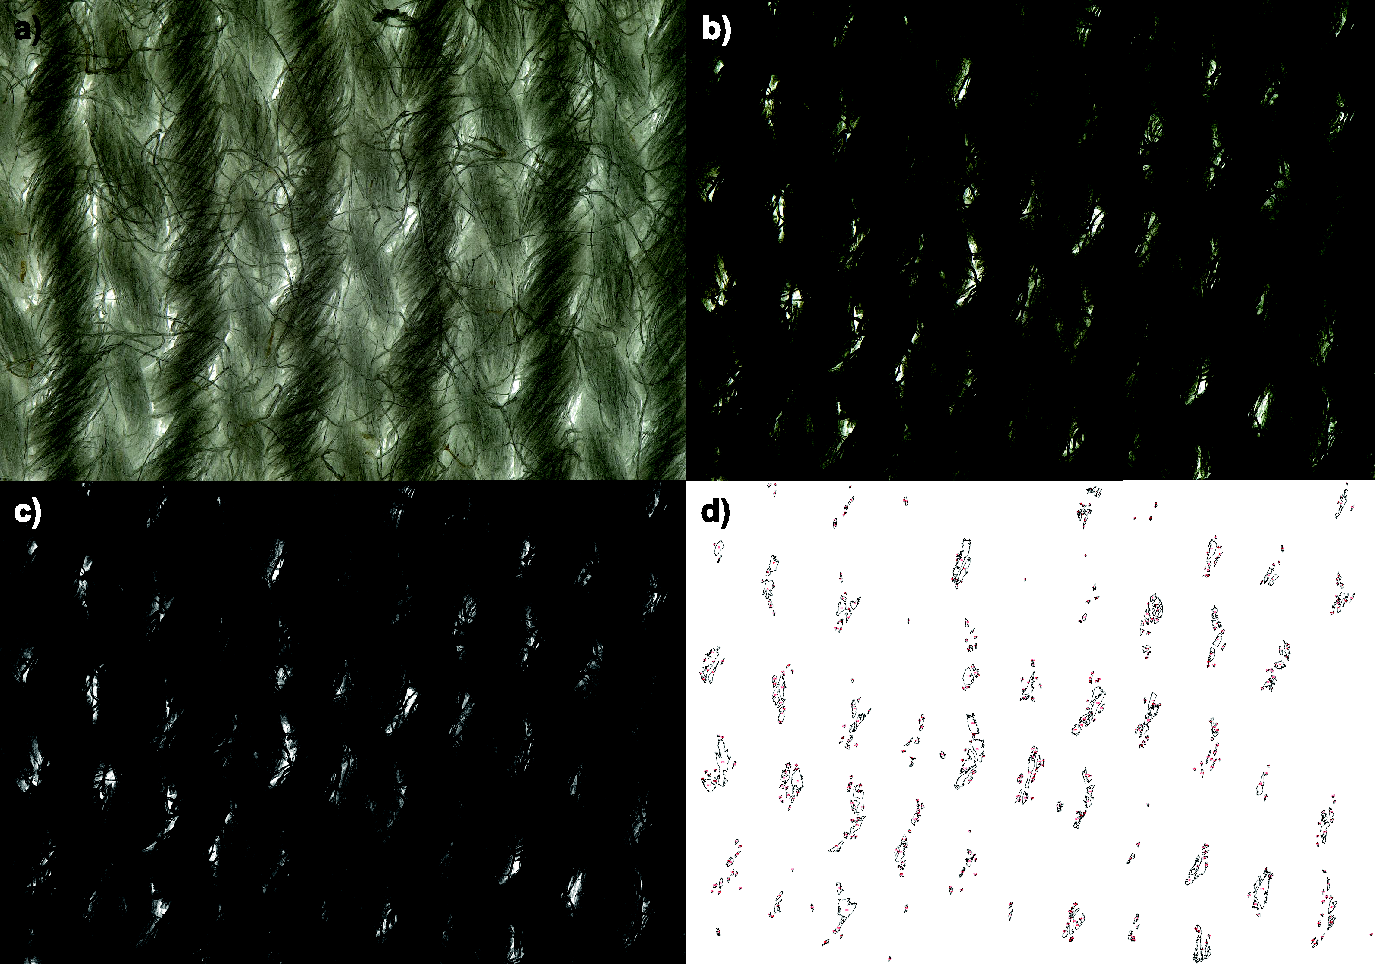
Steps of image analysis: (a) original image; (b) image with enhanced contrast; (c) binary image and (d) pore map of C-20 fabric.
Air permeability test
The air permeability of a fabric refers to how easily air can pass through the fabric, while the breathability of a cloth mask indicates how easily a wearer can breathe through the mask. Therefore, the air permeability of the fabric was measured to investigate and compare the breathability of the single-, double- and triple-layer fabrics in this study. An air permeability tester (F-FAP-HP, Frazier Precision Instrument Company, Hagerstown, Maryland, USA) was used based on the ASTM D737-18 standard. 36 Ten samples were tested for each fabric. The constant pressure drop was 125 Pa (∼12 mm H2O), and the diameter of the test area was 2.75 in. The results were reported following the ASTM method in ft3/min/ft2. On the other hand, the ASTM F3502 specifications report the maximum air resistance, indicating the lowest breathability of the masks allowed, which is 15 mm H2O (∼150 Pa). Since the air permeability measurement was performed in the acceptable range of pressure drop, the air permeability results were used to compare the breathability of the fabrics indirectly.
PFE test
For the comparison of the filtration capabilities of single jersey fabrics, the PFE of the fabrics was measured using a material particulate filtration test method developed by the Textile Protection and Comfort Center at North Carolina State University, Raleigh, North Carolina, USA. The test setup consisted of a test cell and two particle counters (see Figure 2). Three test specimens with a diameter of 2 in were cut from each fabric. Due to the low standard deviation (SD) of the PFE of fabrics, the number of specimens was kept at three for each fabric type. Each specimen was placed in the test cell with proper alignment, and the test cell was closed tightly to avoid leakage at the edges of the fabric. Then, the particle counters were connected to the test cell via tubes. Although cloth masks fit loosely with varying levels of leakage depending on the mask design, the sealing of the fabric edges allowed us to eliminate the influence of the mask design when measuring the actual filtration capabilities of the fabrics.
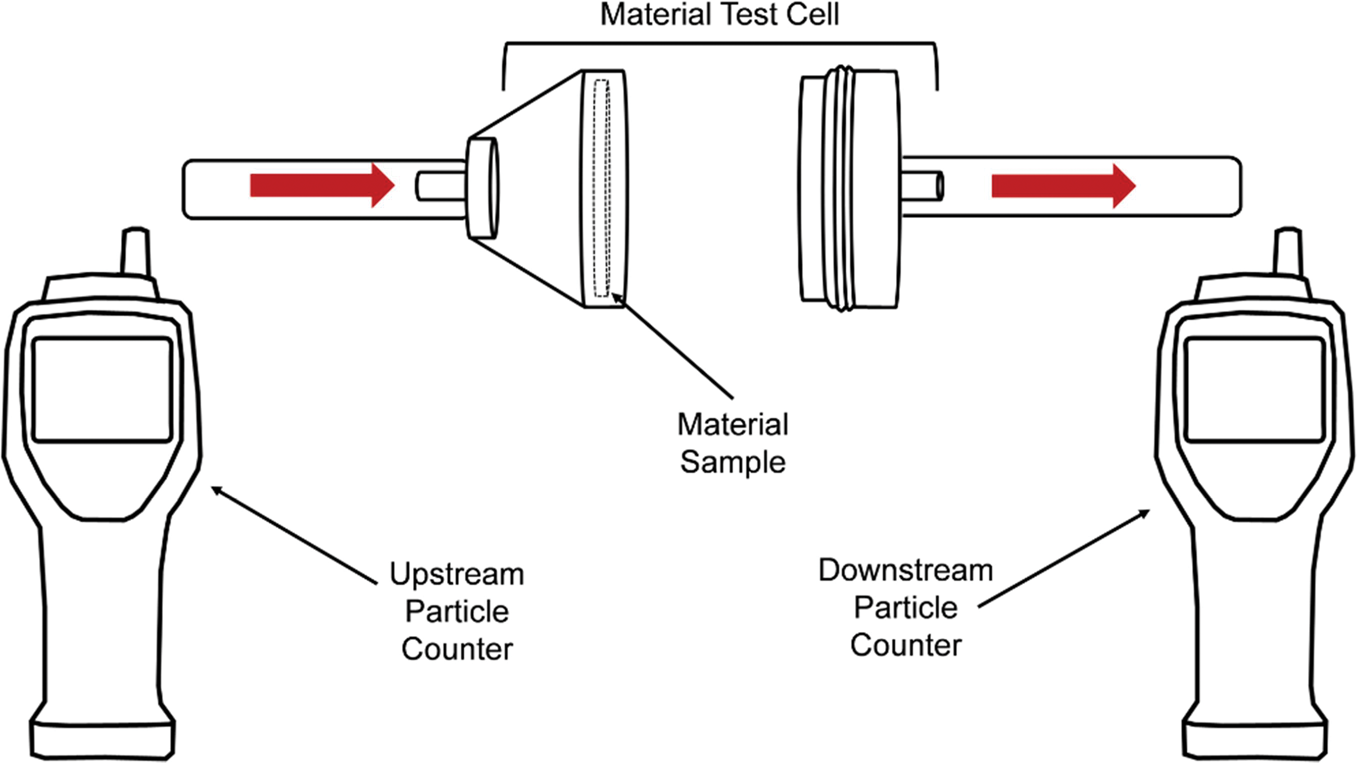
Material-level particulate filtration efficiency test setup.
Each specimen was tested for 3 min with a flow rate of 2.8 l/min (a face velocity of 2.3 cm/s). Despite the low value of the face velocity, it falls within the range of breathing velocities.
21
Only ambient air particles challenged the fabrics during the testing with no additional system to generate aerosols. The particle counters (Model 985, Fluke Corporation, Washington, USA) provided the differential particle counts/minute at 0.3, 0.5, 1.0, 2.0, 5.0, and 10 μm. PFE was calculated using the following equation:

Data analysis
Several statistical tests were conducted to analyze the collected data using JMP Pro 15 software. The first statistical test was a one-way analysis of variance (ANOVA), which enabled us to determine whether at least one of the PFE means of the fabrics was significantly different from others. However, ANOVA did not help with distinguishing which group or groups were significantly different from each other. A post-hoc test, the Tukey-Kramer honest significance difference (HSD) test, was applied to compare means. In addition, Spearman's correlation analysis was performed to determine the direction and strength of monotonic relationships between PFE and yarn/fabric properties. In the analysis, polycotton blends were excluded since their filtration performance was not solely dependent on their structural properties. In all statistical analyses, the p-value set was 0.05.
Results and discussion
PFE
Figure 3(a) presents the wide variation in PFE (15–45%) of single-layer fabrics against 0.3 μm particles. Among all single-layer fabrics examined, cotton/polyester fabrics (CP-75/25-33 and CP-50/50-33) exhibited the highest PFE values of 25% and 45%, respectively. The PFE results of cotton fabrics ranged from 17–22%, while the PFE of the wool fabric (18%) fell in the same range. Lastly, the S-33 fabric showed the lowest PFE with 15%. For multilayer fabrics, the results demonstrated, as expected, an increase in the PFE of the fabrics with a higher number of layers regardless of the fabric type. Yet, the double-layer S-33 fabric with a PFE of 22 ± 1% (see Figure 3(b)) could barely pass the 20% PFE requirement set by the ASTM F3502 standard.
22
On the other hand, the double-layer cotton and cotton/polyester fabrics performed PFE of up to 30.5% and 62.6%, respectively. Therefore, we recommend that the minimum design specifications of a multilayer cloth mask should be based on the PFE of single-layer single jersey fabrics. Estimating total PFE for multilayer fabrics would help eliminate the need for multilayer material testing. Accordingly, Drewnick et al. reported that the multiplication of transmission efficiencies of individual layers gave the total transmission of multilayer fabrics (opposite of PFE).
24
However, the suggested equation tended to overestimate our experimental results in general, as displayed in Figure 4. We recommend using the following equation based on our experimental results with r2 = 0.965 for the estimation of total PFE (PFEtotal) of single jersey fabrics with n number of layers:

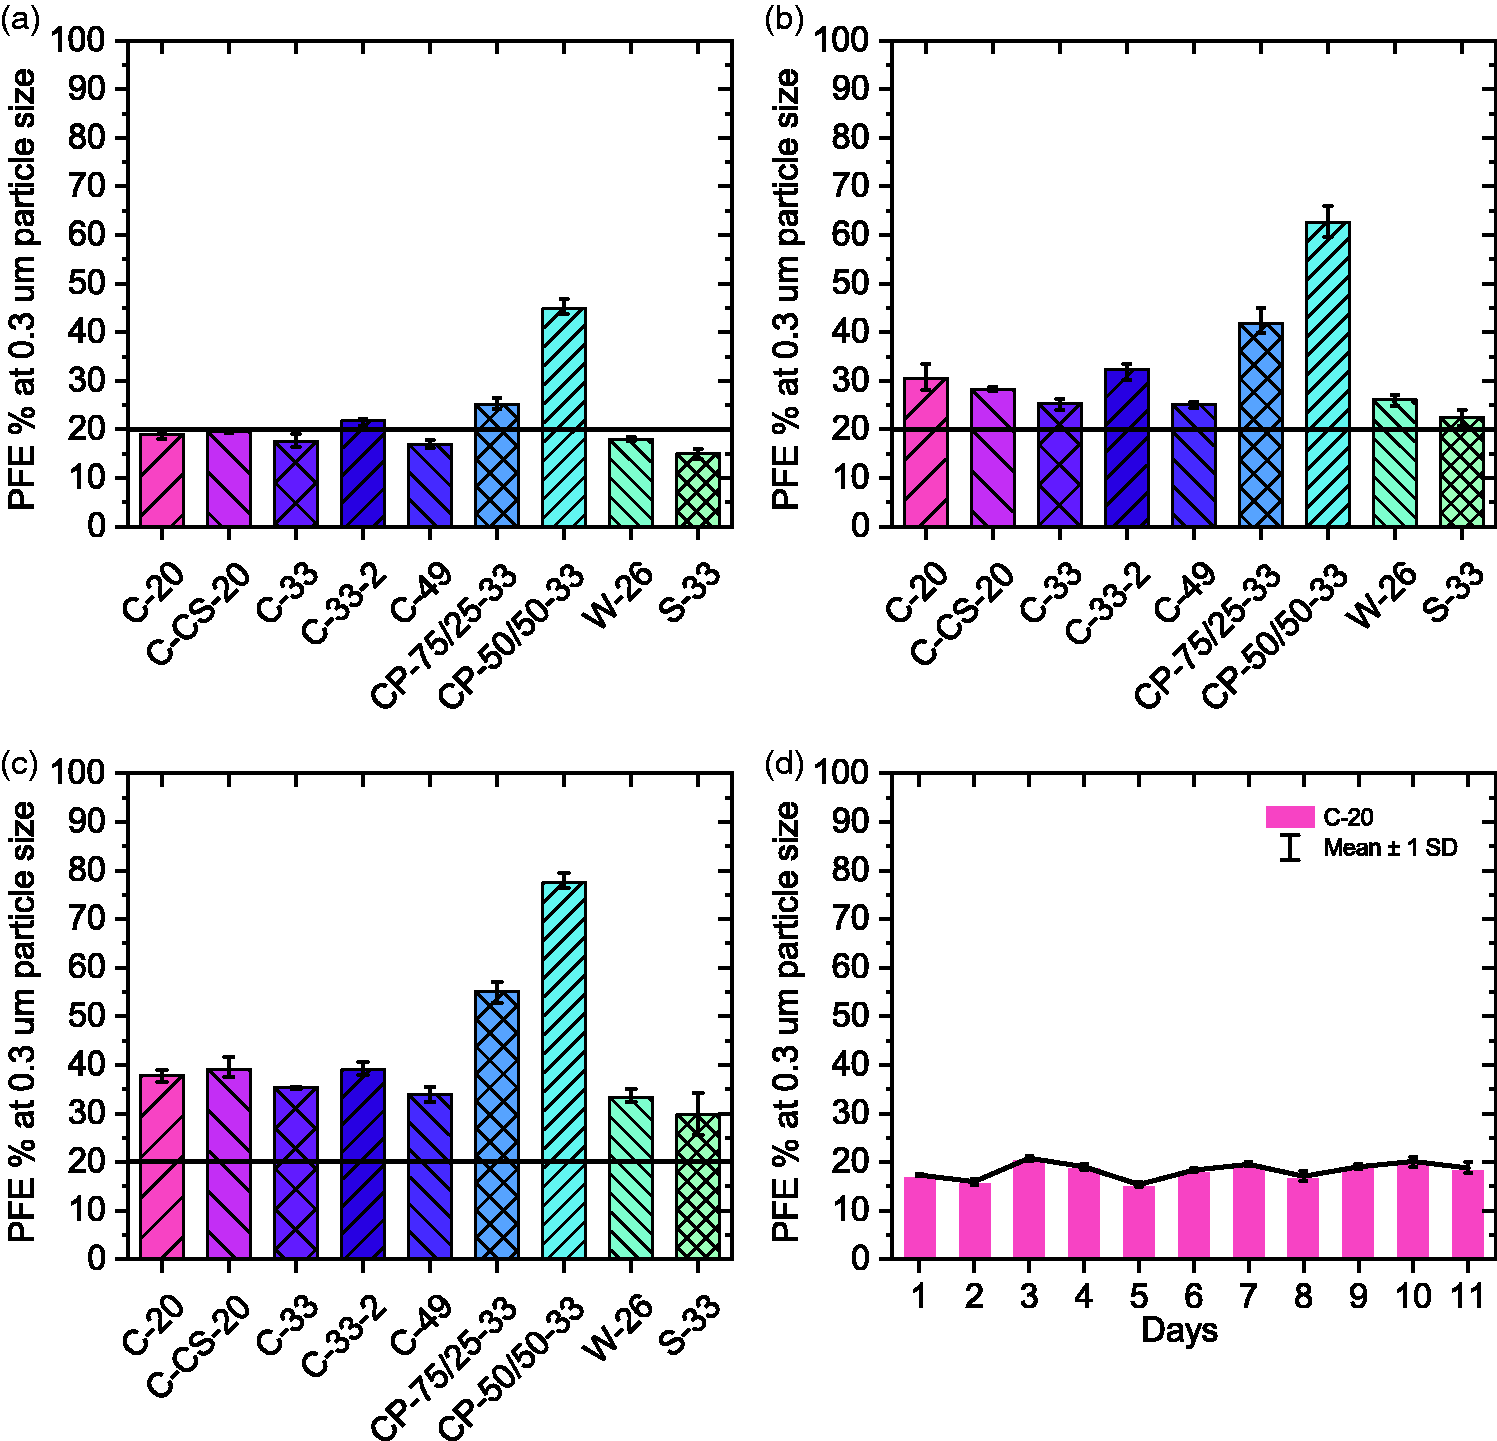
Particle filtration efficiency (PFE) of (a) single-; (b) double-; and (c) triple-layer single jersey fabrics against 0.3 μm particle size and (d) particle filtration efficiency of C-20 tested on different days.
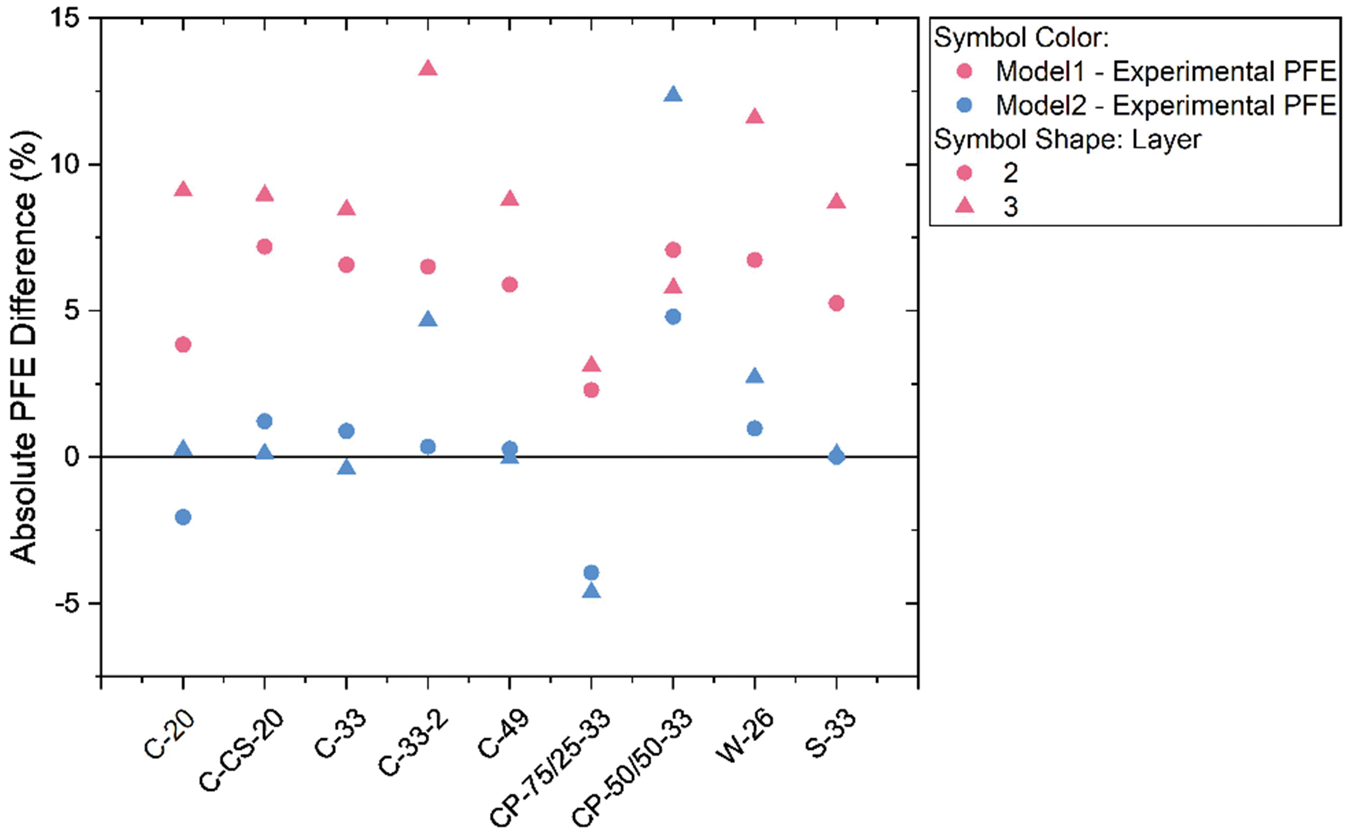
Comparison of absolute particle filtration efficiency (PFE) difference between calculated PFE and experimental PFE. Model1 refers to Drewnick et al.'s equation, while Model 2 refers to the equation developed by this study.
The generalized formula suggests that each additional layer will provide only 50% of its protection; therefore, there is a reduced benefit of adding layers to the PFE. While this equation was derived from a relatively small sample set, it provided a closer approximation to the experimental PFE results within a ±5% margin of the absolute difference between the calculated PFE and experimental PFE, with the exception of CP-50/50-33 (see Figure 4). Moreover, regardless of the fabric type, a similar proportional increase with an additional layer should be expected from the total PFE. One of the primary causes can be attributed to the effect of shared mechanical filtration mechanisms, diffusion, and interception at the 0.3 μm particle size. Those mechanisms are governed by aerodynamic and molecular interactions. 39 Adding a layer proportionally increases the number of obstacles that particles need to pass through, with a proportional improvement in the total PFE.
Table 2 displays the letter report from the Tukey-Kramer HSD test for the fabrics with significant differences between the means of PFE. The filtration performance of the fabrics that fell into different letter groups was significantly different from each other. The statistical analysis supports the importance of yarn selection on the PFE of single jersey fabrics. A statistically significant difference (p < 0.05) does not necessarily make a noticeable difference in the cloth filtration of single-layer masks due to the loose fit of the mask design. For example, there was a statistically significant difference between C-20 (19% PFE) and C-33-2 (22% PFE) fabric, but the 3% PFE difference might be negligible at a mask level. On the other hand, these slight differences can determine the minimum number of layers needed to meet the minimum filtration requirements set by ASTM F3502 specifications for multilayer mask designs. For example, double-layer C-20 could achieve 30% PFE, whereas at least three layers of S-33 were required to pass the minimum 20% PFE requirement.
Comparisons of particle filtration efficiency (PFE) of single jersey fabrics using Tukey-Kramer honest significance difference (HSD) test by the number of layers
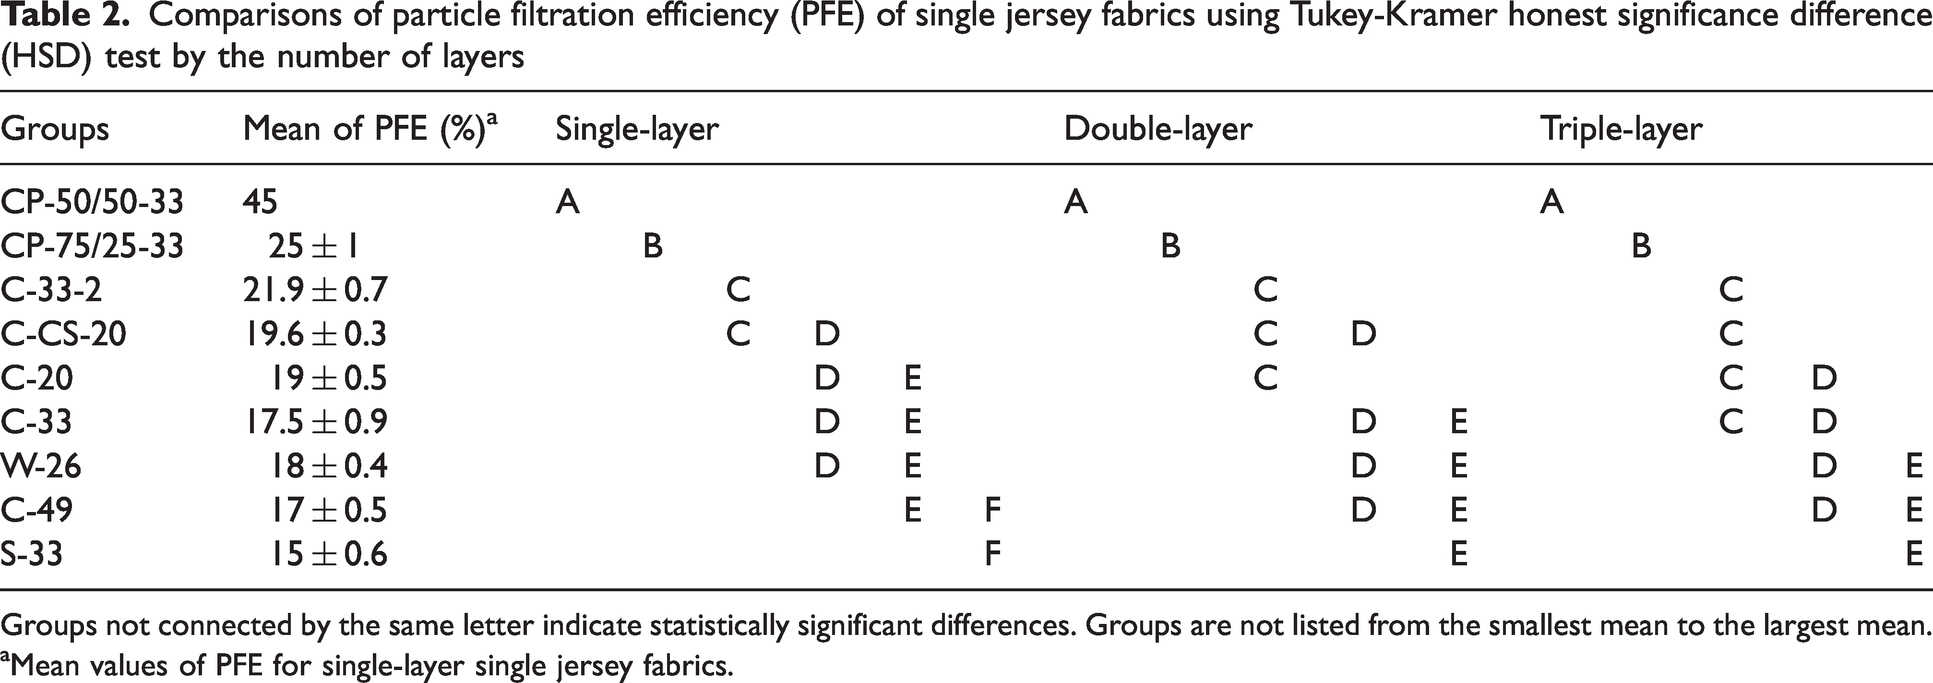
Groups not connected by the same letter indicate statistically significant differences. Groups are not listed from the smallest mean to the largest mean.
Mean values of PFE for single-layer single jersey fabrics.
In addition, since the ambient air content could differ depending on the season, the C-20 fabric was tested on 11 days from other months to investigate the effect of the variability in the ambient air content. As shown in Figure 3(d), the SD of the test results was less than 1.1% for a single day regardless of the test day, whereas the overall SD was 1.7%. The increase in the variation for day-to-day testing may have resulted from the change in the ambient air. Since the results for all samples in this study were collected on the same day, the variation was minimized.
Air permeability
Air permeability is a measurement of how much air can pass through the fabric and indicates the breathability of the fabric. Figure 5(a) presents the air permeability of the single-layer fabrics ranging from 110–330 ft3/min/ft2. As expected, the PFE of the cotton fabrics demonstrated an inverse relationship with air permeability, i.e. linear with airflow resistance, which is the inverse of air permeability. However, the cotton/poly fabrics with a greater PFE exhibited similar or higher air permeability than the cotton fabrics, except for the C-49 fabric. As the number of fabric layers increased, the decrease in air permeability followed a proportional decrease (see Figure 5(b) and (c)), similar to Drewnick et al.'s study. 24
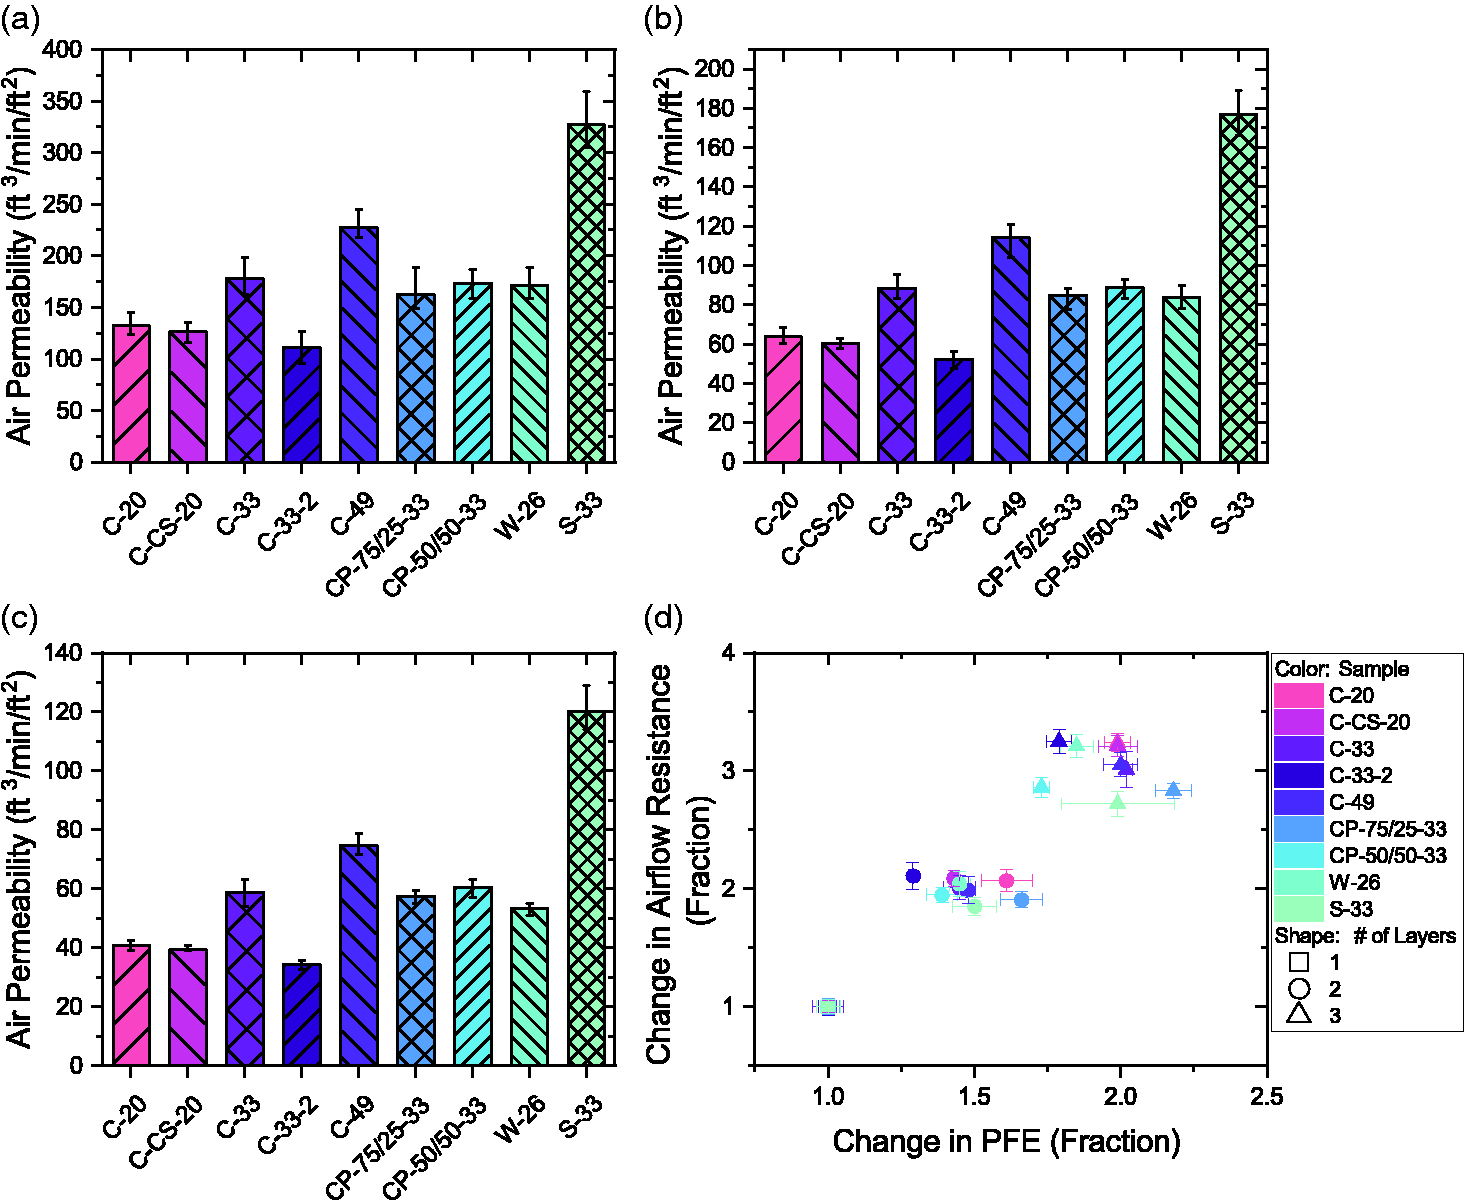
Air permeability of (a) single-; (b) double-; and (c) triple-layer single jersey fabrics and (d) Change in airflow resistance vs change in particle filtration efficiency (PFE) with a higher number of layers.
The increase in the fabric thickness through additional layers would result in the reduction of air permeability.
40
The results suggest the following equation to calculate the total air permeability of multilayer fabrics (AirPermtotal) based on the air permeability of single-layer fabrics (AirPermsingle-layer):

Figure 5(d) displays the changes in airflow resistance and PFE as the number of layers increased. Each layer added about half of its PFE but all of its airflow resistance, regardless of the fabric. The greater impact of adding layers on total airflow resistance can cause two main issues. The first issue is related to the breathability of the fabric. The higher the airflow resistance, the lower the breathability of the fabric. Therefore, high airflow resistance can cause breathing difficulties and might discourage the wearer from wearing the mask. 41 Furthermore, the increase in airflow resistance with more layers might contribute to leak generation and impair the total PFE at the mask level, depending on the mask design.20,42 Although the impact of mask design is beyond the scope of this paper, leakage around the mask may become a more severe problem for fabrics with lower air permeability.43,44 The high airflow resistance would encourage the inhaled air to pass mainly through the leaks around the mask rather than through the fabric. 45 Thus, the cloth masks may become much less effective regardless of the filtration capabilities of the fabric. Due to these issues, the air permeability of the fabric is as important as its filtration capability for cloth masks. Accordingly, the number of layers of a cloth mask should be minimized by considering the PFE and air permeability of the fabric.
Pore network of fabrics
A pore network of fabric is made of inter-yarn pores and intra-yarn pores. For single jersey fabrics with open structure, inter-yarn pores are substantially larger in size compared to intra-yarn pores. Since the inter-yarn pores create a path of least resistance, it can be expected that air primarily passes through the fabric via inter-yarn pores.46,47 A two-dimensional (2D)-image analysis technique was used to measure the inter-yarn pores in terms of individual pore area by ranking the pores from the smallest to the largest in a scatter plot (see Figure 6). Due to the irregular shape of the pores, the individual pore area was quantified instead of the pore diameter. As displayed in Figure 6, the pore network of fabrics mostly contained pores smaller than 5000 μm2, regardless of the fabric type. However, the pore size distribution varied substantially depending on the fabric. The pore size distribution of the S-33 fabric demonstrated an early sharp increase in the pore area, indicating that it had fewer smaller pores and more larger ones. As a result of this pore size distribution, the S-33 fabric had the greatest average pore and cumulative pore area, as listed in Table 3. For C-49, C-33, CP-75/25-33, and CP-50/50-33 fabrics, the larger the pores, the more distinct the size difference between the pores. Contrarily, the individual pore areas increased incrementally for W-26, C-CS-20, and C-20 fabrics. Although the effects of those pores are well-known for the air permeability of knitted fabrics, it is unknown how significant any difference in the pore network is on the PFE of single jersey fabrics.
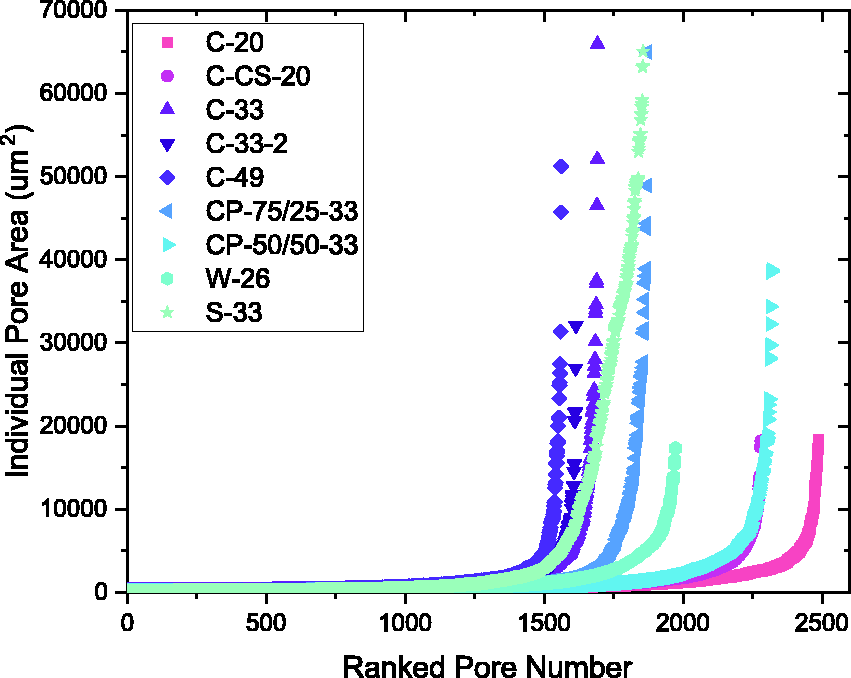
Pore size distribution of single jersey fabrics in terms of area.
Pore parameters of single jersey fabrics

Impacts of fabric properties on PFE
Interception and diffusion are the primary mechanical filtration mechanisms of filters capturing the particles at 0.3 μm. 48 When a knitted fabric is used as a filter, the effectiveness of those mechanisms can be impacted by the structural characteristics of the fabric associated with alterations in the geometric configuration of the pore network and yarn arrangement. Although the dependency of the fabric structure on the yarn properties is well-known due to the hierarchical nature of textiles, it remains uncertain to what extent the filtration performance of knitted fabrics with the same knit design may vary depending on the yarn selection. 19 To investigate the role of yarn selection, the fabrics made from yarns with the same linear density were knitted with the same machine settings. Adjustments were made to the machine settings for those with different linear densities to obtain comparable structural integrity. Therefore, any disparities in the fabric structures and, consequently, the filtration performance can be attributed to variations in the properties of the yarns used. The findings of the study exhibited that the single jersey fabrics performed PFE results ranging from 15–22%, with a median of 19%, except for the polycotton fabrics. Within the scope of this sample set, 19% PFE can be expected from a single jersey fabric with average yarn properties, whilst yarn selection can improve or impair the PFE of the fabric by 3–4%.
The first influence of yarn selection based on the fiber type was observed after the prewashing process. In spite of the fact that a similar knitting process was followed for the fabrics with the same linear density, the susceptibility of the fibers to shrink caused variation in the course densities of the fabrics. It is known that cotton-knitted fabrics shrink more than silk ones. S-33 fabric, made of silk fibers, had a course density of 31 per in, whereas the course densities of the cotton and polycotton fabrics with similar linear densities were 36–37 per in, except for C-33 fabric. The lower course density caused larger inter-yarn pores in the S-33 fabric, as shown in Figure 7. Furthermore, the S-33 fabric, having the lowest hairiness and variation in the evenness of the yarn, created a thinner and lighter fabric. As a result of these structural properties, aerosols moving with the airflow may have encountered fewer fibers while passing through the fabric, and the fabric exhibited the lowest PFE with the highest air permeability. On the other hand, there was no substantial difference in the filtration performance and air permeability of the C-20 and C-CS-20 fabrics despite the ∼10% greater yarn hairiness of the C-20 fabric. There was no strong correlation (ρ = –0.03) between the yarn hairiness and PFE based on Spearman's correlation analysis, as exhibited in Table 4. Despite the lack of substantial improvement in the PFE with higher hairiness, there might be a critical threshold value to experience the negative impact of yarn hairiness on filtration performance as a result of clear pore formation. The determination of the critical threshold value requires further testing. On the other hand, the C-33 and C-33-2 fabrics shared similar yarn features except for the high yarn unevenness of the C-33 fabric. Yet, the C-33-2 fabric had the highest PFE with 22% compared to other 100% cotton fabrics, whereas the C-33 fabric performed a PFE of 18%. The air permeability of C-33 and C-33-2 was 170 and 110 ft3/min/ft2, respectively. This relatively lower PFE of the C-33 fabric with much higher air permeability might have resulted from the irregular loop formation due to the more uneven yarns, creating a higher number of larger pores (see Figure 6).
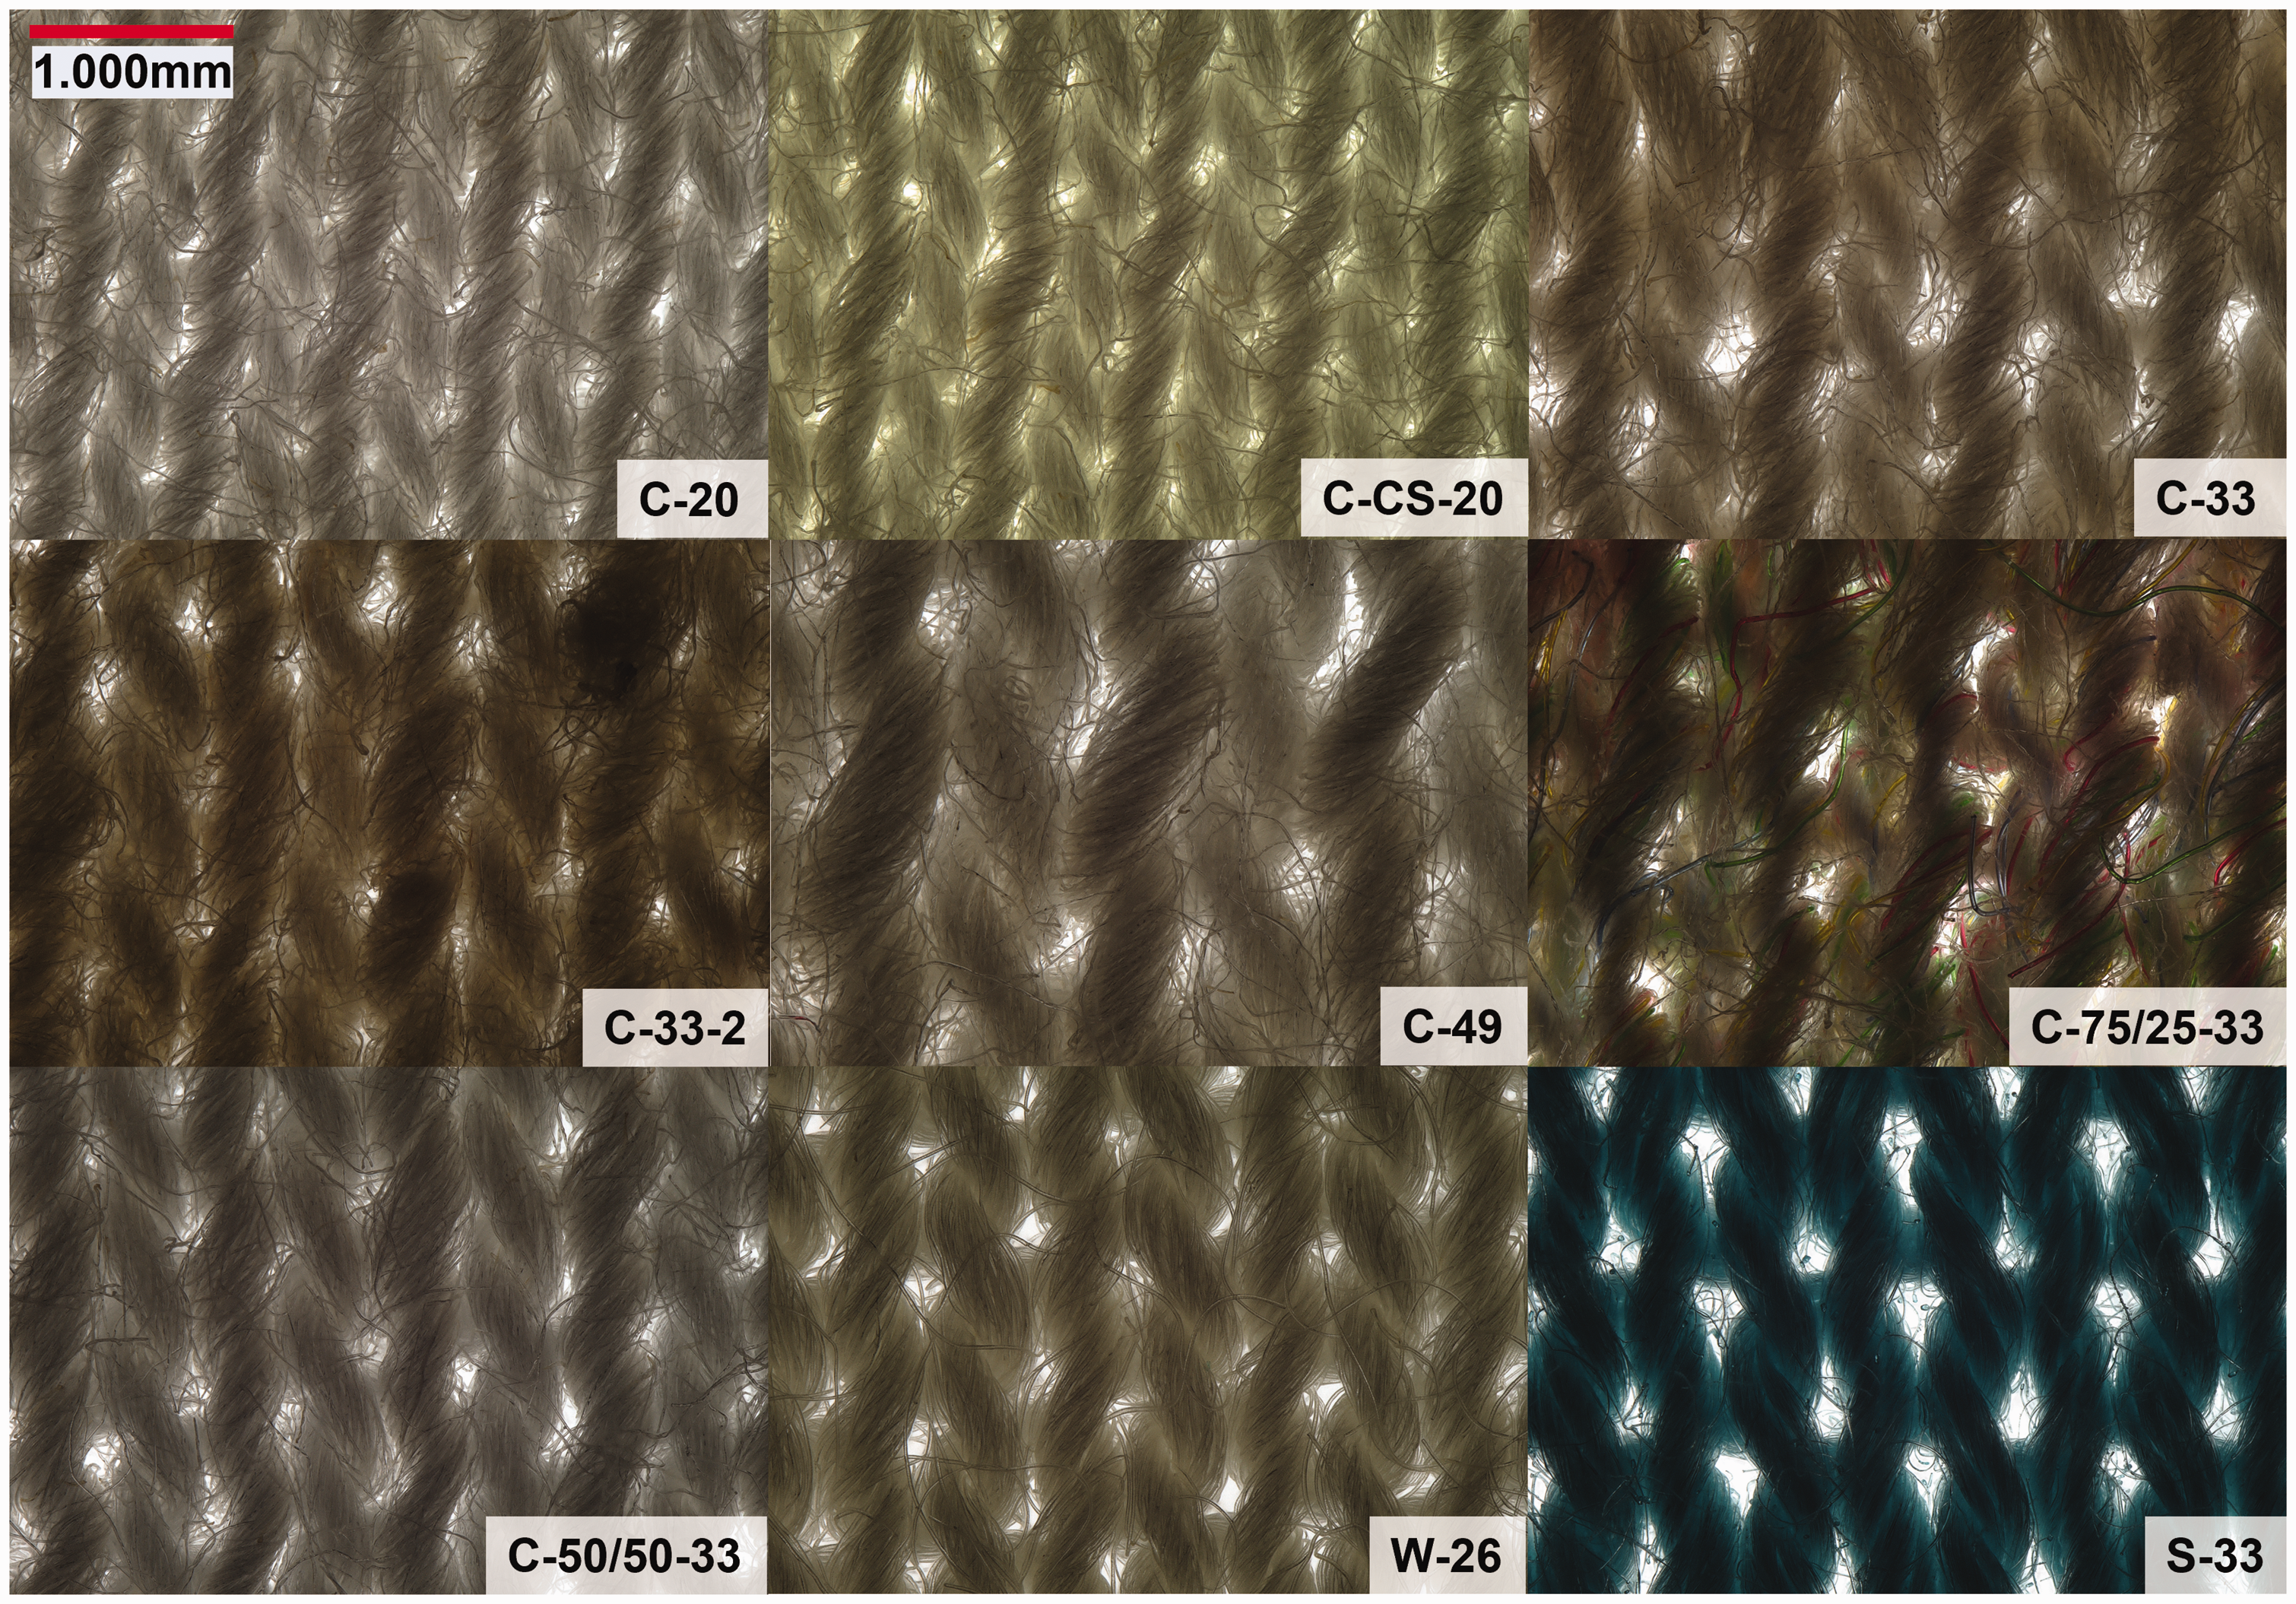
Micrographs of single jersey fabrics under ×80 magnification.
Spearman's correlation analysis.
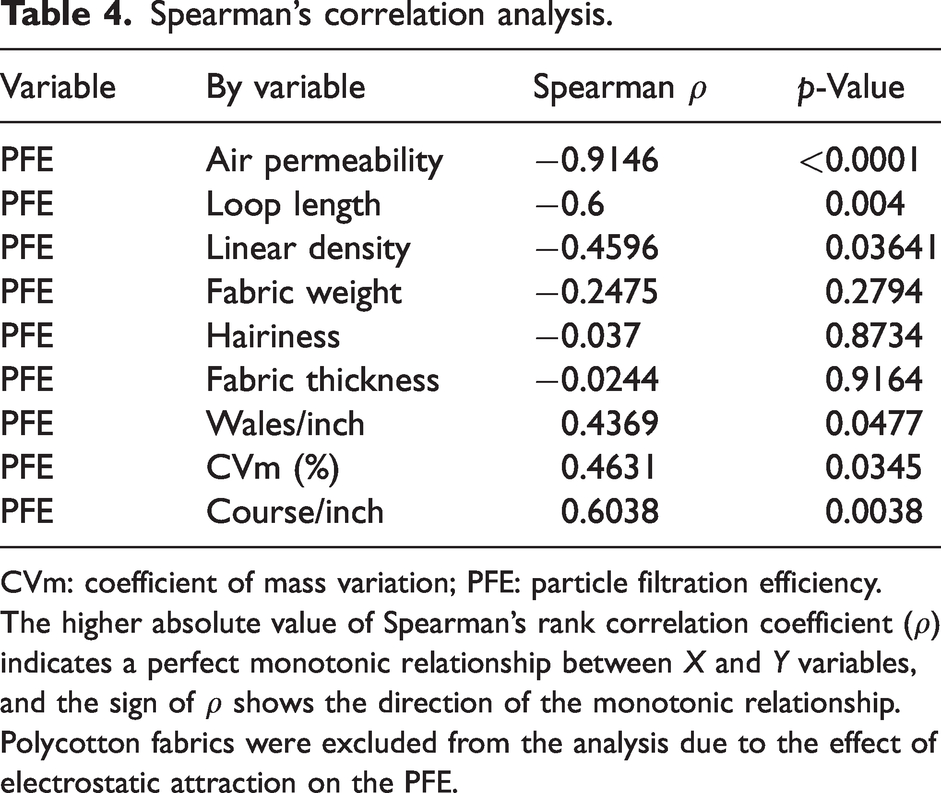
CVm: coefficient of mass variation; PFE: particle filtration efficiency.
The higher absolute value of Spearman's rank correlation coefficient (ρ) indicates a perfect monotonic relationship between X and Y variables, and the sign of ρ shows the direction of the monotonic relationship. Polycotton fabrics were excluded from the analysis due to the effect of electrostatic attraction on the PFE.
Loop length is another critical parameter affecting fabric weight and thickness as a function of yarn count. The thicker the yarn, the larger the loops with a bulkier and heavier fabric. Also, course and wale densities decrease with the thicker yarn. The C-20 fabric, made from the thinnest yarn, had the smallest loops and, hence, the highest course and wale densities with the lowest weight and the second-lowest thickness (see Table 1). Moreover, the C-49 fabric with the thickest yarn had the highest thickness and the second-highest weight as a result of its loop formation. Yet, larger loops can lead to the formation of larger inter-yarn pores with lower course and wale densities. Its longer loop length could explain the pore size distribution of the C-49 fabric with the highest median pore area. Even though the structural differences between the C-49 and C-20 led to a two-fold increase in the air permeability of C-49, there was no statistically significant effect on PFE, resulting in only a 2% difference. On the other hand, the W-26 fabric with 26 tex yarn led to the highest weight since two ends of yarn were used to provide a similar fabric structure to those made from 33 tex yarn. In terms of hairiness and evenness, the yarn of W-26 fabric was similar to C-33-2 fabric. However, as exhibited in Figure 6, the pore network of the W-26 fabric consisted of a higher number of pores with a larger cumulative pore area as an indicator of a more porous fabric that might have resulted from the contribution of using multiple ends to yarn-yarn spaces. The W-26 fabric had 150% greater air permeability alongside a 4% reduction in PFE compared to the C-33-2 fabric. Considering the effects of yarn count, the results exhibited that the increase in the fabric thickness and weight as a result of thicker yarn does not necessarily improve the PFE due to larger pore formation. The lack of a strong monotonic association of thickness and weight with PFE also supports this claim (Table 4). Therefore, using thinner yarns can be advantageous for limiting the pore size and preventing an unnecessary increase in fabric weight and thickness.
In addition to the mechanical filtration mechanisms, fibers that can be charged electrostatically and retain the charges can utilize electrostatic attraction to capture aerosols. Previous studies reported that electrostatic attraction was the key mechanism primarily capturing the aerosols at MPPS for knitted fabrics. 49 However, the effectiveness of electrostatic attraction varies depending on the environmental conditions and becomes unpredictable in real-world applications. The ability of textile fibers to be charged electrostatically and retain the charges shows a wide range depending on the fiber type. For example, hydrophilic cotton fibers can be barely electrostatically charged and dissipate the charges quickly as humidity increases. On the other hand, the ability of polyester fibers to retain the electrostatic charges is greater than that of natural fibers. The hydrophobic nature of the polyester fibers does not absorb the moisture, which causes the fiber not to conduct the charges. 50 The difference between the electrostatic behavior of cotton and polyester fibers might explain why cotton/poly fabrics, CP-75/25-33 & CP-50/50-33, showed substantially greater PFE. Moreover, when the mass percentages of polyester and cotton fibers become similar, the contact between the fibers becomes more intricate. The fibers can form a more tortuous pore network, which can surpass the mechanical filtration mechanisms. 51 Meanwhile, the polyester portion of the yarn may retain the charges. The presence of both cotton and polyester fibers can contribute to the increase in the effectiveness of the mechanical filtration mechanisms and electrostatic attraction.
Table 4 presents the results of Spearman's correlation analysis. The analysis shows a stronger monotonic relationship between the pair variables as the absolute value of Spearman's rank correlation coefficient (ρ) is closer to one. However, the acceptable threshold indicating a strong correlation might differ depending on the research field. It should be noted that the existence of a correlation does not indicate causation. In this analysis, polycotton fabrics (CP-75/25-33 and CP-50/50-33) were excluded due to the effect of electrostatic attraction, which is not dependent on the fabric structure. Since the generation of electrostatic attraction depends on the fiber type, which is character data, Spearman's correlation used for numerical variables cannot explore the relationship between fiber type and cloth filtration. The analysis indicated that there was an extremely strong negative monotonic (ρ = –0.9143) association between air permeability and PFE. Moreover, the association of loop length with PFE was reasonably strong with negative monotonic correlation (ρ = –0.6), and the relationship between linear density and PFE was moderately negative monotonic with ρ = –0.4596. On the other hand, the relationship of wale density and CVm with PFE demonstrated a moderate positive monotonic relationship with ρ values of 0.4369 and 0.4631, respectively. The comparison of C-33 with C-33-2 fabrics showed that extremely high yarn unevenness might reduce the filtration performance of the fabrics due to the irregular loop formation with larger inter-yarn pores. The strongest positive monotonic association was between course density and PFE with ρ = 0.6038. Although the correlation does not give causation, the positive impact of course density on the PFE can be expected since higher course density can limit the air pathways for the fabrics with the same linear density. The p-value was smaller than 0.05 for all those results, indicating evidence of a statistically significant correlation between the variables.
Conclusions
The present work studied the effects of yarn properties on the filtration performance of single jersey fabrics. The conducted characterization techniques identified structural differences between the fabrics resulting from the yarn properties. Despite the similarity of the knit structures, the polycotton fabrics performed up to 45% PFE, while the PFE of other fabrics varied from 15–22%. The fact that polycotton fabrics exhibited the highest PFE results in spite of the absence of noticeable structural differences indicates that the fibers may have induced electrostatic attraction due to their electrostatic properties. Further investigation is needed to compare grounded and charged cotton/polyester fabrics. The results support that 19% PFE can be expected from a single jersey fabric with average yarn properties, except for polycotton fabrics. The choice of yarn selection can result in a 3–4% increase or decrease in PFE. Moreover, Spearman's correlation analysis supports a relatively strong monotonic association of course density and loop length with the PFE, whereas CVm, wale density, and linear density showed a moderate correlation with the PFE, except for the polycotton fabrics. Considering the property-structure relationship, the results support that yarn features can alter the filtration performance of single jersey fabrics, causing statistically significant differences. Our findings suggest that using yarns with smaller linear densities can effectively reduce the size of macro pores through the formation of smaller loops, allowing for more courses and wales per unit area. Furthermore, while higher hairiness does not necessarily yield substantial improvements in the PFE, yarns with extremely low hairiness should be avoided, as they can lead to the formation of more prominent and larger pores, as exemplified by the silk sample (S-33). When considering yarn evenness, a moderate CVm can be used to minimize irregularities in loop formation. It is worth noting that the effect of yarn selection on the PFE is smaller compared to its effect on the air permeability.
Evaluating the filtration performance of the multilayer fabrics demonstrated that adding layers improves the PFE of the fabrics and facilitates meeting the minimum 20% PFE set by the current standard ASTM F3502. However, each layer can improve the total PFE only by half its PFE while adding all its airflow resistance. Therefore, the minimization of the number of layers is required to limit the tradeoff between PFE and air permeability. Meanwhile, the significance of yarn selection becomes greater for the PFE of double-layer fabrics with up to 10% difference. Overall, this study suggests that yarn properties should be considered in fabric selection for cloth masks, and the number of layers should be optimized in mask design to avoid a false sense of protection in multilayer cloth masks. To ensure the appropriate selection of fabrics based on yarn properties, it is imperative to verify breathability and filtration performance at the mask level, considering the potential for leakage caused by the loose fit of cloth masks. Future work should also consider the drapability and stretchability of fabrics, which can impact the mask fit and the PFE of the cloth masks.
Footnotes
Declaration of conflicting interests
The author(s) declared no potential conflicts of interest with respect to the research, authorship, and/or publication of this article.
Funding
The author(s) disclosed receipt of the following financial support for the research, authorship, and/or publication of this article: This work was financially supported by the Centers for Disease Control and Prevention (000HCCCG-2021-50798).
