



Abstract
Down is often used as a natural filler for warm clothing, but the odor of down is one of the issues that affects the performance of warm clothing applications. At present, the evaluation of down odor mostly uses the human olfactory evaluation method, which has low reproducibility and accuracy. This article first uses the method of activated carbon gas extraction/gas chromatography–mass spectrometry to identify five down odor compounds that can be detected in a stable way, as representative compounds of down odor. Then, a simple direct impregnate extraction/gas chromatography–mass spectrometry method was used to determine the exact concentration of odor compounds in down fibers. Finally, an odor level radar chart was constructed by analyzing the concentration of odor representative compounds of levels 1–5 in down. The digital visual evaluation method was composed of direct impregnate extraction combined with radar chart to judge the down odor level and compared to the human olfactory method. The results indicate that the radar chart evaluation has relatively accurate evaluation results and is more objective and accurate than the human olfactory method. This method for evaluating the odor level of down is simple and reliable, and has certain promotion and application prospects in the down production industry.
Down is a good green insulation material, which is favored by consumers for its lightness, fluffiness, and warmth. 1 Down obtained from animals is accompanied by some animal lipids. 2 These natural oils and fats are the key to the warmth of down. However, the fishy odor emitted by the lipids may contribute to a poor experience for consumers during production and use.3 –9 Down odor not only affects the quality of the down but also affects the health of consumers. Therefore, controlling and evaluating down odor is very important to regulate the quality of down products.
Before filling and sewing down, down manufacturers must first clean the down fibers to remove impurities and odors. Zhaohui et al. 10 developed a detergent to remove lipids from down. The results of the study showed that a high residual rate of lipids in down after washing would cause an increase in down odor, but a low residual rate of lipids in down would affect the fluffiness, luster, and warmth of down. Yuhui et al. 11 studied the effect of the washing process on down odor, and the results showed that controlling the amount of detergent, the number of rinsing times, bath ratio, and water temperature in the washing process had a significant effect on the reduction of down odor. The residual odor on the down after pretreatment washing is an important index to evaluate the quality of the down.
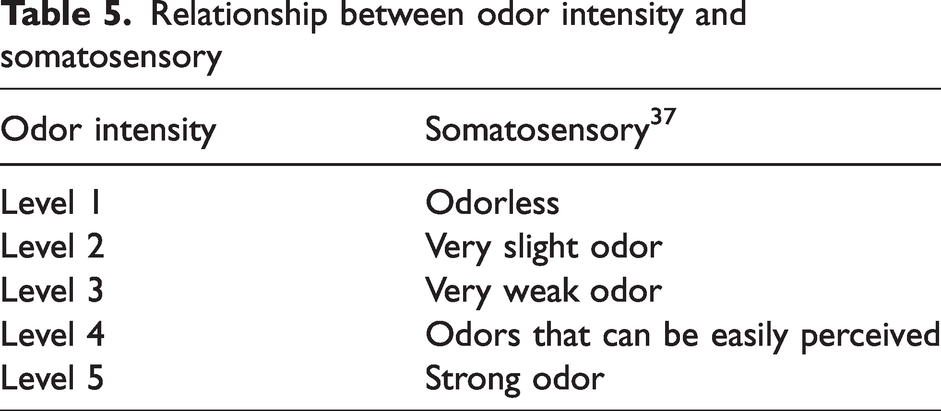
Currently, the human sense of smell is used worldwide to evaluate down odor.12 –15 The standard ISO 8586-2023 12 is the “official analytical method” for down odor testing developed and implemented by the International Down and Feather Bureau (IDFB). The official analytical method takes down samples for pre-treatment and then tested for 24 h, though the sample has no rotting odor to determine whether the down samples were qualified or not. The GB/T 10288-2016 standard is a national standard developed by China with reference to the International Feather Bureau - Official Analysis Method, which is currently the main method for Chinese enterprises and the down commodity market to determine the quality of down. 16 The GB/T 10288-2016 standard divides down odor into five levels, the first level represents no odor, the second level represents extremely weak odor, the third level represents weak odor, the fourth level represents the odor that can be easily perceived, and the fifth level represents strong odor. The GB/T 10288-2016 standard uses the fixed-temperature dry sniffing method, which is attended by five inspectors, and the unanimous judgment result of more than three people is taken as the inspection result. Although the human olfactory evaluation method of down is widely used, due to the inspector’s influence the odor evaluation results are subjective and there may be individual differences.17,18 In addition, environmental factors can seriously affect the results.
To address the subjectivity of human olfactory evaluation of down odor, researchers have begun to use analytical instruments to analyze the composition of down odor.9,19 –21 Among them, gas chromatography–mass spectrometry (GC-MS)22,23 is an analytical method which is characterized by accurate detection and lower-line concentration of detectors, so that trace concentrations of chemicals can be analyzed. Therefore, it is widely used in the analysis of odor characteristics of flavors and fragrances and the analytical study of various trace compounds.24,25 Costa et al. 20 used headspace extraction to extract down odorants and GC-MS to analyze the extracted odor samples. It was shown that down odor is composed of volatile compounds with a specific odor. Wan wangjun et al. 26 used direct methanol extraction to obtain a methanol solution containing down-odor compounds, and the methanol extraction solution was analyzed using GC-MS. The results showed that the extracted solution of down contained dozens of small molecule compounds, including esters, carboxylic acids, hydrocarbons, ethers, alcohols, aldehydes, and ketones. These compounds have different molecular weights, and there are great differences in molecular structure and polarity, so their volatile properties are also very different.
From the few available studies, the majority have analyzed the structure and content of small molecular compounds in down fibers. These studies did not relate the odor compounds of down to the odor levels of down products. The wide variety of small molecular compounds contained in down fibers has also made it difficult to classify down odor levels. How to identify the down odor level simply, stably, and accurately is still a difficult problem faced by down producers. The establishment of a simple, rapid, and accurate down odor evaluation method will be conducive to the correct evaluation of down quality, not only providing a reliable data basis for optimizing down production technology but also improving the quality of down products.
The radar chart represents multi-dimensional data which is suitable for comprehensively evaluating the performance of a product and has a strong visual impact.27,28 By comparing the changes in shape and area of radar charts, the changes and differences between product performance can be visualized.29 –31 Yingjie et al. 32 used the radar chart method to study the aroma characteristics of flowers. Differences in flower aroma and concentration were recognized based on changes in the area and shape of radargrams, and the effects of volatile components in flowers on aroma characteristics were revealed. Zhilong et al. 33 also used the radargram method in a study of vegetable flavor characteristics, revealing the effects of small molecular compounds in various radish varieties on the differences in radish odor.
From the physiological mechanism of odor olfaction, it can be seen that the chemical substances that can stimulate the human olfactory organs must be small molecular compounds that are easy to volatilize. 34 Different volatile compounds have different thresholds for human olfaction due to their different structures. In this article, we start from the real demand for fast, simple, and accurate evaluation of down odor quality. Firstly, purified activated carbon fibers were used to collect the volatile odor small molecules of down fibers in a gaseous state. GC-MS analysis was used to identify the volatile odor compounds that can be stably detected in down fibers as the representative compounds of down odor. Then direct impregnate extraction was used to measure the exact concentration of these representative compounds in down. By analyzing the concentration of these representative compounds in down with known odor levels, a visual radar chart of the representative compounds and odor level of down was constructed by using radar chart method. The reliability of the method was verified by performing GC-MS analysis/radargram visualization grade evaluation with unknown down fibers, and comparing the results of the digital-visualization grade evaluation with those of human olfactory evaluation.
Experiment
Instruments and reagents
The down materials used in this experiment were provided by the Shanghai Donglong Down Products Co. Ltd. The activated carbon fiber non-woven fabric used in this experiment was provided by the Aladdin Biochemical Technology Co. Ltd.
The equipment consisted of a single quadrupole gas chromatograph mass spectrometer QP2020NX (Crypto Scientific Instruments Co. Ltd), an elemental analyzer (Leeman Prodigy; Leeman Technology Co. Ltd), and a circulating water type multi-purpose vacuum pump SHZ-DIII (Heqi Glass Instrument Co. Ltd).
The reagents consisted of methanol GC (≥99.9%; McLean Biochemical Technology Co. Ltd), hexanol GC (≥90.0%; Yuanye Biotechnology Co. Ltd), ethyl acetate GC (≥99.5%; Titan Technology Co. Ltd), and acetonitrile GC (≥99.5%; McLean Biochemical Technology Co. Ltd).
Experimental methods
Purification of activated carbon fibers
Methanol can extract the impurities adsorbed on the activated carbon fibers, thus acting as a cleaning agent for the carbon fibers. 35 Activated carbon fiber non-woven fabric of size 30 cm × 30 cm was placed in the serpentine rope extractor with 20 g of molecular sieves and 300 ml of methanol. Under the conditions of a 65°C water bath, the methanol was forced to reflux five times, so the activated carbon fibers were thoroughly washed. The cleaned activated carbon fibers were placed in a tight bag and allowed to dry at 150°C.
Based on a mass spectrometry database search, it was learned that there were methyl hexadecanoate, methyl octadecanecarbonate, and silicone-containing impurities such as [(benzyloxy)imino]acetic acid, trimethylsilyl ester, and cyclopenta dimethylsiloxane on the activated carbon fiber before purification. In analysis the injection process of GC-MS is that the automatic injection needle breaks the cap of the sample bottle, the sample is directly injected into the gas chromatography inlet for gasification, and the cap of the sample bottle is made of rubber, so there may be part of the rubber with the solvent in the gas chromatography inlet.22,36 To clarify the specific source of the silicon impurities, an elemental analyzer was used to analyze the type and content of the elements on the activated carbon fibers, and the results showed that 1 g of the sample contained 11.52 mg of silicon, which indicates that the activated carbon fibers do contain silicon impurities. The gas chromatograms of activated carbon fiber before and after purification are shown in Figure 1. Observing the number of peaks of the two in the chromatogram, it can be seen that the number of peaks after purification of activated carbon fiber is significantly fewer than before purification. Most of the impurities were washed away by methanol, and only methyl hexadecanoate with a retention time of 14.685 min and methyl octadecanecarbonate with a retention time of 16.090 min were not processed cleanly. The reason is that methanol is a polar solvent, so according to the principle of similar solubility, it is less soluble with non-polar and low-polar solvents. That is, methanol is less soluble in solvents with high-fat solubility. Therefore, methanol is not very effective in removing methyl hexadecanoate and methyl octadecanoate. As it is known in the pre-test that these two substances are not contained in the down, they can be clearly distinguished in the peak diagram.37,38 These two substances did not affect the qualitative and quantitative analysis of the odor components on the down. Therefore, activated carbon fibers treated with methanol purification were used as solid adsorbents for odor adsorption on down.
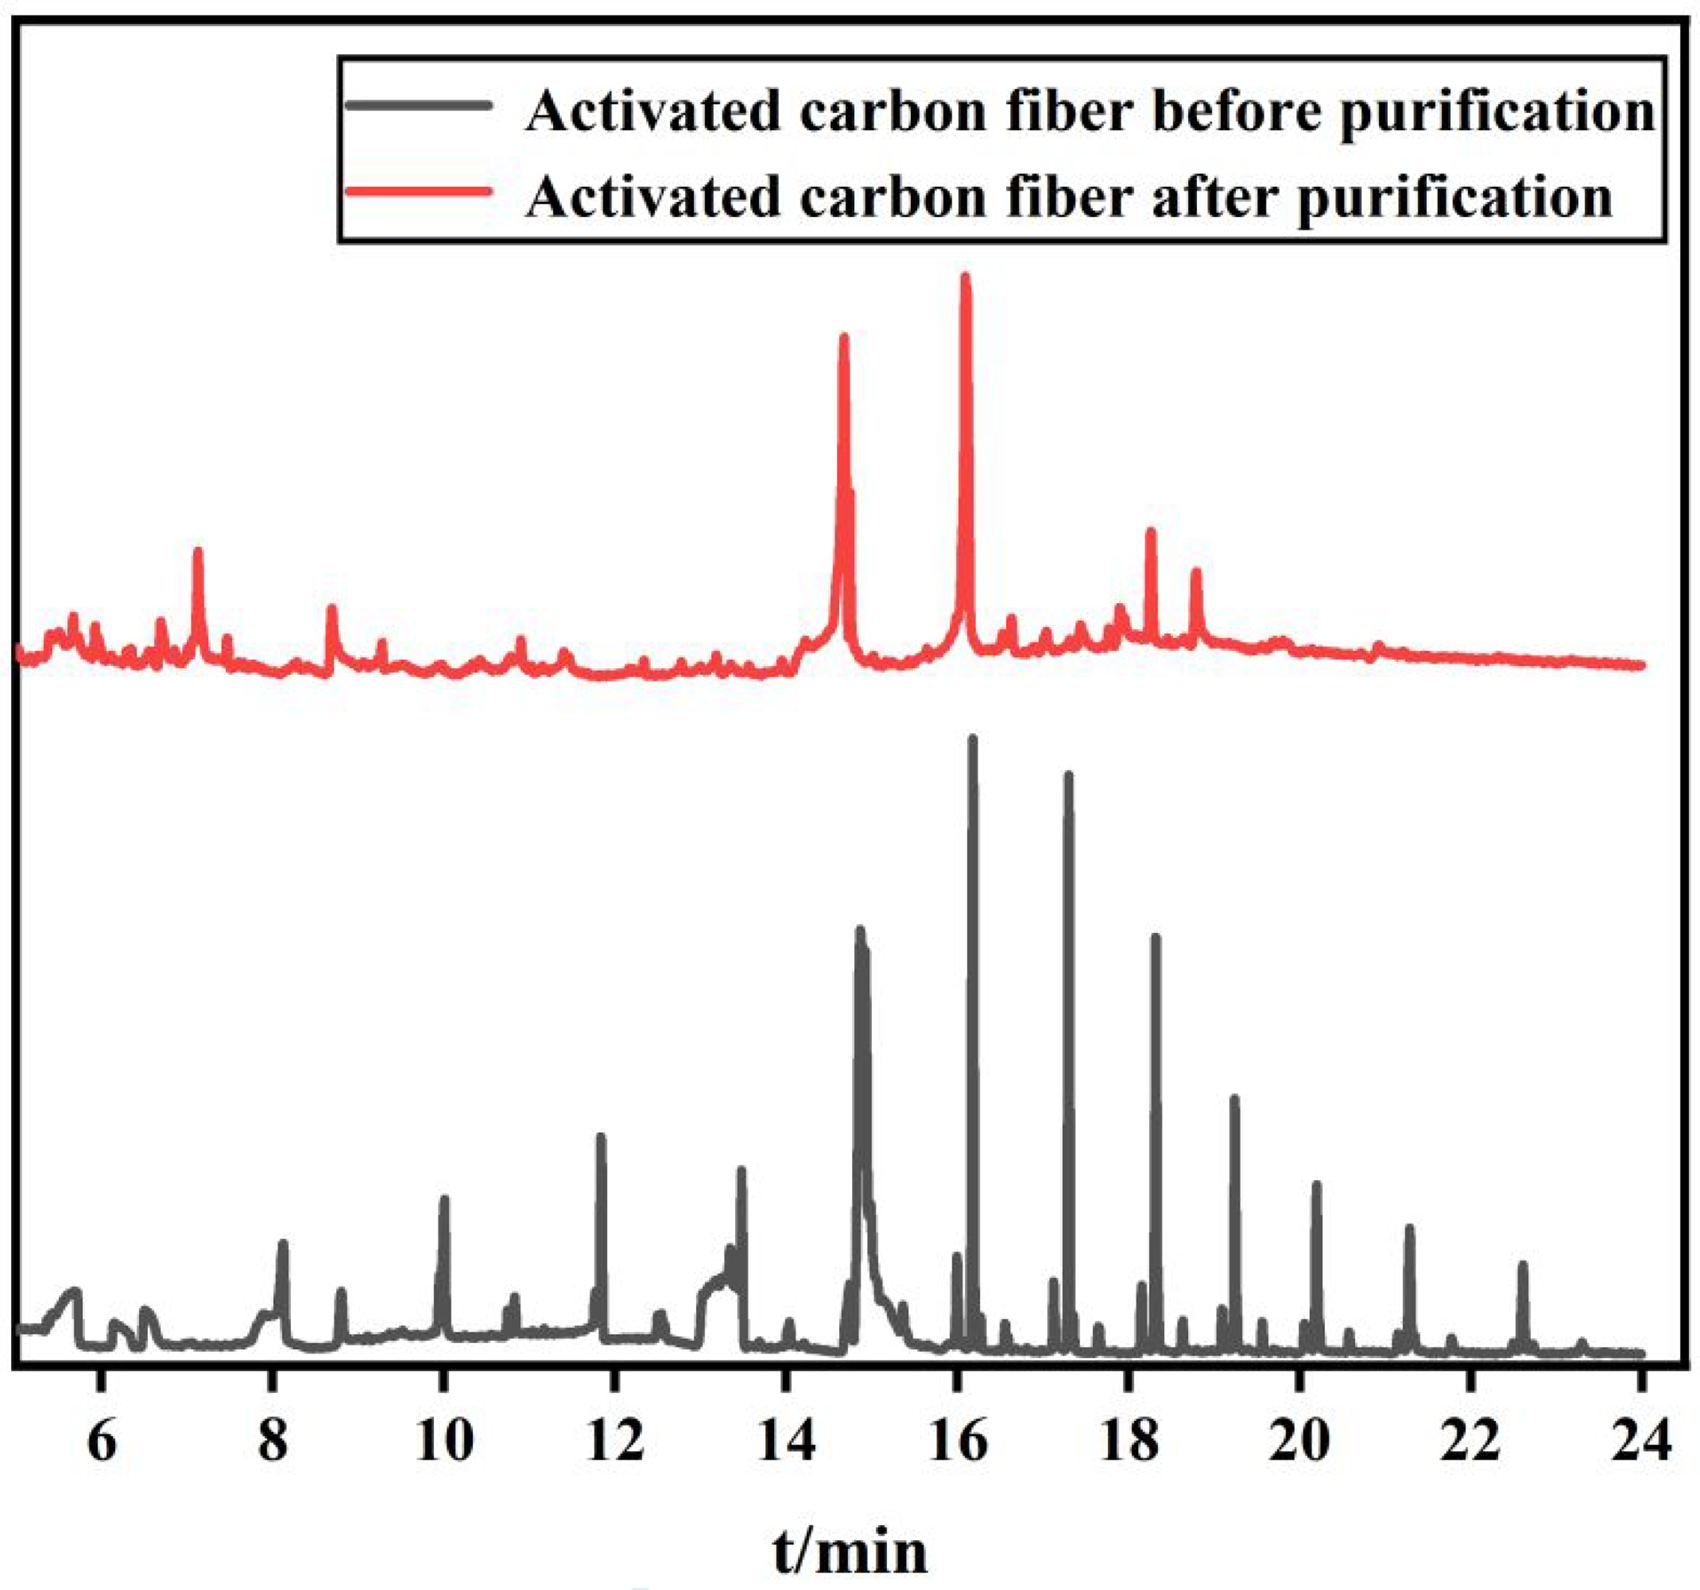
Chromatogram of activated carbon fiber before and after purification.
Preparation of standard solutions
Preparation of standard solution of the internal standard sample. An amount of 1 ml of cis-hexene-3-ol and n-hexanol was added to 100 ml of methanol solution to get 10,000 ppm of standard solution.
Checking the literature,34,39,40 the boiling point of volatile organic compounds on down is known to be less than 200°C. N-hexanol is a colorless transparent liquid at room temperature and pressure, with a boiling point of 157°C. Cis-hexene-3-ol is a colorless oily liquid, and its boiling point is 156–157°C. The boiling points of N-hexanal and Cis-hexene-3-ol are close to those of the volatile compounds in down. The boiling points of n-hexanol and cis-hexene-3-ol are close to those of volatile organic compounds (VOCs) on down, which meets the requirement that the peaks of the internal standard are close to the peaks of the components to be measured and completely separated. It is known in the pre-test that n-hexanol and cis-hexene-3-ol do not exist on down, so a mixture of the two was chosen as the internal standard. The characteristic peaks of the internal standard are shown in Figure 2.
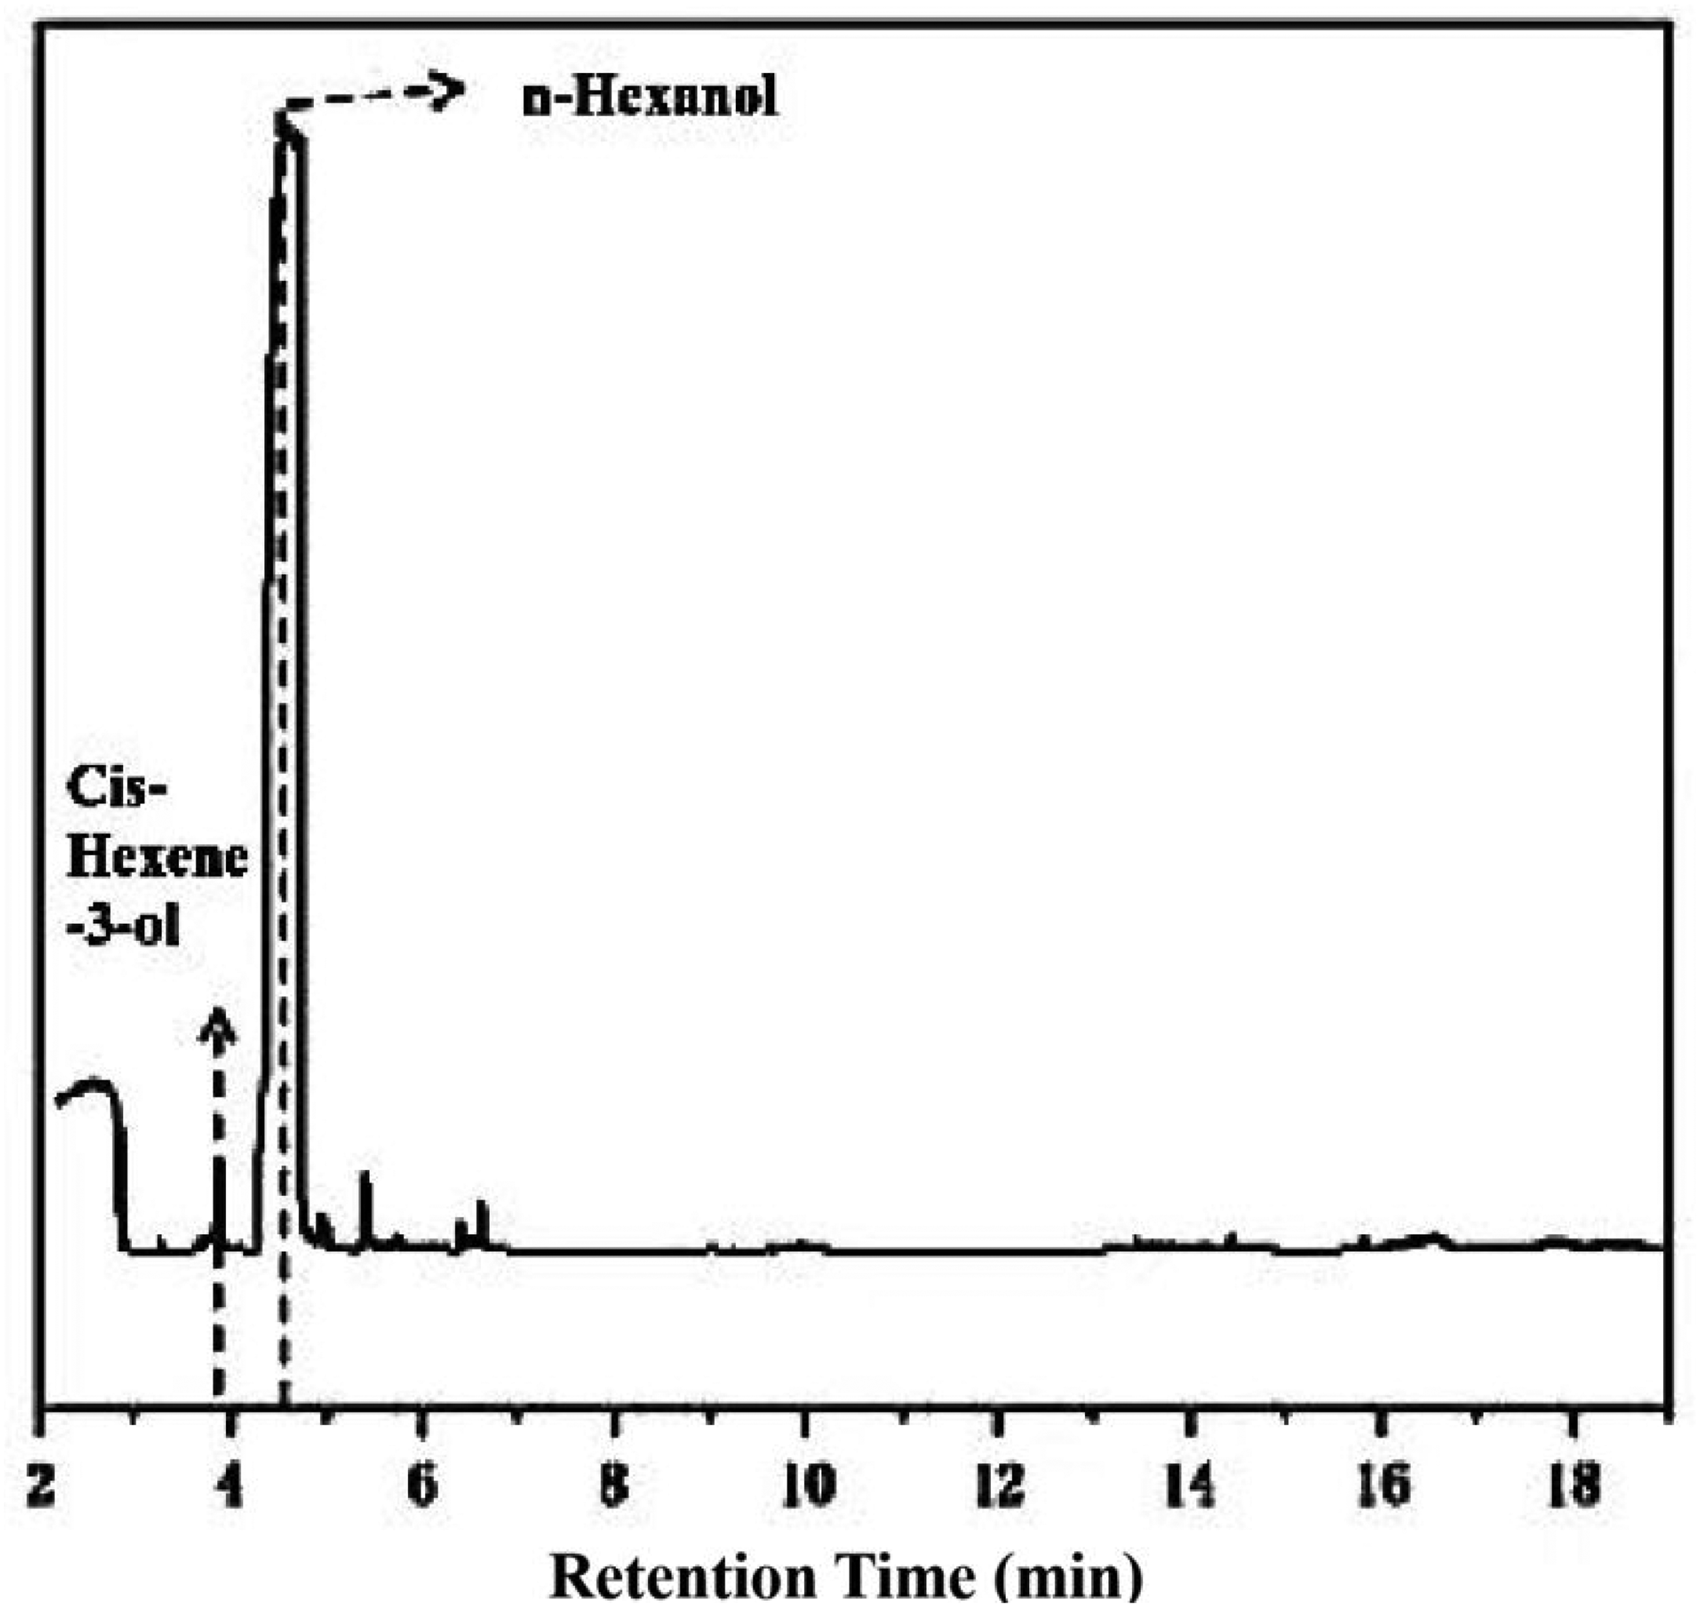
Internal standard chromatogram.
Dynamic adsorption of down odor by activated carbon fiber non-woven fabric
A quantity of 5 g of down was added to a 500 ml wide-mouth container, then 1 ml of internal standard solution was added dropwise on the down. Next, 1 g of purified activated carbon fiber non-woven fabric was placed in the middle of the glass tube, connected to the pump and other equipment, and the gas flow rate was set to 1 l/min. The adsorption period was 20 min. After adsorption, the activated carbon fibers were quickly soaked in 30 ml of methanol solution and after 3 h the resolution of the methanol solution was used for GC-MS analysis. Three separate concurrent sets of experiments were conducted under identical circumstances. The apparatus is shown in Figure 3.
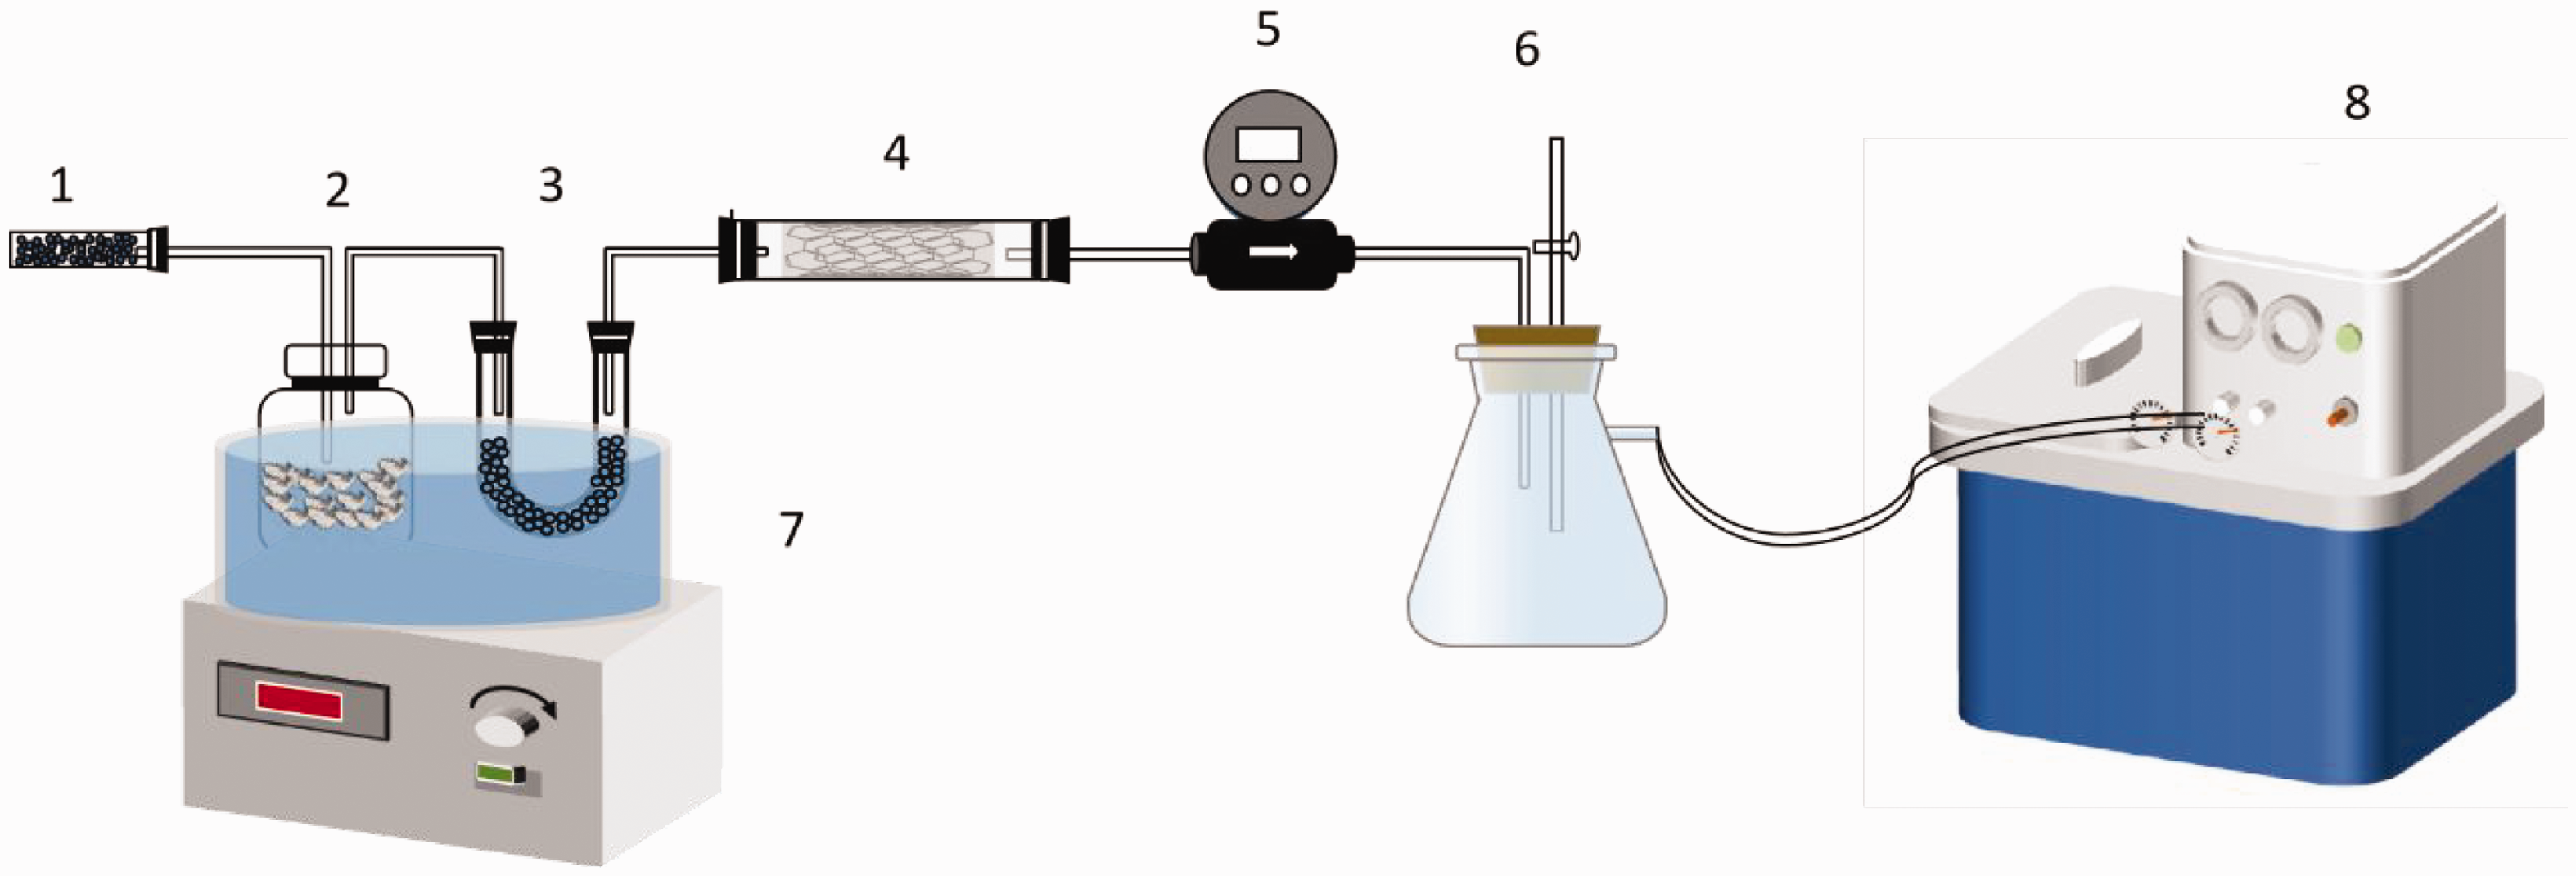
Dynamic adsorption method plant chart. 1 and 3: color-changing silica gel; 2: down fiber; 4: activated carbon fiber; 5: gas mass flow meter; 6: buffer device; 7: constant temperature heating magnetic stirrer; 8: water pump.
Static adsorption of down odor by charcoal fiber
A quantity of 5 g of down was placed in a 1000 ml wide-mouth vial with a rotor, then 1 mg of internal standard was added dropwise to the vial. Next, 1 g of activated carbon fiber was placed in a polyester mesh bag. The bag was suspended above the down. The temperature of the water bath was set at 40°C, and the adsorption time was 12 h. After the adsorption, the activated carbon fibers were quickly taken out and immersed in 30 ml of methanol solution, and then analyzed by GC-MS after 3 h of analysis. Three sets of parallel experiments were performed. The apparatus is shown in Figure 4.
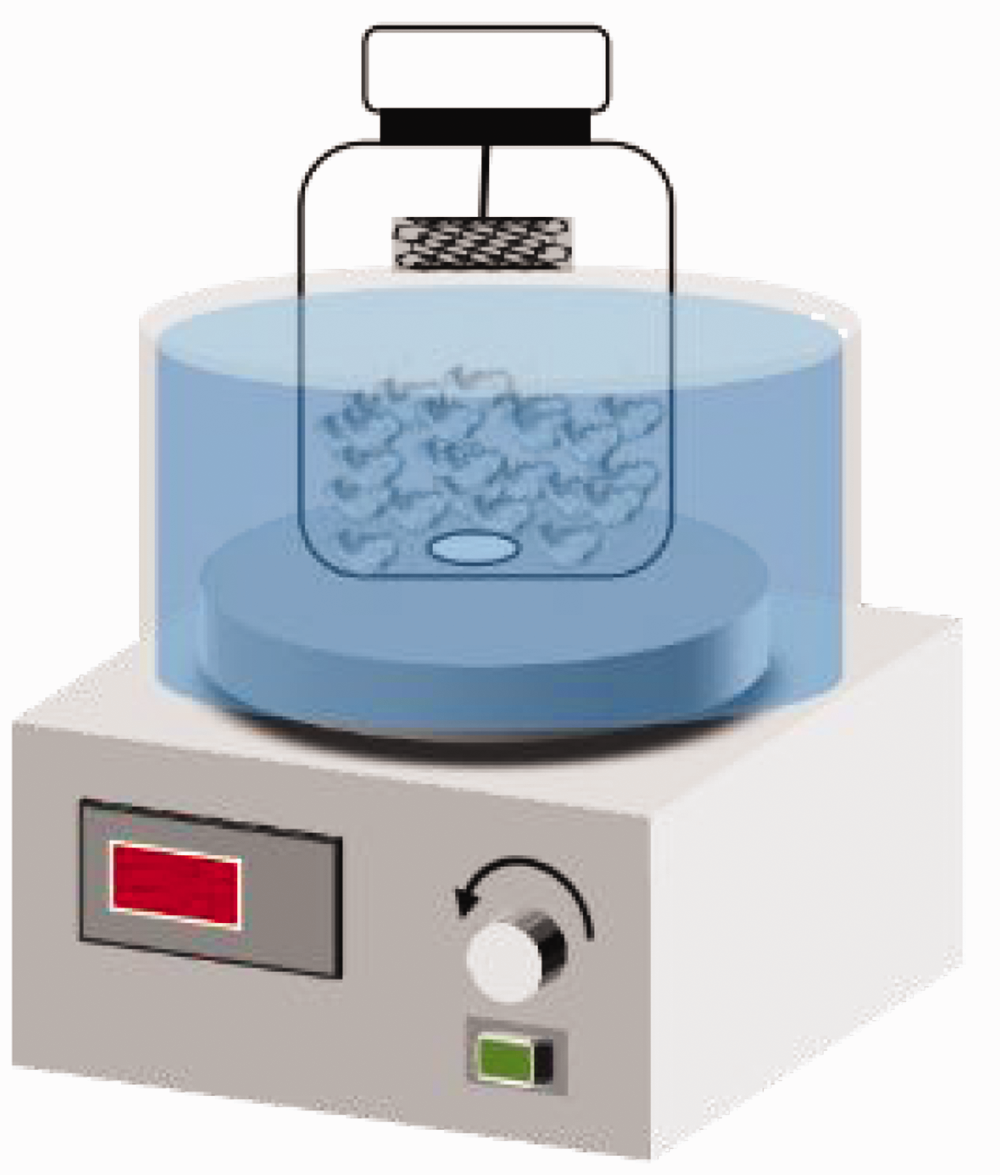
Static adsorption unit.
Method of impregnation and extraction of down odor substances
A quantity of 5 g of down was placed in a 250 ml conical flask, then 100 ml of methanol with 0.5 mg of the internal standard was added, sealed, and then shaken by ultrasonic vibration for 30 min. After cooling, we removed 1 ml of the extraction solution. This was followed by GC-MS analysis.
Chromatography and mass spectrometry conditions
The column type used was chosen as HP-5MS (30 m ×0.25 mm × 0.25 µm); GC-MS analysis of the obtained samples was carried out using helium as a carrier gas at a flow rate of 1.0 ml/min. The study used a standard electron bombardment ionization (EI) source. The mode was SCAN. The injection volume was 2 µl, with no shunt injection. After the column was kept at 50°C for 1 min, it was programmed as 280°C at 15°C/min and kept at this temperature for 3 min. The inlet temperature was set to 280°C, and the interface temperature to 300°C.
Results and discussion
The selection of down odors represents compounds
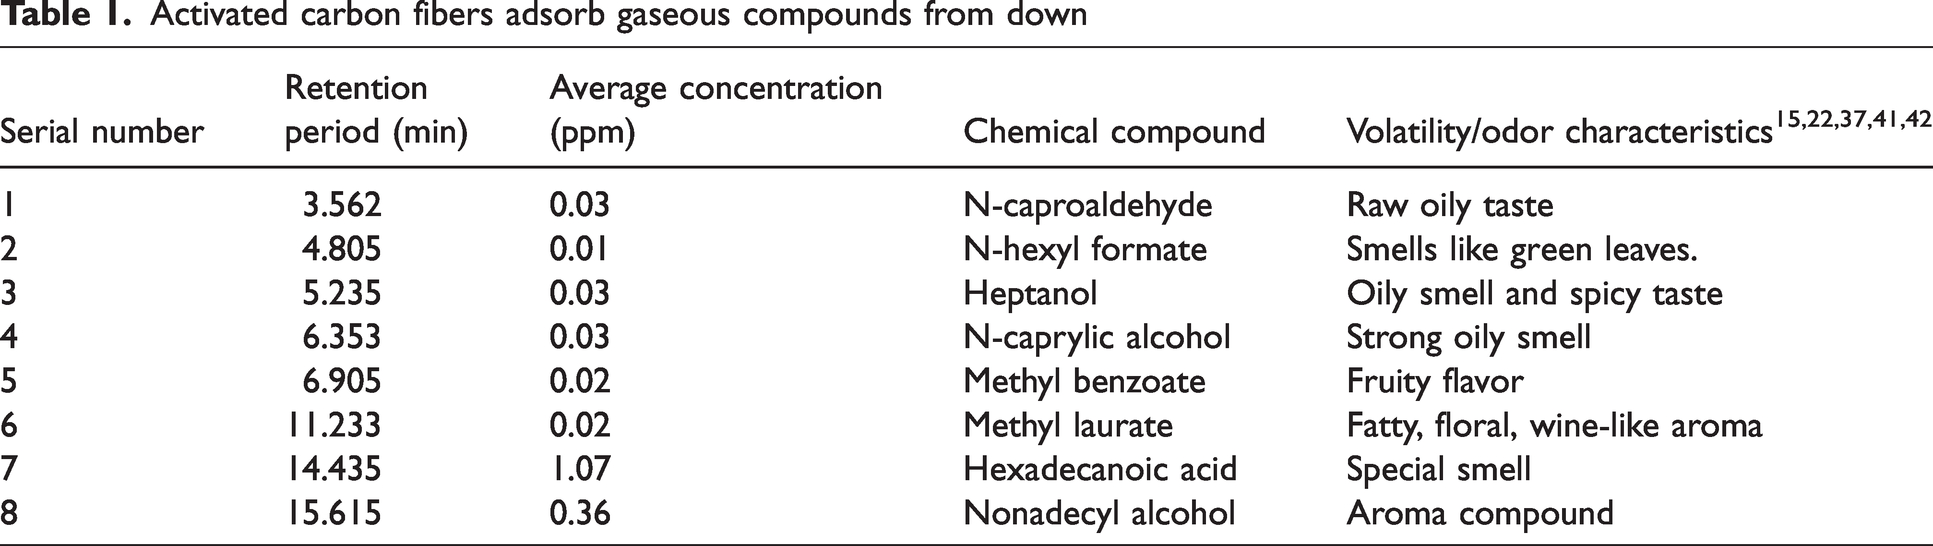
Activated carbon fiber adsorbed to the volatile odor substances can be perceived by the human sense of smell. Multiple measurements found five odor compounds that could be consistently detected: n-caproaldehyde, heptanol, n-caprylic alcohol, hexadecanoic acid, and nonadecyl alcohol. These components were analyzed in different down varieties and batches, with high content and distinct odor characteristics, making them easy for human olfactory perception. In addition to alcohols, aldehydes, and carboxylic acids, various ester compounds were also identified in static adsorption experiments, such as hexyl formate, methyl benzoate, and methyl dodecanoate. Esters are less volatile than alcohols, therefore they are adsorbed less by the activated carbon fibers, which results in the low numbers of esters found in this experiment. This also suggests that the number of esters sensed by the human body’s senses is quite modest. Additionally, despite typically having an aromatic scent, their odor is not as stimulating as that of alcohols and carboxylic acids.17,19,23,43 Therefore, we selected n-caproaldehyde, heptanol, n-caprylic alcohol, hexadecanoic acid, and nonadecyl alcohol as the representative compounds to characterize the odor of down. The odor characteristics of the volatile compounds are shown in Table 1.
Activated carbon fibers adsorb gaseous compounds from down
Selection of extraction method
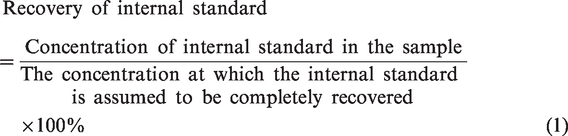
According to the test results, the target objects cannot be found using the dynamic adsorption approach. Only the impurities of activated carbon fibers can be found using the dynamic adsorption approach. The reproducibility of the static adsorption method is good, but the recovery rate is poor and falls short of the desired range. The findings of the GC-MS analysis demonstrated that the dynamic adsorption method did not exhibit the internal standard’s peak of n-hexanol at or near the four-minute retention duration. The internal standard is quickly desorbed after adsorption, resulting in very low content of the internal standard on the activated carbon fiber in the end. The adsorption and desorption speeds of the activated carbon fibers are fast, and when in the space state of gas flow, their speeds are large.9,34,40,44 Additionally, the internal standard will be depleted during the removal of the activated carbon fibers from the glass tube and subsequent placement in the methanol solution for extraction. Due to these two conditions, the internal standard’s low content was adsorbed and was not picked up by the GC-MS. Thus, volatile components that may be present on the down, such as esters, ketones, carboxylic acids, ethers, etc. were not found. It can be demonstrated that this dynamic adsorption method is not appropriate for the adsorption study of down odor. The static adsorption method could adsorb the VOCs from the down with good reproducibility. Calculated by the formula of the recovery rate of internal standard, the recovery rate of internal standard of static adsorption method was only 32%, which was low. See formula (1) for the inner recovery rate.
The reason for the static adsorption method’s low adsorption amount is that once the adsorption equilibrium is reached, it is difficult for organic molecules to realize the transfer of high concentration to a particular phase. This is because the adsorption resolution of odor organic molecules between down and carbon fibers by gaseous transfer reaches equilibrium. According to GB/T 27404-2008, the static adsorption method is unable to recover materials at a rate of 95–105%. As a result, the static adsorption method of down odor is not appropriate.
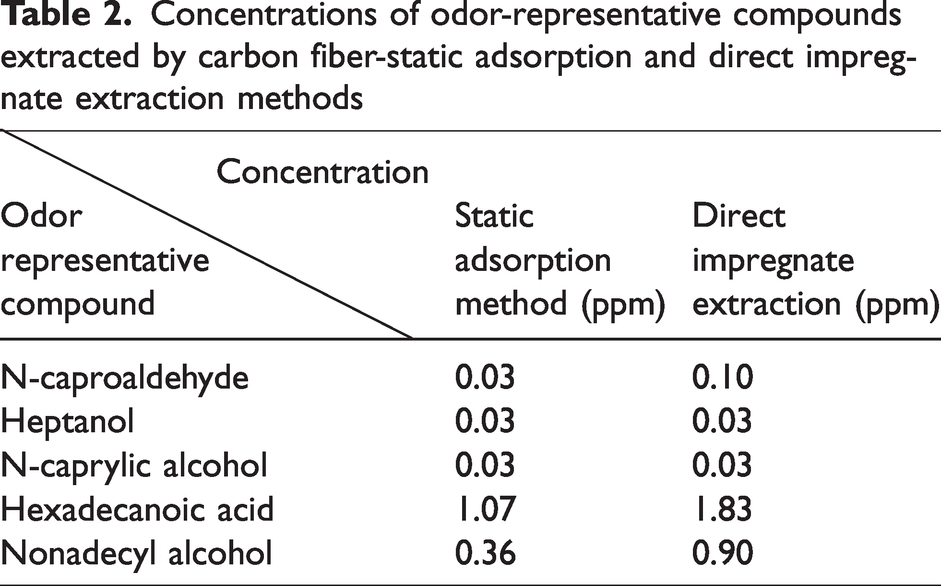
The chromatogram of the direct impregnate extraction has more chromatographic peaks than those of dynamic adsorption or static adsorption, as the peak height can be clearly seen. Direct impregnate extraction, taking advantage of the difference in solubility of solutes in solvents, extracts the solute from a solution with one solvent. Direct impregnate extraction provides sufficient extraction of compounds from down in a short period. Table 2 compares the concentration of odor-representative compounds extracted by the down direct impregnate extraction and down carbon fiber static adsorption methods. It can be seen from the comparison that the concentration of odor-representative compounds extracted by direct impregnate extraction is higher when methanol is used as the extraction solvent, which can reflect the actual concentration of odor-representative compounds. To accurately express the odor grade of down, direct impregnate extraction was used to carry out follow-up experiments.
Concentrations of odor-representative compounds extracted by carbon fiber-static adsorption and direct impregnate extraction methods
Influence of down quantity on odor detection in direct impregnate extraction
To analyze the trend of the concentration of the representative compounds, the quantities of down were increased to 10 g and 15 g. The chromatogram was obtained by GC-MS analysis. The concentration of odor-representative compounds is given in Table 3.
Effect of down dosage on the concentration of odor-representative compounds
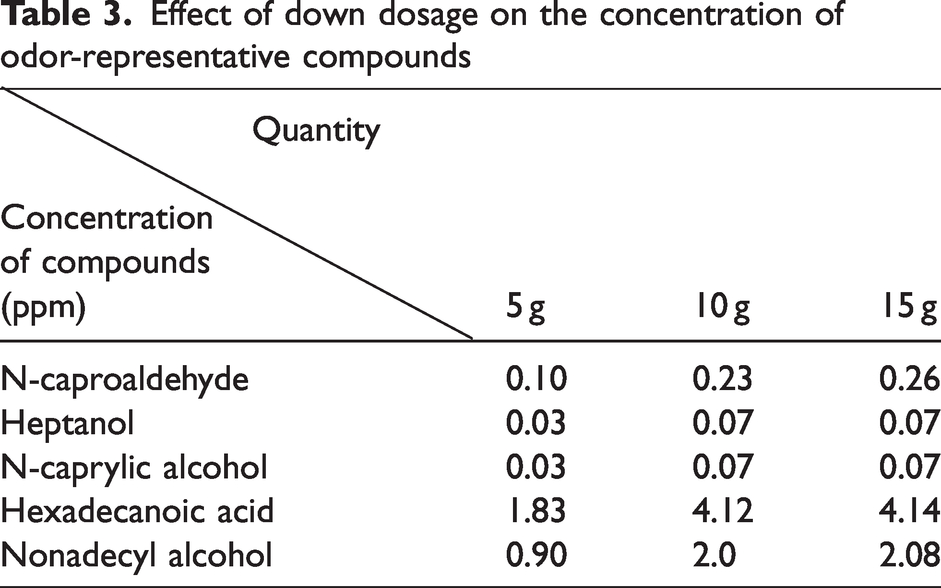
Chromatogram peak heights increased as the down quantity was increased. That is, more odorous chemicals were being extracted by 100 ml of methanol. The concentration of five scents reflects components multiplied with an increase in down quantity in the region of 5–10 g, according to quantitative analysis. The concentration of heptanol and n-caprylic alcohol did not change when the down quantity was increased to 15 g, and the concentration of the other three chemicals increased by less than 5%. This is due to the down’s light and bulky nature, which prevents it from being fully immersed when the down quantity is increased to 15 g. When the quantity of down reaches 10 g, the odor compounds in down can be fully extracted by the solvent to reach a saturated value. Therefore, in the down extraction experiment we selected a down dosage of 10 g.
Influence of extraction solvents on odor detection in direct impregnate extraction of down
Usually, the polarity of the extractant can have a great effect in the extraction efficiency of organic matter. In this experiment, different organic solvents were used to extract the down fiber, and the extraction efficiency of down odor compounds was studied.
While the other extraction conditions were unchanged, ethyl acetate and acetonitrile were selected as solvents to compare the extraction effect with methanol. The experimental results are shown in Table 4.
Effect of extraction solvent on the concentration of odor-representative compounds
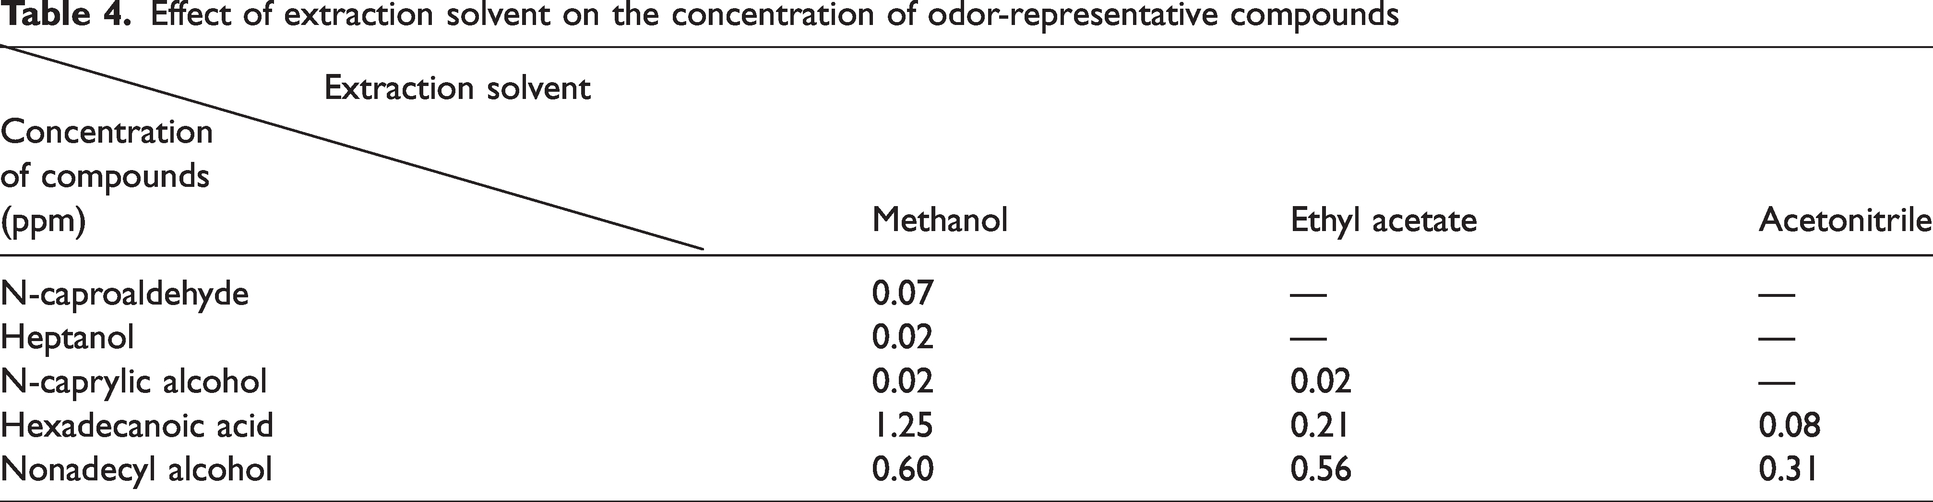
The test results shown in Table 4 demonstrate that when various solvents were employed to extract the down, there was an obvious difference in the odor components found. The types and quantities of target odor compounds tested are significantly different Due to the different polarities of extraction solvents, their solubility in various target compounds changes.8,45,46 The down-odor chemicals extracted by ethyl acetate were mostly esters, alcohols, and ethers, such as ethyl 2-hydroxybutyrate, ethyl propionate, n-butyl formate, 1,5-pentanediol, and n-butyl ether. Acetonitrile extracts predominantly amides and cyclohexanes, such as acetamide and n-dodecylcyclohexane. Ethyl acetate only extracted n-caprylic alcohol, hexadecanoic acid, and nonadecyl alcohol. Acetonitrile only extracted hexadecanoic acid and nonadecyl alcohol. Methanol was chosen as the extractant because neither acetonitrile nor ethyl acetate can fully detect the five representative substances.
Establishment of a digital visualization method for down feather odor level
Establishment of a digital-visual odor grading methodology
The down with different odor concentrations were ranked from 1–5 based on the intensity of the odor, as the standard representing different odor intensities. The relationship between the intensity of down odor and olfactory discrimination evaluation is shown in Table 5. One of the quality indicators for down is the odor requirement of a value <3, which means that down garments are allowed to have a slight odor from the filler down.3,5,6
Relationship between odor intensity and somatosensory
The five odor levels of down mentioned above were extracted by direct impregnate extraction, then subjected to GC-MS analysis (five standard-level samples were provided by third-party testing agencies).
Figure 5 shows the chromatograms of down of different odor levels. The red markers in the figure are the characteristic peaks of the internal standard. In Figure 5, the yellow marker 1 is n-caproaldehyde, marker 2 is heptanol, marker 3 is n-caprylic alcohol, marker 4 is hexadecanoic acid, and marker 5 is nonadecyl alcohol. The horizontal coordinates of the figure represent the time in the process of extracting odorants. The smaller the horizontal value of the characteristic peak, the stronger the volatility of the substance, and the easier the substance is perceived by the human olfactory organ. Substances with a retention time of 18 min or more are less volatile and are not easily perceived by the human body, so they were not examined as down odors. The other characteristic peaks in Figure 5 are known to be odorless substances based on the olfactory analysis of the substances (the results of olfactory analysis are shown in Table 1). Based on Figure 5, it can be seen that the greater the odor rating of the down, the higher its chromatographic peaks, i.e. the greater the concentration of odor compounds. The chromatograms were analyzed qualitatively, then the concentrations of the five odor-representative compounds were calculated according to the internal standard method, averaging three sets of parallel experiments. Finally, a radar chart characterizing the relationship between odor intensity and concentration of odor compounds was obtained. As shown in Figure 6, from the center point of the radar chart, five axes are shot out at equal angular intervals. Each axis represents a concentration of odorant. The points on the axes are sequentially connected to form a geometric figure. The shape and area of the geometries represent the down odor levels. The odor representative substances were extracted from down of different odor levels 1–5, and the five representative substances were multiplied by the corresponding multiples in the radar chart to obtain a standard radar chart of the odor levels. Note that because of the small concentration of the odor extracts, a magnification method was used for ease of observation. For the down of unknown odor grade, the odor grade can be determined by extracting the odor substances, substituting the concentrations into the standard radar chart, and comparing the geometric areas.
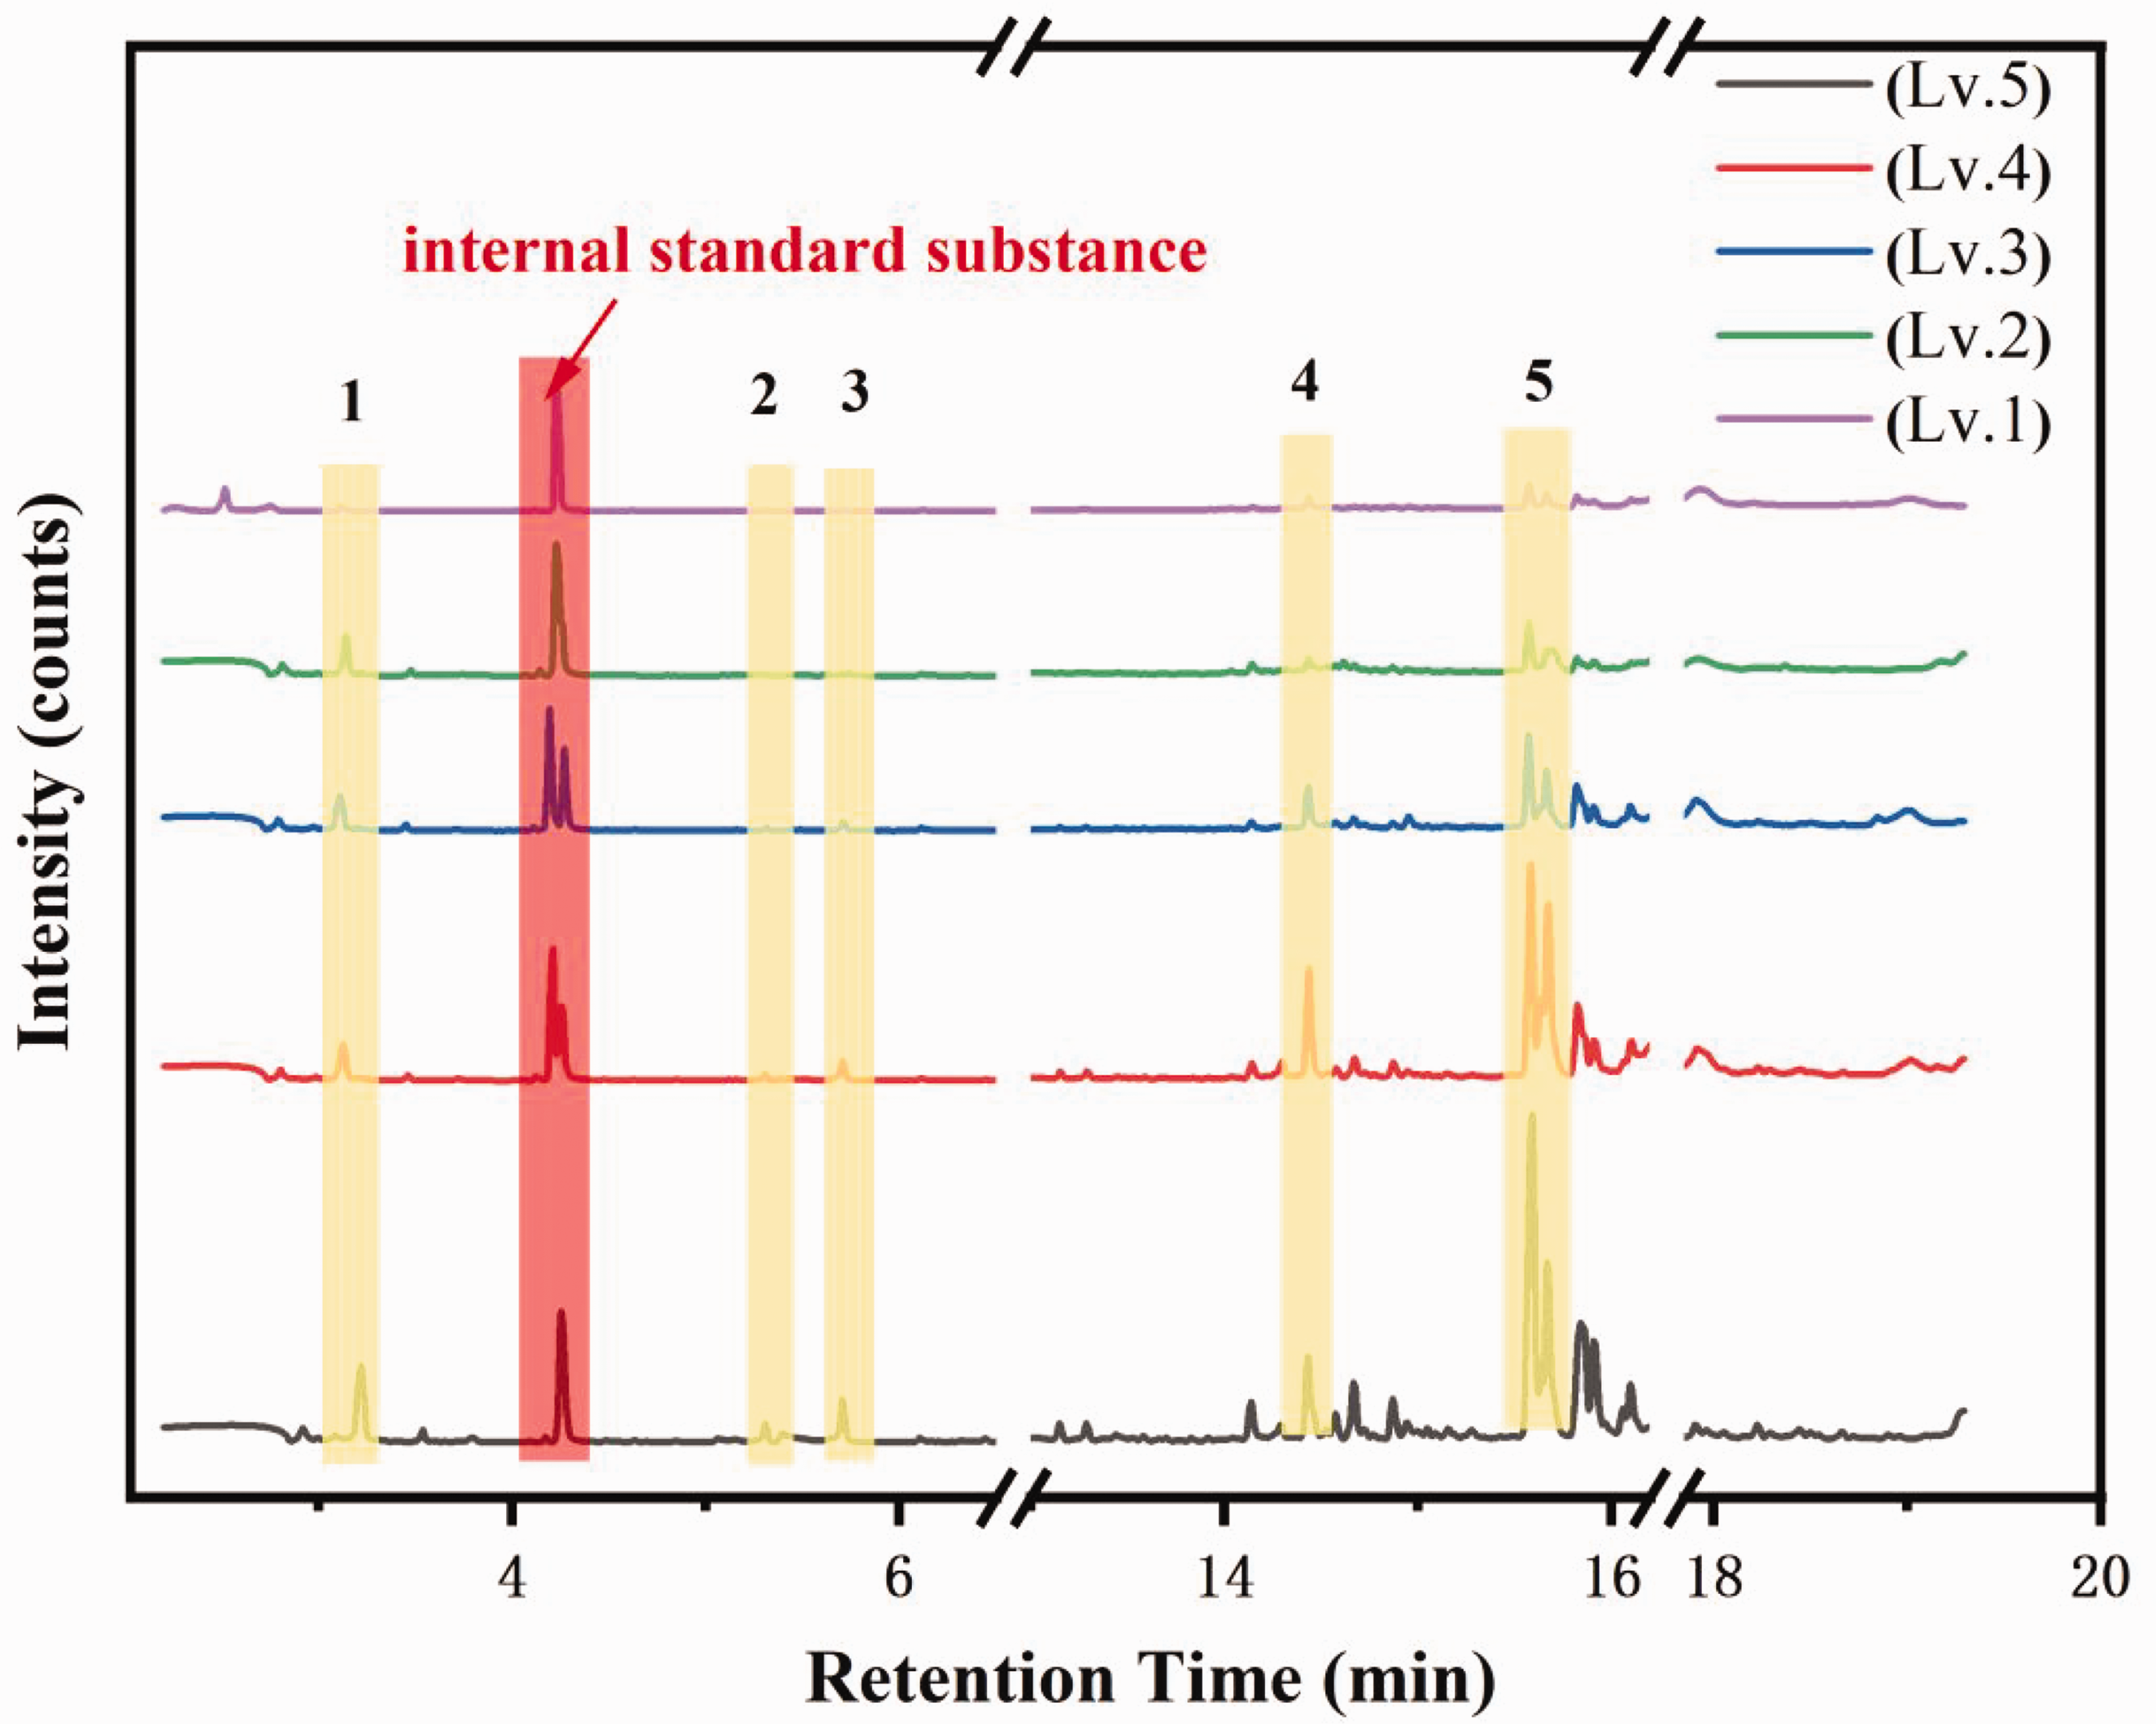
Chromatograms of down of different odor levels. Lv: level.
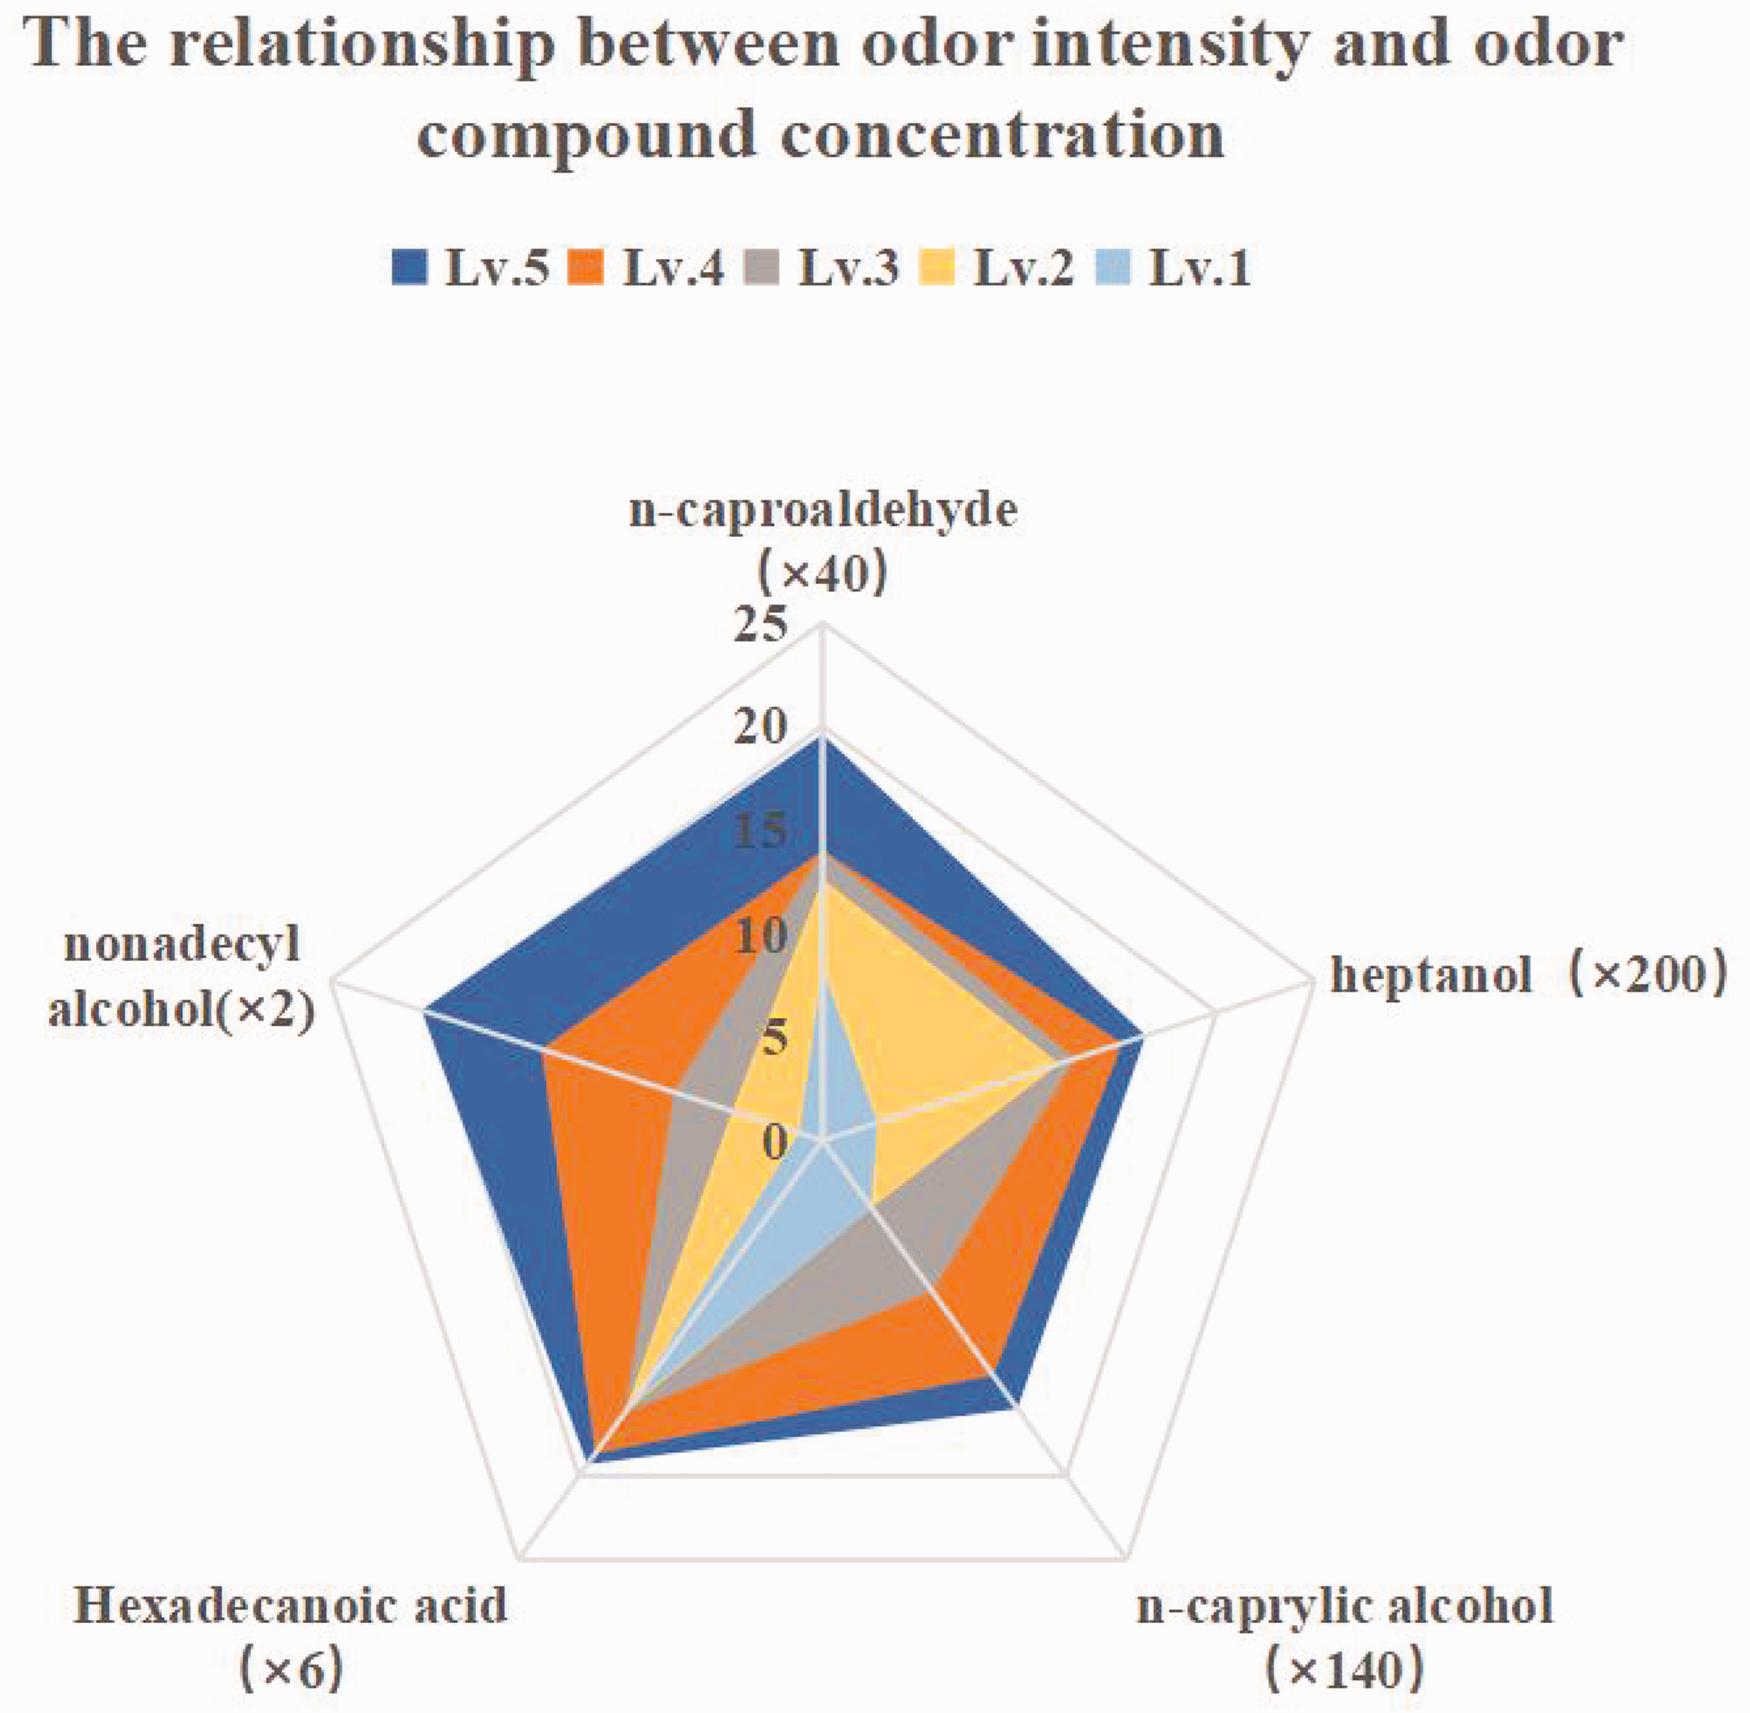
Plot of odor intensity vs concentration of odor compounds. Lv: level. Concentrations of odor compounds are magnified for clarity of expression, with magnification in parentheses.
Looking at the area occupied by the odor concentrations from down of different odor levels in Figure 6, it can be seen that the area occupied by the concentrations of the five representative compounds increases as the odor level of the down increases. This law is consistent with theoretical studies.25,47 To exclude the effect of error, this experiment carried out three parallel experiments on the same batch of down to take the average value, which ensures the objectivity of the radar chart.
In summary, the direct impregnate extraction can be used to detect the down of unknown odor class. The operation of the direct impregnate extraction is to add 10 g down (down should be broken into fine filaments) into 100 ml methanol solution containing 0.5 ml internal standard, ultrasonic oscillation extraction for 30 min, and then take 1 ml of the extraction solution for GC-MS analysis. Calculate the concentration of the five odor-representative compounds listed above and substitute into Figure 6. The odor level of down can be quickly judged by observing the area and position of the image after substituting, thus realizing the visual evaluation of down odor.
The formula for calculating the concentration of unknown compounds is as follows.

Validation of methodological feasibility
To more intuitively show the advantages between the digital-visual evaluation and the human olfactory methods, this project selected the most-used down samples in the company and used a radar chart to further illustrate the odor level of down. The raw material of down was provided by Shanghai Donglong Down Products Co. Ltd. The down materials were the Australian white duck down for 2021, the Australian white duck down for 2023, the Cherry Valley white duck down, and the Guangxi white duck down. The down samples of each specification were split into the same two sections, one of which was evaluated using the human olfactory method and the other using the digital-visual evaluation method. Here we give the evaluation findings for the two approaches. To increase the experimental accuracy, five samples were randomly selected from each of the four batches of down and five repetitions of the experiment were carried out.
As can be seen from Table 6, the digital-visual evaluation and the human olfactory methods have similar evaluation results. However, the digital-visual evaluation method is more accurate. The concentration of each odor representative can be intuitively seen from a digital-visual evaluation radar chart, so the difference between different down odors can be judged. Four different odor levels of down were evaluated using the human olfactory method, and the results were all level 2. The evaluation with the human olfactory method does not provide any further explanation of odor characteristics, indicating that this method cannot further distinguish the odor differences of down under the same odor level in four samples of this experiment. 16
Comparison of digital-visual evaluation and odor level results of the International Down and Feather Bureau (IDFB) human olfactory method

Human olfactory analysis test results are provided by the third-party testing organization. Down odor level <3 is considered acceptable.
It is pleasing that the digital-visual evaluation method can determine the intensity of down odor at the same level and the concentration of odorants can be visualized from the digital-visual evaluation radar chart. As can be seen in Figure 7(a) and (b), although the results of the odor evaluation of the Australian white duck down from two different times are both passes, it is clear that the sample for 2021 smells more than the sample for 2023. It can be visualized that the n-caprylic alcohol and nonadecyl alcohol content increased significantly with time. This shows that storage time affects down odor. This method can provide a reference for enterprises to further study the quality of down. In Figure 7(a), the n-caprylic alcohol and Hexadecanoic acid content of the Australian white duck down for 2021 exceeds level 2 but does not reach level 3, so it is determined that the odor level of the Australian white duck down for 2021 is level 3–. Besides, in Figure 7(d), the n-caprylic alcohol content of Guangxi white duck down exceeded level 2 but did not reach level 3, besides, the content of other substances did not exceed level 2. The method of digital-visual evaluation showed that the odor level of Guangxi white duck down was level 2+. The radar chart shows that, although all four types of down are level 2, the Australian white duck down for 2021 has the strongest odor, followed by the Guangxi white duck down, and the Australian white duck down for 2023 has the lightest odor. According to the composition of various odor components, researchers can further examine the distinction between the same odor level and different odor levels. According to the radar chart, the extremely light odor of Guangxi white duck down is mostly that of grease, while the odor of Australian white duck down for 2023 is primarily of alcohol and acid. As a result, the digital-visual evaluation method is more precise and impartial, and it may serve as a guide for the business as it investigates the down odor further. Besides, the digital-visual analysis method requires only 2 h for the whole process from the extraction of odor compounds to the comprehensive evaluation of odor levels by radar chart, which greatly saves time and cost compared with the human olfactory method. Four batches of down have initially proved the feasibility of the digital visual evaluation method, which will be further improved by using different types of down materials in the production process.
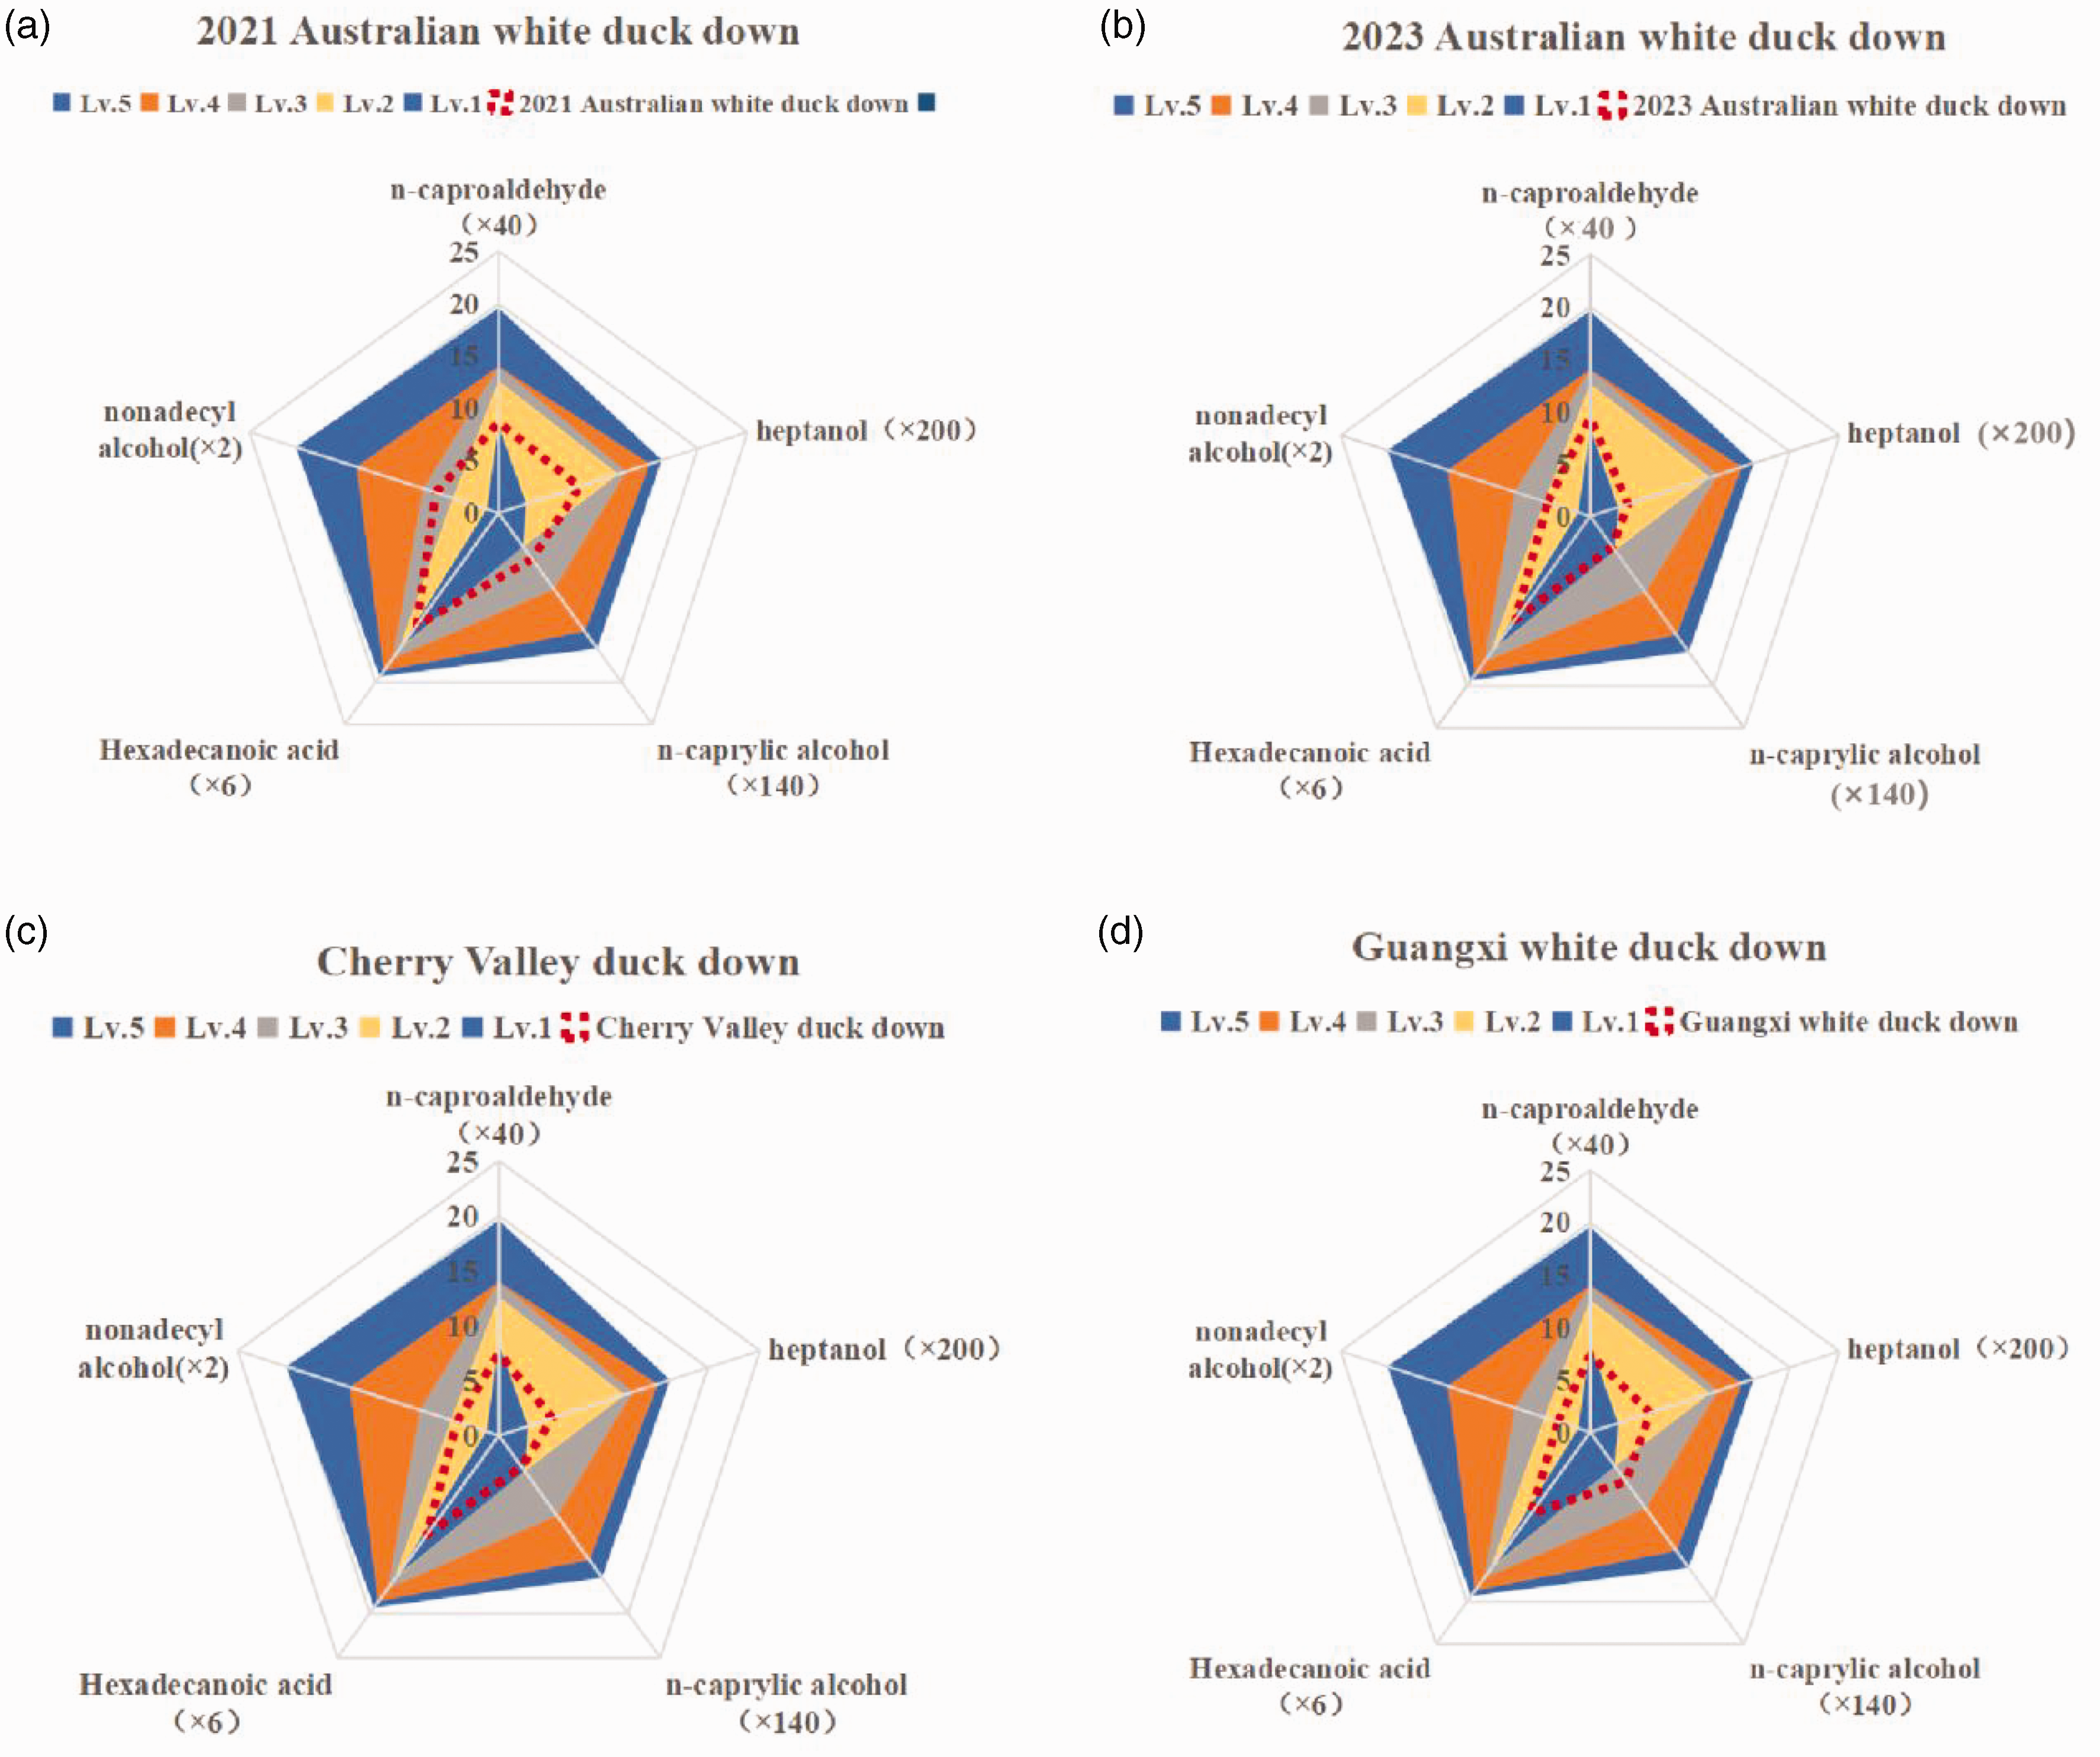
Different varieties of down digital-visual evaluation radar chart: (a) odor radar chart of Australian white duck for 2021; (b) odor radar chart of Australian white duck down for 2023; (c) odor chart Cherry Valley white duck down and (d) odor radar chart map of white duck down in Guangxi.
Conclusion
The compounds that stimulate the human olfactory organs are small molecules that are easily volatilized. In this article, the activated carbon fiber gas phase collection was used to find the five odor compounds that can be stably collected and have the highest concentration in down fibers as the representative compounds of down odor. These five compounds are: n-caproaldehyde, heptanol, n-caprylic alcohol, hexadecanoic acid, and nonadecyl alcohol. Experiments showed that the recovery of the activated carbon fiber gas-phase collection method was too low and the five representative compounds were not collected completely. Finally, direct impregnate extraction was used to fully extract the five odor-representative compounds. The exact concentrations of the odor-representative compounds in down fibers were obtained. Down fibers of known odor levels were extracted and the concentrations of the odor-representative compounds in these downs were calculated. A radar chart of the odor evaluation criteria was plotted in terms of the coordinates of the odor-representative compounds versus the odor levels. A digital-visual evaluation method was finally developed, which combines direct impregnate extraction with radar charts to evaluate the odor level based on the concentration of the down odor representative compounds. Four batches of down with unknown odor grades were tested using the digital-visual judging method to validate the constructed method. The detection results were all the same as the human olfactory method, and all of them were qualified. The digital-visual evaluation results could show the odor differences and odor characteristics of different batches of down according to the area and shape of the radar chart. The results showed that the digital visualization evaluation method can be better applied to the identification of down odor levels. Compared with human olfactory evaluation, the digital visual evaluation technique developed in this study is more accurate and objective, and it saves a significant amount of time. This method effectively reduces the subjectivity of manual evaluation of down odor levels and is expected to be promoted and applied in the industrial field.
Footnotes
Declaration of conflicting interests
The author(s) declared no potential conflicts of interest with respect to the research, authorship, and/or publication of this article.
Funding
The author(s) received no financial support for the research, authorship, and/or publication of this article.
