



Abstract
In many processes and applications, the performance of textiles relies heavily on fluid transport; for example, the in-plane distribution of water and the through-plane permeation of water vapor and air. Prediction of knitted fabrics’ effective transport characteristics can enhance development workflows and bring them to new applications. Effective transport parameters that are particularly important are the permeability and diffusive mass transfer. Usually, experiments are used to determine these parameters. It is desirable to conduct a thorough investigation into how yarn structure and knitting gauge influence these properties to tailor knitted fabrics for a particular application. Our contribution in this context describes a consistent workflow to forecast the effective mass transfer characteristics of single jersey fabrics. Single jersey fabrics have been chosen for they are the simplest patterning, and are widely used in body-near worn garments. The proposed approach involves visualizing fabric samples with a light microscope, and subsequently determining relevant geometric parameters through automated image processing algorithms. With these parameters in hand, a representative elementary volume of the fabric is constructed. The yarn is modeled as an effective medium to reduce calculation time. The representative elementary volume is then used for numerical predictions of air permeability and the diffusive water vapor transport. The predicted through-plane gas transport properties are compared with experimental data to validate the approach. Six different single jersey polyester fabrics were analyzed, with different yarn structures and machine gauges. The comparison shows a good agreement between simulated and measured transport properties.
Textiles provide differentiated fluid transport in numerous technical and non-technical applications. The functionality and performance in applications of textiles can often be reduced on the efficiency of gas transport occurring within them. Illustrative instances showcasing the significance of gas transport in textiles encompass a broad spectrum from garments to technical textiles. In garments, especially in sportswear, the removal of heat and sweat from the skin is a desired function. 1 In the context of wound dressing, in which the choice of textile material plays a crucial role in the wound healing process, it is essential to strike a balance between providing proper ventilation for the wound while preventing excessive drying out. 2 The same balance has to be maintained in fuel-cell applications. In the reactive layer the efficient removal of water, and simultaneously supplying gaseous hydrogen and oxygen, has to be secured. 3
Whereas for technical applications nonwoven fabrics are common, knitted fabrics for more than a century are for body-near worn garments. This results on the one hand in their nice hand feel and drapeability, but is mainly due to their good moisture transport properties, and the easy to adjust manufacturing process with knitting machines. In the technical knitting process, the structure of the material can easily be altered by the choice of yarn and the choice of the knitting parameters; for example, machine gauge or sinker depth.
In all applications the functionality of a fabric (besides the transport of liquid water) is determined by two key factors: the ability of the fabric to allow convective and diffuse transport. Not only for textiles, the single-phase (only gaseous) transport properties are only governed by the complex geometrical structure of the material. The geometrical structure of textiles can be interpreted as a hierarchical porous system with the scales of the fiber (microscale), the yarn (mesoscale), and patterning (macroscale). 4 Many publications correlate the through-plane transport properties with the porosity of the fabrics, which is mostly influenced by the macropores.5 –11
In order to compare textiles quantitatively, there are two properties which are well known and used widely both in the textile industry and academia. Air permeability
Both of the above-mentioned transport properties specify the transport properties perpendicular to the fabric plane, and significantly impact their overall performance. The units and specifications are very common for experts, but can be confusing for those who usually do not work with textiles on a daily basis. Scientific definitions such as permeability
Experimentally, a broad variety of knitted fabrics has been characterized towards air permeability and evaporative resistance. Nazir et al. 5 knitted combed cotton yarns on E18 and E20 double jersey knitting machines, and found that air permeability increases both with stitch length and gauge. Both parameters influenced fabric porosity in the same way. 5 Chakroun et al. 14 knitted patterns with different levels of tuck stitches in two colors and finishing. They concluded that tucks significantly decrease the air and vapor permeability. The same was concluded for different dyeing process. 14 Ivanovska et al. 15 examined how plating with elastane and the usage of softeners affect gas transport in single jersey fabrics. Both characteristics, air permeability and water vapor transport decreased with higher elastane and softener content. 15 Özkan and Baykal16,17 changed the texturization parameters of polyester intermingled yarns, namely the number of nips. It is not surprising that the air permeability significantly drops with the number of nibs, leading to more compact yarns.16,17 For woven fabrics made from wool, Dal et al. 18 stated that all thermal comfort properties (i.e. air permeability and water vapor resistance) rely heavily on the physical properties such as thickness, weight, porosity and structure. Atmaca et al. 19 found similar results for woven wool fabrics. Choudhary and Ramatran 20 determined the moisture management behavior of knitted fabrics made for activewear made of different texturized polyester yarns with and without the addition of elastane. It was found that air permeability decreases with texturization and plating with spandex. Among others, the characteristic of air permeability is associated with the porosity of the fabrics. 20 In general, experimental studies give a good insight into the qualitative behavior of textiles, but are often carried out on very specific fabric and material types.
To target the efficient development of specialized knitted textiles for certain applications, different attempts for predicting the transport properties of knitted structures were made in the literature, each having certain benefits and draw backs. The correlation of air permeability with loop parameters is well described in literature. Ielina et al. 21 gave a detailed model for the loop geometry of multifiber yarns to predict the air permeability. The model resolves the single fibers of the fabric structure and is therefore computationally expensive. In addition, it was not validated experimentally. Baghdadi et al. 22 follow a data-based approach and use a neural network for predicting the air permeability of finished stretched jersey fabrics. The authors used 14 samples for calculation and focussed on the change of the air permeability during the finishing process. The data-based approach lacks the deep understanding of the underlaying processes and the quality of the data, which is used as an input, and is rarely available for fabrics on the market. Siddiqui et al. 23 develop a computational fluid dynamics (CFD) model, which shows good agreement with experiments on polyester single jersey fabrics. In the work, the geometry is varied only by the stitch length in a small range. In addition, the origin of the yarn diameter for the computational model, which is critical for the macropores and accordingly for the air-permeability, is not clearly described. The group of Orgulata and colleagues24,25 developed a theoretical model, which calculates the air permeability of cotton fabrics by abstracting the single loop to a rectangular representative elementary volume (REV) with a cylindrical hole. In a subsequent publication the model was verified with CFD computations. In general, the publications lack the definition and origin of yarn diameter. Puszkarz and Krucińska 26 implement a geometrical model for double jersey fabrics with a monofilic and a very basic multifile yarn model. A slight difference in the simulation results between the two approaches for the yarn configurations was found. Fiber materials ranging from natural staple fibers to manmade-fibers were used, although they had errors from 4.1% to 20.3% compared with the experimental results.
The number of publications showcasing experimental and simulative approaches on determining transport properties of knitted fabrics underline the great interest and importance to predict the effective transport properties of fabrics. A model based on only their geometry, solely based on the yarn parameters and the knitting process, would facilitate an estimation of the performance of the fabric before it is even produced. Generally, many publications lack certain details or use certain parameters; for example, the yarn diameter for fitting. A straightforward workflow that is suitable both for scientists in the field of simulative heat and fluid transport and the more experimental driven textile domain could not be found. This publication intends to fill this gap and present a simple, straightforward workflow for the prediction of both, the air permeability
Those parameters are the wale and course spacing, the yarn linear density and fiber diameter, the effective yarn diameter in relaxed state, and the fiber count. In terms of computation capacity, it would be very costly to begin the modeling on the fiber scale, and conduct discrete simulation as structures cover three scales (µm to mm) and are very complex. Therefore, its most efficient to use an effective model to present the yarn's geometry based on the statistical distribution of the fibers in the yarn cross-section. For the yarn axis, a well-known mathematical description that discretizes the yarn path is available and can be implemented. The experimental validation of the presented model for the gas transport through knitted fabrics focuses the parameters loop geometry and yarn structure, which are crucial for the transport properties. The model uses only typically known and tested parameters of the yarn and fabric without any use of fitting factors. The workflow is documented in logical steps, and can easily be extended to more complex yarn and loop geometries.
The overall goal of this contribution is to predict the effective gas transport properties of single jersey knitted fabrics solely by easily accessible geometrical parameters of yarn and fabrics.
Materials and methods
In the following section the considered textiles, the experimental setup, and the simulative model of the presented workflow are described.
Sample production and preparation
To validate the simulative model, six single jersey fabrics were produced with different yarns. As the yarn has a major influence on the transport properties, monofilament, smooth multifilament, and texturized multifilament yarns were used. Although monofilament and smooth yarns are not commonly utilized in clothing applications, these materials are analyzed to expand the range of yarn porosity that can be examined. All yarns are made from polyester with a circular fiber diameter. The yarns have highly different porosities as shown in Figure 1.
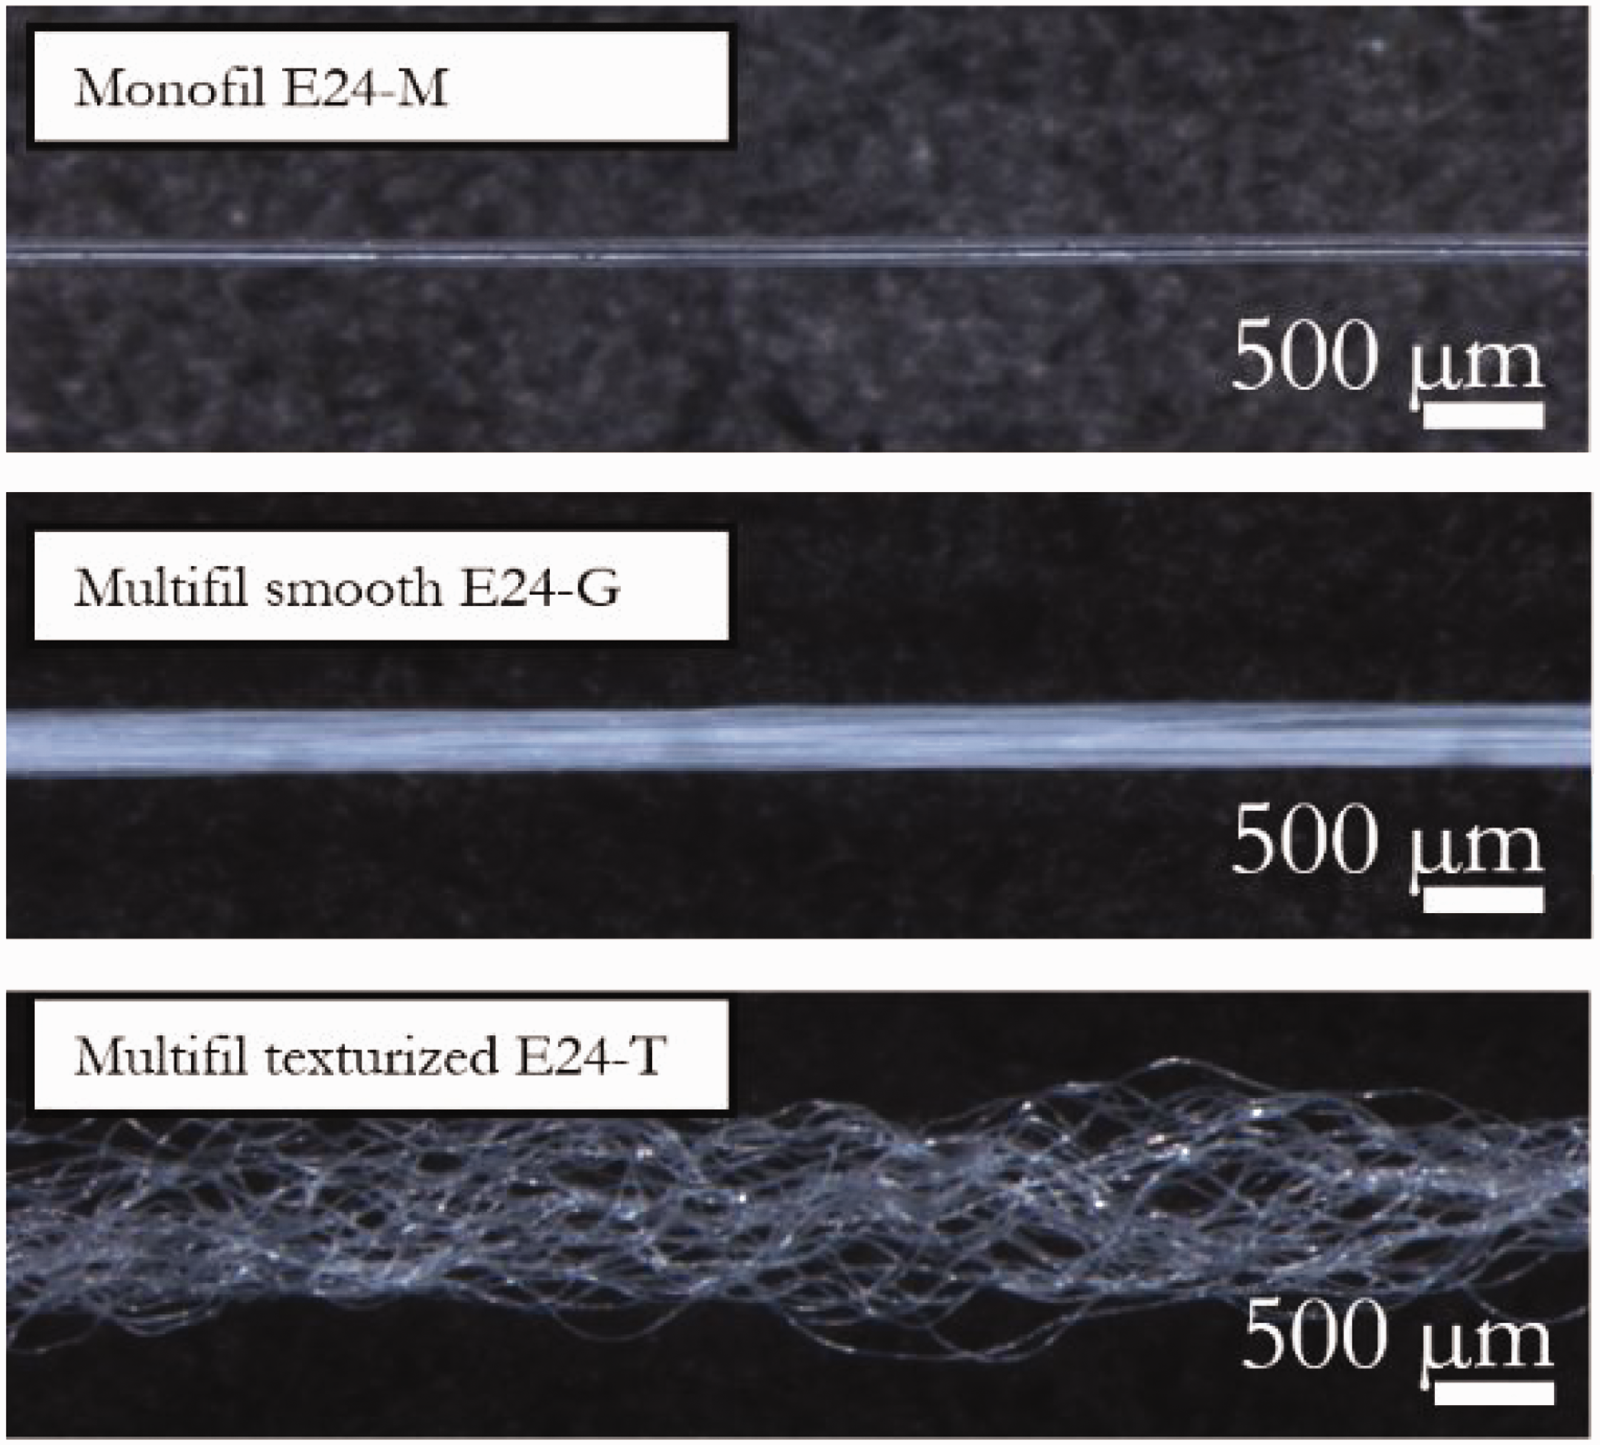
Structure of mono/multifilic polyester yarns used for knitted fabrics.
From the polyester yarns with different porosities, single jersey fabrics were produced on a flatbed knitting machine (gauge E14), and a circular knitting machine (gauge E24), resulting in six different fabric types. After knitting, the fabrics were washed with IEC 63456 reference base detergent in a fine wash program at 30°C and air dried. Other chemical treatments than the washing have not been applied. Microscopic images of the six fabric samples are shown in Figure 2.
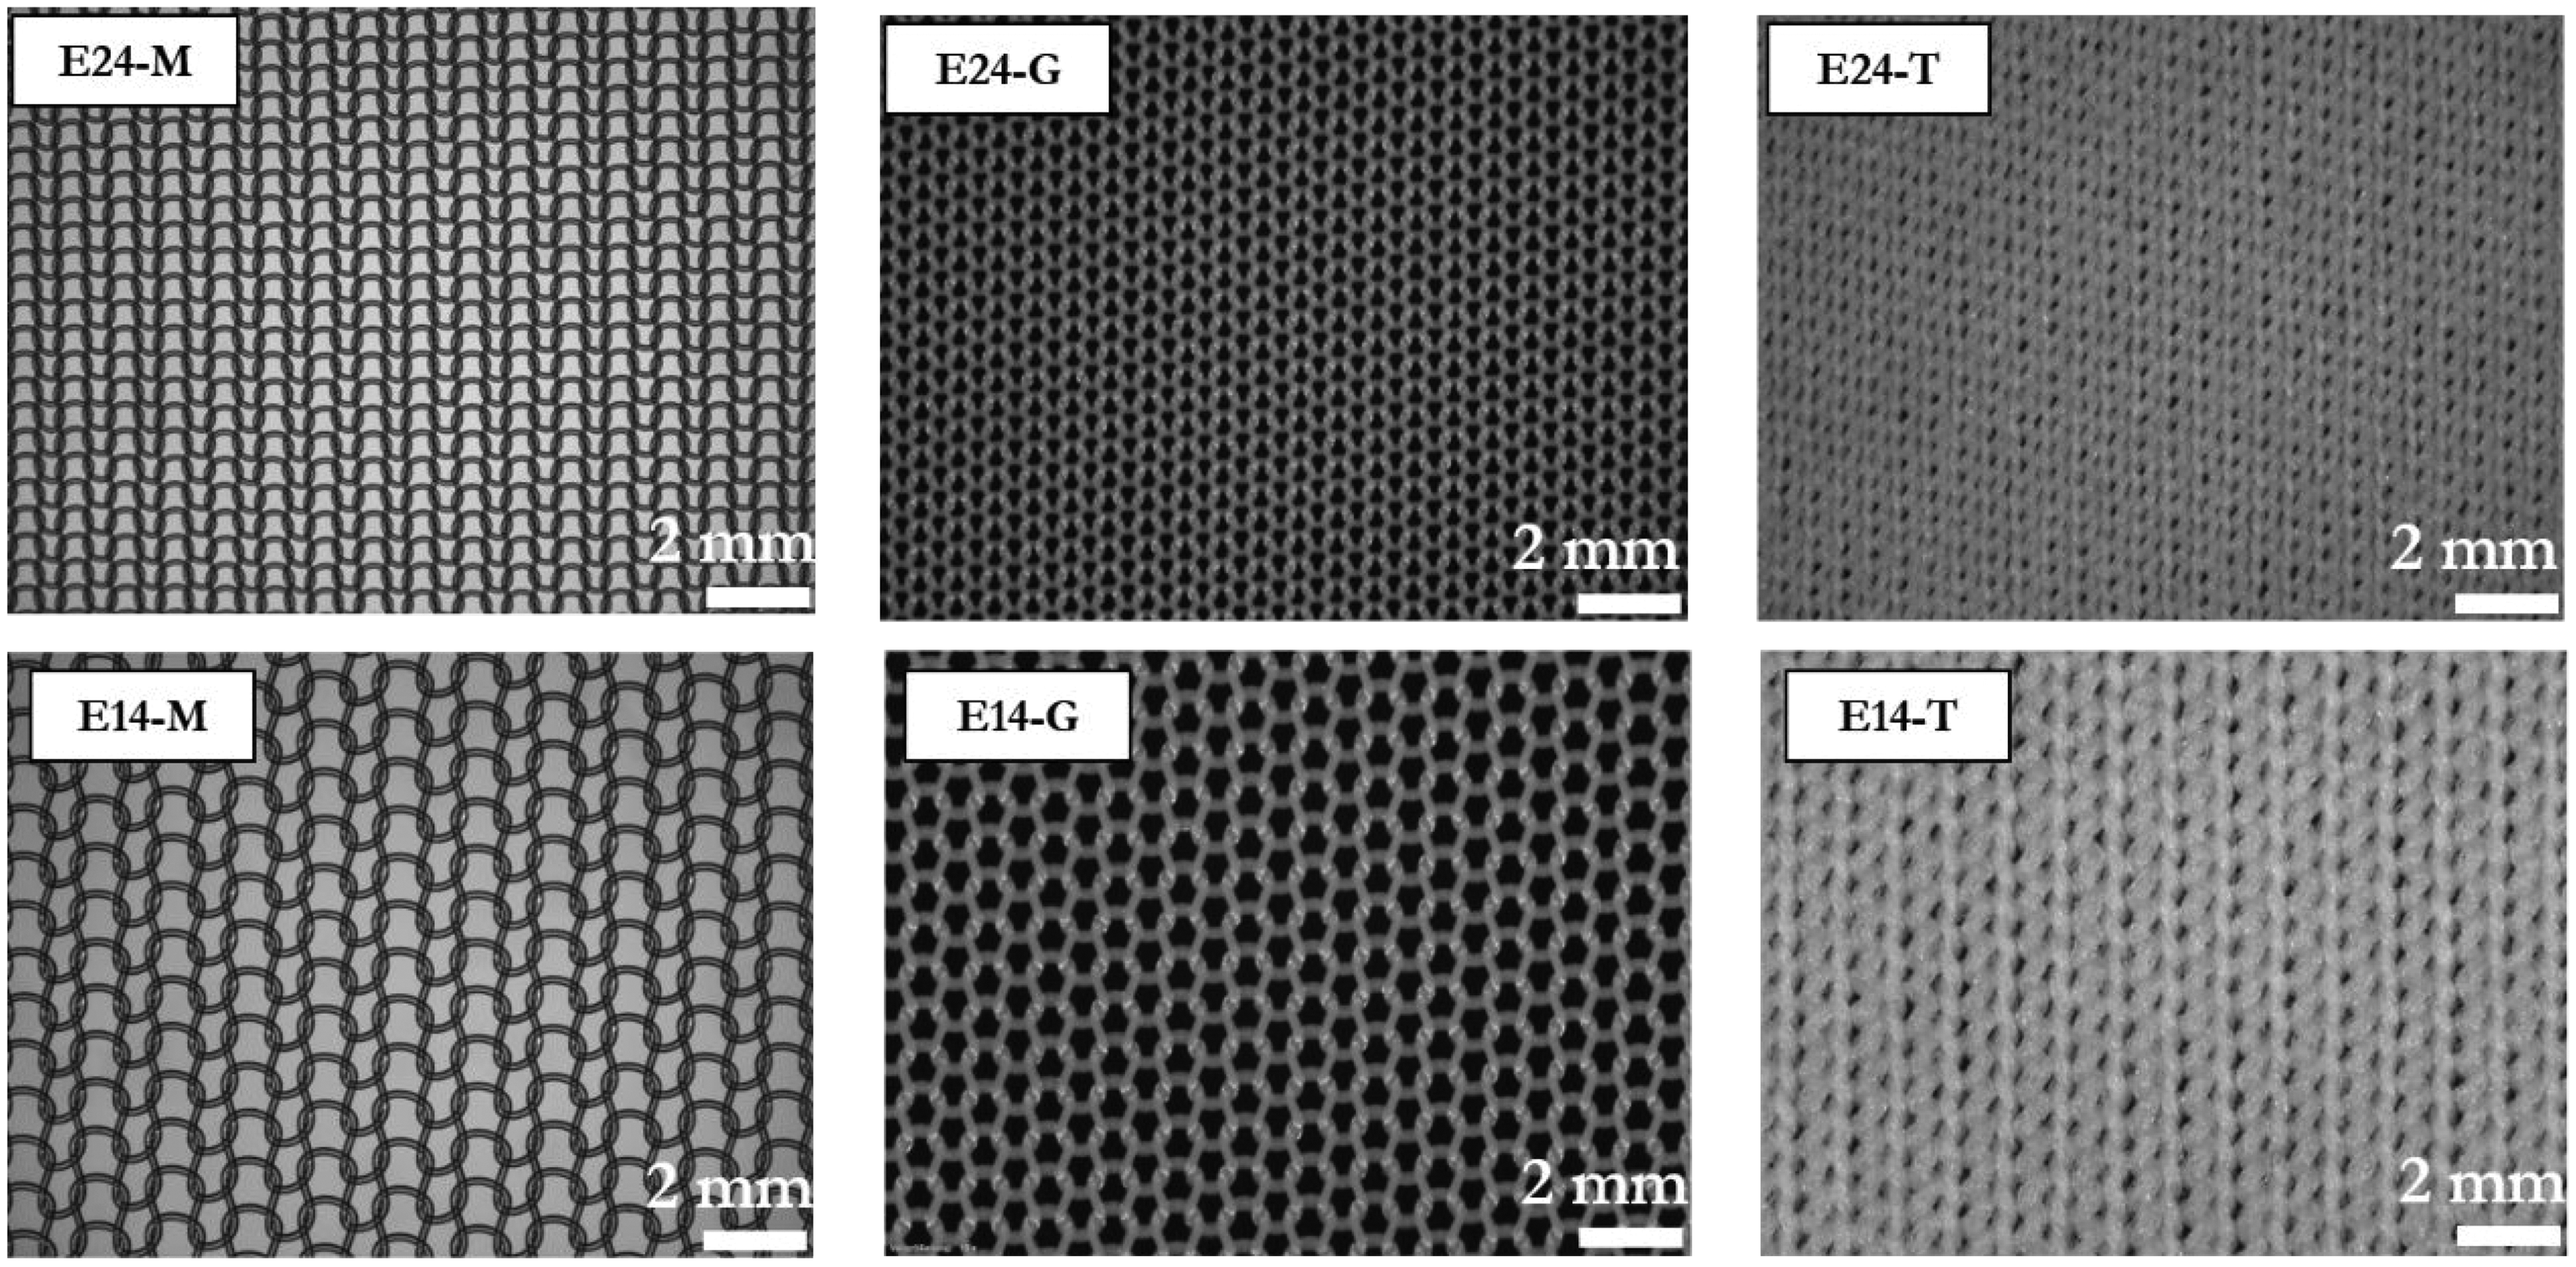
Overview on knitted fabrics for validation of the predictive model.
As knitted fabrics are elastic, the geometry of the single loop changes with the tension of the fabric. In order to have a reproductive loop geometry and prevent the edges of the fabric from rolling fabrics have been prepared on specimen holders. The preparation process was carried out for the six different fabric types and is shown in Figure 3. The knitted fabrics were put on a device in which they can be put under defined tension. Fabric is fixed on moveable needle bars (see arrows in Figure 3) and put under tension of 10 N/m as proposed in EN ISO 13934-1 for elastic fabrics. After stretching, samples were fixed on a metallic specimen holder with hotmelt and cut out.

Preparation process of fabric specimen for experiments a) Fixation on stretching device b) Fixation on specimen carrier c) Imaging positions.
For every fabric sample, five specimens were prepared for the experimental determination of air permeability and evaporative resistance. For geometry analysis, from each fabric specimen five images have been acquired on different locations in the middle of the specimen (see Figure 3(c)), which results in 25 images per fabric type for geometry analysis. In the workflow, all experiments have been performed on the textile fabrics under constant strain on the specimen carriers, resulting in constant loop geometry for every step of the geometry and flow analysis.
Experimental determination of the air permeability and evaporative resistance
Experiments were conducted in constant climate with 23°C and 50% relative humidity (RH). Specimens have been conditioned a minimum of 48 hours before the conduction of the experiments.
Air permeability
The air permeability was determined on the device Textest FX 3300 according to DIN EN ISO 9237:1995-12. In the experiment the fabric was exposed to a predefined pressure gradient, and the resulting air flow was measured. The direction of the fabric and its relaxation state usually influence the measure. In the experiments a reduced pressure difference

Experimental setup for measurement of air permeability: Textest FX 3300 device and schematic diagram of the experiment.
According to the manual, the certainty of the device is 3%. The air velocity

The air permeability

Evaporative resistance
The evaporative resistance

Experimental setup for measurement of evaporative resistance. (a) PERMETEST device; (b) detail of the measuring head; (c) schematic diagram of the air channel and (d) profile of measurement head.
The PERMETEST instrument calculates the water vapour permeability of the textile sample from the area specific heat loss of the wet surface in the measurement head with textile cover

The PERMETEST instrument is mostly used to measure thermophysiological characteristics for fabrics used for garments worn next to the skin, and is widely used in academia and industry. The advantage of the instrument is the simplicity of the device, and the fast measurement process compared with a sweating guarded hotplate or a thermal manikin.27,28 The disadvantage is that the measurement can rely on the surface roughness of the textile, 29 and on the ambient conditions.
Numerical prediction of the air permeability and evaporative resistance
Geometry of knitted fabrics and general modeling
Generally, knitted fabrics consist of yarn which is formed to a loop. For single jersey fabrics the main geometric parameters are the wale spacing and the course spacing. A sketch of a single jersey loop is shown in Figure 6. The yarn itself consists of more or less aligned fibers. To deal with the complex, statistical structure of fibers forming a yarn, it is the simplest approach to abstract the yarn to a spline with a round cross-section. The only parameter is then the yarn diameter
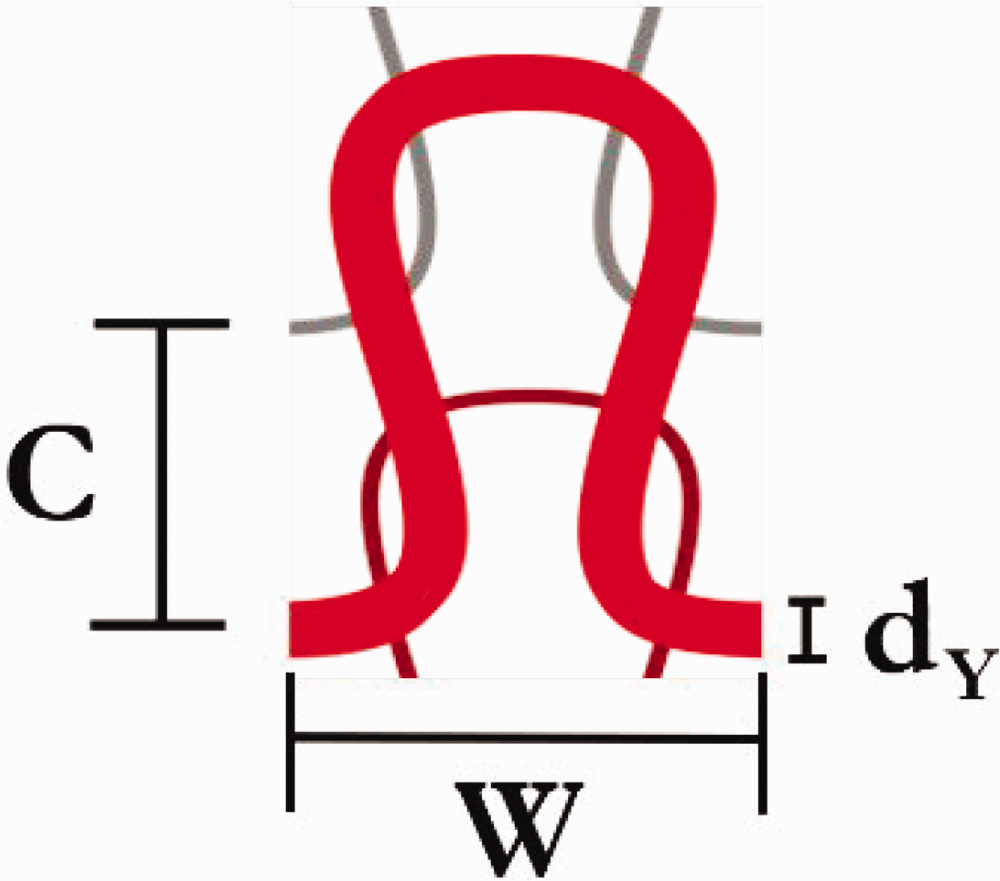
Geometrical parameters of single jersey fabrics: wale spacing
In order to predict the transport through the textile a geometrical representation of the knitted fabric is necessary. The schematic representation of the knitted fabric is shown in Figure 6. Due to the periodic geometry, the single jersey fabric is represented by a REV. The REV has periodic boundaries in each direction and is the smallest repeated unit of the fabric. The REV can be freely positioned. In order to give an intuitive representation, the open yarn ends on the side are not cut horizontally for all REVs, resulting in a configuration in which the loop feet and the loop head of two course-wise consecutive loops are present in the REV. The positioning of the REV in the fabric has no effect on the simulation results.
The detailed description of the loop model is given in the following section. The multifil yarn is modeled as an effective media, meaning the fibers are not resolved in detail. For the modeling of the permeability of the yarn, it is assumed that the fibers are arranged in randomly parallel manner, as shown in Figure 7. This geometrical representation was used numerically to derive constitutive transport correlations for inside of the yarn as published in Maier et al. 30 Even if the REV itself does not perfectly coincide with the single loop, the macroscopic periodic structure is generally well described with the REV used in Figure 7.

Schematic representation of the knitted fabric for the numerical prediction of the transport properties of knitted fabrics.
Estimation of yarn diameter
and porosity
When modeling yarns, the diameter of the yarn is always a difficult parameter to derive. In the yarn forming process the fibers are stretched and texturized and the effective diameter is a statistical quantity. It depends on many material parameters, process parameters during the yarn forming process, the yarn tension, and the measurement method itself. 31 Pavko-Cuden 32 gives a good overview on how the experimental determination and calculation of a diameter is difficult with yarn. 10
In this publication, an average yarn diameter represents the varying yarn diameter in a single jersey knitted loop with a mean value. At the binding points the yarn is compressed, beside the binding points it is more or less free from tension. An average yarn diameter covers the variation of the yarn compression in the loop. The average yarn diameter

For the maximal yarn diameter

The maximum density ratio
The fiber diameter

From the above parameters the average porosity of the yarn for the flow calculations in the section on the modeling of the air permeability can be calculated:

The measured and calculated parameters of the yarns are presented in Table 1.
Yarn parameters
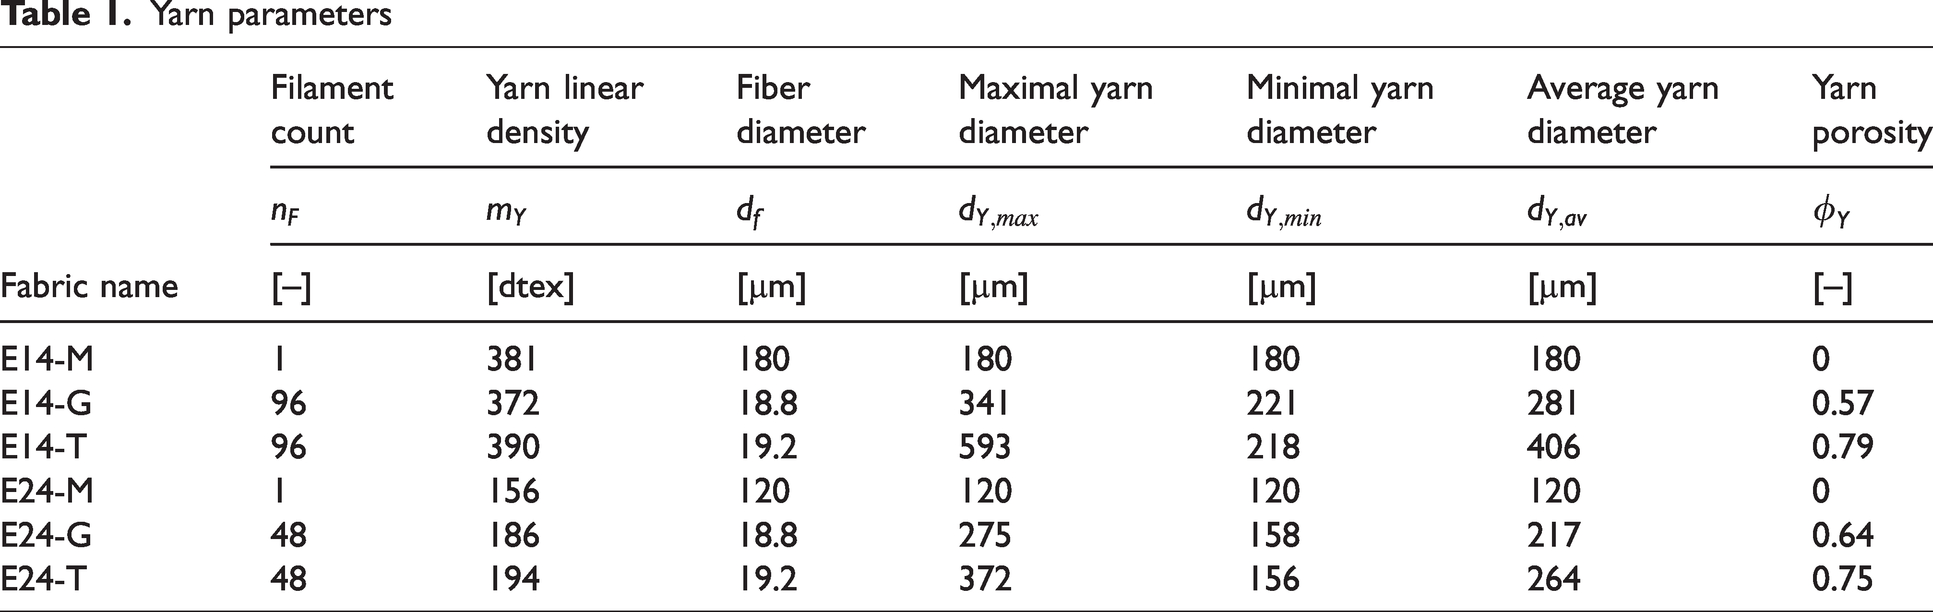
The yarns used are consisting of one to 96 single filaments. The fiber diameters of G-type and T-type yarns are in the same range. Measured yarn diameters
Loop model and extraction of loop-geometry parameters
The digital twin of the single jersey knit is parametrized only by wale spacing

Workflow of the automated imaging algorithm for determining the loop parameters of knitted fabrics.
The algorithm binarizes a microscopic image of a single jersey knit, and extracts the void pore spaces between the loops by color thresholding. In a following step, artefacts are removed by area thresholding, and the gravimetric counterpoints of the pores are calculated. Course spacing and wale spacing are then calculated by searching points in a defined region of interest (ROI), which has to be roughly determined beforehand.
The loop geometry can be easily obtained with a limited number of parameters. This publication uses the loop geometry that was automatically extracted from a microscopic image to parametrize the loop model. For parametrization of the loop model, manual measurements of wale spacing and course spacing could be used similarly.
The REVs of the knitted fabrics were generated by using Choi’s loop model
35
for single jersey fabrics. Choi’s model describes the yarn path in the single jersey loop as



Choi’s model is parametrized only with the wale spacing
Many publications show that the cross-section of the yarn in knits is not necessarily circular but can have more complex geometries. The cross-section then depends on many fiber and yarn parameters, such as fiber geometry, texturation, and twist.
36
Even though more complex loop models with noncircular cross-sections do exist,
37
a general, simple model is desirable. Therefore, for all yarns a circular cross-section was still chosen. As the yarn tends to be compressed, and the diameter is minimal at the interlacing points, the yarn diameter
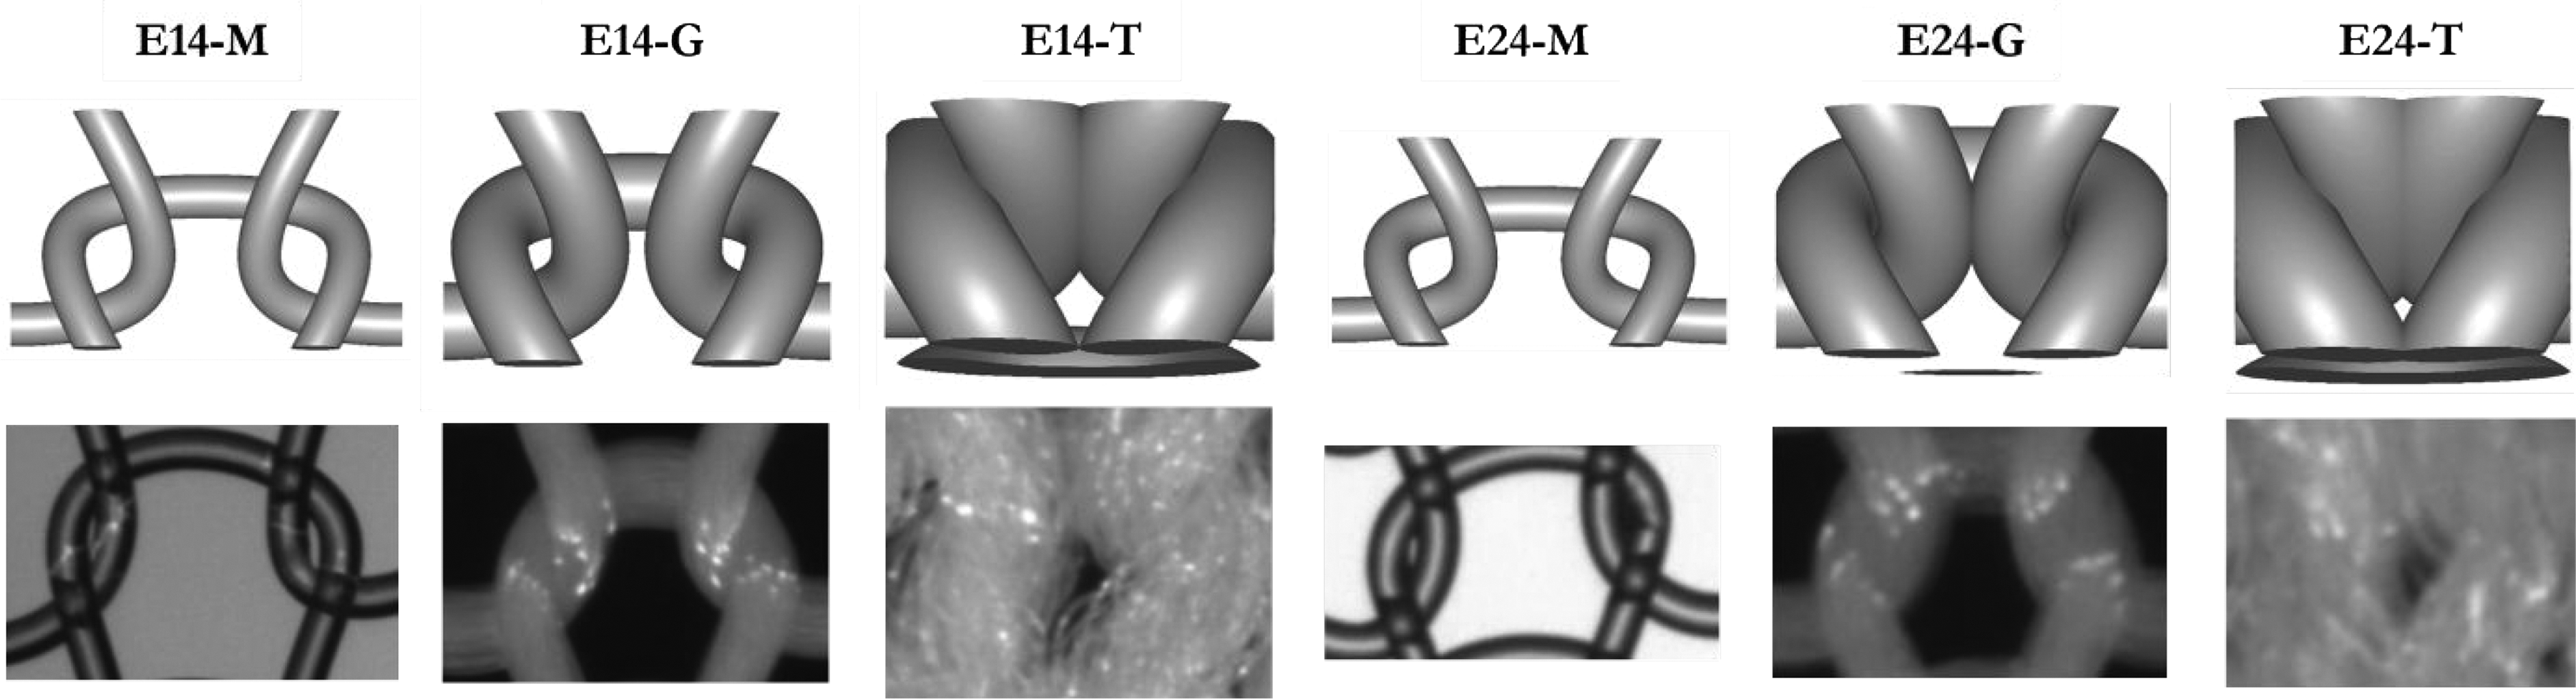
Visualization of the representative elementary volumes (REVs) with TexGen (top) and comparison with the REV of microscopic image (bottom).
The yarn path generated from Choi’s model was simulated in Python 3.8 38 and a three-dimensional (3D) digital twin of the knitted fabric was generated using the open-source tool TexGen 39 using the yarn diameter derived by equation (3).
The resulting REVs are shown in Figure 9 in comparison with REVs obtained by microscopic imaging.
The geometries of the REVs obviously differ from the microscopic images. The monofilic yarns in E14-M and E24-M do not touch each other on the microscopic images either, but the gaps are way smaller by more than a factor of five. For the multifilic nontexturized fabrics E14-G and E24-G the yarns are fully in contact, whereas they do not touch each other in the modeled REV. In order to analyze the obvious differences, microscopic Images, REVs and fabric are compared quantitively in the results section. The properties of the fabrics and corresponding REVs are presented in Table 2.
Properties of the fabrics and the corresponding REVs
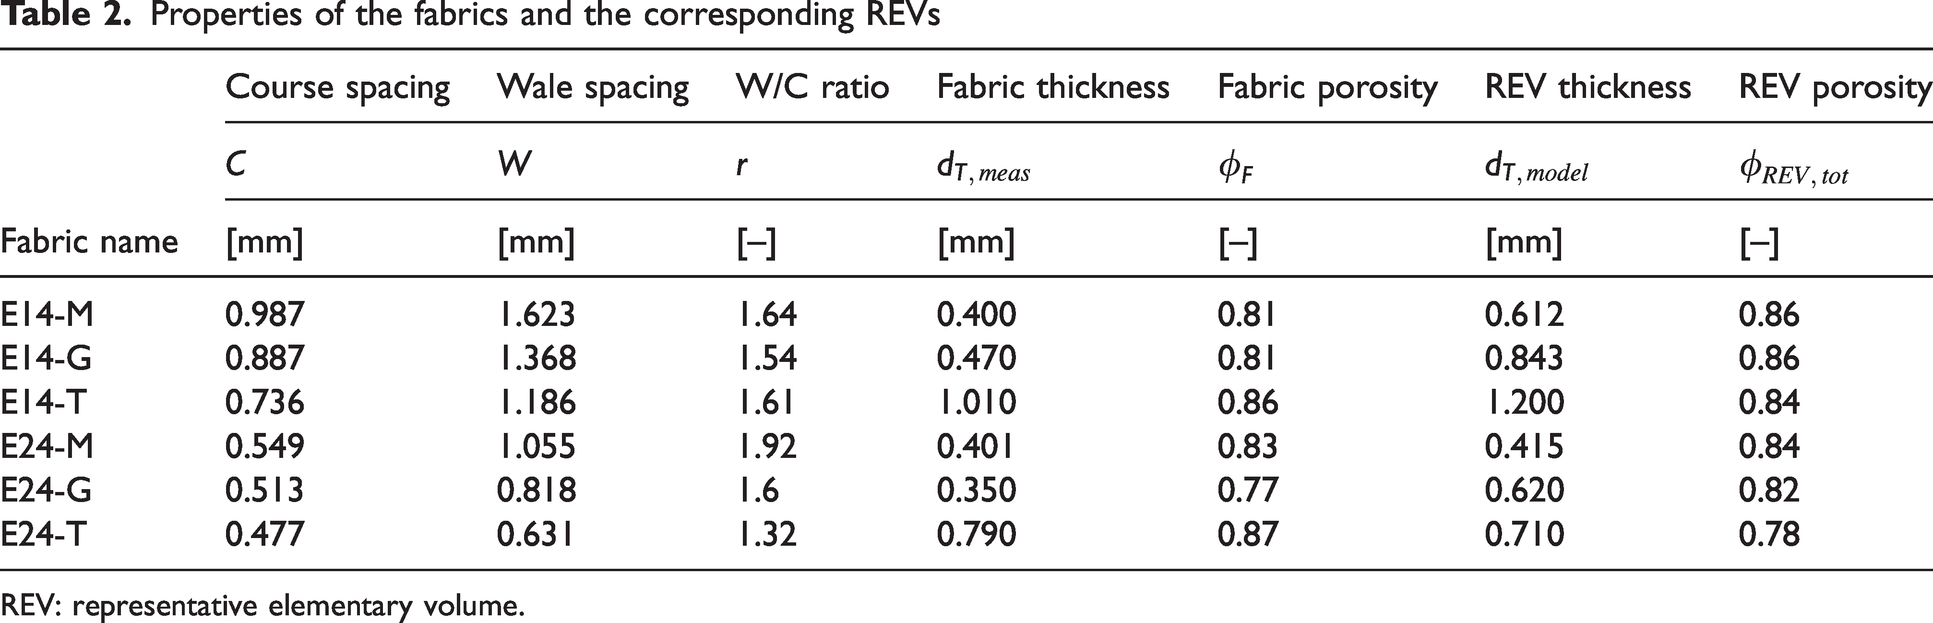
REV: representative elementary volume.
Computational domain for simulative studies
The computational domain to predict the effective transport equations is shown in Figure 10.
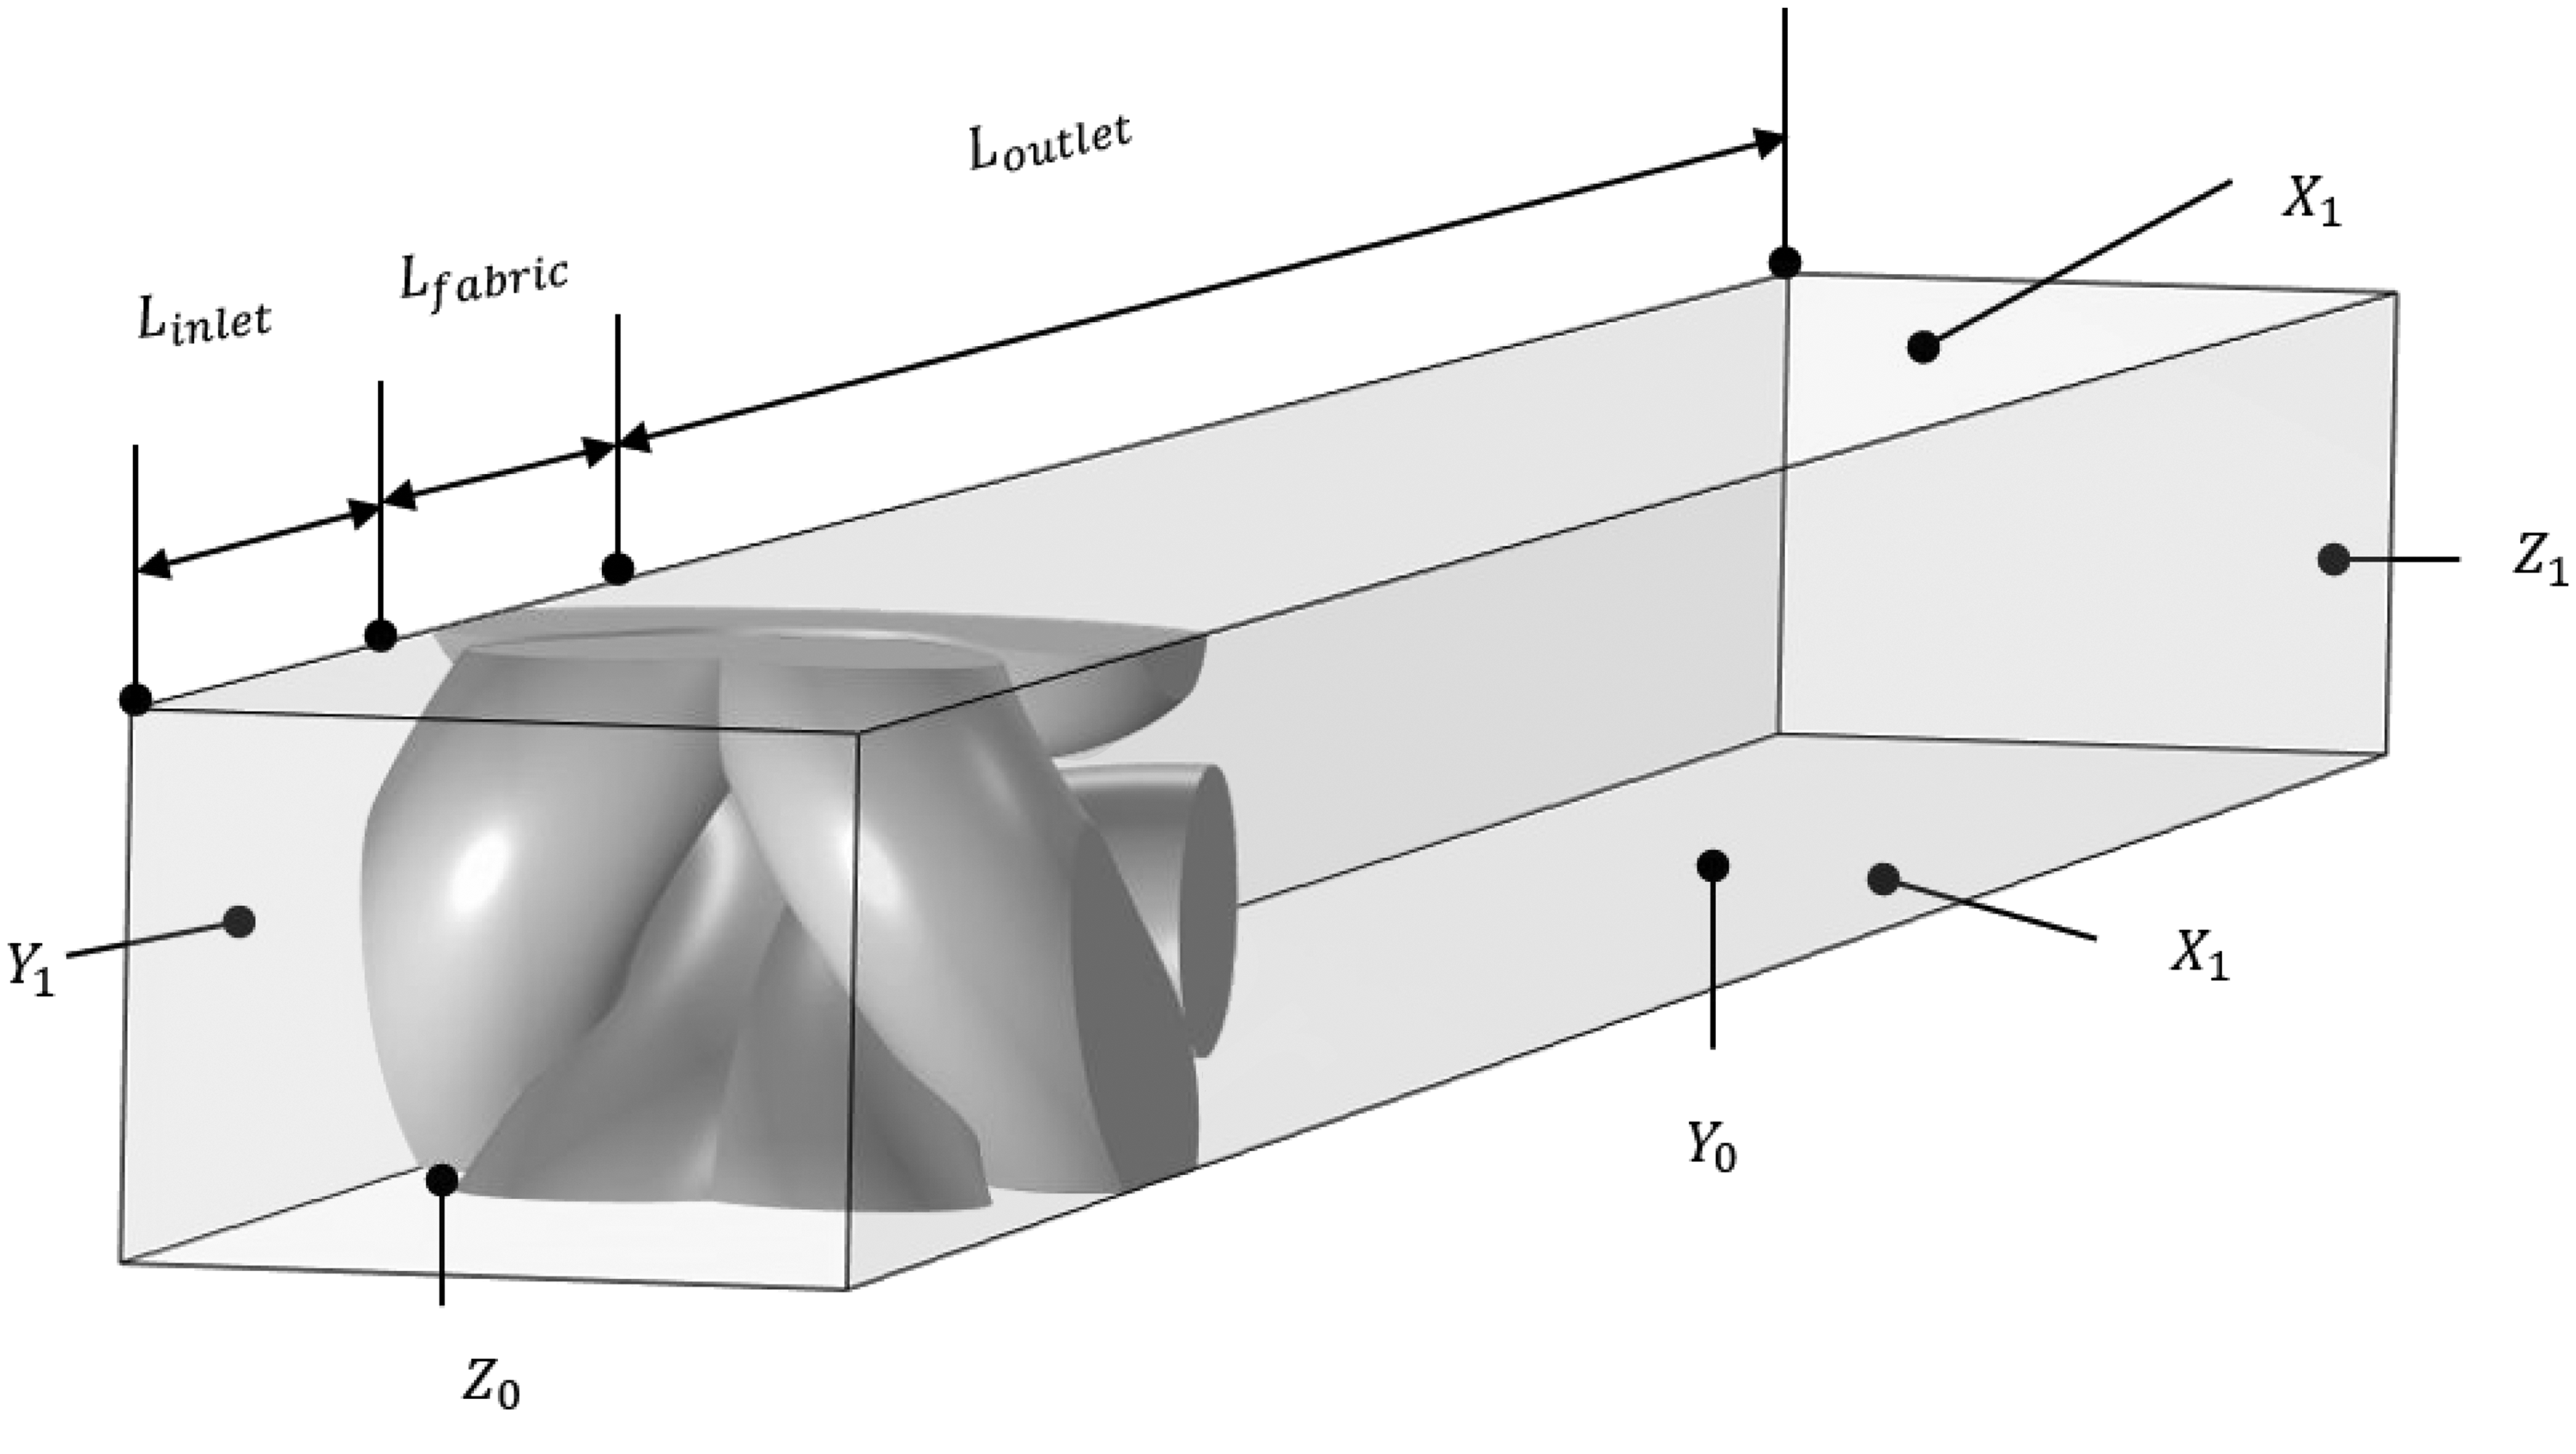
Illustration of the computational domain and the domain boundaries to predict the effective transport properties of the knitted fabrics.
At the inlet boundary
Modeling of the air permeability
To predict the effective mass transfer properties of the knitted fabric, a single domain approach was employed. A single domain approach is based on the solution of a single transport equation in the entire domain, the same transport equation in free flow and porous media domain. This approach avoids the explicit formulation of an interface condition between the porous media, here the yarn, and the free flow domain.
The transitions between the two flow regions are achieved by specifying the variation of physical properties such as permeability, diffusion coefficient, and porosity, as shown in Figure 11. However, the validity of the single domain approach is restricted. The model is valid only for high porosity systems (
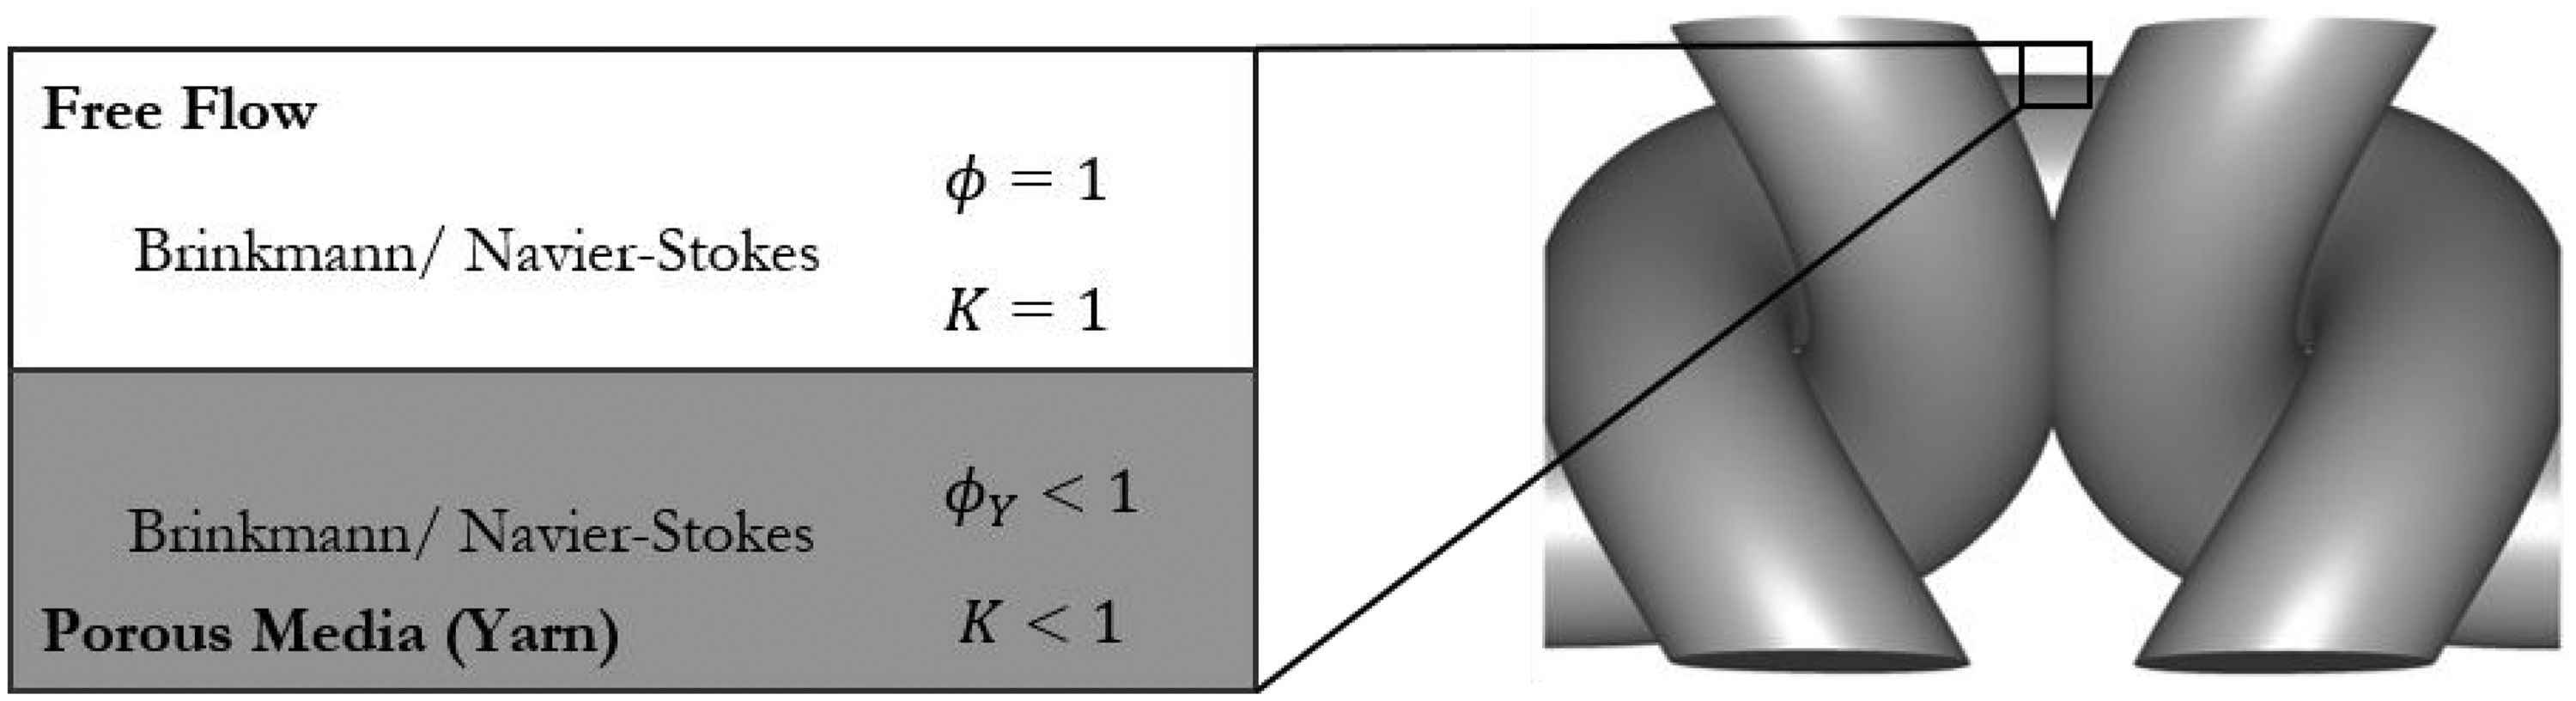
Single domain approach for convective mass transfer in free flow and porous media systems.
For predicting the convective transport, a Brinkmann equation
41
was solved on the computational domain:


Equations (8) were implemented in the laminar flow module of the finite element software COMSOL Multiphysics v5.6. The computational domain was discretized by a triangular mesh. For solving the discretized partial differential equations, the generalized minimal residual method with an algebraic multi-grid preconditioner was used as the iterative solver. It turned out that the mesh quality is crucial. In domain areas with large velocity gradients a mesh refinement (five adaptions with starting mesh size ‘extra fine’) was necessary to obtain a converged solution. With the solution to the equation the average air volume flow through the knit can be calculated as

Modeling of the evaporative resistance (effective diffusivity)
The evaporative resistance is directly related to the effective diffusion coefficient
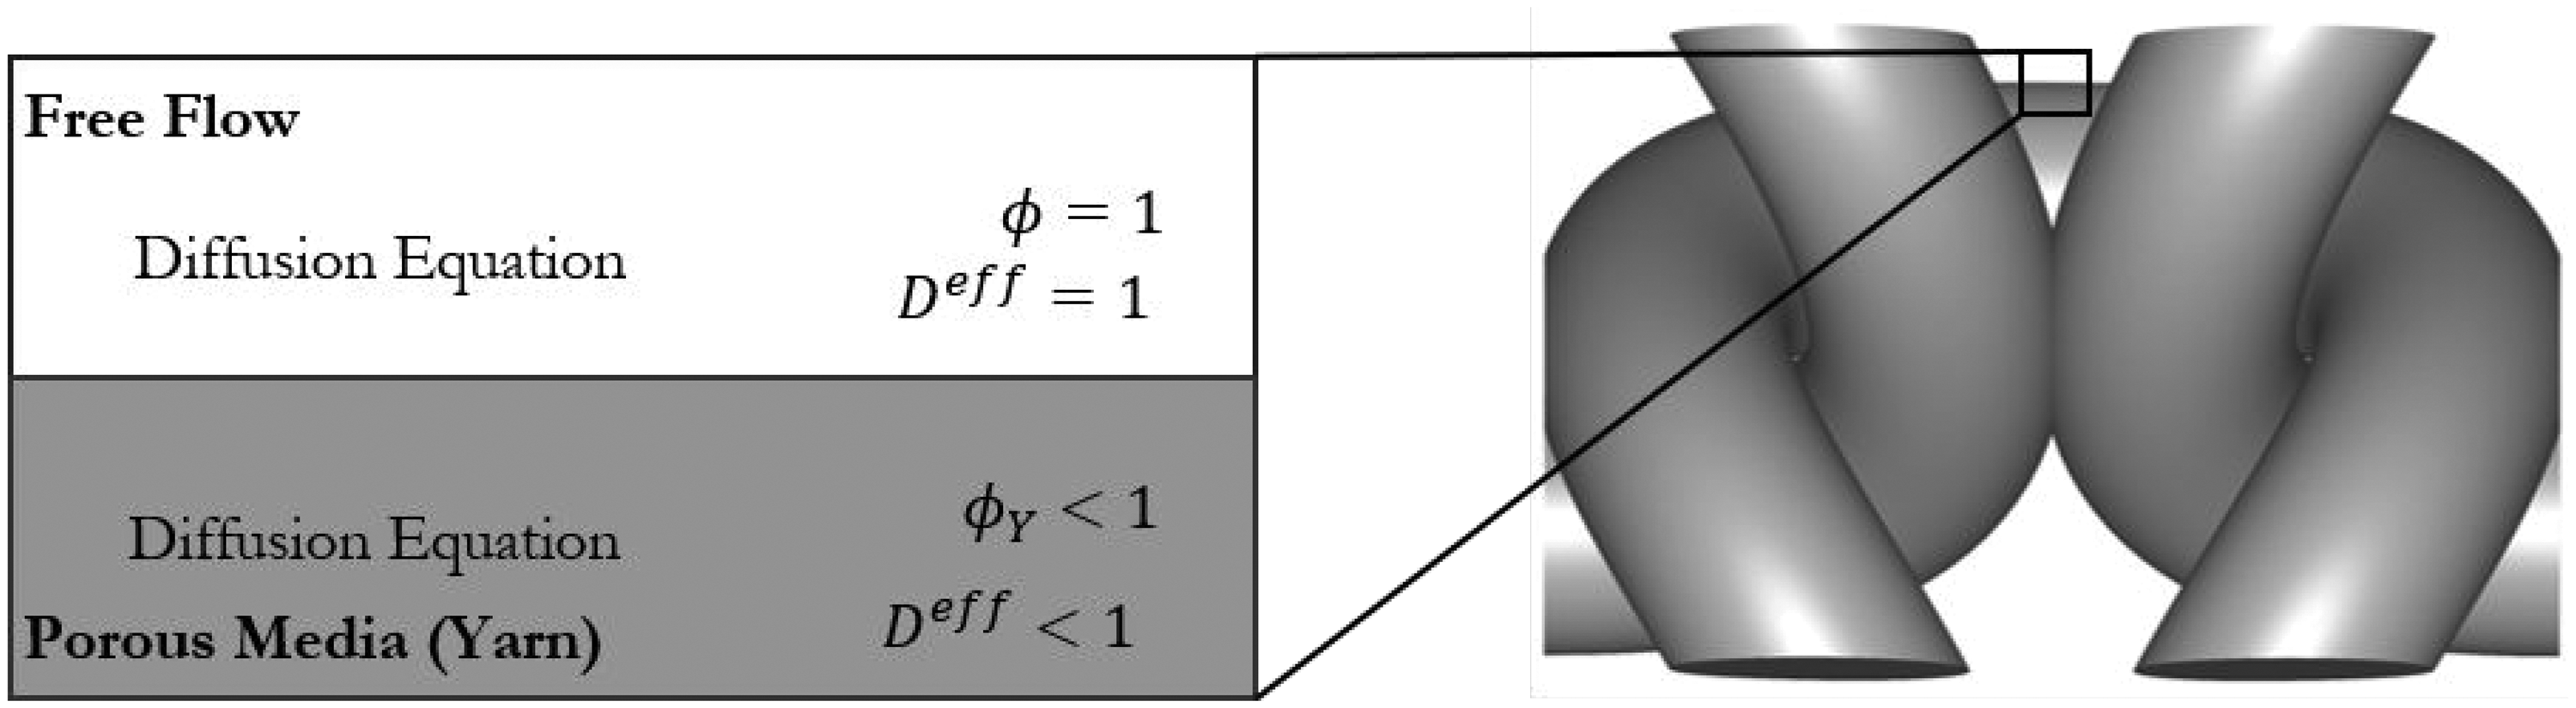
Single domain approach for diffusive mass transfer in free flow and porous media systems.
For predicting the diffusive transport, the stationary Fick’s diffusion equation was solved on the computational domain. Fick’s diffusion law is a simplification of the Stefan–Maxwell diffusion law, which assumes infinite dilution, constant temperature, and ideal behavior of the considered species:


Methods for geometry analysis of the representative elementary volume (REV) and fabric in two-dimensional (2D) (area porosity) and three-dimensional (3D) (porosity). Examples are given for sample E14-G.
Equation (11) was implemented in the PDE module of finite element software COMSOL Multiphysics v5.6. The computational domain was discretized by a triangular mesh. To obtain a mesh independent solution, the mesh setting ‘extra fine’ was sufficient. For solving the discretized partial differential equations, the direct solver PARDISO was used.
42
By utilizing the solution calculated, the average diffusive flux 
In this equation, 
The evaporative resistance 
Results and discussion
Analysis of REVs and comparison with knitted fabric
In order to quantify the difference between the microscopic images and the REV, the area porosity and porosity were analyzed. Figure 13 shows methods for the analysis and comparison of fabric and REV.
The area porosity was calculated from the black background 
The threshold for binarization was chosen in a way that the free area of the binarized image has subjectively a good fit compared with the original image, and is shown in Figure 14. The left side of each image shows the microscopic image and the right side shows the binarized image, which was used for calculation of area porosity. In the binarized image, the area covered by yarn is filled with white pixels, the background is filled with black pixels.

Two-dimensional (2D) image of fabric for all samples. Image (left), binarized image (right).
The corresponding images of the REVs with renderings and the binarized renderings are shown in Figure 15.
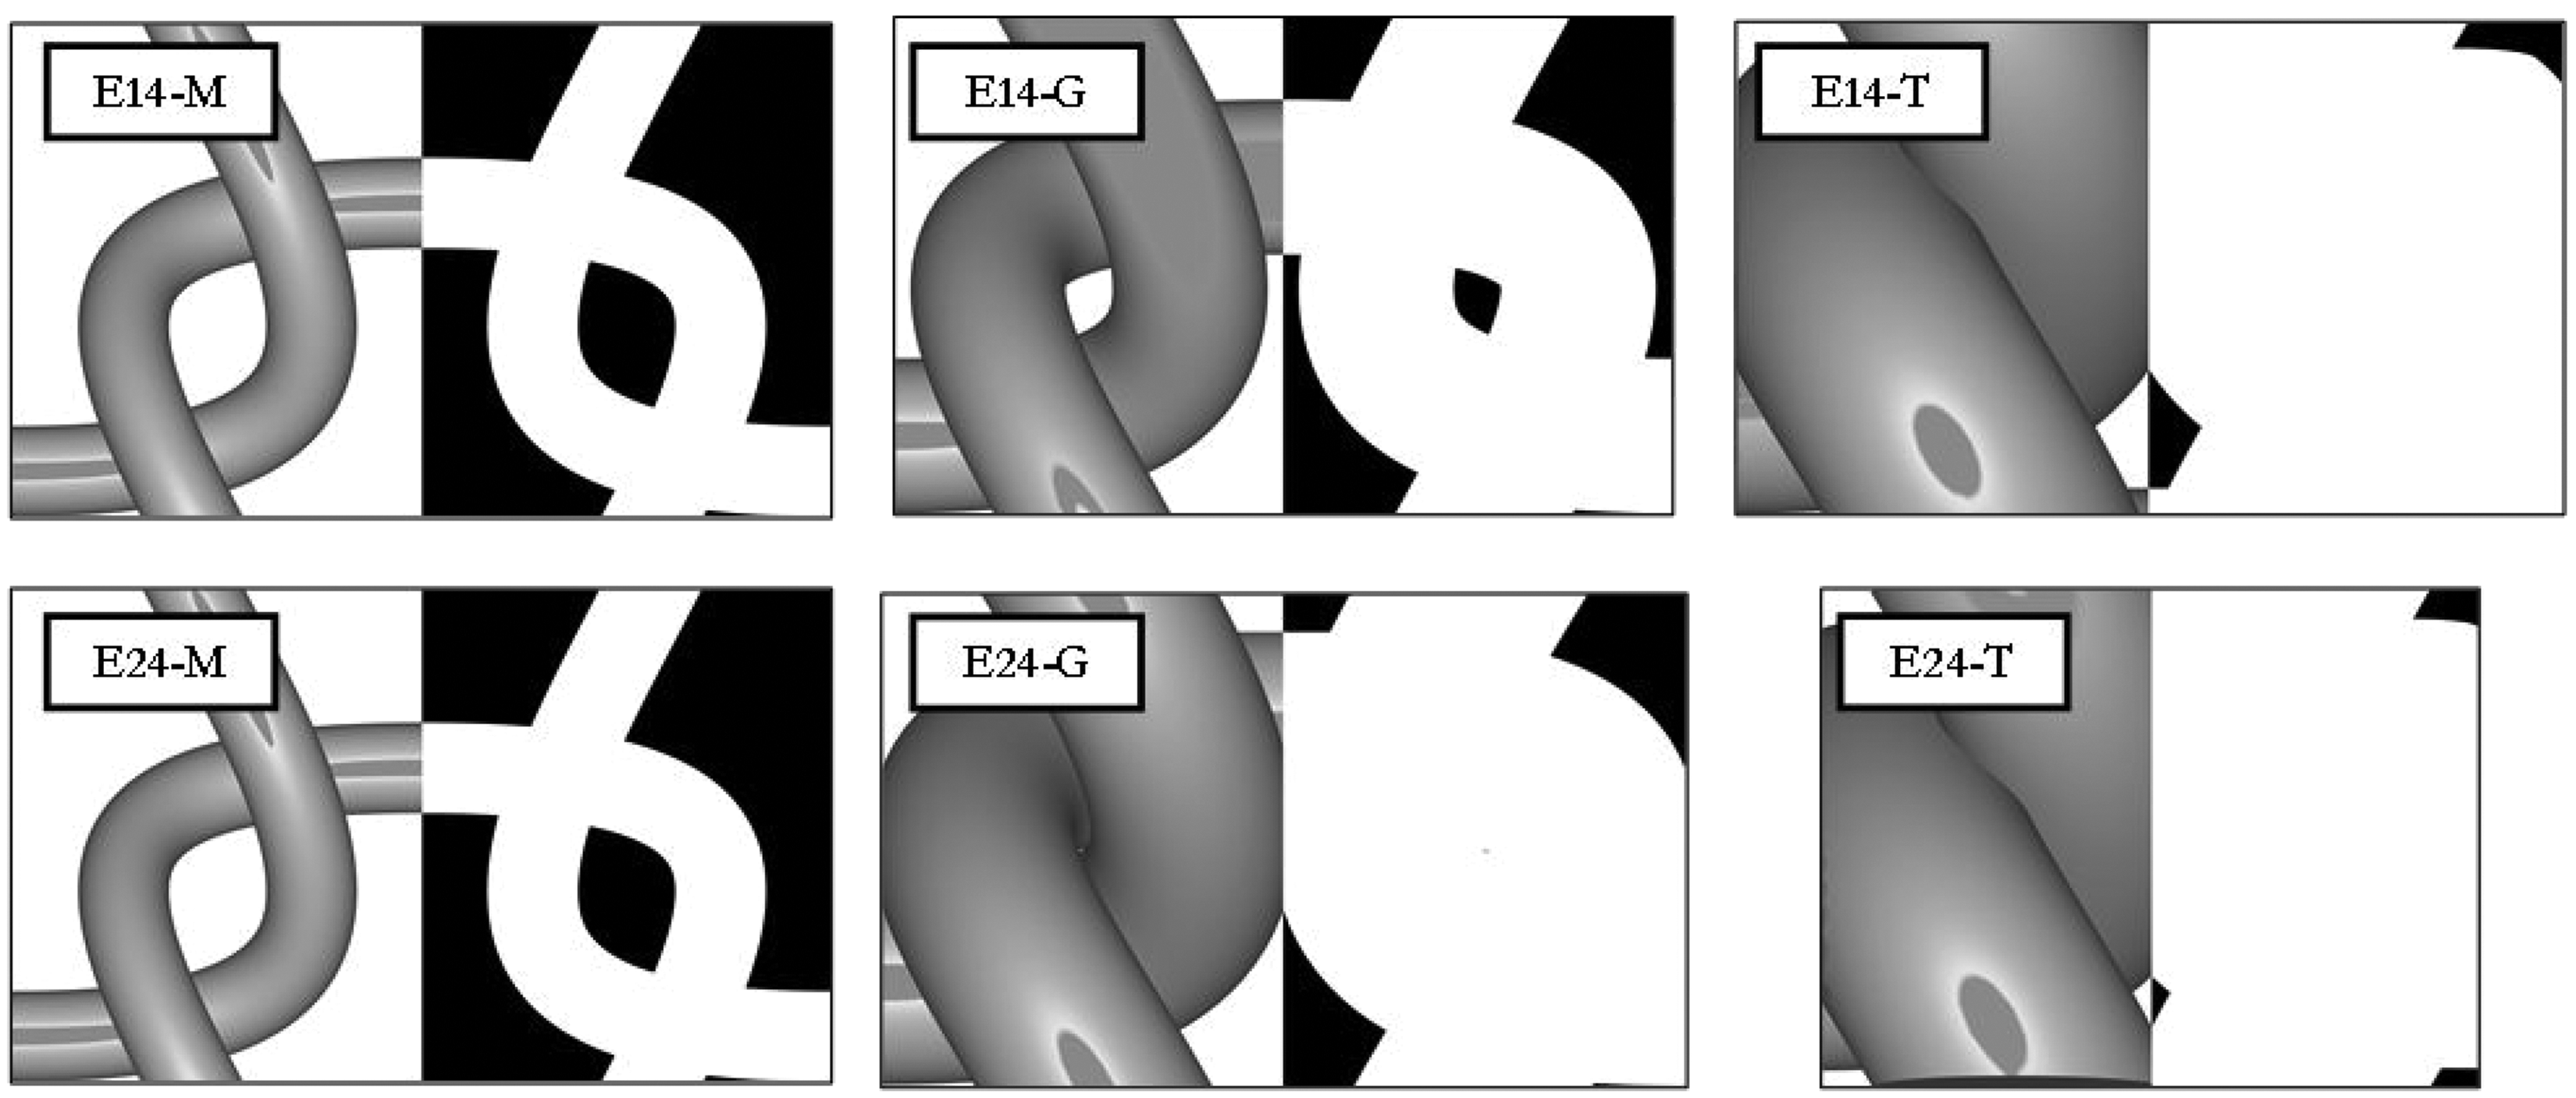
Two-dimensional (2D) image of representative elementary volume (REV) for all samples. Rendering (left), binarized rendering (right).
As the area porosity lacks the information of the third dimension, the total porosity of the REV (both loop and yarn porosity combined) was compared with the measured porosity from the samples. The porosities were each calculated as follows.
Density based fabric porosity 
The total porosity of the REV 
The properties of the six different fabrics are presented in Table 2 with the properties of the REVs used for modeling.
The REV is calculated just by the W and C of the original fabric. The W/C ratio
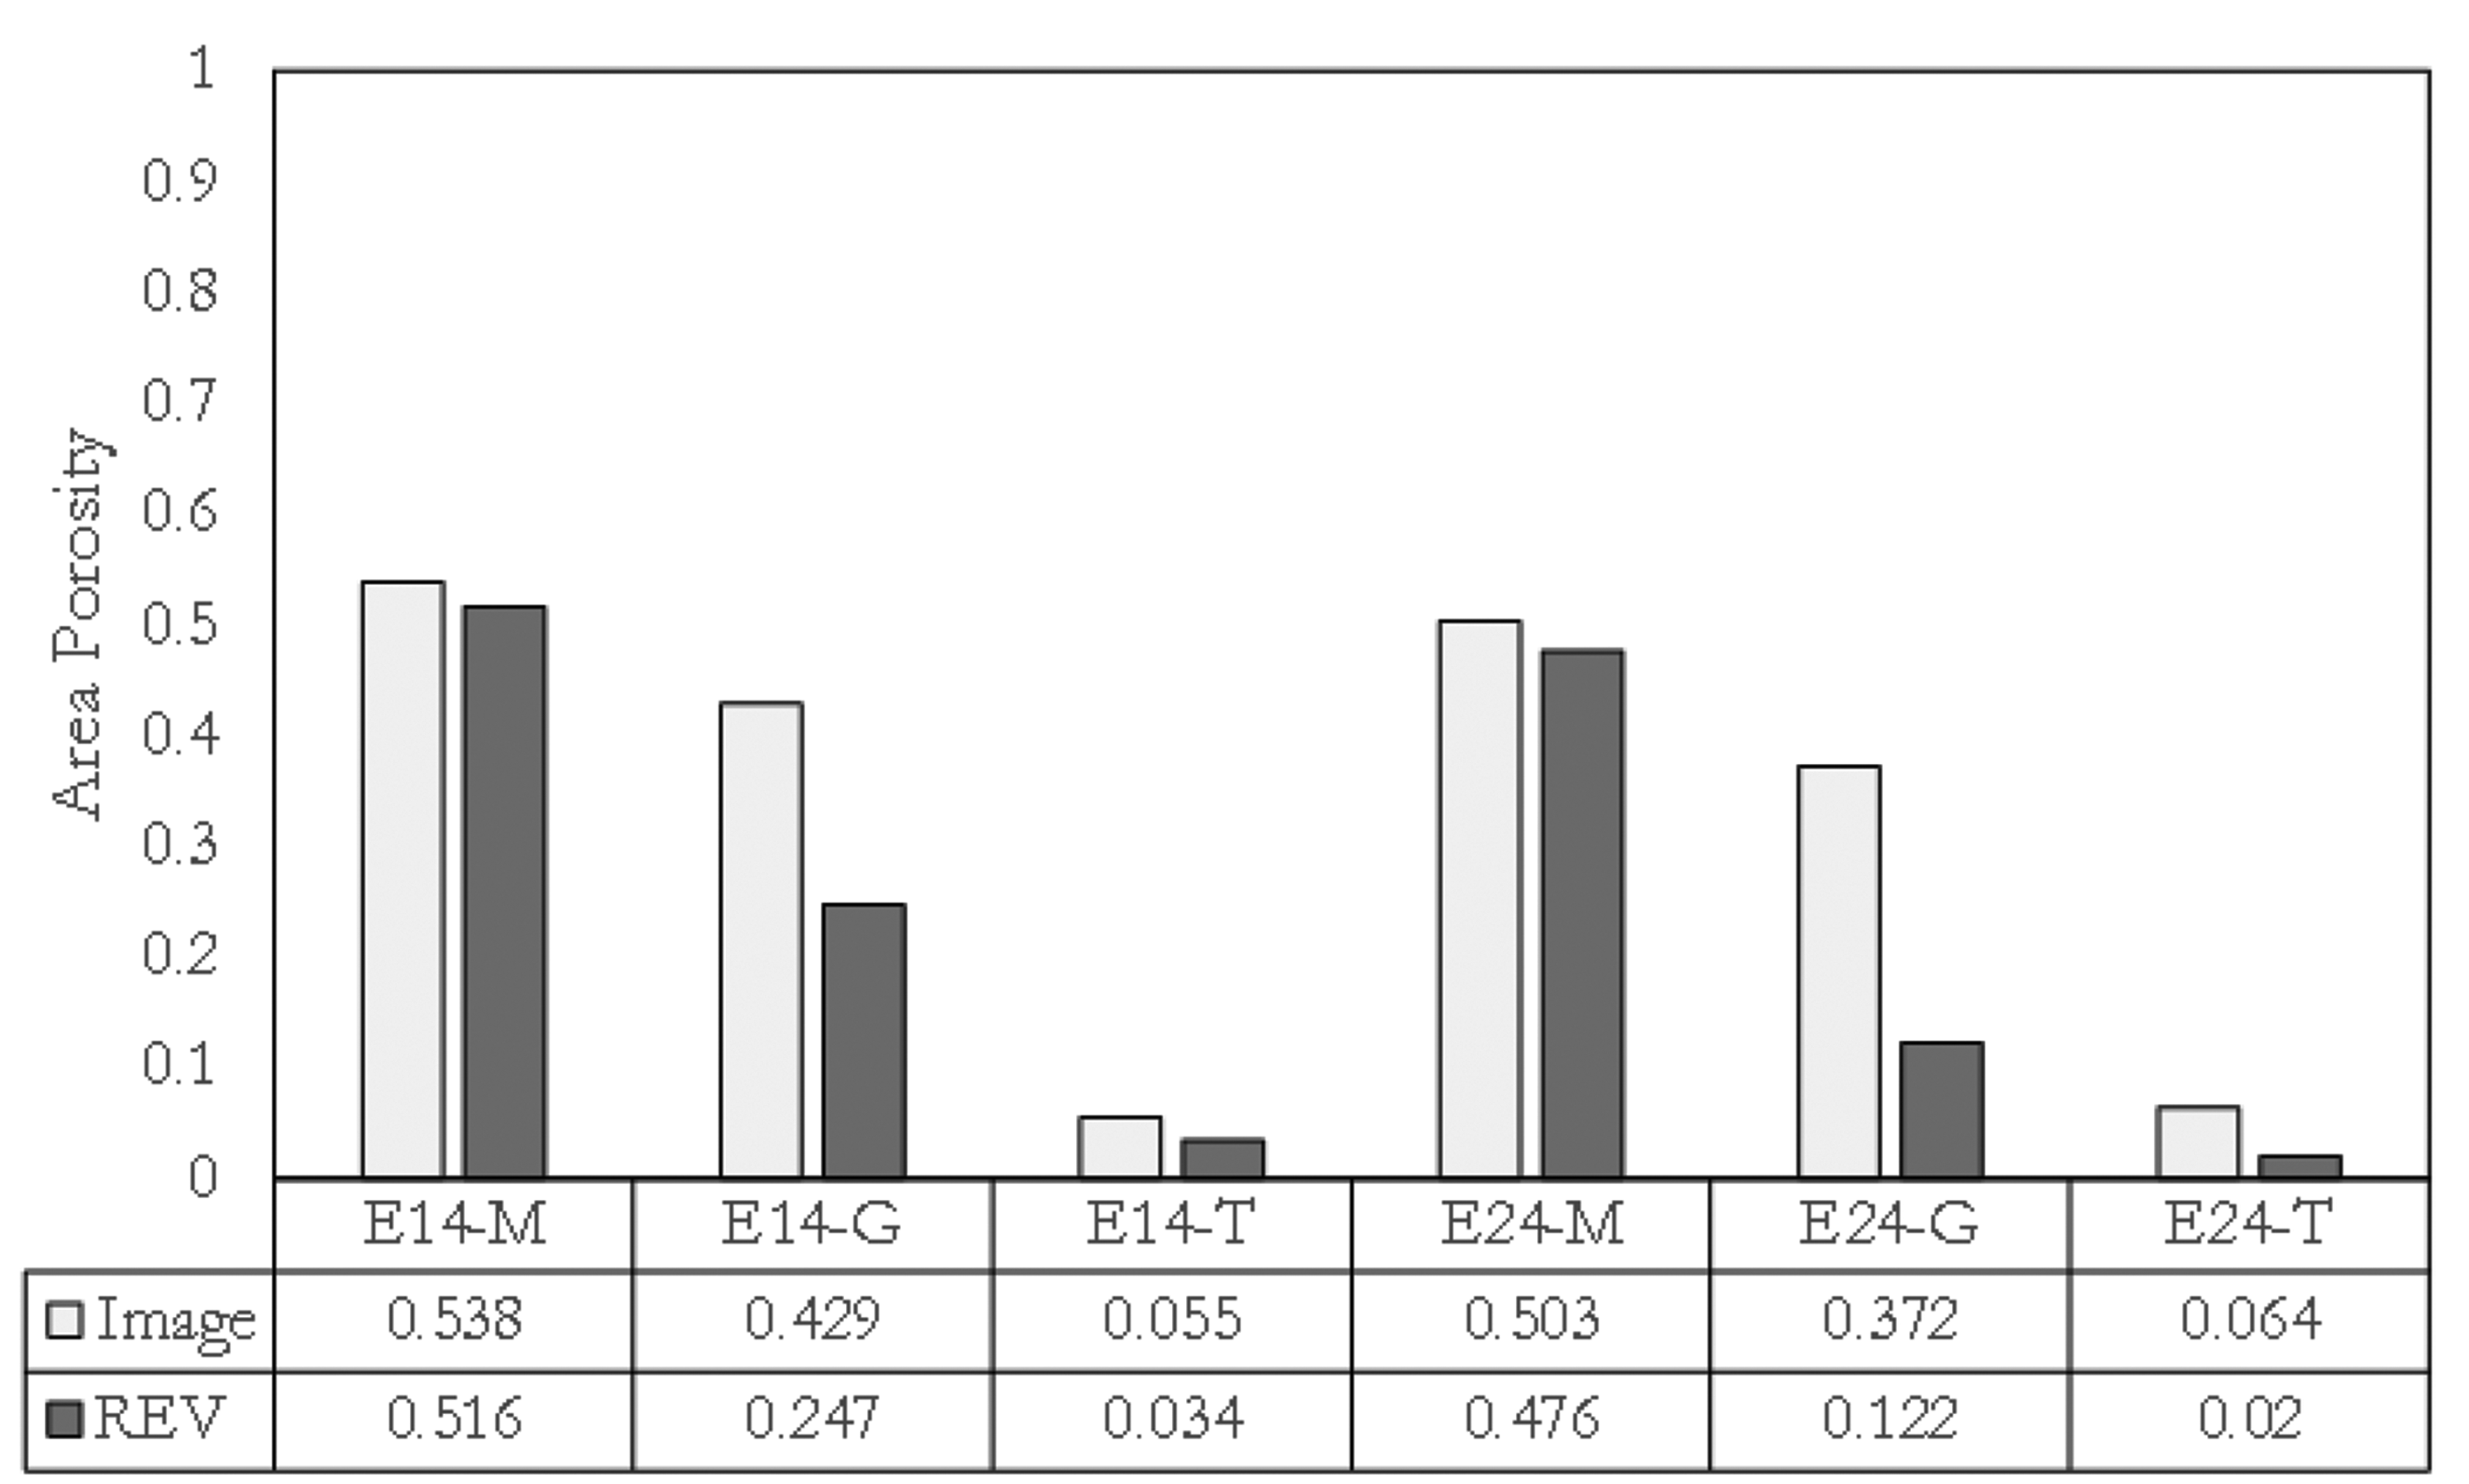
Analysis of area porosity of images and representative elementary volumes (REVs).
Figure 16 shows the results of the computation of area porosities. It turns out that for the fabric samples made out of smooth yarns (E14-G and E24-G), area porosities differ a lot at first sight as the comparison of Figure 9 suggested. For the monofilic and texturized yarns the area porosities match quite well.
Figure 17 shows the results of the comparative analysis of the geometrical characteristics in 3D by the porosity. It turns out that porosity determined by gravimetric analysis of the fabric and volume calculation of the REV do correlate quite well. All porosities are in the typical range for knitted fabrics between 0.6 and 0.9, with a tendency towards very loose fabrics.4,44,46 –48 The correlation of transport properties with porosity is sufficiently described in the literature.

Comparative analysis of fabric and representative elementary volume (REV) regarding the relative open space (left) and porosity (right).
A more accurate representation of the loop could easily be achieved by implementing a more sophisticated loop model in the workflow. However, the goal of this work is not to replicate the geometry precisely, but to obtain a sufficiently accurate representation of the structure to determine the transport characteristics. It turns out that porosities of the REVs correlate with the fabric despite the poorer fit of the geometric representation examined on area porosity and fabric thickness. In pore network simulations, geometries are often completely neglected. What matters are the characteristic properties for gas transport, here given as porosity.
The authors want to emphasize that despite this subjective geometrical deviation of fabric and REV, the characteristic property of fabric porosity is in good agreement.
Study of the simulation domain length and mesh convergence
In order to obtain a solution that is not dependent on the mesh size, an adaptive mesh analysis was conducted. This involved utilizing the L2 norm error estimator to assess the error associated with each individual element. The error indicator specifically quantified the L2 norm of the local velocity gradient. Subsequently, areas with higher error were identified, and the geometry was re-meshed with finer elements in those regions. The model was then solved using this updated mesh. For more detailed information, please refer to the Adaptive Mesh Refinement Solver. 49 After a mesh refinement step five the relative error was below 1%. Figure 18 illustrates an exemplary demonstration of the mesh analysis. Following the fifth mesh refinement step, the relative error dropped below 1%. In addition to mesh resolution, it was discovered that the length of the outlet also played a significant role in influencing the simulated average air velocity. To eliminate the impact of the simulation domain's length, an investigation into the outlet channel length was carried out, as depicted in Figure 18 (right). Notably, as the fabric with textured yarn exhibited decreasing velocity, the influence of the channel length and the mesh resolution diminished.
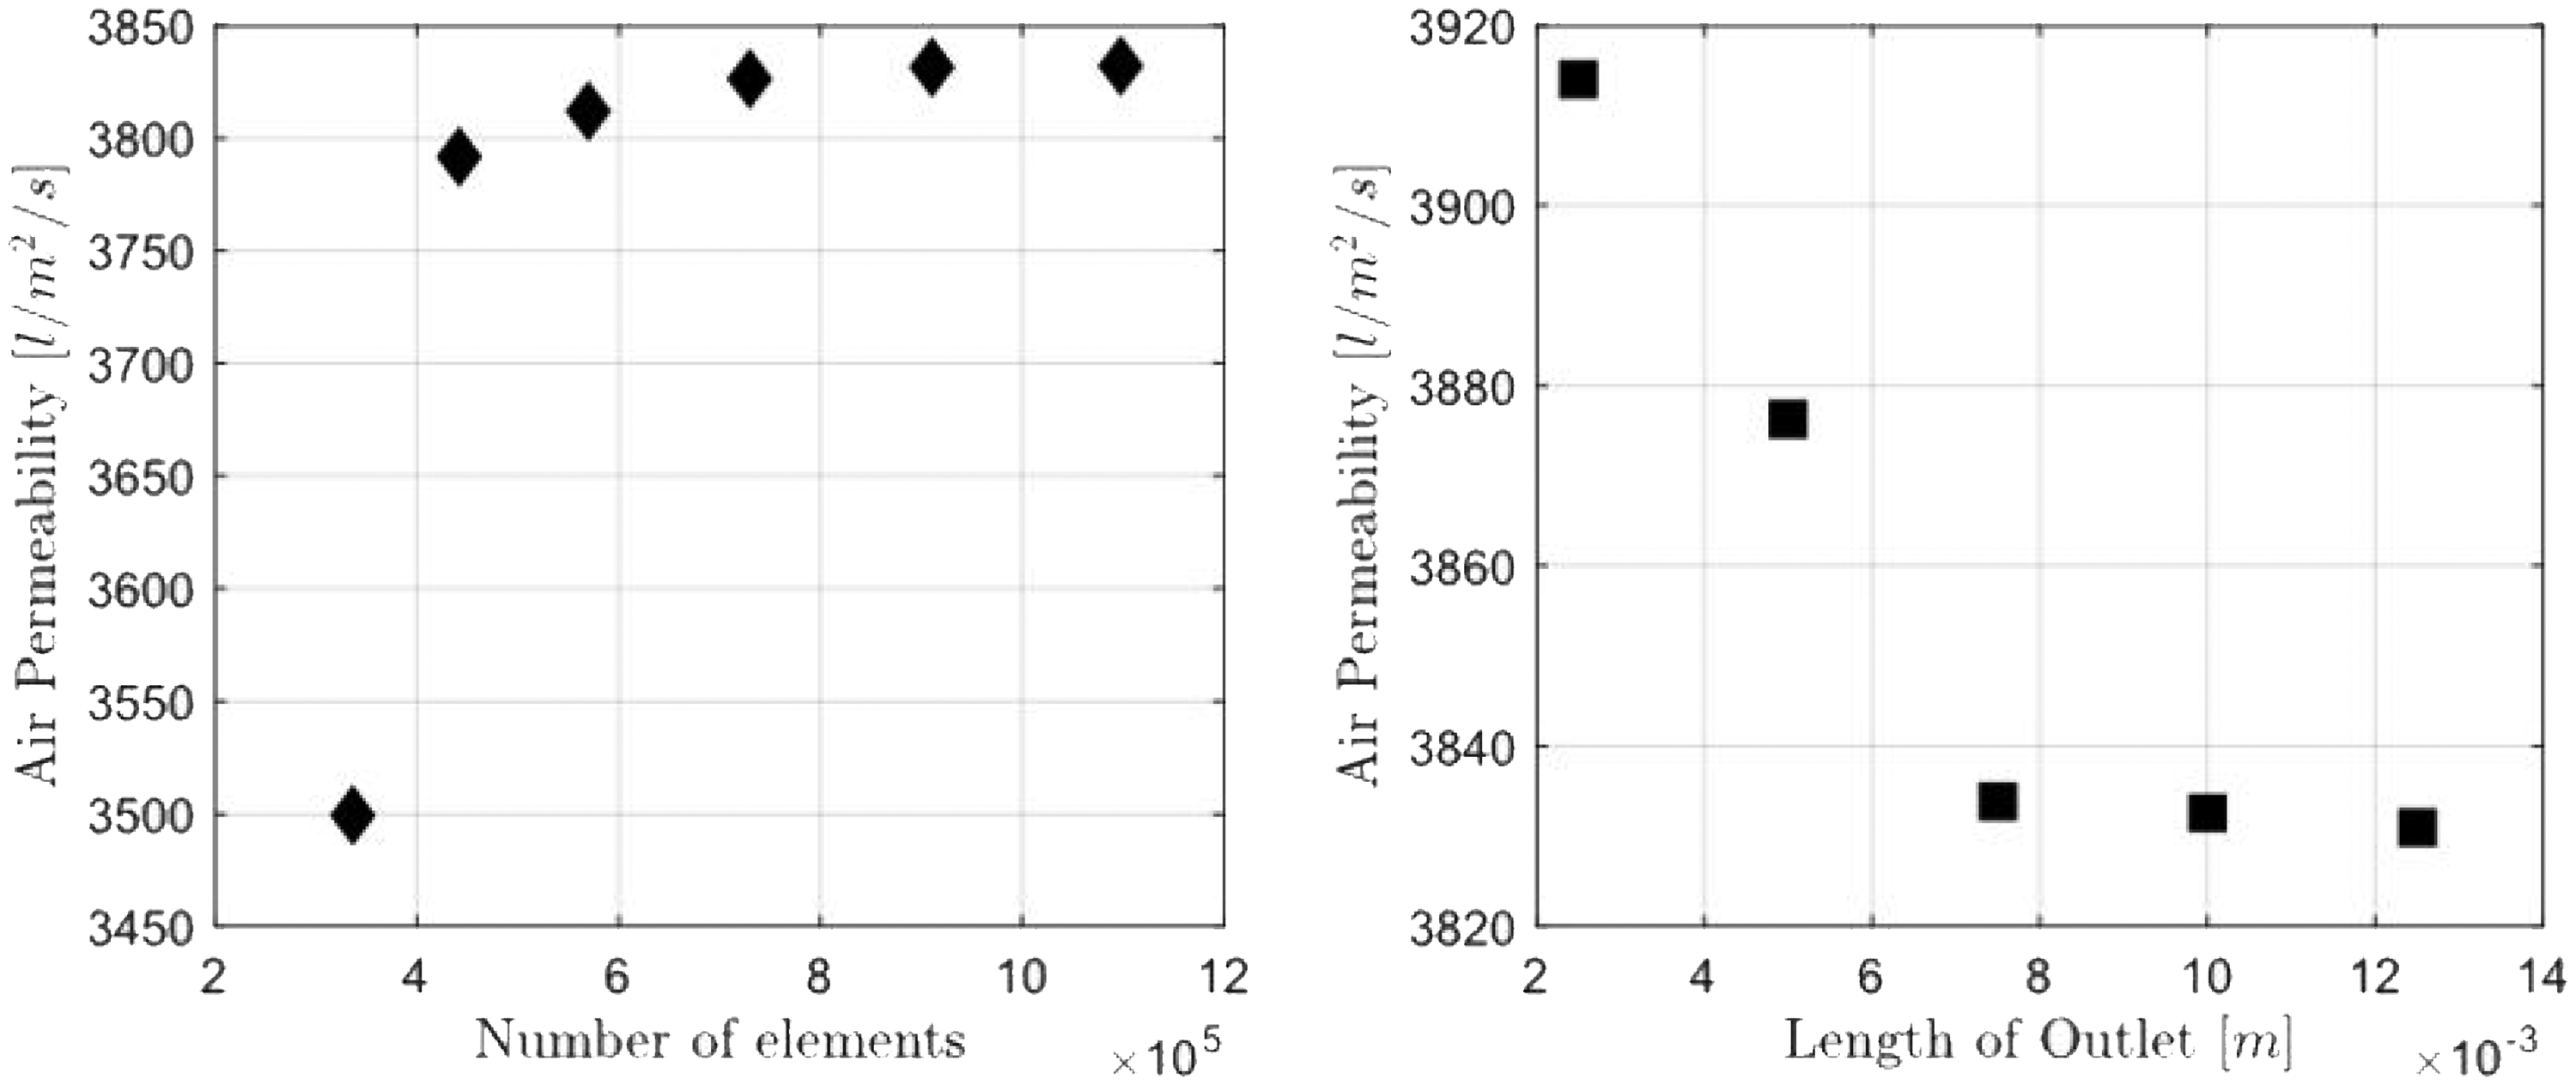
Mesh study (left) and study on the outlet length (right) exemplary shown for E24M.
Prediction of air permeability
The knitted fabric exhibits an aggregate laminar flow pressure drop of 20 Pa. Figure 19 provides a visual representation of this pressure drop within the yarn, highlighting a significant increase in pressure drop inside the yarn itself, indicating the predominant flow through the macropore in the middle of the loop.
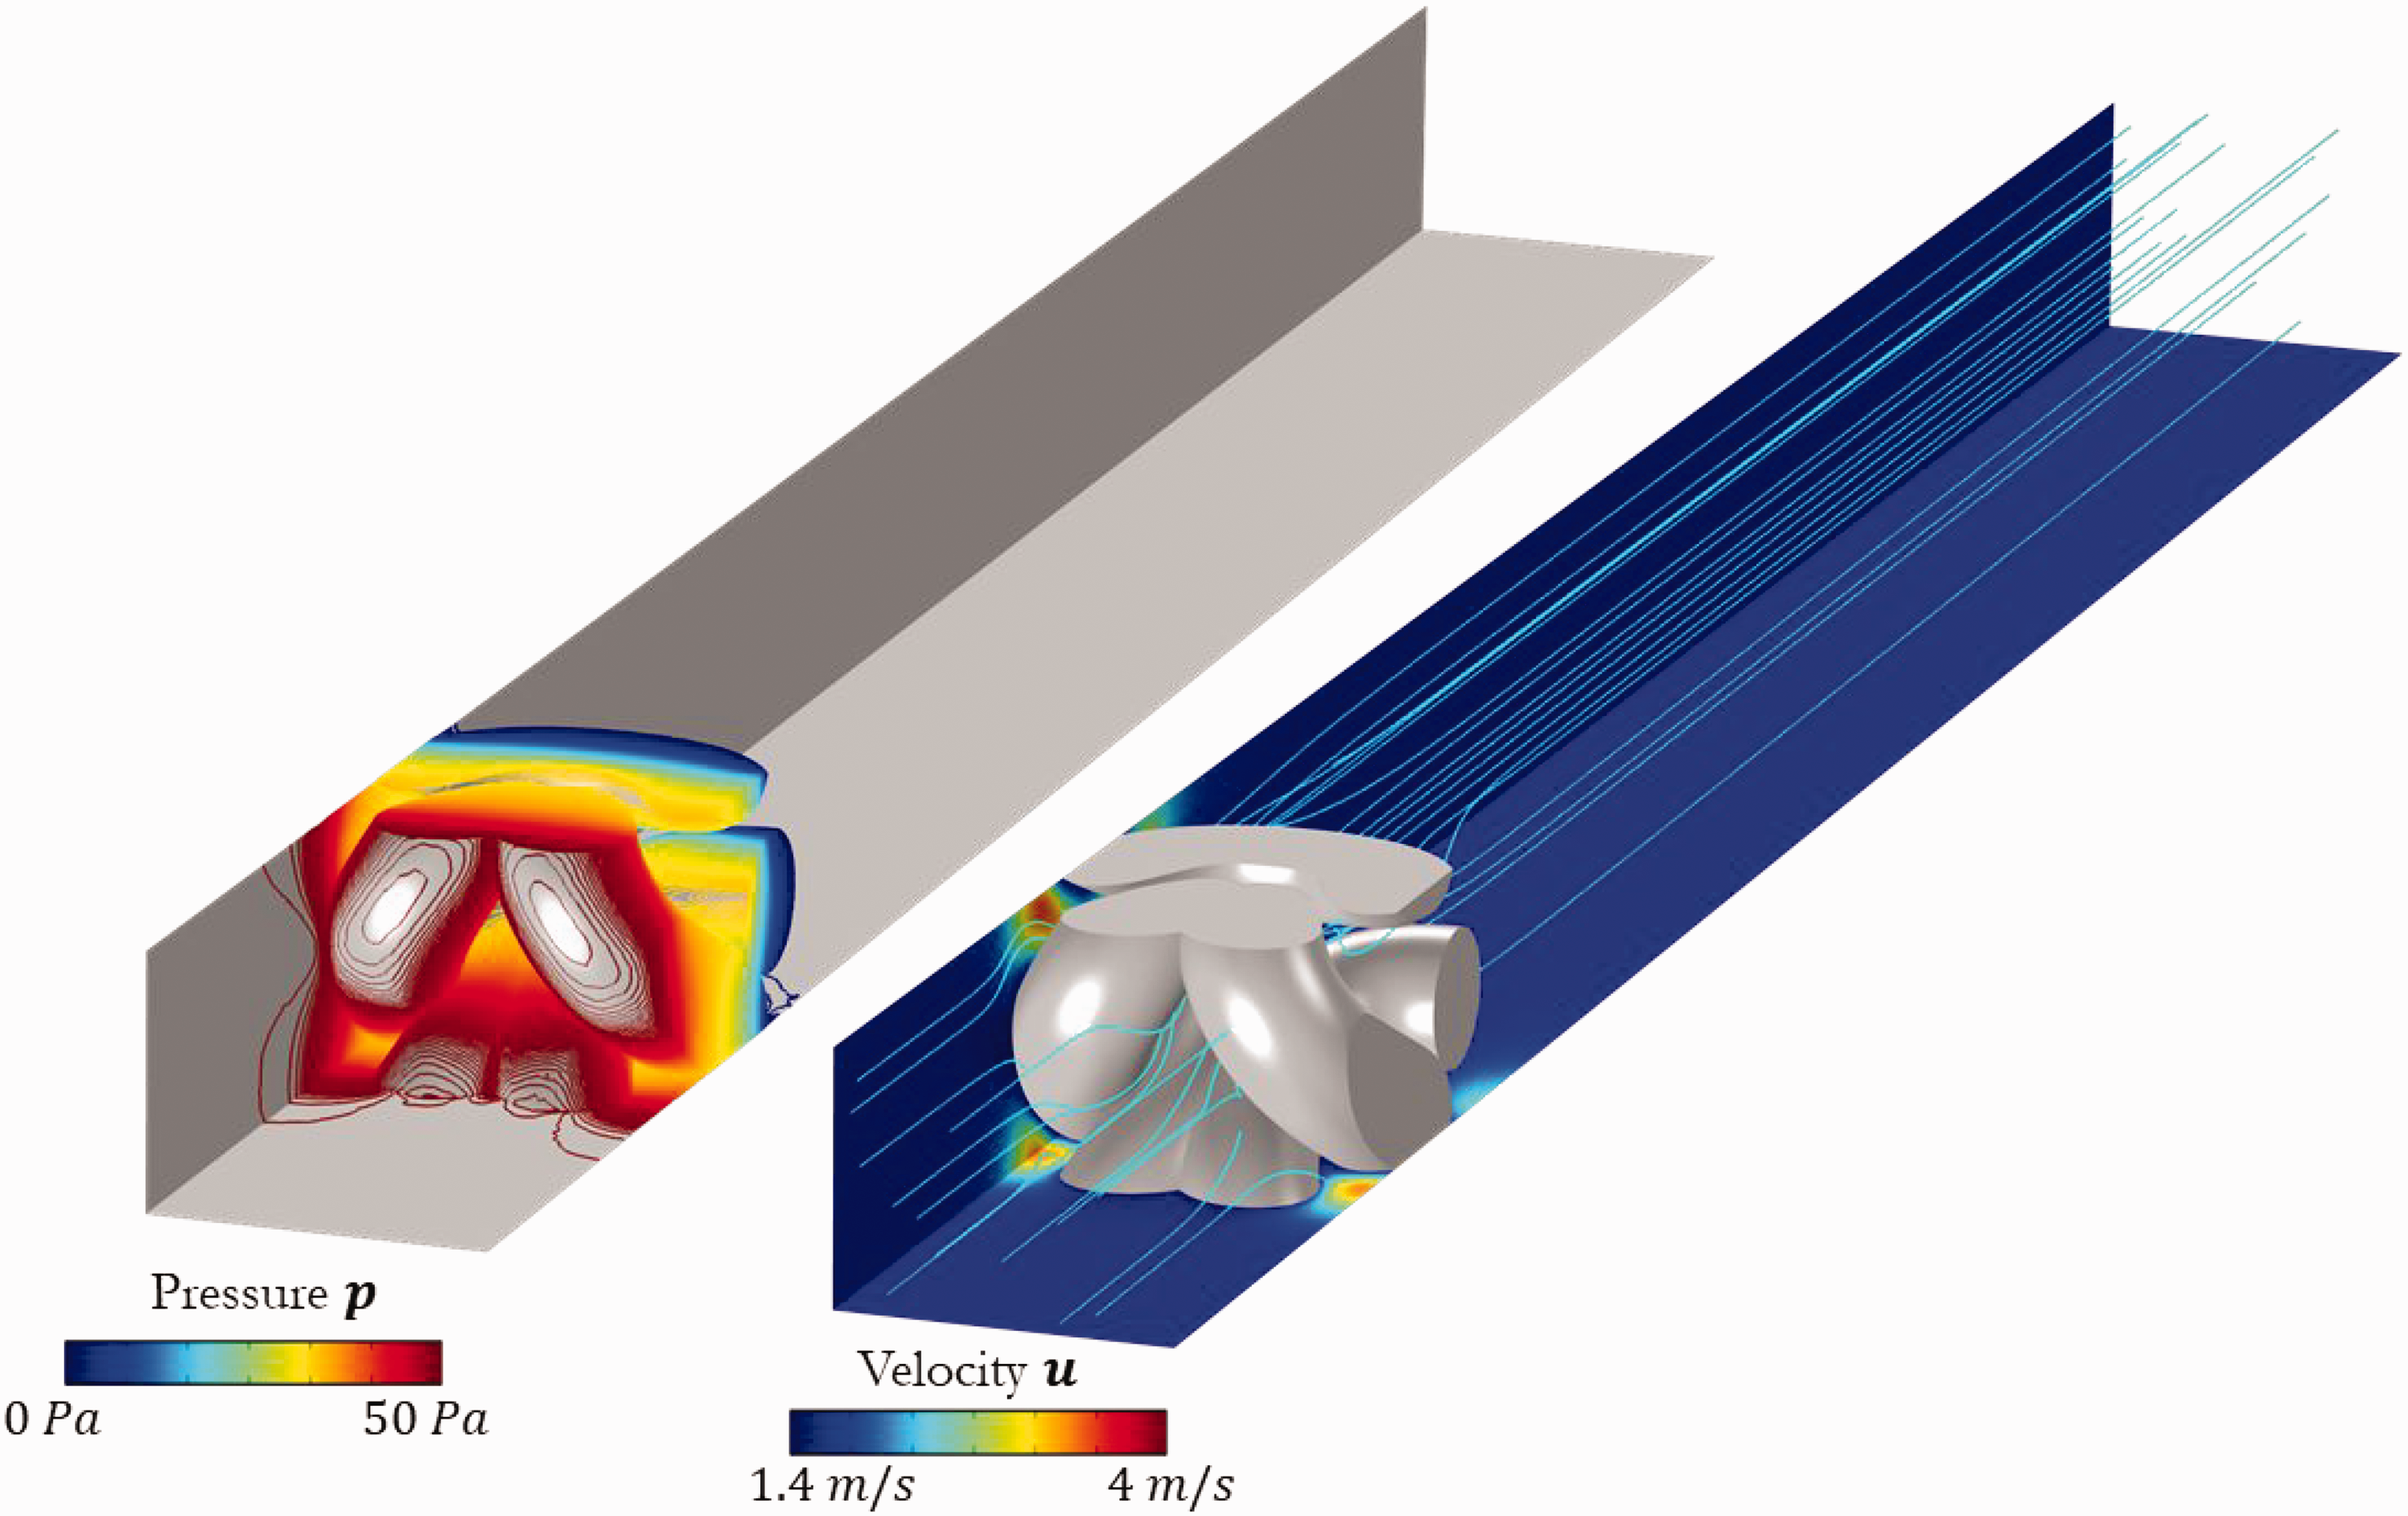
Velocity and pressure field exemplary shown for E24 T knitted fabric.
Figure 20 illustrates a side-by-side comparison between the experimentally measured and simulated flow when a 20 Pa pressure drop is applied to the knitted fabrics. For all fabric types, the simulations show good agreement with the experimental air permeabilities. Notably, the knitted fabrics composed of smooth yarns exhibit the most pronounced deviation.

Comparison between air permeability determined through simulation and those measured experimentally.
The maximum relative deviation between simulation and experiment is 31% for E24-G. This discrepancy can likely be attributed to the fact that these fabrics possess the lowest yarn porosity (

Comparison between air permeabilities determined through simulation and measured experimentally with R-squared.
The results show that the predominant factor affecting air permeability is the presence of macroscopic pores, as present in the M-type and G-type fabrics. Fabrics with visually larger macropores resulting from their loop geometry exhibit the greatest air permeability. Conversely, when distinct macropores are no longer present, as is the case with fabrics knitted from textured yarn (T-type), air permeability diminishes significantly due to the primary airflow occurring through the porous yarn structure.
Prediction of effective diffusivity (
)
In Figure 22 the values of effective diffusivity

Comparison between effective diffusivity determined through simulation and those measured experimentally.
Unlike the permeability, the values of the effective diffusivity exhibit minimal variation among the different fabric samples. This may be attributed to the closely matched overall structure and porosities of each fabric sample. In addition, the correlation for the effective diffusion coeffienct (equation (12)) highlights that only porosity influences effective diffusivity, while fiber diameter has no discernible impact on it. However, the fabrics from texturized yarns have significantly lower air permeability, they still show comparable effective diffusivity in the same range of the other samples, due to their high overall porosity.
When addressing deviations, it is worth noting that our R-squared value is 0.7369, as illustrated in Figure 23.
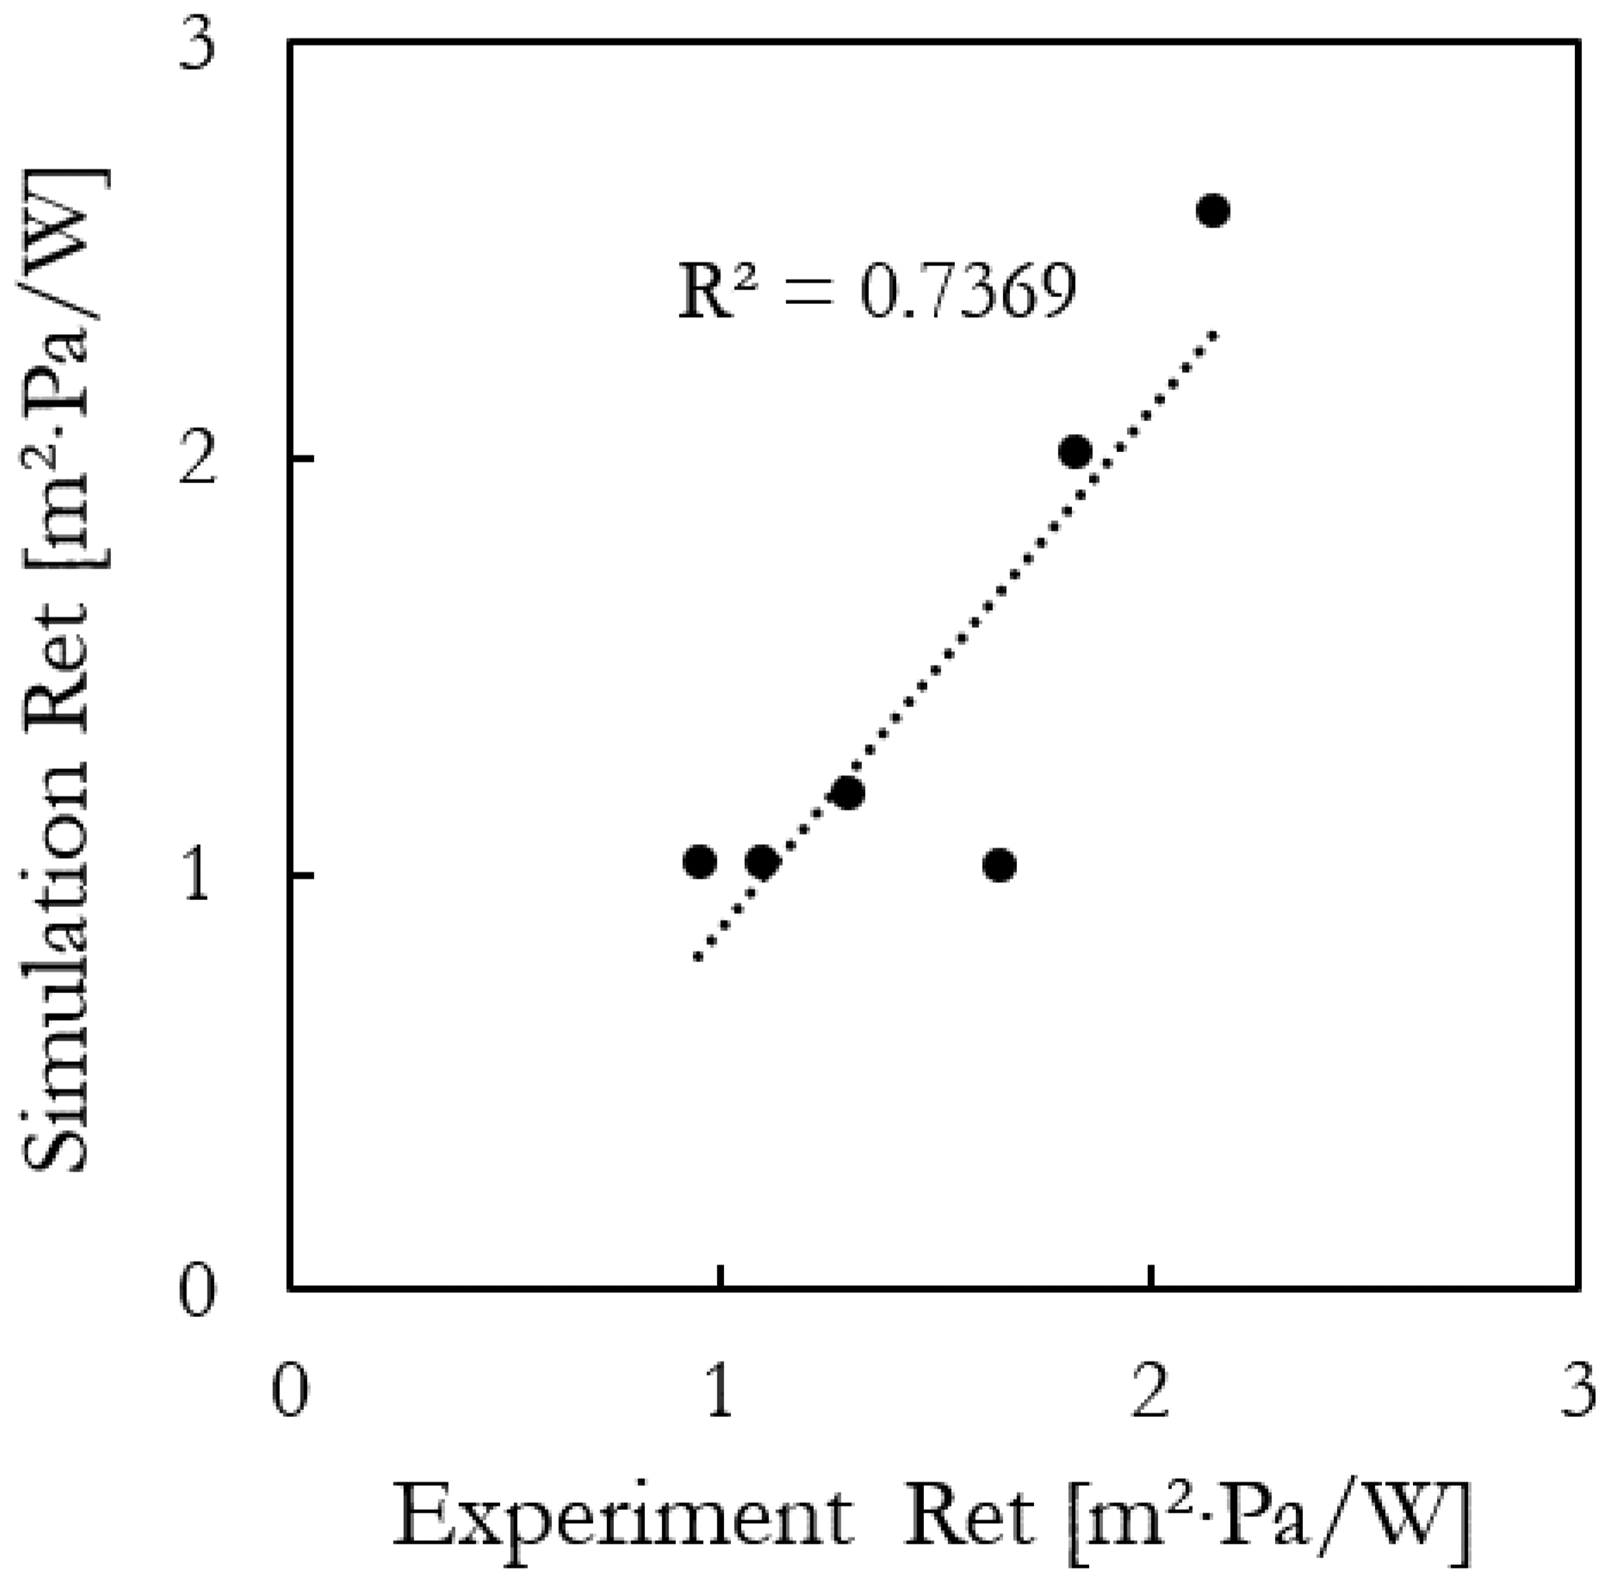
Comparison between the Ret values determined by simulation and experiment with its corresponding R squared value.
It is important to acknowledge that the certainty of our measurements might be somewhat uncertain, considering the low
Conclusions
In conclusion, the presented workflow has demonstrated its efficiency in predicting the air permeability The model offers a cost-effective method of characterizing knit fabric properties, reducing the need for extensive physical testing and experimentation. The model is just relying on geometrical parameters of the knitted fabric and simply available data of the yarn. For six different fabrics made of yarns ranging from monofilament to multifilament, an accuracy of An accuracy of The workflow is suitable for all single jersey knitted fabrics from materials that have no significant moisture uptake and shrinkage. The workflow can easily be extended to more complex patterns or even far abstract geometrical representations. As the computed REVs differ from the microscopic images, it can be stated that the porosity is the governing property for gaseous transport in knitted fabrics. Macropores define the air permeability, overall porosity defines evaporative resistance.
However, it is important to acknowledge certain limitations inherent in this method:
While the loop geometry employed in the simulation is a valuable approximation, more complex loop models as in Kyosev et al.
37
are available and can be a scope of future improvisation of the workflow. The assumption of a constant yarn diameter might not fully capture the intricacies of real-world yarn variations and could be improved. The influence of filament cross-section on permeability within the yarn might be a factor that should be considered for a more comprehensive analysis. In addition, the absorption of moisture leading to swelling of the fibers is currently disregarded, which could be an important aspect to incorporate for a more accurate representation and future development of the model. Furthermore, the current model does not account for permeability and diffusivity anisotropy, an important aspect of some knitted fabrics in which air flow and moisture transfer vary in different directions.
Despite these limitations, the method presented here is a promising advancement in digital textile engineering. In essence, this approach holds the potential for providing greater control over fabrics functional properties to tailor the fabric to its specific application; for example, in filtration, wound care, and membrane technology. It should serve engineers, designers, and product developers in many fields in order to estimate if a certain textile is suitable for the use case or not. In most of the cases, little information about fabric and yarn is available, and a rough estimation of the transport parameters is enough to decide whether a knitted textile fits the requirements or not.
Footnotes
Declaration of conflicting interests
The author(s) declared no potential conflicts of interest with respect to the research, authorship, and/or publication of this article.
Funding
The author(s) disclosed receipt of the following financial support for the research, authorship, and/or publication of this article: The author(s) gratefully acknowledge the funding of the German Research Council (DFG) – project number 453311482.
