
Abstract
Child homelessness has recently reached levels unprecedented in the United States since the Great Depression. Contemporary research has attempted to isolate the effects of homelessness on education, with mixed results. This study reports results from a study in one large urban area and finds that there is no meaningful difference in achievement between homeless and housed low–socioeconomic status (SES) elementary school students. Furthermore, we find that attendance is a mediator of lowered achievement and that commonly suspected school-level characteristics do not predict homeless student success. Implications for policy, practice, and research are discussed.
Introduction
Homelessness is a difficult topic to study. Definitions are elusive, populations difficult to estimate, and effects hard to isolate. Nonetheless, researchers agree that the face of homelessness in the United States has changed dramatically in the past half century: Once comprised primarily of single men, the homeless population now includes a significant number of families with children. Although some experts believe that homelessness may actually be more prevalent in rural areas, the majority of research on this phenomenon is situated in urban areas, where subjects are simply easier to find. Cities are more likely to have shelter systems, relatively easy points of entry for researchers, whereas people experiencing homelessness in rural areas are more likely to be camping in hard-to-find places or sleeping in cars (National Coalition for the Homeless, 2007b). Even though actual homeless counts vary greatly, Bassuk (2010) asserts that “1.5 million children experience homelessness in America each year” (p. 496). The most recent Annual Homeless Assessment Report (AHAR) to Congress provides a much more conservative estimate: 346,620 children in homeless shelters at some point during 2010 (HUD, 2011). The National Center for Homeless Education (NCHE) estimates that 794,600 school-aged children were homeless in 2009 (NCHE, 2009). In 2010, the National Association for the Education of Homeless Children and Youth (NAEHCY) reported a 41% increase over the previous year, with 956,914 homeless children enrolled that year (NAEHCY, 2010). In 2010-2011, the NCHE (2012) reported a 13% increase, bringing the total to 1,065,794 homeless children in schools across the country. Despite a lack of consensus on exact numbers, however, all reports point to a problem of homelessness among families unprecedented in the United States since the Great Depression, and continuing to grow (Bassuk, 2010).
Although difficult to operationalize and measure, homelessness is believed to affect children in profound ways, possibly different from the ways they are touched by poverty writ large. Many studies have found that in addition to logistical and procedural barriers to school access, homeless children experience physical, developmental, mental health, and educational problems at much greater rates than national norms. Likewise, new research linking stress to learning difficulties (Evans & Schamberg, 2009) is relevant because the homeless experience is often correlated with great stress (Grant et al., 2007). To date, however, research is inconclusive on whether students experiencing homelessness fare worse at school than their housed peers from low–socioeconomic status (SES) backgrounds (see Buckner, 2008).
This article presents the results of a quantitative analysis of student test score and housing status data from a large Northeastern city. The term city is used synonymously here with urban area. Although the word urban is often used as a euphemism for high-poverty areas or ones whose residents are largely non-White (Milner, 2012), this article uses “urban” quite literally, relying on the U.S. Census Bureau definition of “urban” as an area with an overall population over 50,000 people and population density of at least 1,000 people per square mile. This city is what Milner (2012) calls “urban intensive,” a large, densely populated major metropolitan core human settlement. For the purpose of this study, an urban area is also one expected to have a system of identifying and sheltering homeless individuals and families in some formalized way. The present study is centered on three questions: one, is housing status a predictor of elementary student achievement, after controlling for common covariates of achievement like poverty and race? Two, if there is a significant relationship, is it mediated by attendance, a suspected correlate of both homelessness and achievement? And three, what school-level characteristics, if any, predict homeless student success? Answers to these questions lend support to urban policy, practice, and research directions.
Theoretical Framework
Experiencing homelessness is undoubtedly difficult for adults, but research demonstrates that it can be devastating for children. Particularly in the area of educational outcomes, research has shown again and again that test scores (e.g., Dworsky, 2008; National Center on Family Homelessness, 2009; Robertson, 1992; Rubin et al., 1996) and grades (e.g., Rubin et al., 1996) are lower for homeless students, whereas drop-out rates are higher (Masten et al., 1997; Rouse & Fantuzzo, 2009; Tucker, 1999). Homeless children are also more likely than the general population to be retained (Bassuk & Rubin, 1987; Hart-Shegos, 1999). Some studies have found that homeless children fare worse in these domains than very low-income housed children as well (e.g., Buckner, Bassuk, & Weinreb, 2001).
In general, the effects of homelessness on children can be separated into four categories. Homeless children are commonly faced with logistical and procedural barriers to enrolling in school. Next, they are plagued by physical ailments. Homeless children also suffer from mental health issues at greater rates than children in the general population. Finally, homeless children often face educational readiness challenges. 1 These factors come together to decrease the likelihood that homeless children will attain school success. But three decades of research have failed to reach consensus on whether homeless students perform more poorly in school than their housed low-SES peers. Research has shown that homeless students underperform when compared with middle-class children, but the question of whether or not academic achievement is lower for homeless children than their stably housed low-income peers has yet to be settled. This study attempts to add to the discussion by providing recent empirical evidence from a large urban area in the Northeastern United States.
Data and Method
This study used administrative data provided by the education department of a large Northeastern city. Student test scores, demographics, and housing status data were provided for the 2007-2008 and 2008-2009 school years. Data were provided for third through eighth grades, but only third through fifth grades were included in the analyses. The decision to focus on elementary school was made to limit the analysis to children who are homeless with their families, as opposed to unaccompanied homeless youth, who have distinct needs and characteristics (Robertson, 1992). In addition, rather than focusing on scores in the whole city, the final analysis focuses on the two sections of the city (hereafter referred to as “District A” and “District B”) with the lowest median incomes and highest percentages of residents living in poverty (U.S. Census, 2010) because of the relative homogeneity and geographic proximity of their populations. Although including the entire city in the analysis would potentially make my results more generalizable, limiting it to these two districts lessens the likelihood that non-school factors such as race, income, neighborhoods, and their unobservable correlates will bias the results, as Districts A and B tend to be more homogeneous than the city as a whole. They are both largely impoverished areas with a majority of students of color. Because the overall city is so large, however, even limiting to these two districts still yields an area that fits Milner’s 2012 classification of “urban intensive,” one “where the sheer numbers and density of people . . . in the schools can make it difficult to provide necessary and adequate resources” to students and the overall number of residents is more than 1 million (p. 559). If the more affluent areas of the city were included in the analysis, it is likely that schools in those areas would have higher homeless student scores for reasons not captured by administrative data and not likely related to school programs and practices; peer and/or neighborhood effects might affect scores. 2 Likewise, in this city, schools in wealthier neighborhoods often benefit from fundraising and donations given to the school by parents—This source of funding would not be captured in the per-pupil expenditure data available to the public and could further skew results.
Because the city provided information for the complete population of students in its public schools, the descriptive analysis is conducted for the full population described above. It includes students from Grades 3 to 8, though only Grades 3 to 5 are included in the regression analyses. Not all records are complete, and missing data cannot be assumed to be missing completely at random. There are three possible relationships between the missing data and test scores. One, it could be completely random, though this is unlikely. Two, students who have less housing stability might be likely both to score lower and miss school on test administration days, biasing the effects of homelessness and making the negative impact of homelessness seem smaller than it really is. Three, those students who have the greatest and most obvious problems in school might be more likely to be identified as homeless and to receive support services from the school, the shelter, and other community agencies, making them more likely to attend school on test days. This could bias the effects of homelessness upward, overestimating the negative impact of homelessness on test scores. It is also possible that many homeless students were not tested, or that many students have not been correctly identified as homeless.
Independent Variable
In the first set of regressions, the independent variable of interest in the analysis is homelessness. There were approximately 6% third through fifth graders who experienced homelessness during the 2008-2009 school year. In Districts A and B, that number was over 7%. Some research indicates that 2% of all children, and 10% of poor children, experience homelessness (National Coalition for the Homeless, 2007a). Table 1 shows the breakdown of housing status within the group of homeless third- to fifth-grade students in the city. Unfortunately, it shows that the majority (79%) of homeless students’ residence types were unknown. Of those known and verified by the district, 16% were in shelters and 5% were doubled up with another family. These numbers are very similar in Districts A and B.
Homeless Residence Type (Citywide).

As reported in this data set, the district verifies address changes. When students or parents tell the school that they are in temporary housing, the verification involves contacting the shelter and making sure students are indeed living there. Because the onus for conducting this verification seems to fall on already overburdened school office staff, it is not surprising that many address changes are not verified and therefore cannot be confirmed. However, some publicly available data are available to corroborate the numbers in this data set. Previous research indicated that homelessness affected 5% of some cities’ populations (Culhane & Metraux, 1999), but newer estimates in this city put that number closer to 10%. In addition, a disproportionate number of the homeless families in the city come from Districts A and B. As homelessness is correlated with poverty and these two districts also have higher poverty rates than other parts of the city, it is reasonable to conclude that the homeless percentage should be higher in those districts. Some research suggests an overlap between highly mobile and homeless families (Obradovic et al., 2009), so students who moved more than once in the 2008-2009 school year are included, transforming the independent variable into homeless/highly mobile. Doing this did not change the results of the analyses significantly, and this strategy brought the percentage of students in Districts A and B coded as homeless and highly mobile up to 8.6 of that population.
To test the relationship between having been homeless the previous year (2007-2008) and having been homeless both years, the models include these variables as well. It is important to note that the “homeless 09” variable is the effect of the current year’s homelessness, controlling for having been homeless the year before and having been homeless both years. To get the effect of having been homeless in 2008 and 2009, it is necessary to add together all three housing status coefficients.
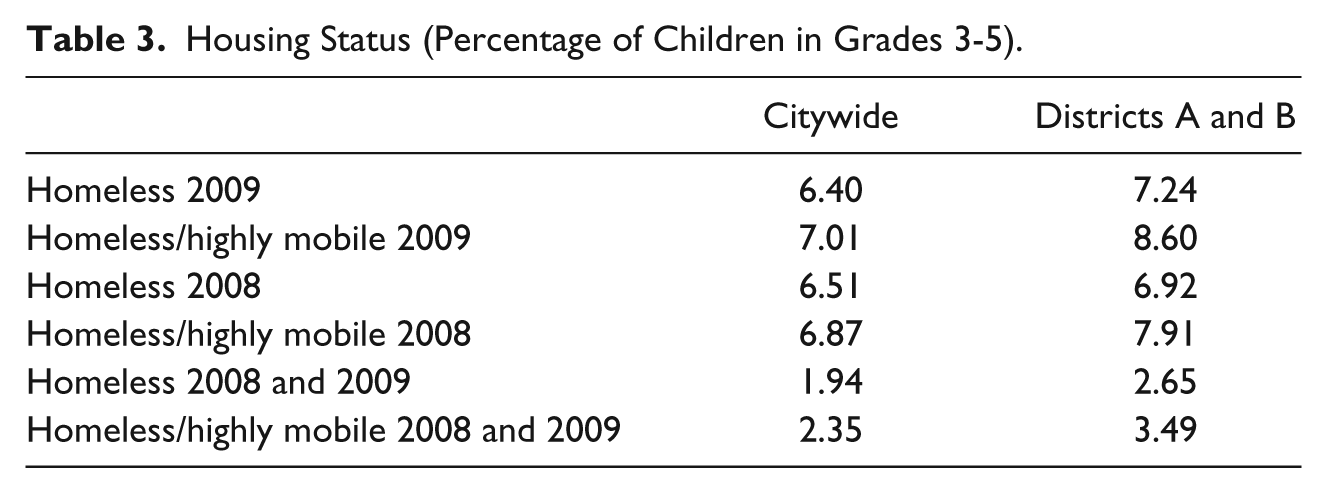
Tables 2 and 3 show the percentage of students in each of the categories (homeless and homeless/highly mobile) for each year in the city and the districts, for both Grades 3 through 8 and Grades 3 through 5. The percentage of students who were homeless both years is much smaller than the percentage of those homeless in either single year. This is not unexpected, given that the majority of families experience only one episode of homelessness, and only 8% are believed to experience multiple episodes (Culhane, Metraux, Park, Schretzman, & Valente, 2007).
Housing Status (Percentage of Children in Grades 3-8).

Housing Status (Percentage of Children in Grades 3-5).
Dependent Variable
In this city, students in Grades 3 through 8 are administered two standardized tests in May of each academic year: one in language arts, and the other in mathematics. For the reasons explained above, the analysis focuses on third-, fourth-, and fifth-grade scores. Some models are further limited to only fourth and fifth graders because they include previous achievement, and third graders do not have test scores from the previous year.
Language arts
The language arts test used here “contains several different types of questions. Students answer multiple choice questions based on short passages they read, and write responses to open-ended questions based on stories, articles, or poems they listen to or read”. Scale scores on the test range from 400 to 800 and follow a roughly normal distribution for all third through fifth graders citywide as well as within the homeless and high-poverty subsamples and in Districts A and B.
Mathematics
The mathematics test used by the city measures “number sense and operations, algebra, geometry, measurement, and statistics and probability [and] ways of acquiring and using knowledge [including] problem solving, reasoning, communication, connections, and representation”. There is no evidence that the scores are vertically equated. Also, like language arts, scale scores on the test range from 400 to 800 and follow a roughly normal distribution for all fourth-grade students citywide as well as within high-poverty and homeless subsamples.
Control Variables
Demographic factors known to correlate with test scores and poverty/homelessness are included in the analysis: race/ethnicity and participation in the federal free lunch program (a measure of poverty). Test scores generally vary in expected ways with respect to poverty: low-income students’ scores are lower than overall norms, and homeless students’ average scores are even lower. However, the sizes of these differences are very small, less than 5% of 1 SD.
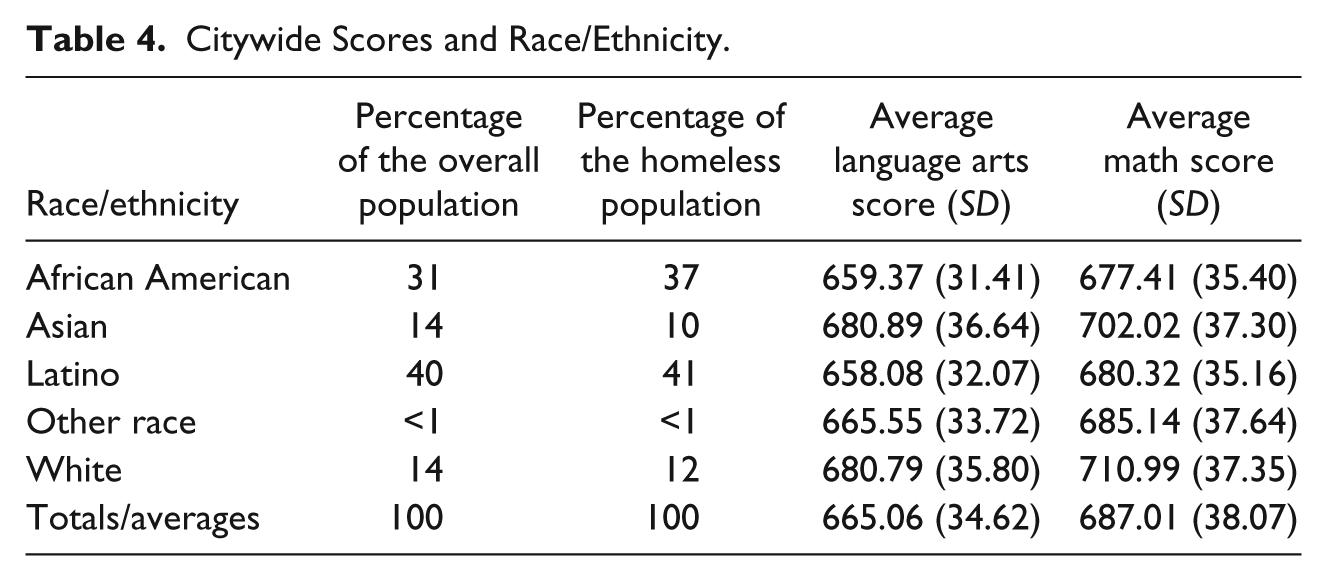
Table 4 shows that test scores vary across demographic groups in commonly encountered ways: Students who identify as Asian and White have higher scores than those who identify as Hispanic and African American. These numbers align very closely with published statistics available on the city’s website. Table 4 also shows the percentage of the homeless population comprising children in each of the racial/ethnic categories.
Citywide Scores and Race/Ethnicity.
Unfortunately, the data set does not include any measures that could be used to construct other hypothesized mediating factors (e.g., mental health). It does include suspensions, but the total number of students who were suspended, according to my data, was 67 (0.06% of all students). It is likely that there is an issue of reporting here, as 67 suspensions across two districts seem implausibly low. Because of this, suspensions are not included in the final models.
To construct a viable comparison group of low-income students, this study uses the well-established strategy of considering eligibility for participation in the federal free lunch program as a marker of poverty. It does not include students eligible for reduced-price lunch in the comparison group. Federal guidelines allow for students whose families earn up to 130% of the poverty level to be eligible for free lunch (U.S. Department of Agriculture, 2010).
Although one would expect a complete overlap between the homeless and low-income groups, only 72% of homeless/highly mobile students were coded as free lunch recipients. If reduced-price lunch was included, 86% of homeless students qualified for participation in a lunch program. It is more likely that an issue of identification or enrollment is driving these numbers rather than 14% of homeless students not meeting the guidelines for the lunch program. It is easy to imagine that homeless parents might fail to enroll their children in the free lunch program, owing to the enormous stresses of simply trying to survive a homeless experience. Parents in homeless situations, like their children, are also likely to suffer physical and mental health challenges that might interfere with their ability to complete paperwork at school. Although schools are legally required to allow homeless students immediate participation in the free lunch program, it is also possible that they delay in completing enrollment paperwork for these students, which would lead to a lack of free lunch identification.
Another important control variable included in the analyses is special education participation. Homeless students are believed to be less likely than housed students to be identified by the school as having a learning disability (Duffield, Heybach, & Julianelle, 2007), so a homeless student having a special education classification may well have been identified in a year prior to the homelessness episode. Table 5 shows the proportion of each subpopulation identified as receiving special education services.
Participation in Special Education (%).

Note. HL/HM = homeless/highly mobile.
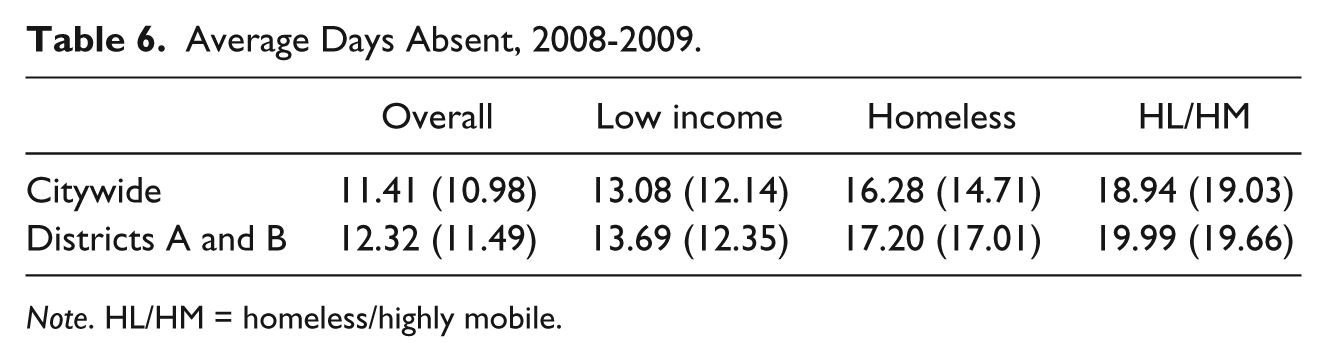
Because the literature indicates that attendance is one factor that might link homelessness and lower achievement (e.g., Dworsky, 2008), this variable is also included in the final model. However, if homeless students qualify for services but are not identified as such at school, this effect might be captured by the homeless variable. Table 6 shows the distribution of absences across the subpopulations.
Average Days Absent, 2008-2009.
Note. HL/HM = homeless/highly mobile.
Although, as Rubin and colleagues (1996) remind us, “it is well known that when using a cross-sectional study design, a causal relationship cannot be confirmed” (p. 292), it is nonetheless informative to examine relationships between housing and academic performance in the data for correlations that point toward further study. Because students are not randomly assigned to a homeless condition and homeless students are not randomly assigned to schools, multiple regression is used to estimate the effect of housing status on test scores while controlling for factors likely to vary with both scores and homelessness: income, race, previous homelessness, and participation in special education. Previous achievement is included to account for the level at which students started the year. The final model also includes the mediating variable of attendance, as it is suspected to be a link between homelessness and achievement. Higher absence is known to be associated with homelessness and is also believed to be associated with lower achievement. Controlling for these variables allows the model to isolate the effects of housing status and examine the role of attendance as a mediating factor. The final model of interest is estimated as follows:

where Y is the dependent variable of either math or language arts test score, i indexes students, H is a vector of homelessness/high mobility, L is a marker for low income, R represents the student’s race/ethnicity, S indicates whether a student has a special education classification, and P is the student’s test score from the previous year, and A indicates the number of days a student was absent. The βs are coefficients to be interpreted and ϵ is the error term.
To adjust for clustering, that is, students within schools are likely to resemble each other in important ways (Rogers, 1993), the Huber–White correction was used to produce robust standard errors in the first four models. The analysis also includes a fifth model that uses school fixed effects. This model has the benefit of controlling for any unobservables at the school level, as it is likely that there are some characteristics common to students within a school that cannot be or have not been measured. For example, if teacher quality were better in some schools than others, using school fixed effects would control for this.
Results
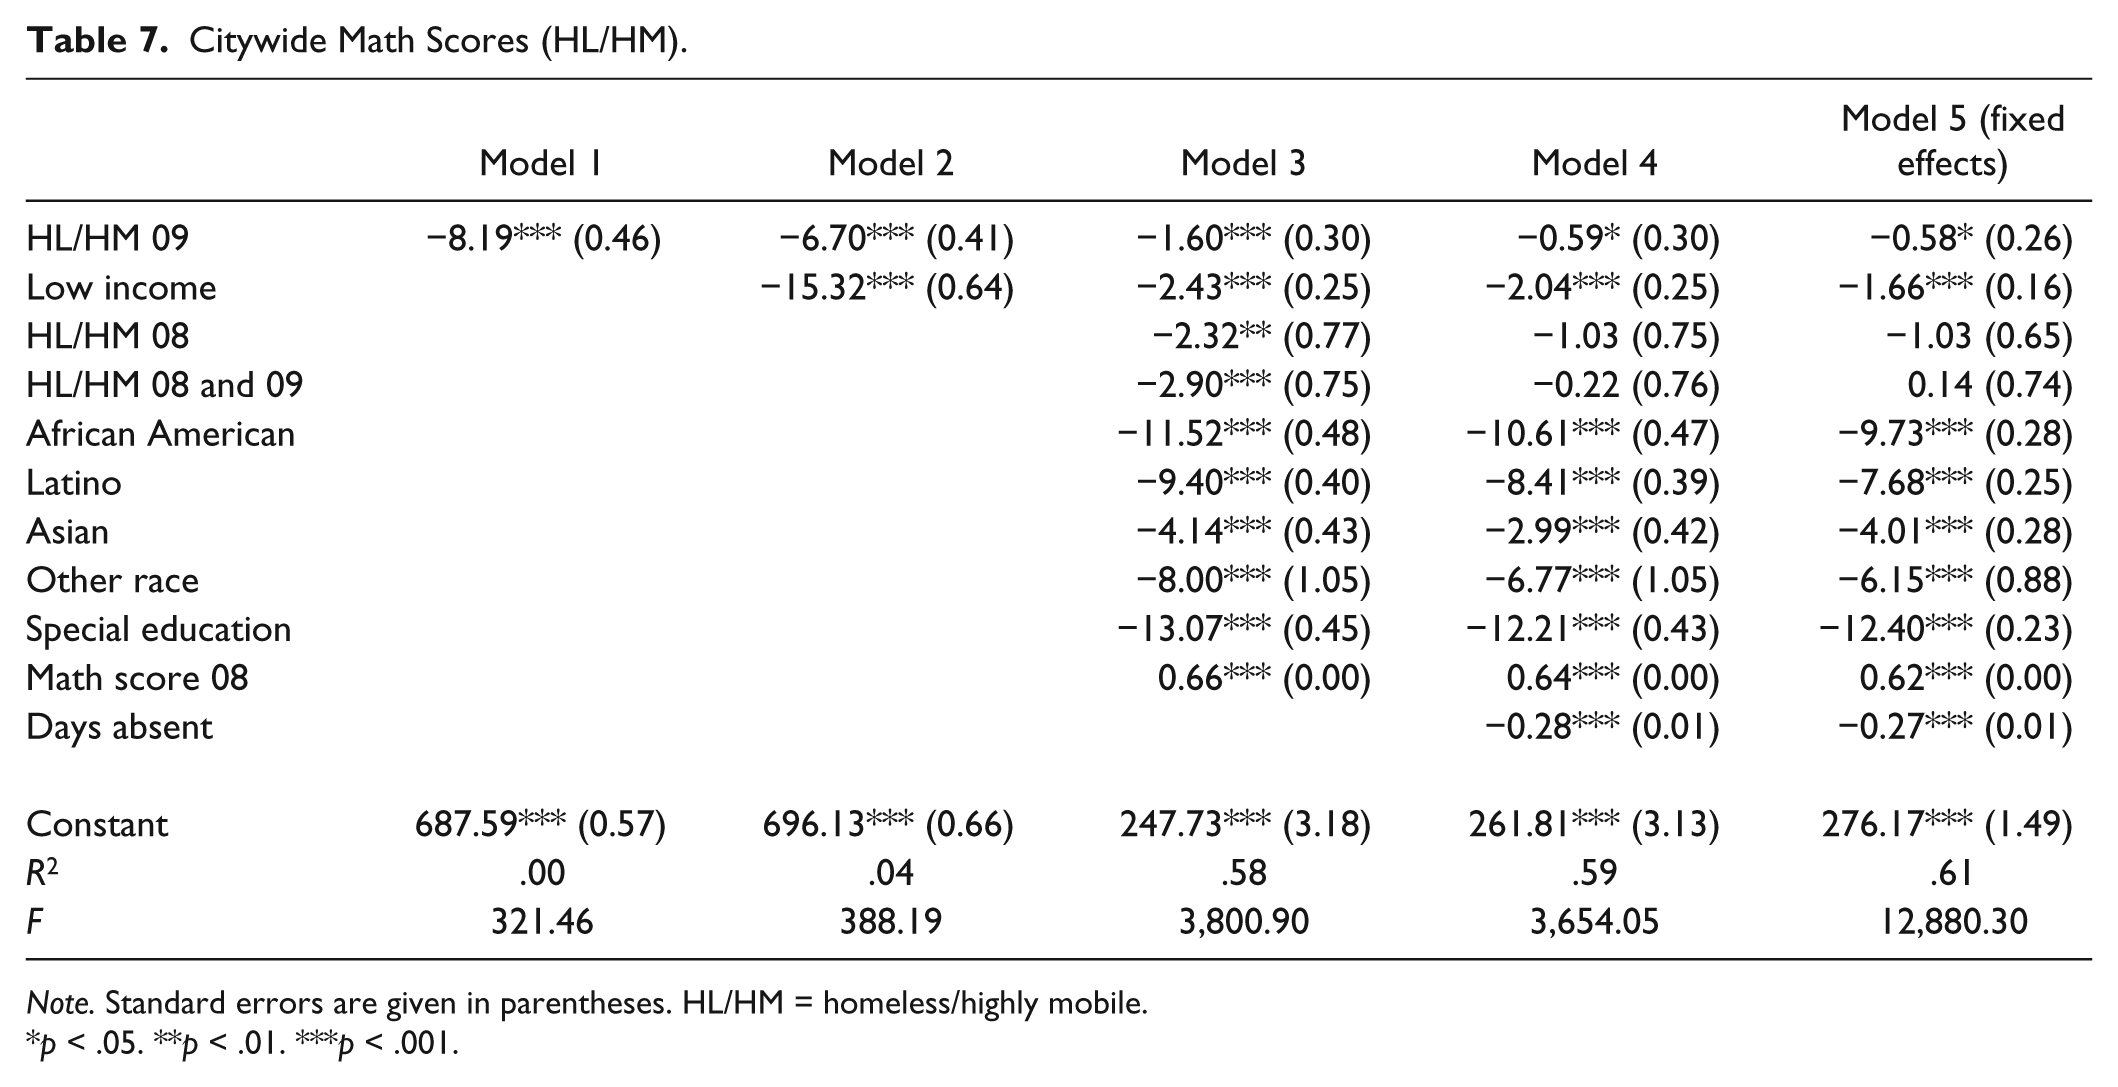
Table 7 shows that homelessness/high mobility in the tested year (2009) is associated with math scores that are 8.19 scale points (0.22 SD) lower across the city as a whole. The size of the coefficient shrinks to −6.70 points (0.18 SD) when income is added in Model 2. In Model 3, when income, previous homelessness, race/ethnicity, participation in special education, and previous achievement are added, the effect of experiencing homelessness only in 2009 remains significant but shrinks to −1.60 points (0.04 SD). Having been homeless only in the previous year is correlated with a drop of 2.32 points (0.06 SD). To understand how having been homeless in the both 2008 and 2009 is related to test scores, it is necessary to add the independent effects of 2009 homelessness (−1.6 points), 2008 homelessness (−2.32 points), and the added impact of having been homeless both years (−2.90 points), which totals −6.82 points (0.21 SD).
Citywide Math Scores (HL/HM).
Note. Standard errors are given in parentheses. HL/HM = homeless/highly mobile.
p < .05. **p < .01. ***p < .001.
Housing status remains a significant predictor, though tiny in magnitude (−0.58 points or 0.02 SD) in the final model when attendance is included as a hypothesized mediator between homelessness and achievement. The attendance coefficient seems small (−0.28 points), but when multiplied by the average number of days homeless students miss school (almost 20), it becomes more meaningful (−5.6 points or 0.15 SD). The strongest predictors of math achievement in the final model are not related to housing status but to race and special education participation.
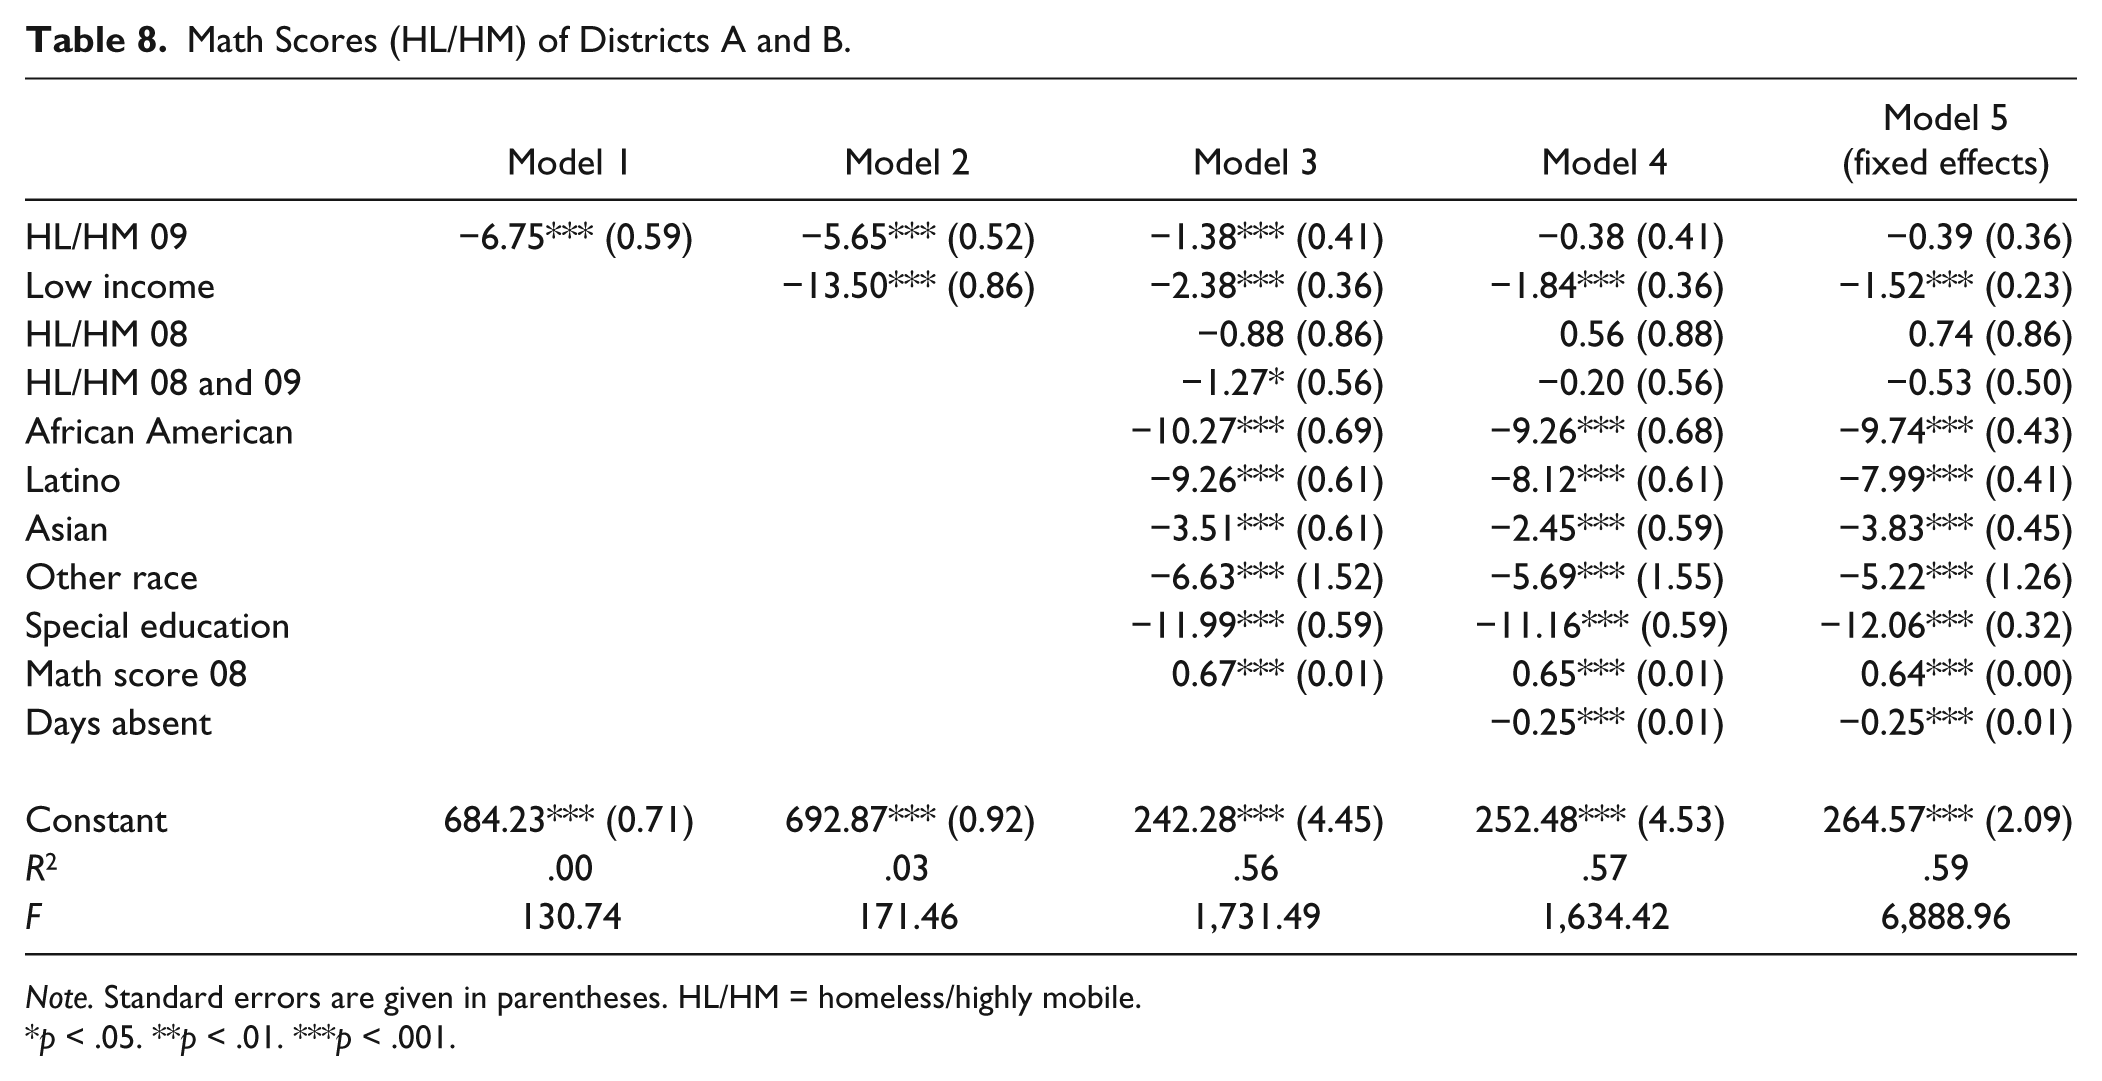
Table 8 shows similar relationships between math score and housing status in Districts A and B together. With no controls, homelessness/high mobility is associated with a 6.75-point (0.18 SD) drop in the scale math test score; when income is added to the model, the effect falls to −5.65 points (0.15 SD). Controlling for previous homelessness, inclusion in special education, and previous achievement reduce the effect to −1.38 (0.04 SD), and this effect disappears once absences are added into the model. Days absent has a small negative effect (about −0.25 points or 0.01 SD) that, like above, becomes larger when multiplied by the average number of days missed by homeless children (20), rising to 5 points (0.14 SD). Nonetheless, as in the city taken as a whole, race and special education status are the strongest predictors of the test score in Districts A and B. In the final models, housing status has no relationship with math scores in these districts.
Math Scores (HL/HM) of Districts A and B.
Note. Standard errors are given in parentheses. HL/HM = homeless/highly mobile.
p < .05. **p < .01. ***p < .001.
Although the number of observations in each regression is not reported, it is important to note that when previous achievement is added into the model, the sample size drops by close to one third, because third graders did not take a test in the 2008 school year and therefore do not have previous test scores. However, when the analysis is run on just fourth and fifth graders, the results do not chance significantly. Likewise, regression analyses run on the homeless (not homeless/highly mobile) population produce nearly identical results.
Having been homeless/highly mobile in only the 2009 school year is a significant predictor of test scores citywide in all models, but its effect lessens once attendance is added, indicating that missing days of school may be a part of the homelessness experience that is related to low test scores. In Districts A and B, the effect of having been homeless in only 2009 disappears once attendance is added. The biggest predictor of lowered test scores in all the models is participation in special education (about −12 points, or 0.32 SD). As special education status can be considered a de facto marker of academic challenge, this is not surprising. Also, given the long-standing literature on race and scores, the relatively large coefficients on Latinos (close to −8 or 0.21 SD), African Americans (close to −10 or 0.27 SD), and Other race (about −5 or 0.13 SD) are not unexpected. The coefficients on days absent (between −0.28 and 0.25) across the models are reasonable in light of the literature on the relationship between absences and lower scores. Multiplied by the average homeless student absence rate of 20 days, this amounts to about −5 points (0.15 SD), less than the effects of some racial identification or special education status.
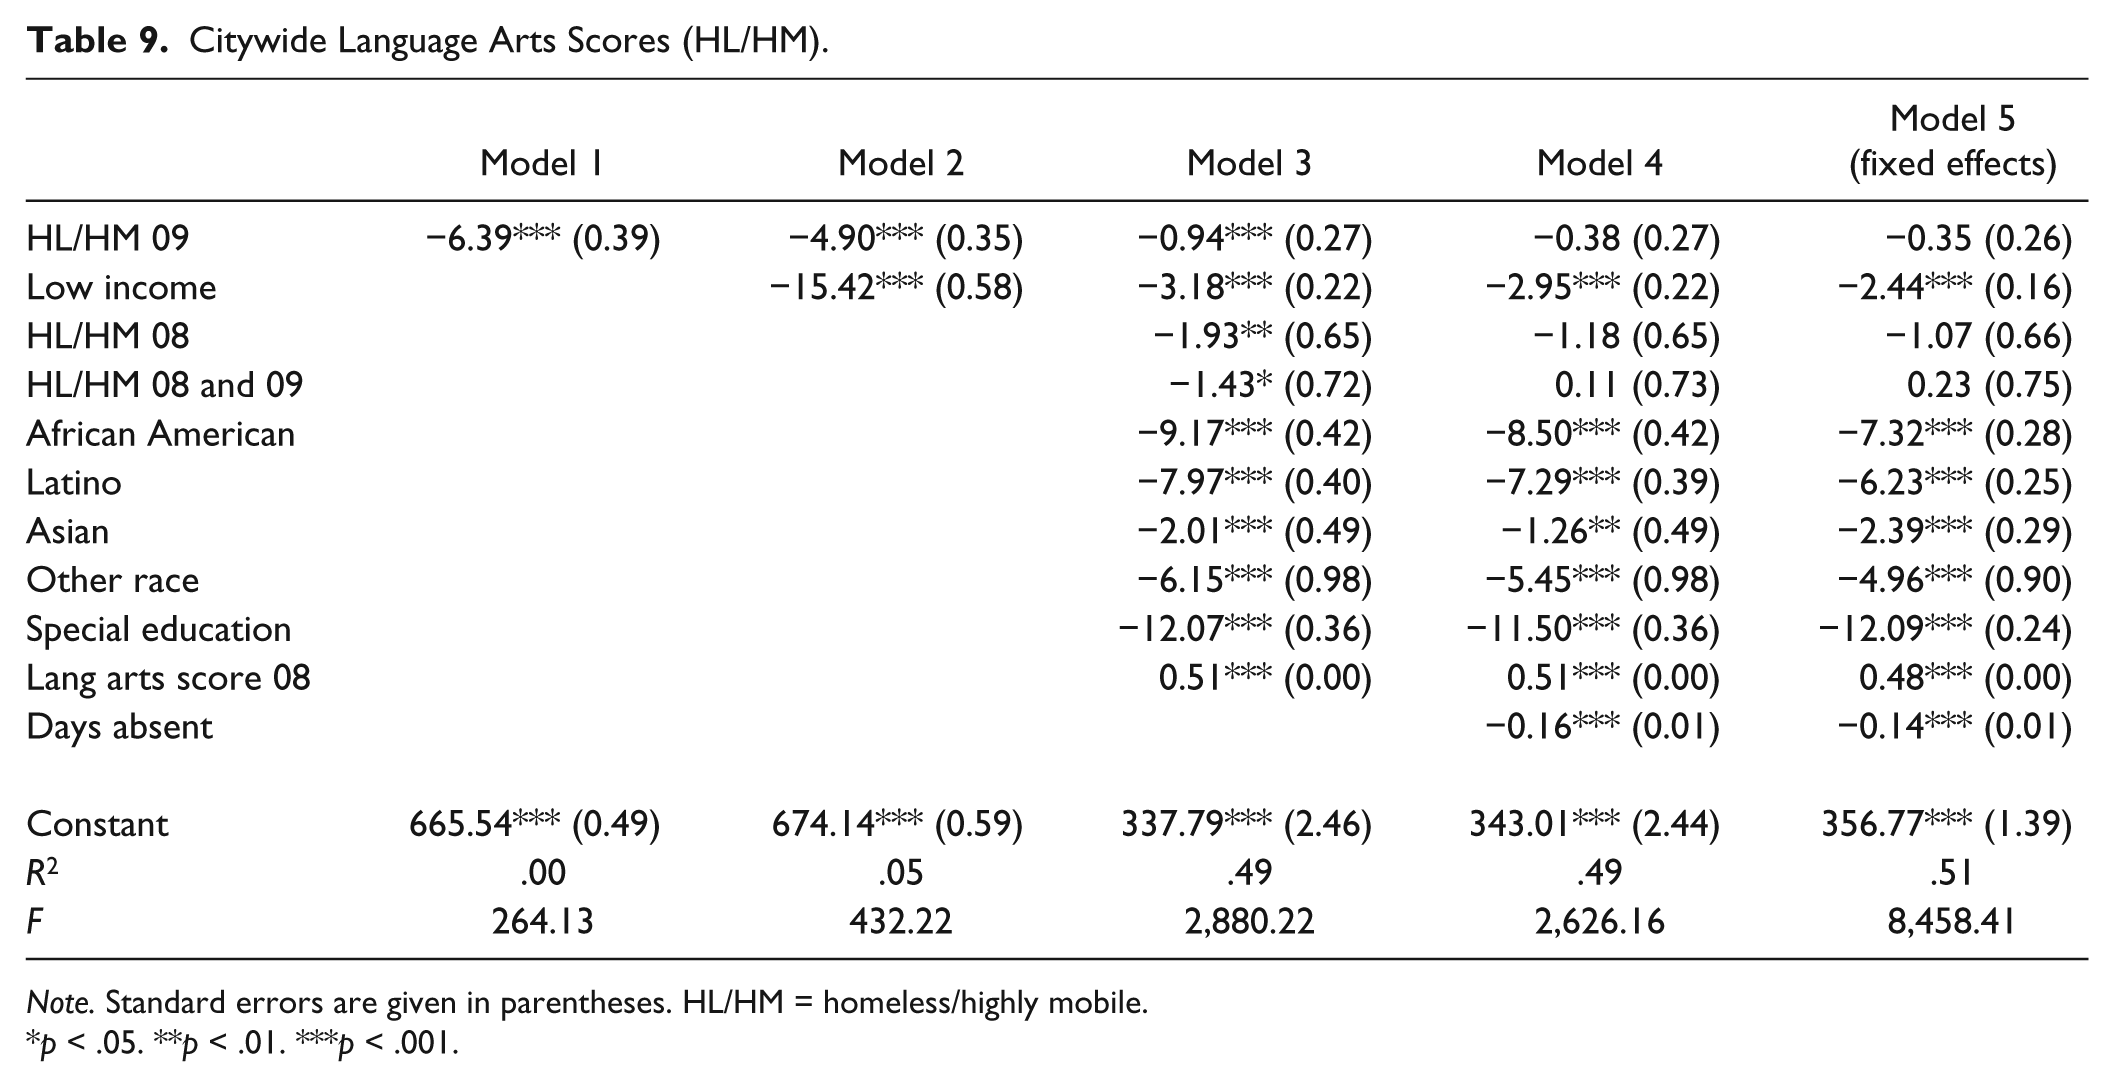
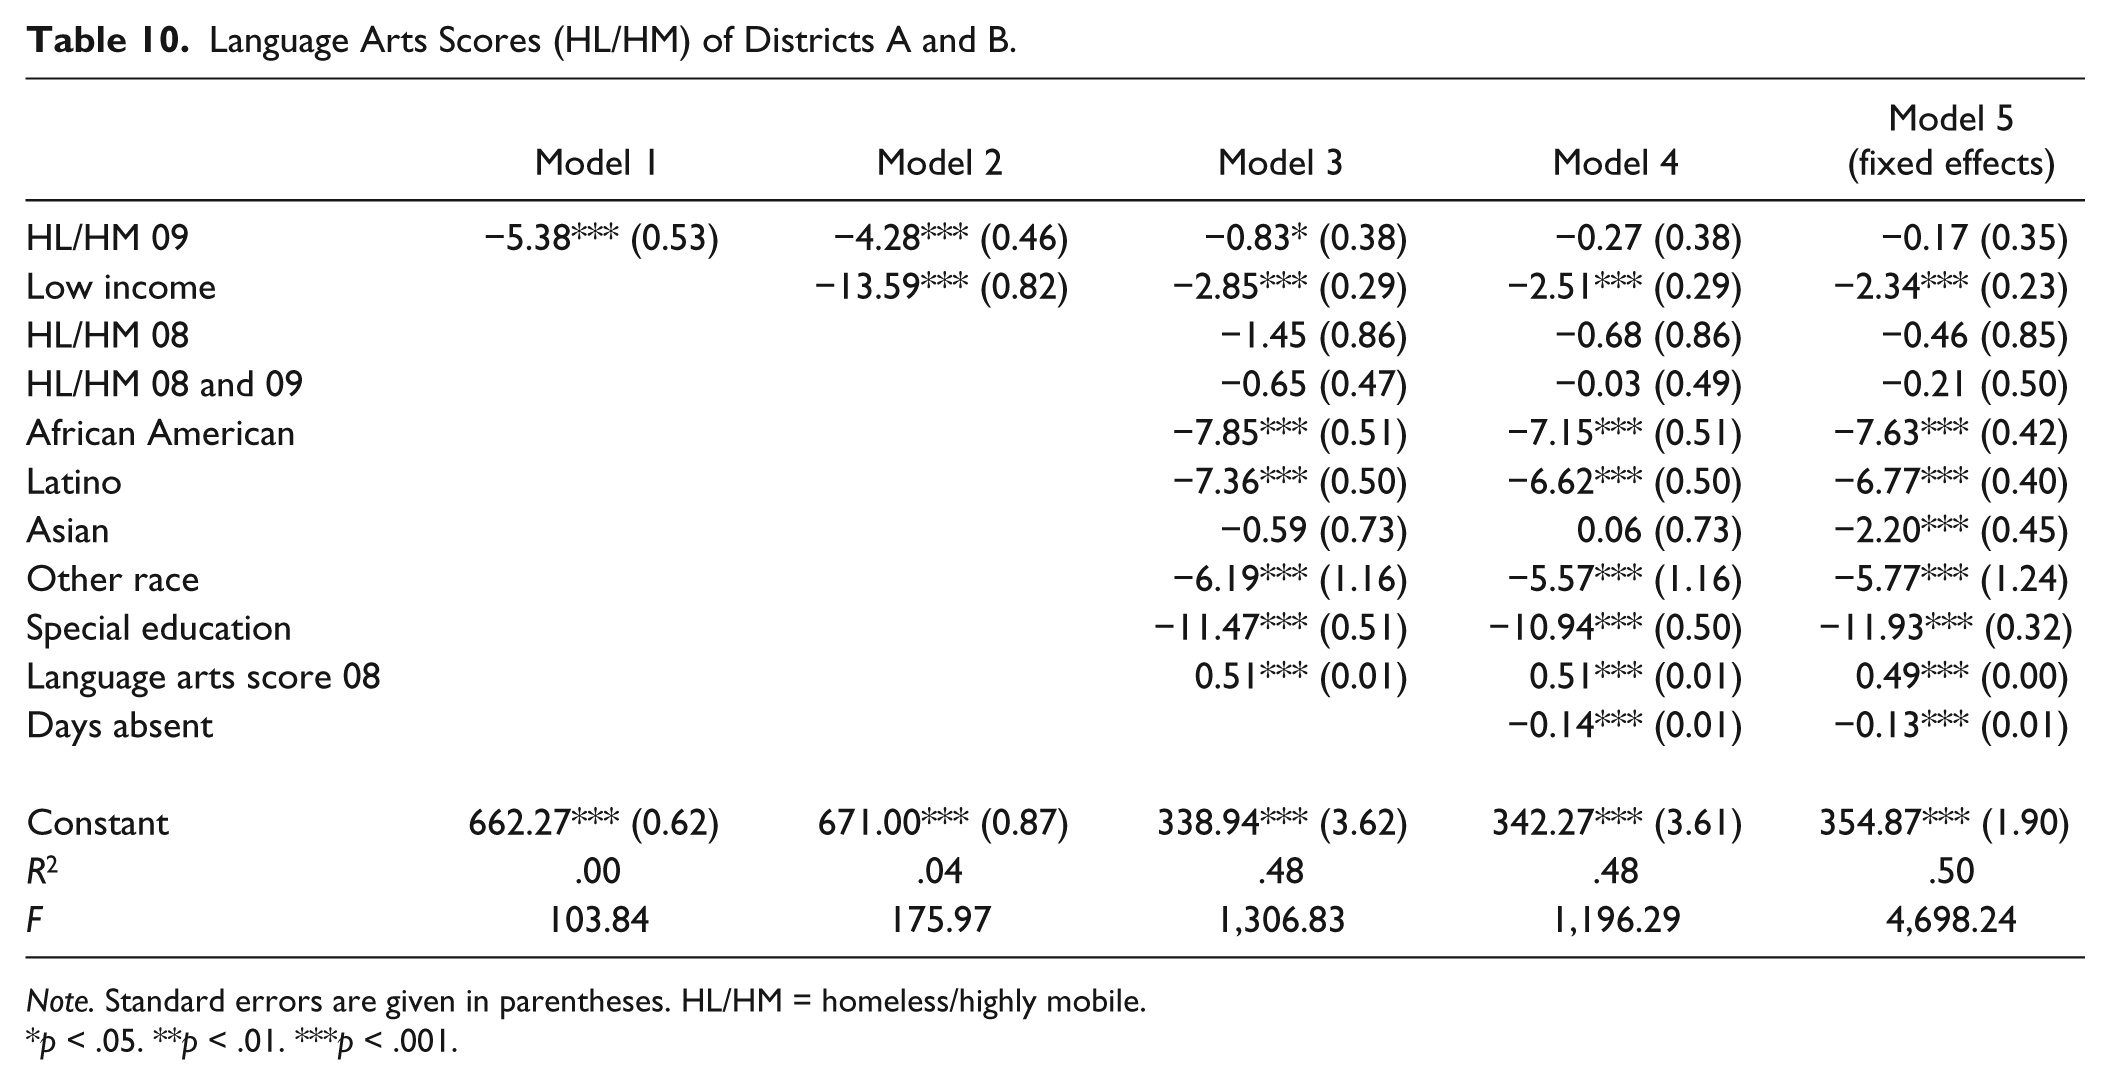
The same patterns are evident in language arts test scores. Tables 9 and 10 show that the relationship between test scores and homelessness/high mobility is negative and statistically significant citywide and in the districts until absences are included in the model. Like math scores, special education status and race are the biggest predictors of language arts scores. Not surprisingly, the coefficients on days absent are smaller in the language arts regressions: between 0.16 and 0.14 points. For the average homeless student with 20 absences, this would equal −3 points (0.10 SD).
Citywide Language Arts Scores (HL/HM).
Note. Standard errors are given in parentheses. HL/HM = homeless/highly mobile.
p < .05. **p < .01. ***p < .001.
Language Arts Scores (HL/HM) of Districts A and B.
Note. Standard errors are given in parentheses. HL/HM = homeless/highly mobile.
p < .05. **p < .01. ***p < .001.
To investigate whether and how schools affect homeless student test scores, multiple regressions of school-level data were used to predict test scores in much the same way as described above. Because the first set of regressions demonstrates that patterns in Districts A and B tend to mimic those of the city as a whole, all further analyses were restricted to just those two districts. Publicly available school-level data were merged with the data provided by the district to assemble a set that contained both student-level variables and school-level ones: the percentage of homeless/highly mobile students in a school, the school’s poverty rate, total enrollment, and average overall test scores. The final model used to estimate the relationship between school-level variables and homeless student test scores is as follows:

As above, Y is either math or language arts test score, and i indexes students. S represents the vector of student-level variables found to be significant in the previous analysis (housing status, income, race, special education status, and days absent). H is the percentage of the school population coded as homeless/highly mobile; P is the school’s poverty rate, based on parent income data; E is total enrollment; and M is the average overall student test score in the given subject. To highlight how school-level variables might affect homeless/highly mobile students in particular, the model includes an interaction term for each of the school-level variables and the student having been homeless/highly mobile in the 2008-2009 school year.
Results
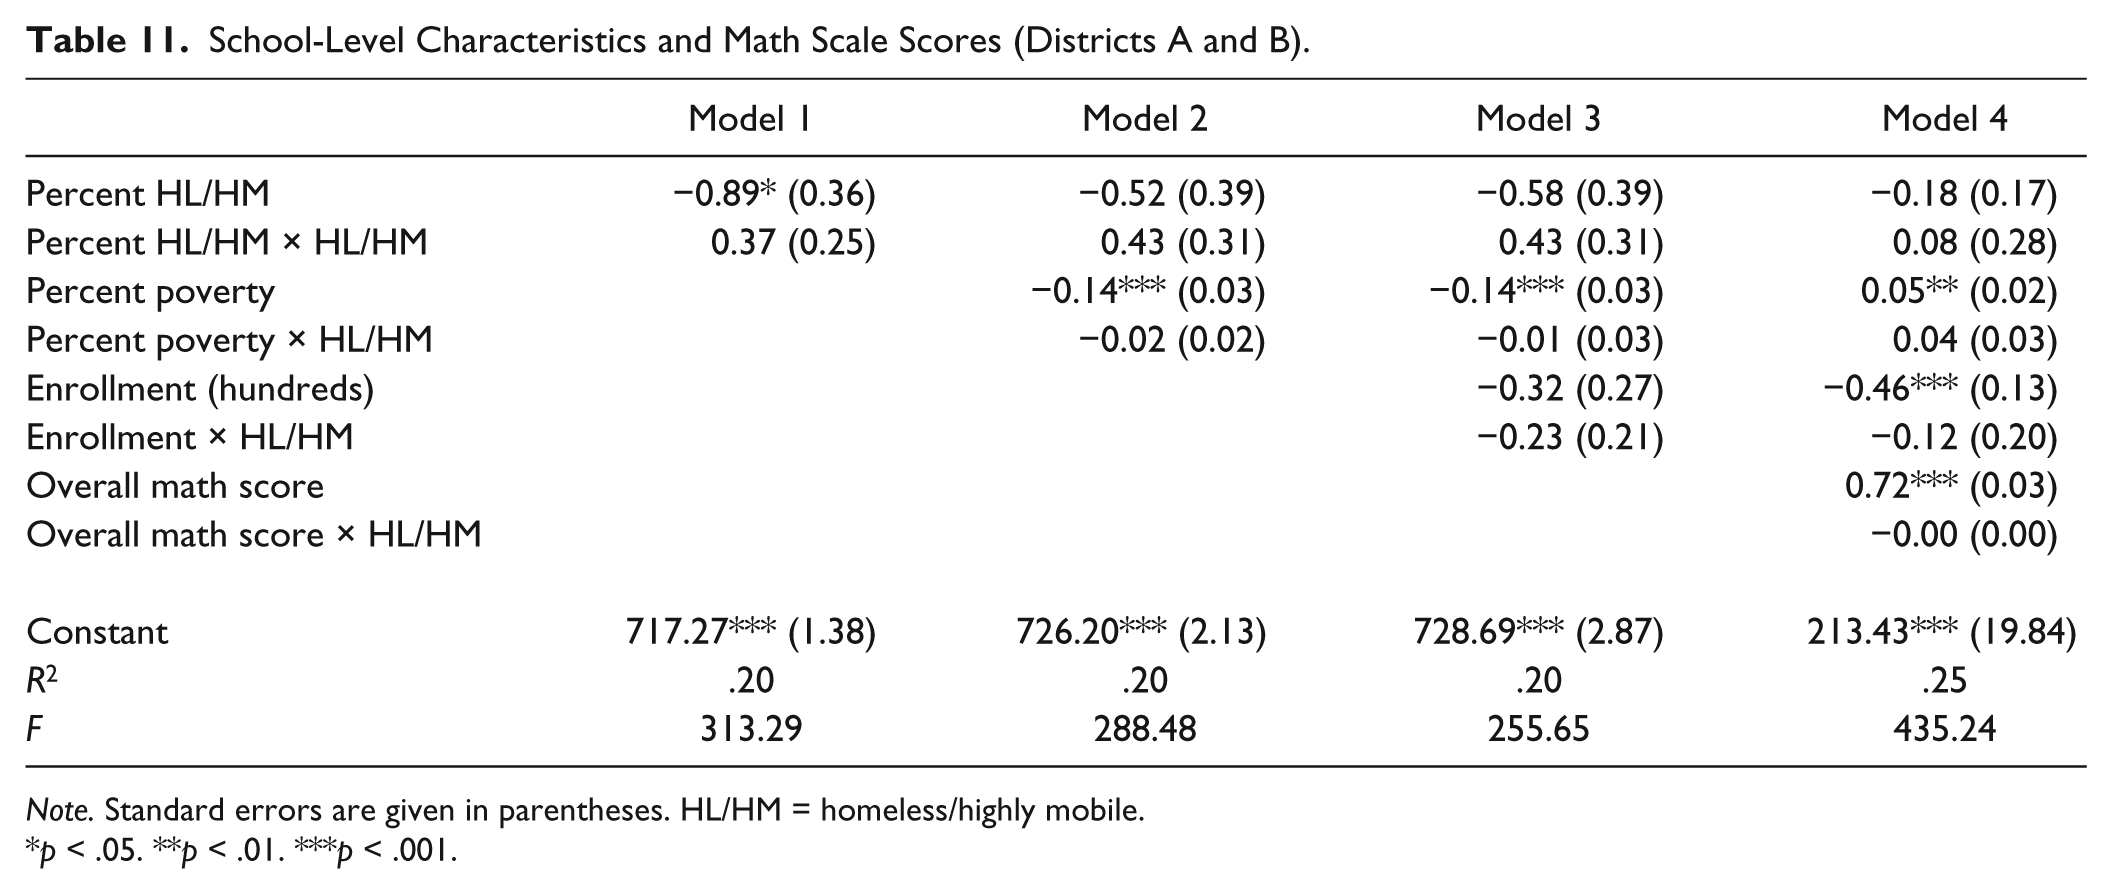
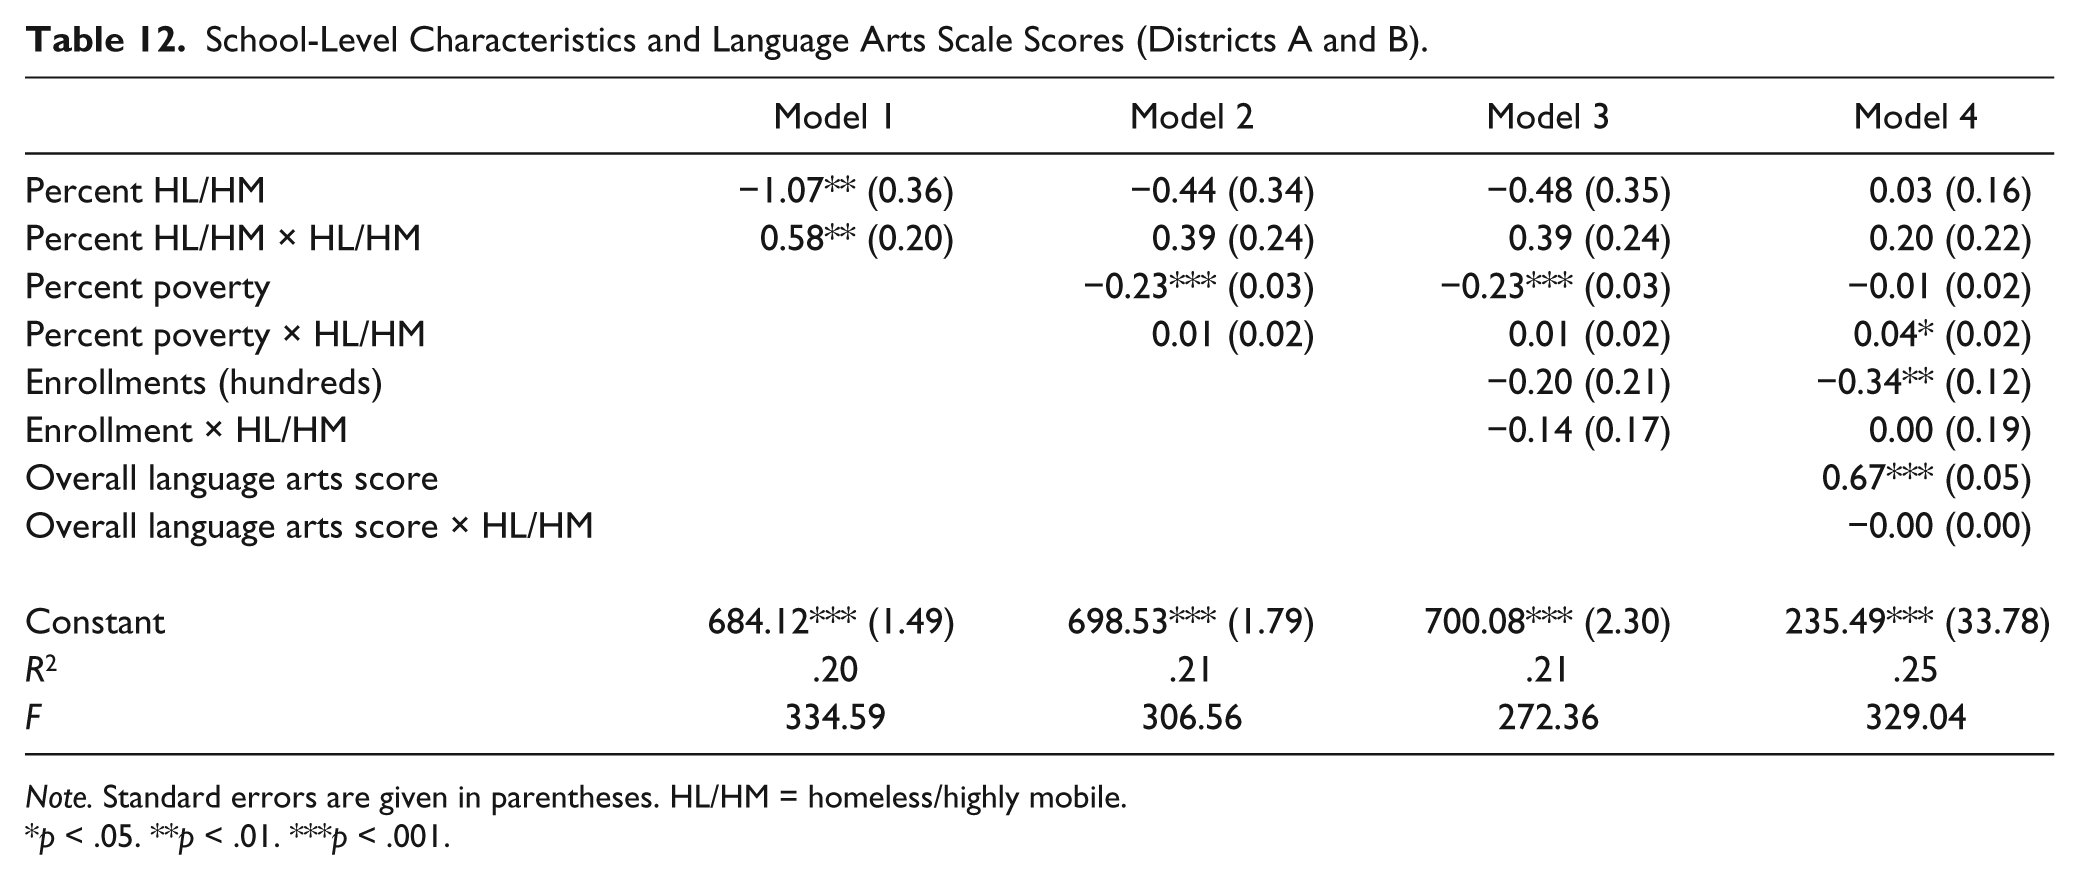
The analysis here examines the relationships between school-level characteristics and scores for homeless/highly mobile students by interacting each school-level factor with housing status. Although some school-level factors are significant predictors of non-homeless students’ test scores, none of the school characteristics are significant when there is an interaction with housing status, indicating that there is no relationship between the percentage of homeless/highly mobile students in a school, the overall percentage of students in poverty, the enrollment of the school, or the overall achievement level of students at the school and homeless/highly mobile students’ math (see Table 11) or languages arts (see Table 12) test scores. 3
School-Level Characteristics and Math Scale Scores (Districts A and B).
Note. Standard errors are given in parentheses. HL/HM = homeless/highly mobile.
p < .05. **p < .01. ***p < .001.
School-Level Characteristics and Language Arts Scale Scores (Districts A and B).
Note. Standard errors are given in parentheses. HL/HM = homeless/highly mobile.
p < .05. **p < .01. ***p < .001.
Discussion
The results of the first analysis (see Tables 7-10) indicate that in this city and in its two poorest neighborhoods, housing status is not an important predictor of academic achievement in either language arts or math. Even in models where it is significant, its magnitude is on the order of 0.02 SD, rendering it essentially meaningless. Attendance is shown to mediate these small effects, and a two-sample t test shows that homeless students have more absences than students overall in the city. Homeless students miss, on average, nearly 20 days (one full month) of school, and those only 1 SD from the mean miss nearly 40 days of instruction. Tables 11 and 12 show that none of the tested school-level factors have a significant relationship with homeless students’ scores in math or language arts.
The findings in this study—that there is no meaningful difference in achievement between homeless and housed low-SES elementary school students in this city, that attendance is a mediator of lowered achievement, but its effect is not overwhelmingly large, and that commonly suspected school-level characteristics do not predict homeless student success—indicate that it might be more appropriate to target academic interventions among all low-SES students regardless of housing status. It also supports a call for policies to address the problem of low attendance among homeless and housed low-SES students. These policy suggestions cannot be assumed to apply to non-urban homelessness, however. It is possible that because of the relatively more sophisticated shelter systems in most major urban areas, homelessness in rural areas affects student achievement in school more, or in different ways.
Policy
Although the McKinney–Vento Homeless Assistance Act of 1987 makes certain provisions to guarantee homeless students access to school, the question of their success once enrolled is not as easy to answer. Once they are in the school building, addressing the needs of homeless students apart from their housed low-income peers does not appear to be substantiated. However, one policy lever that might be useful in helping both homeless and housed low-income students would be to make students with excessive absences a measured subgroup in the next reauthorization of No Child Left Behind. Casting this kind of policy spotlight on the problem of students missing 20 to 40 days of school would help draw attention and generate funding for research to find solutions.
Practice
As far as practice is concerned, these findings suggest that, similar to the policy directions, schools would be wise to focus on devising measures to boost attendance for all low-income students rather than focusing only on homeless students. This measure would fall under Murphy’s (2009) category of a strategy intended to help all students but expected to return even greater gains for one subpopulation (homeless students, in this case). Schools can be proactive in working with homeless shelters to coordinate attendance support, and they can also focus on making sure that students’ transportation needs are met.
Research
The future of research on this question leads logically down two few paths. On the first, expanding this type of study to more cities and to non-urban areas would allow researchers greater evidence of the impact (or lack thereof) of housing status on achievement. The city studied here has a relatively sophisticated family shelter system even compared with other large cities, potentially lessening the chasm between housed and homeless low-SES children. In a city with a less developed shelter system, or a rural area with no formal shelter system, the difference between these two groups might well be greater. The second path leads to research studying the effects of attendance on achievement as well as looking for practices that successfully boost student attendance and, accordingly, achievement. A study hoping to identify best practices might help tease out ways in which some schools are able to boost student attendance meaningfully.
Conclusion
This study’s findings reify long-standing research in the field, adding evidence to the claim that homelessness is not in itself an important predictor of school achievement. Rather, it is best understood as one of many risk factors, such as poverty, race, and mobility, which threatens student success. Indeed, recent research is beginning to uncover a relationship between the stresses of living in high-poverty situations, the body’s physical response to stress, and learning difficulties (e.g., Evans & Schamberg, 2009). Homelessness often comes with more stress than stably housed poverty (Gewirtz & Edleson, 2007; Grant et al., 2007; Masten, Miliotis, Graham-Bermann, Ramirez, & Neemann, 1993), possibly offering further insight into group achievement differences. None of the tested school-level factors were significantly related to homeless student achievement in this study, further attesting to the blurry lines between students in poverty with and without housing, perhaps because homelessness is a temporary and often short-lived experience: Evidence is mounting that children who are or have been homeless have considerable school-related problems, even when barriers to educational access have been addressed. Further, there is little reason to believe that their problems are unique or largely the result of homelessness per se. Rather, homelessness appears to be a marker of very high cumulative educational risk levels likely to be shared by other children living in extreme poverty. (Masten et al., 1997, p. 43)
However, the knowledge contributed by this study does not necessarily negate a need to continue to research the needs of students who are experiencing or have experienced homelessness. As Bassuk (2010) points out, focusing on differences between these groups of children obfuscates the pressing needs of homeless children. . . . Whether homeless children are better or worse off or suffer more or less than other children may answer one set of questions but obscures others. (p. 496)
Homelessness can be viewed as one additional stressor heaped onto many children already facing life in poverty, and as such, a marker of extremely high need; studying our neediest children can help us find ways to serve a larger group. In much the way Maria Montessori’s educational philosophy was developed for a specific subset of children but has proven to be effective for the general population, studies of homeless children and how best to support their achievement at school may lead to solutions appropriate for the greater group of children living in poverty.
Footnotes
Declaration of Conflicting Interests
The author(s) declared no potential conflicts of interest with respect to the research, authorship, and/or publication of this article.
Funding
The author(s) received no financial support for the research, authorship, and/or publication of this article.