
Abstract
We utilized a pooled sample of elementary, middle, and high school–aged children identified as homeless via definitions set forth by McKinney–Vento legislation in a large urban district in California to estimate the extent to which school factors contributed to student attendance, suspensions, test-taking behaviors, and performance on state standardized achievement tests (N = 2,618 students in 111 schools). Results of multi-level models indicated that school factors, including school truancy and average school reading and mathematics proficiency rates, contributed to individual student outcomes. Students identified as English language learners or receiving special education services performed relatively more poorly than peers across outcomes considered.
Keywords
Student homelessness is prevalent, on the rise, and a risk factor for poor academic outcomes. Nearly 1.3 million school-aged students are homeless, a number that has grown since 2010 (National Center for Homeless Education [NCHE], 2014). Compared with the general population and their low-income, but housed, peers, students who experience homelessness attend fewer days of school, have higher rates of grade retention, earn lower grades, and score lower on standardized tests of reading and mathematics (Buckner, 2008, 2012; Miller, 2011a).
This problem has not escaped the attention of policy-makers. Federal legislation mandates that schools facilitate students’ access to a stable education by removing barriers to enrollment and attendance. Students who experience homeless spells are eligible to receive supportive services through their districts McKinney–Vento Program (NCHE, 2014). McKinney–Vento legislation and programming (McKinney–Vento Homeless Assistance Act of 2001) specifies a standard formula to distribute funds to state education agencies to serve identified students. The legislation guarantees a student’s right to enroll in and attend school, even if they do not possess oft required records (e.g., proof of residency, immunization records). If relevant and in the best interest of the child, the law emphasizes maintaining children in their school of origin and includes provisions for transportation. School districts must also appoint a liaison, whose responsibilities include educating the district community about the law, identifying eligible students, and facilitating access to district and school services.
Despite the central role schools and districts play in identifying and facilitating school and service access to homeless students, the potential influences of schools on this subgroup’s short- and long-term educational performance are not well-understood (Miller, 2011b; Miller & Bourgeois, 2013). With some notable exceptions (Miller & Schreiber, 2012; Tobin, 2016), most investigations to date focus on the influence of child and family characteristics on homeless students’ educational trajectories over time, typically utilizing samples of preschool and elementary-aged children. This approach, although informative about potential sources of individual and family variability in student educational trajectories, ignores the relative contribution of schools to these students’ educational performance.
The application of a school effects lens to homeless students’ academic performance holds promise to enhance research in this area, potentially providing more information about how schools can effectively fulfill their mandate. Widely applied to students in the general population, school effects approaches aim to uncover malleable school features that may enhance or constrain student school performance when controlling for student and family characteristics (for reviews, see Rutter & Maughan, 2002; Teddlie & Reynolds, 2000). Gaining better insight into the extent to which homeless students perform differentially across schools is central to the identification of additional policy and intervention levers, particularly given the recent growth of this population. Moreover, it aligns with recent calls to balance student- and family-centered analyses of homeless children with those that consider school organizational, community, and structural factors (Ellis & Geller, 2014; Miller, 2011a; Miller & Schreiber, 2012; Milner, 2014). Balanced analyses avoid tendencies to frame homelessness as a problem located exclusively within families (de Bradley, 2015; Milner, 2014).
The aims of the current study are to take initial steps to (a) describe the extent to which homeless student’s attendance, suspensions, standardized test taking, and performance vary across schools and (b) assess how these indices of access and performance uniquely relate to specific school characteristics (e.g., student socio-demographic composition; school structural and process characteristics), controlling for student and family background characteristics. This study is among the first to broadly sample students (i.e., including in kindergarten through 12th grades) identified through the McKinney–Vento Program in a large urban school district in California.
Background
Prior Research on the Academic Performance of Children Experiencing Homelessness
Recent reviews highlight three strands of research related to the academic performance of homeless children and youth (Buckner, 2008; Miller, 2011a). One strand, particularly seen in early research efforts in this area, describes homeless students’ psycho-social and academic profiles (e.g., Masten, Miliotis, Graham-Bermann, Ramirez, & Neemann, 1993). A second strand considers whether the experience of homelessness makes a unique contribution, net of other socio-demographic factors such as family income, to student academic performance. A third strand investigates individual differences in academic functioning within samples of homeless children. Generally, research in this area utilizes samples from large urban areas; cities are more likely to have homeless service infrastructures (e.g., shelter systems) that facilitate identification of service recipients (Tobin, 2016).
Current research examining unique risks associated with homelessness and heterogeneity within the student homeless population capitalizes on large administrative data sets, often linking records from housing, health, child welfare, and educational systems. To date, analyses typically consider elementary-aged students (kindergarten through eighth grades). Such data sets facilitate comparisons between students who are identified as homeless (vs. not), longitudinal investigations, and contain sufficient samples of homeless children for within-group analyses.
An exemplary set of studies, drawing from the Minneapolis Public Schools (MPS), used linked administrative data to create cohorts of homeless and highly mobile (HHM) students (Grades 2 to 8) and compared them with housed students in the general district population (Cutuli et al., 2013; Obradovic et al., 2009). This line of research generally demonstrates that HHM students’ initial reading and mathematics achievement scores and rates of achievement growth were lower than those of both their low-income (but stably housed) and more economically advantaged peers.
The MPS studies also revealed important sources of heterogeneity within the HHM subgroup, identifying a subset of high-performing HHM students. Within HHM students, socio-demographic characteristics such as minority ethno-racial background, being male, and English language learner status, as well as special education placement, related to poorer performance and rates of growth on standardized tests of reading and mathematics achievement (Cutuli et al., 2013). In addition, variation in homeless children’s executive function skills (Masten et al., 2012) and quality of parenting received (Herbers et al., 2011) related to individual differences in academic outcomes.
Because identification of homeless students is difficult and housing instability is inextricably linked to school mobility (Tobin, 2016), researchers often combine these subgroups (Tobin, 2016). Unfortunately, such a strategy conflates the experience of homelessness and school mobility. To disentangle these effects, Fantuzzo and his colleagues took advantage of a linked, administrative data combining records across education and health and social service sectors to investigate the educational trajectories of homeless children in Philadelphia among a birth to third-grade cohort of students. One of their studies investigated effects of the timing of first emergency housing placement on achievement schools (Fantuzzo, LeBoeuf, Brumley, & Perlman, 2013). Controlling for maternal use of prenatal care, gestation age, low birth weight, and child maltreatment as key covariates, they found evidence of unique associations between housing placements and academic performance. Specifically, housing placement in infancy predicted increased odds of poor math achievement and multiple housing placements related to increased truancy rates. Fantuzzo, LeBoeuf, Chen, Rouse, and Culhane (2012) also simultaneously considered both effects of parental shelter stays and school mobility on school performance. Results showed both negative homeless and combined homeless and mobility effects on reading and mathematics achievement scores.
Finally, recent research also strongly implicates student attendance as a key mechanism through which homelessness exerts negative effects on student achievement. Tobin (2016), utilizing school administrative data (including children in Grades 3-8) from a large, northeastern city, finds that student absences fully mediate the negative relationship between student HHM status and readings and mathematics achievement scores. Fantuzzo et al. (2012) also found that attendance mediates the relationship between shelter placement and school achievement.
In summary, accumulated research suggests that the experience of homelessness is uniquely, and in combination with high mobility, negatively associated with school achievement. It implicates attendance as a crucial mechanism explaining this relationship. It also suggests heterogeneity in academic performance within students who are homeless and unstably housed, justifying research focusing within this subgroup of students.
Calls for Contextually Grounded Research on the Academic Performance of Children Experiencing Homelessness
Numerous scholars call for broader ecological accounts of the educational experiences of homeless students (de Bradley, 2015; Ellis & Geller, 2014; Miller, 2011a; Miller & Bourgeois, 2013; Milner, 2014). To date, such accounts consider the influence of economic and housing dynamics on child and family outcomes and collaborative relationships between school staff and community service providers. For example, Miller (2011b) notes that the recent recession changed the dynamics and distribution of homeless students, both within and across schools, communities, and districts. In addition, the nature of and variation in the implementation and impacts of McKinney–Vento Programs within and across school districts are thought to play a key policy-contextual role (Buckner, 2008; de Bradley, 2015; Miller, 2011a), particularly in poorly resourced urban schools (Tierney & Hallett, 2012).
Homeless and other marginally housed students are typically identified and programmatically served by schools and districts through McKinney–Vento legislation and associated programming (Miller, 2011b). The legislation specifies a standard formula to distribute funds to state education agencies to serve identified students. Students targeted by the policy and programming include, but are not limited to, students living in shelters (estimated at 18% of the McKinney–Vento eligible population) as well as those living “doubled-up” or couch surfing (estimated at 75%; NCHE, 2012).
The legislation ensures enrollment for identified students, even if they do not possess oft required records (e.g., proof of residency, immunization records). If relevant and in the best interest of the child, the law emphasizes maintaining children in their school of origin and includes provisions for transportation. In addition, school districts must appoint a liaison, whose responsibilities include educating the district community about the law, identifying eligible students, and facilitating access to district and school services. The 2001 reauthorization of the McKinney–Vento Act required that school districts submit yearly reports including basic information about the homeless students identified and served in their schools. Many districts began flagging student homelessness in administrative records for reporting, facilitating research in this area (Cunningham, Harwood, & Hall, 2010).
Miller (2011b) contends that McKinney–Vento legislation primarily focuses on facilitating student access to school, primarily through ease of enrollment and transportation, rather than the quality and continuity of their actual school and instructional experiences. Thus, he argues, less focus is placed on the implications of the legislation for coordinating services for these students across school and community agencies, particularly in terms of roles of school leaders and staff (Miller & Schreiber, 2012). Once enrolled, the in-school experiences of homeless students are not well-understood, although qualitative research suggests across school variability in homeless students in both instructional and relational experiences with school staff (Ellis & Geller, 2014).
Notably, these calls highlight important sources of district and school-related variation in the implementation of McKinney–Vento legislation. Not all local education agencies draw down funds (NCHE, 2014). Evidence also suggests considerable variation in densities of McKinney–Vento eligible students across both across and within districts (Tobin, 2016). Finally, there is also considerable variation in how districts and schools implement mandates in support of these students (Tierney & Hallett, 2012).
School Effects as a Conceptual Lens for Children Experiencing Homelessness
Given calls for more contextually grounded accounts of homeless student academic experiences, the key role that districts and school staff play in identifying and serving homeless students, as well as suggestive evidence of several sources of school-related variation relevant to homeless students, schools themselves are not typically considered as a key unit of analysis in prior research (Miller, 2011b; Miller & Bourgeois, 2013). Although prior research utilizes analytic methods that correct for the nesting of students in schools (e.g., Cutuli et al., 2013; Fantuzzo et al., 2013; Fantuzzo et al., 2012; Obradovic et al., 2009; Tobin, 2016), across-school variation in homeless student outcomes has not been a central focus of investigation.
School effects approaches, thus, offer a useful conceptual framework from which to consider the academic performance of students experiencing homelessness. Often attending to equity concerns, these approaches ultimately aim to uncover malleable school features that may enhance or constrain student school performance when controlling for individual student and family characteristics (for reviews, see Rutter & Maughan, 2002; Teddlie & Reynolds, 2000). This body of research finds unique contributions of the characteristics of schools to individual academic performance and psycho-social functioning, even after controlling for key student-level background characteristics such as racial and ethnic background, socio-economic status, and initial academic skills (for a review, see Rutter & Maughan, 2002).
School effects research generally considers the influence of four broad conceptual domains on individual student outcomes (Teddlie & Reynolds, 2000). Inputs, broadly defined, include resources that schools are given, including fiscal and human capital (e.g., qualified teachers). Other inputs are “compositional” and include the socio-demographic and initial performance characteristics of the student body (Konstantopoulos & Borman, 2011). There is also a growing body of research that suggests that school-level concentrations of students with psycho-social risk factors (e.g., exposure to lead, homelessness, maltreatment, and foster care) exert additional compositional effects on student academic achievement (Bryk, Sebring, Allensworth, Easton, & Luppescu, 2010; Fantuzzo, LeBoeuf, & Rouse, 2014). Of relevance to the current study, Fantuzzo et al. (2014) links school-level concentrations of students with histories of homeless spells to poorer student attendance and reading achievement scores, controlling for individual socio-demographic characteristics and risk exposures as well as school socio-demographic composition.
The second, third, and fourth domains are structure, process, and context, respectively. Structural features of the school include features such as school size, class size, and grade span. The process domain includes school managerial and organizational features. Typically, a focus of school effectiveness studies, principal leadership, and school social and instructional climates represent this domain (Bryk et al., 2010). Aggregate school attendance rates, in particular, appear to operate as an important “process” variable (Caldas, 1993; Lamdin, 1996), reflecting qualities of the school climate and instructional practices (Gottfried, 2011b, 2012; Rumberger & Rotermund, 2012). Finally, the wider community context, typically operationalized as region and/or urbanicity, is also conceptualized as shaping relationships between input, structure, process, and student outcomes.
Although school effects research typically considers standardized achievement scores as key individual student outcomes, student attendance and behavior are increasingly seen as critical outcome domains as well. Rumberger and Rotermund (2012) and other scholars (see Fredricks, Blumenfeld, & Paris, 2004, for a review) articulate a tripartite model of school engagement, which is composed of affective (feelings and beliefs and attitudes about school), cognitive (investment and willingness to engage in learning), and behavioral (including attendance and behavior) dimensions. Poor attendance robustly relates to a multitude of poor outcomes among students in the general population, including lower standardized test scores in reading and math (Archambault, Janosz, Fallu, & Pagani, 2009; Dunn, Kadane, & Garrow, 2003; Gottfried, 2009, 2010, 2011a; Lamdin, 1996), increased risk of non-promotion, and eventual dropout (Balfanz, Herzog, & Mac Iver, 2007; Jimerson, Egeland, Sroufe, & Carlson, 2000; Schoeneberger, 2012). Using structural equation modeling techniques, Archambault et al. (2009) found that behavioral engagement, indicated by school attendance and poor school behavior, but neither cognitive nor relational engagement, predicted early dropout. Findings such as these cohere with the development of “early warning indicators (EWIs).” Specifically, poor initial school performance (e.g., poor reading standardized test scores, failing grades), attendance, and behavior, as measured by school suspensions and expulsions, increasingly serve as markers for subsequent academic problems, including school dropout (Balfanz et al., 2007). Of relevance to the current study, student attendance appears to fully mediate negative relationships between the experience of homelessness and student reading and mathematics achievement scores (Fantuzzo et al., 2012; Tobin, 2016).
Actual test taking of students who are homeless also raises concern. Only about 50% of McKinney–Vento identified students nationwide took their state standardized language arts or mathematics tests. The lowest test-taking rates (15%) were observed among high school students (NCHE, 2012), again suggesting the importance of examining school-level factors in the analysis of homeless student subgroups.
Given the paucity of school-contextually informative research on the academic behaviors and performance of homeless student, prior empirical findings from school effects research suggest that input/compositional (socio-demographic and psycho-social) characteristics of the student body, school structural (level, size), and school process indicators (e.g., positive climate and performance) would plausibly show effects on academic outcomes of homeless children. Indeed, given their high risk for poor academic outcomes, attending higher quality schools might be particularly beneficial for this subgroup of children (Bryk et al., 2010; Konstantopoulos & Borman, 2011).
The current study thus draws on pooled administrative data gathered over 4 school years (2007-2008 to 2010-2011) from a large urban school district in California to build on previous research. The analysis considers students when they are first identified as McKinney–Vento eligible by district staff, and, by this definition, includes those both sheltered and in other unstable housing circumstances. Most crucially, it applies a school effects lens to guide simultaneous exploration of both school- and individual-level factors that relate to student attendance, behavioral infractions, and standardized test taking and performance, over and beyond individual-level factors that have been considered in the past. The current study explores two central questions:
To what extent do student attendance, suspensions, standardized test taking, and performance vary across schools among McKinney–Vento identified students?
To what extent do student attendance, suspensions, standardized test taking, and performance uniquely relate to specific school characteristics (e.g., student socio-demographic composition; school structural and process characteristics), controlling for student and family background characteristics?
Method
Data Sources and Study Context
Data for the study were drawn from three sources. A large urban California District provided the first two sources. Staff from the McKinney–Vento office within the district allowed access to rosters of students served between the 2007-2008 and 2010-2011 school years. Second, using district student identifiers, district research and evaluation staff linked these rosters to student demographic and academic records (we were provided a de-identified version of this linked data set). We linked these de-identified student records to publicly available school-level records from the California Department of Education to provide information on school characteristics.
The district, overall, served approximately 46,500 students in 144 schools over the study time period. Of these 144 schools, 111 included at least one McKinney–Vento identified student. The student body is predominantly minority—40% are identified as Latino, 32% African American, and 13% Asian. Twenty-six percent of students are classified as English language learners, and 70% receive free and/or reduced lunch. These school characteristics remained stable over the study time period.
Given prior research noting variability in the implementation of McKinney–Vento programming, it is important to note that this district uses aggressive McKinney–Vento program-related efforts. In response to the recession, these efforts intensified starting in the 2007-2008 school year. During each of these school years, district employees actively reached out to community-based organizations and homeless shelters to facilitate identification of students. McKinney–Vento staff publicized district enrollment periods and was available on-site during school enrollment periods. These staff interviewed all students potentially eligible to receive McKinney–Vento services and confirmed that they met the criteria as described in the McKinney–Vento Homeless Assistance Act of 2001, Title X, Part C of the No Child Left Behind Act. Specifically, these include the following:
Sharing the housing of other persons due to loss of housing, economic hardship, or similar reason
Living in motels, hotels, trailer parks, or camping grounds due to the lack of alternative accommodation
Living in emergency of transitional shelters
Abandoned in hospitals or awaiting foster care placement
Having a primary nighttime residence that is a private or public place not designed for or ordinarily used as a regular sleeping accommodation for human beings
Living in cars, parks, public spaces, abandoned buildings, substandard housing, bus or train stations, or similar settings
Membership in specified migrant populations
Using these criteria, approximately 6% of students were identified as homeless in this district. Of identified students, the actual housing status of sample members (which was not disclosed to researchers) was estimated to be distributed as follows: 80% doubled up, 16% sheltered, and 4% unaccompanied youth by the district’s McKinney–Vento liaison. The density of homeless students in the district and estimated distribution of their housing status closely parallel national estimates (NCHE, 2012).
Sample
The district identifies and creates new counts of McKinney–Vento eligible students on an annual basis. Over the 4-year time period, from 2007-2008 to 2010-2011, 90% of identified students appeared in these counts only once or twice. To address the research questions of this study, our analytic sample consists of students in schools at first identification by McKinney–Vento staff, yielding 2,618 unduplicated student records in 111 schools. We constructed our sample in this manner to (a) reflect the district counting strategy (i.e., most all students appeared in counts once or twice) and (b) maximize overall and within-school sample size. In analyses not presented here, we tested whether this strategy introduced artifactual school-level effects by replicating our analyses in single years and for the subsample of students who were identified as homeless more than once over the time period. We found the patterning of results similar across these specifications.
Although subsequent student mobility is not considered in this analysis, 23% of the students who were identified at two or more time points would ultimately make one or more non-normative moves (e.g., not a natural transition from middle into high school). In addition, it is important to note that there were 260 records of McKinney–Vento identified students who had a registered contact with McKinney–Vento staff but either did not formally enroll or attend school. Thus, they did not have complete academic performance records beyond basic socio-demographic characteristics and were not included in analyses. Although these children did not differ significantly in their socio-demographic characteristics from those included in analyses, they likely differ from those with complete academic records in important and unmeasured ways (e.g., greater propensity for mobility).
Sample school and student characteristics are presented in Table 1. On average, these students are academically vulnerable as seen by their overall attendance and test scores. Sample average test scores indicate performance at the lower end of the “basic” skill range (i.e., scores between 300 and 349 based on levels set by the Standardized Testing and Reporting [STAR] program in the state of California).
Sample Descriptive Statistics.
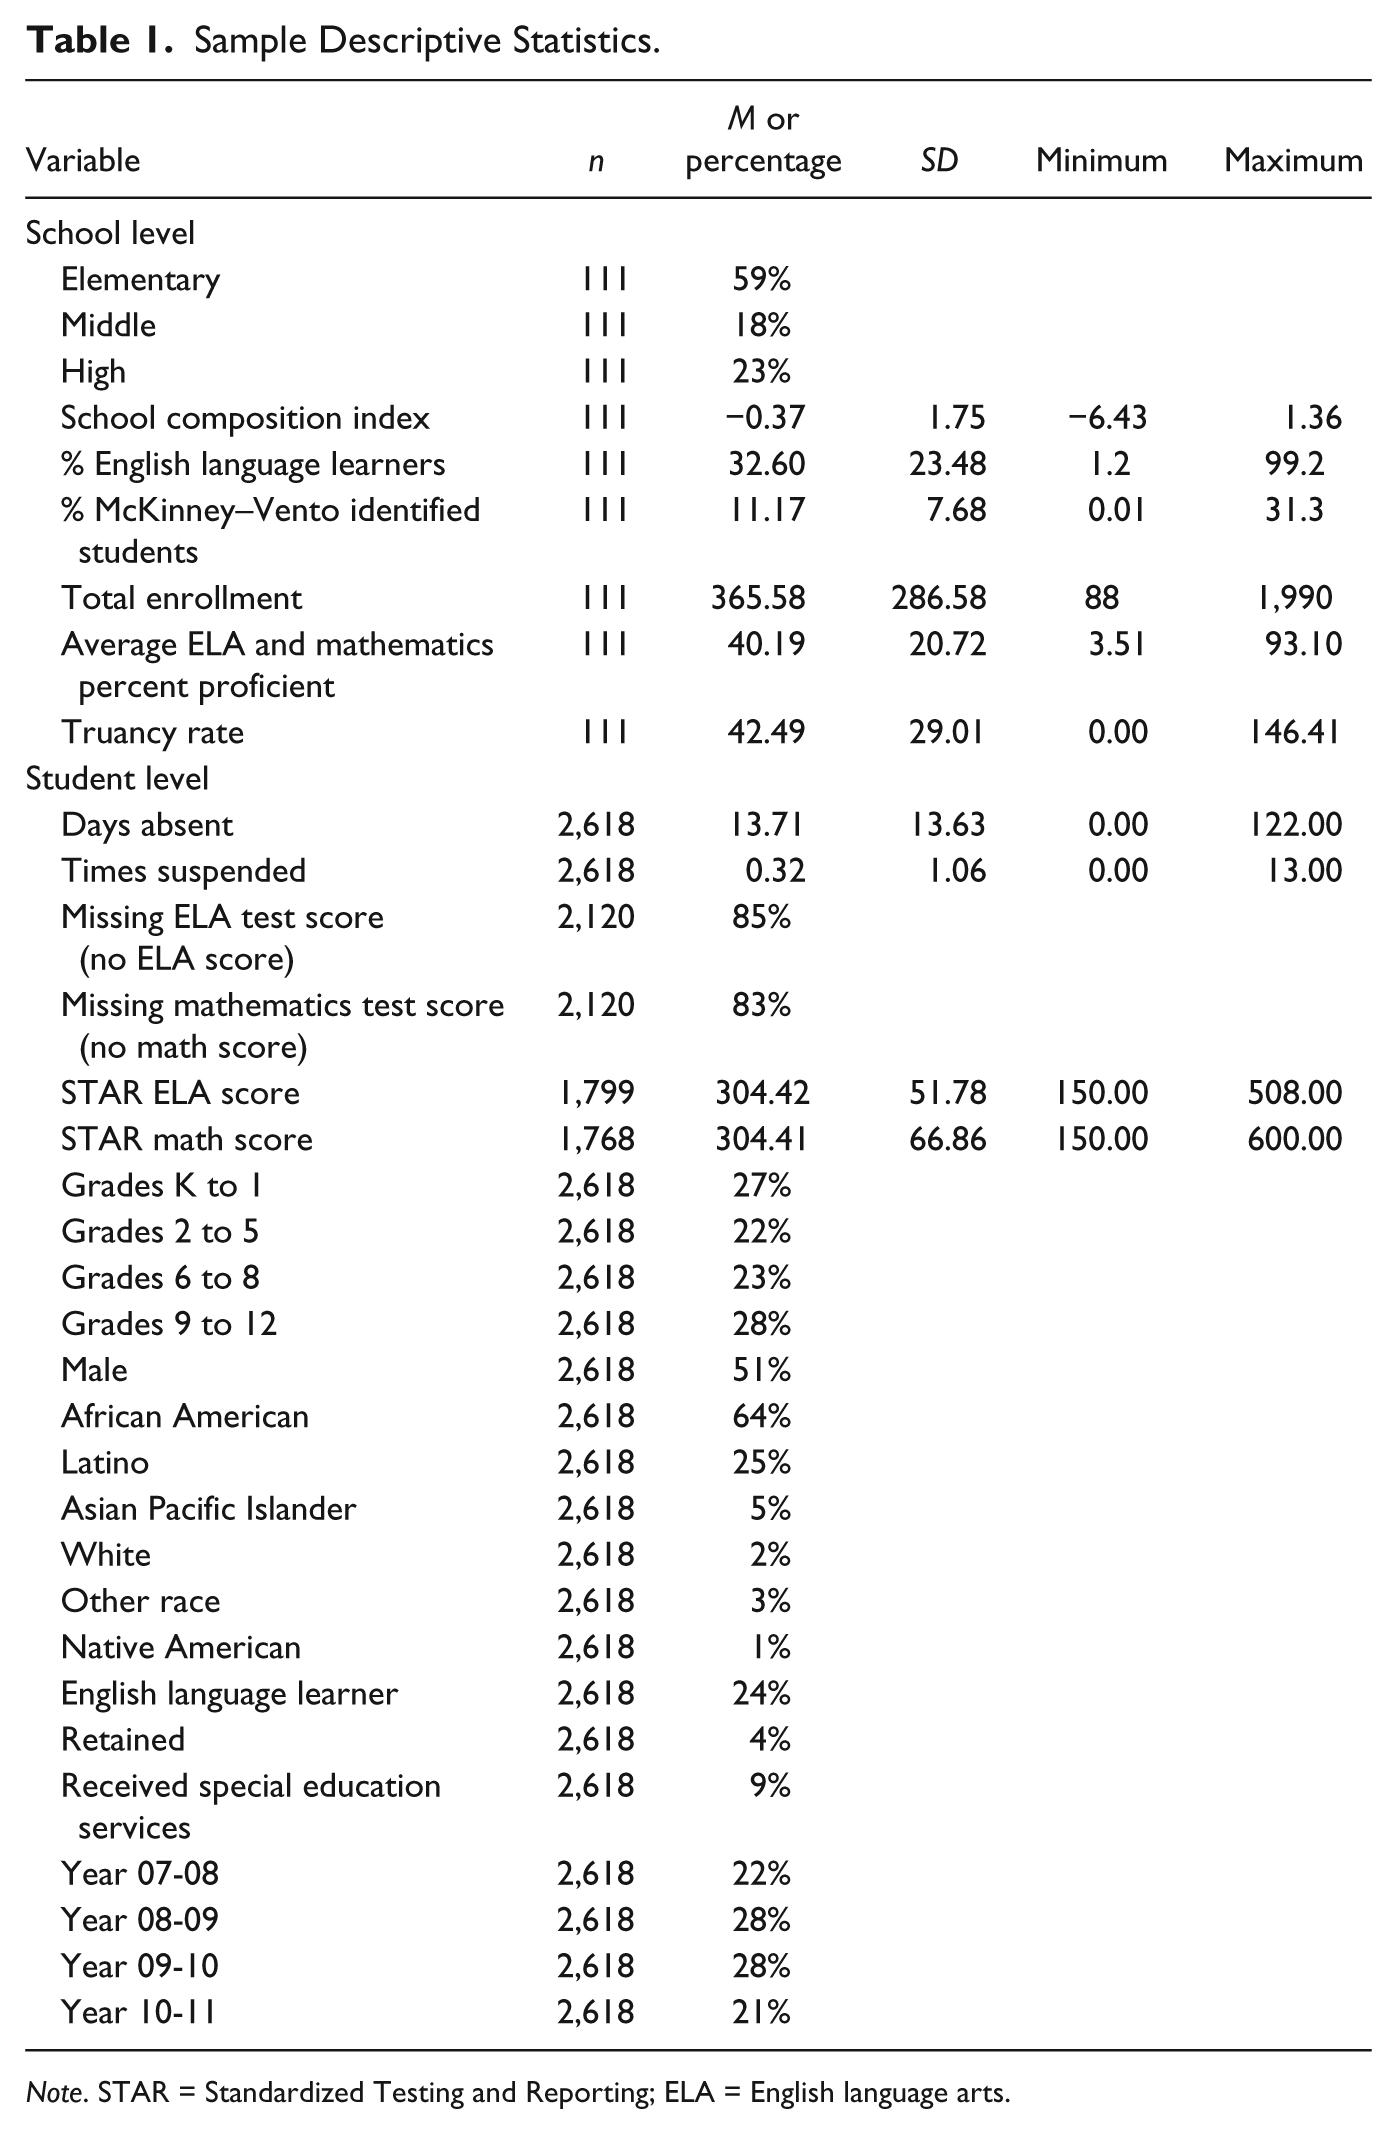
Note. STAR = Standardized Testing and Reporting; ELA = English language arts.
Variables
Student variables
Student variables fall into three categories: outcome variables, student socio-demographic background, and prior school performance and placement characteristics (e.g., a history of grade retention and special education placement). The four outcomes considered include attendance, suspensions, test taking, and achievement test performance. We measure student attendance and suspensions based on counts of days absent and suspended in the given school year. Test taking is indicated by whether a student was missing a reading (vs. not) or mathematics test score (vs. not), respectively. We measure achievement test performance using end of year standardized tests scores in English/language arts and mathematics available from California’s STAR program. The scaling of these scores allow for comparisons across grade levels. We consider student’s overall scores as well as whether, using dichotomous indicators, a student’s score would be considered below basic skill levels (less than 300 vs. all higher scores) and whether a student’s score indicates proficiency (greater than or equal to 350 vs. all lower scores). Importantly, student achievement test scores are only reported for students beginning in second grade, so test-taking and achievement analyses are confined to students eligible for test reporting (n = 2,120).
Student socio-demographic characteristics include a series of dichotomous indicators reflecting student grade level (Grades 2 to 5, Grades 6 to 8, Grades 9 to 12 vs. Grades kindergarten to 1), ethno-racial characteristics (student identified as Latino, Asian/Pacific Islander, White, or Other vs. African American), whether the student is male (vs. female), whether the student is classified as an English language learner, and the school year in which the student was first identified (2008-2009, 2009-2010, or 2010-2011 vs. 2007-2008). Dichotomous indicators reflecting whether the student ever repeated a grade (vs. not) or received special education services (vs. not) serve as indicators of prior school performance and placement.
School variables
School variables were stable over time and were, therefore, averaged over the study time period. We selected them to reflect key school effects conceptual domains: structural, compositional, and school process and performance characteristics. Structural features of the schools included total enrollment, and dichotomous indicators capturing whether a school was a middle or high school (vs. elementary). Student body composition indicators included the percentages of the total enrollment of students who were identified by the McKinney–Vento program and English language learners. In addition, given that a vast majority of children enrolled by the district were African American and Latino and received free and reduced lunch, we created a standardized index reflecting the extent to which a given school was above or below the district average across these variables. Positive scores indicate that school had above-average concentrations of African American and Latino students and students participating in the free and/or reduced lunch program (see Bryk & Thum, 1989, for a similar measure). This coding strategy derives from compositionally oriented, school effects research suggesting the unique context of schools with high concentrations of historically underserved students (Bryk et al., 2010). School process and performance characteristics include average percentages of students who were proficient or above in language arts and mathematics as measured by the STAR program and school aggregate truancy rates representing the proportion of students with three or more unexcused absences from school.
Analytic Approach
To address our research questions, we utilized multi-level modeling techniques to account for the clustering of students within schools and to estimate the extent of across-school variation in student outcomes (Raudenbush & Bryk, 2002). For each outcome of interest, we implemented three random intercept models for continuous and dichotomous outcomes, as appropriate. Across all models, student-level variables were treated as fixed effects. The first model (Model 1) was unconditional and allowed for estimation of the between-school variation in outcomes of interest. The second model (Model 2) included student-level predictors. The third model (Model 3) added school-level variables if there was remaining variation to be explained after the addition of student-level predictors. In addition to intercept variance components and proportions of variance explained, we present three statistics—−2 log likelihood (−2 LL), Akaike’s information criterion (AIC), and Bayesian information criterion (BIC)—to provide a comparative assessment of the extent to which added parameters improved the fit of the data to the model. A score closer to zero indicates an improvement in fit.
The first set of outcomes include student days absent and times suspended and whether students were missing reading and math scores, respectively. The second set of outcomes includes indicators of achievement for students who were both eligible for test reporting and had test scores available (1,799 students in 110 schools for reading; 1,768 students in 110 schools for math). For achievement test taking and performance, we include student days absent and times suspended as independent variables given prior research presented above implicating them as critical indicators of engagement related to student achievement in both general student populations and homeless subgroups. As noted above, these analyses do not include students in kindergarten to first grades.
Because scaling metrics are critical to interpretation in multi-level modeling (Enders & Tofighi, 2007), we strategically coded student- and school-dichotomous independent variables so that assignment to zero on these indicators generally represented the modal student or school in the sample. We grand-mean centered all covariates (including dichotomous indicators; Algina & Swaminathan, 2011; Enders & Tofighi, 2007). The intercepts thus represent average outcomes of interest adjusted for included covariates. Parameter estimates represent associations between covariates and outcomes of interest averaged across schools.
Finally, because our analyses showed that students who had test scores available differed from those who did not in terms of both student and school characteristics, we also compared, in analyses not presented here, results obtained for this sample of test takers to models where we accounted for the propensity to have a test score, based on the student and school variables of interest. Results obtained from each of these approaches yielded nearly identical results.
Results
Table 2 summarizes variance components and model fit indices for days absent, times suspended, and whether or not a student was missing English/language arts or math scores, respectively. Although the across-school variation was statistically significant for each outcome of interest, the intra-class correlation was relatively modest for student days absent. Approximately 4% of the variation in days absent was due to between-school differences. Although intercept variance for each of these outcomes remained after student-level covariates were included, inspection of fit indices indicates that addition of this group of school covariates only improved model fit for the outcome of times suspended. This suggests a simplified school-level model and/or consideration of an alternative set of school characteristics may be warranted for attendance and test-taking outcomes.
Summary of Variance Component and Fit Indices for Multi-Level Models of Critical Indicators.

Note. ELA = English language arts; AIC = Akaike’s information criterion; BIC = Bayesian information criterion; LL = log likelihood.
p < .10. *p < .05. **p < .01. ***p < .001.
Table 3 presents school and student coefficients for days absent, times suspended, and whether or not a student was missing English/language arts or math scores, respectively. Looking across school correlates of outcomes, controlling for student background, higher school truancy rates negatively related to average days absent, attending a middle school was associated with increased average frequency of suspensions, and attending a high school was associated with greater odds of missing a mathematics test score.
Multilevel Models for Critical Indicators of Academic Performance.

Note. ELA = English language arts; SE = standard error; OR = odds ratio.
Versus Elementary.
Versus Grades K-1.
p < .10. *p < .05. **p < .01. ***p < .001.
At the student level, those in Grades 6 to 8 and 9 to 12, who were Latino or Asian Pacific Islanders or English language learners, accrued fewer absences, whereas those who were retained (repeated a grade) or received special education services accrued more absences. Males, students who were retained, and those who received special education services were more frequently suspended. Paralleling findings for days absent, Latino and Asian American students were suspended relatively less frequently. Finally, days absent and receipt of special education services were both associated with greater odds of missing test scores.
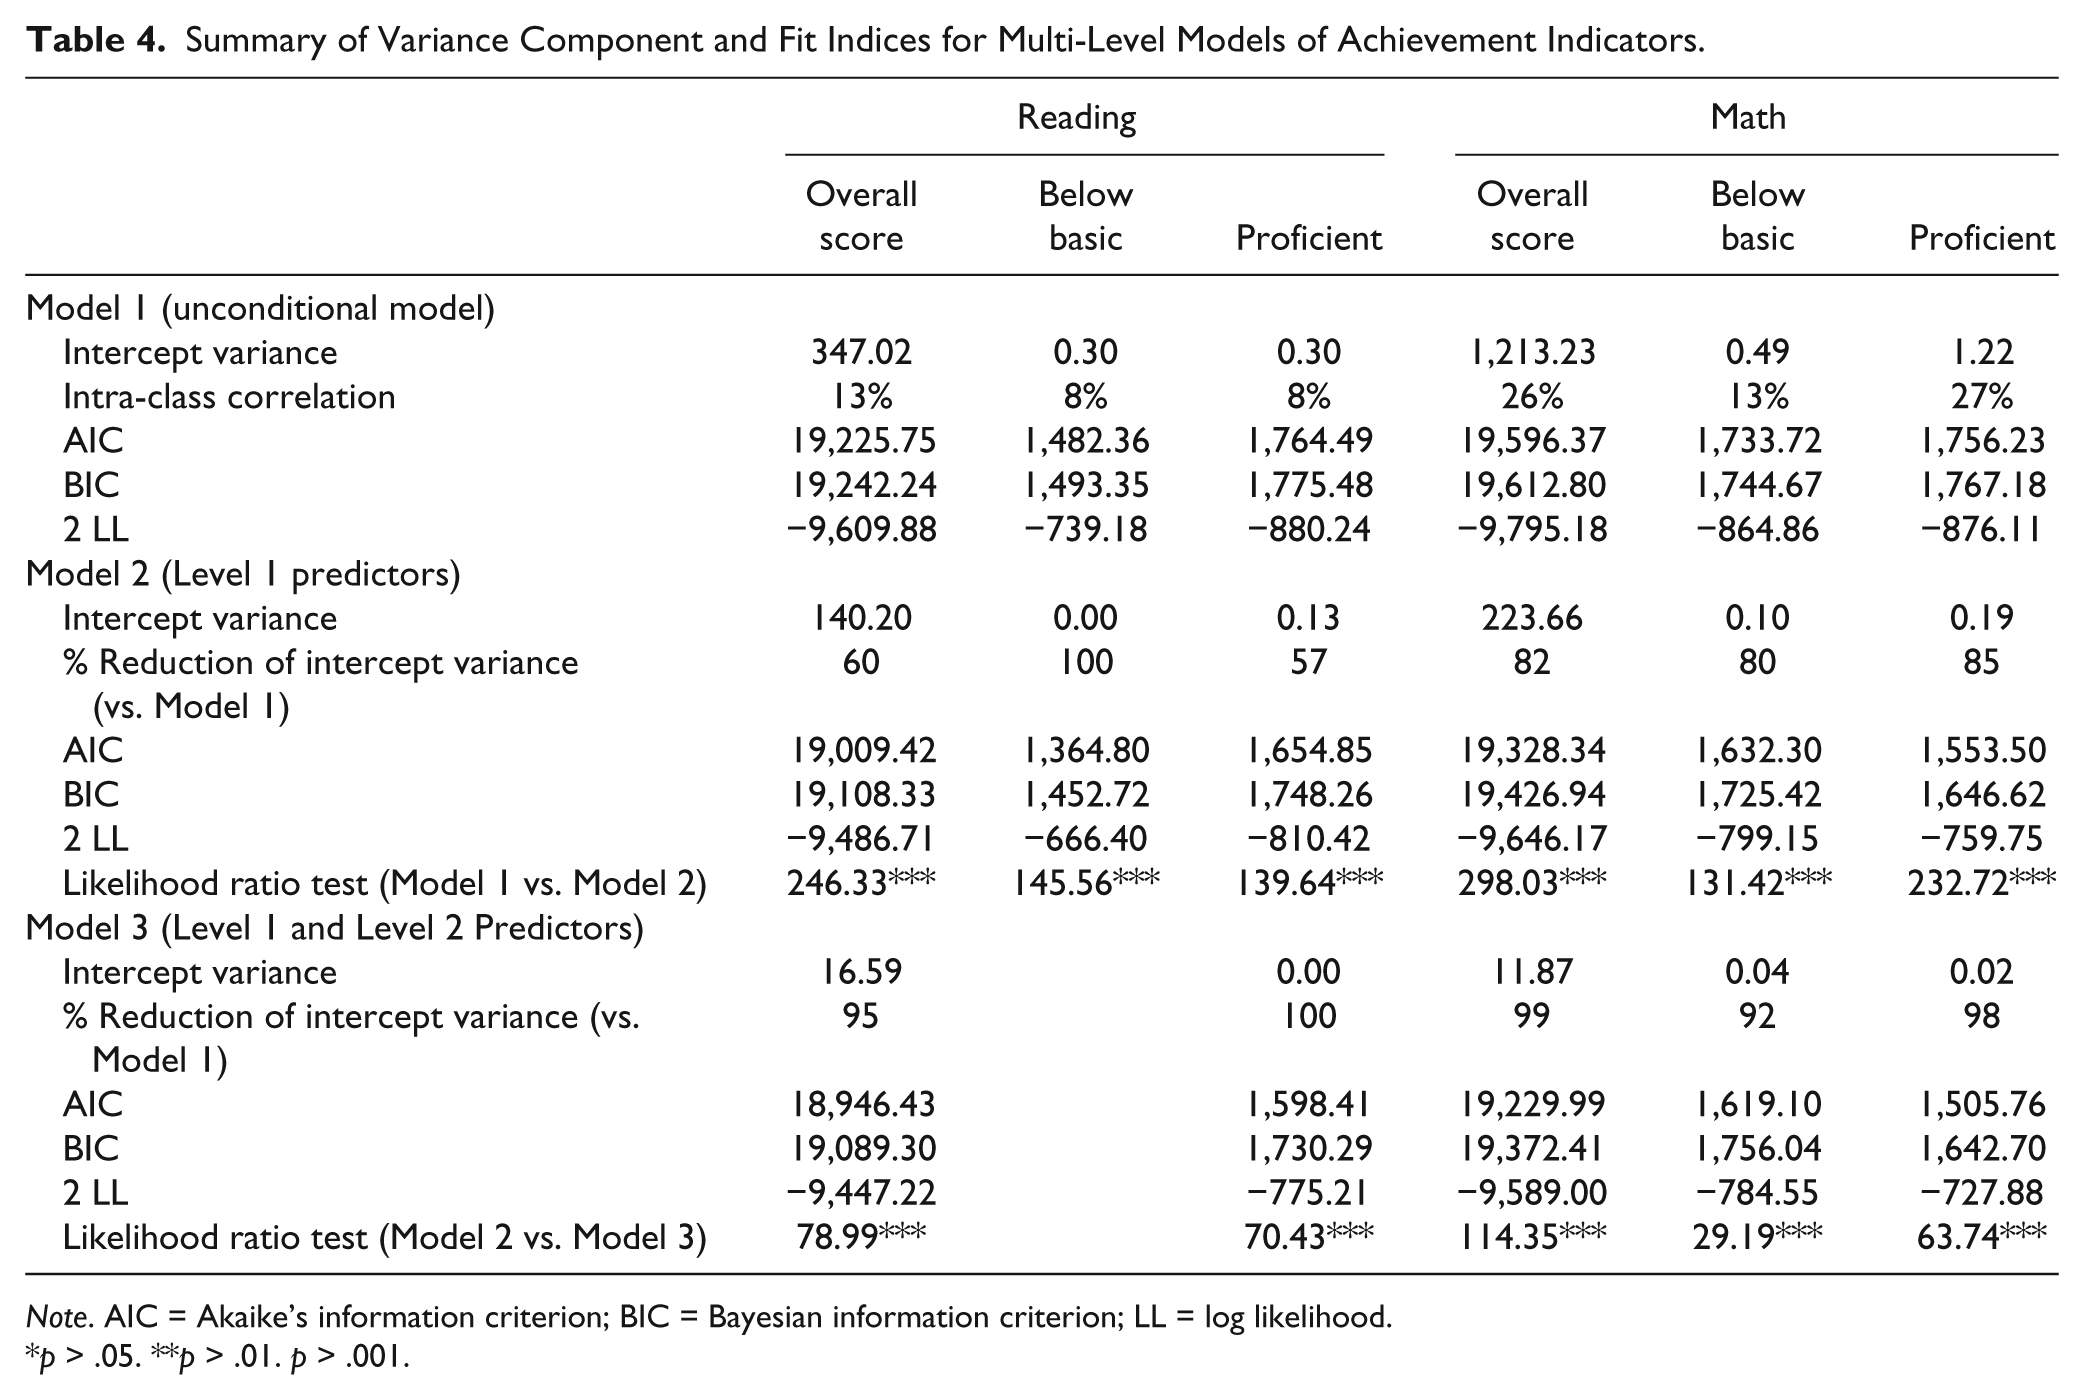
Table 4 summarizes variance components and model fit indices for English/language arts or math achievement performance indicators, respectively. There was significant across-school variation over all indicators (ranging from 8% to 27%). After adjusting for student covariates, significant intercept variation remained for each outcome except whether a student was reading at a below basic skill level. Including school covariates further reduced intercept variance, and model fit indices generally suggested that this group of school covariates enhanced model fit.
Summary of Variance Component and Fit Indices for Multi-Level Models of Achievement Indicators.
Note. AIC = Akaike’s information criterion; BIC = Bayesian information criterion; LL = log likelihood.
p > .05. **p > .01. p > .001.
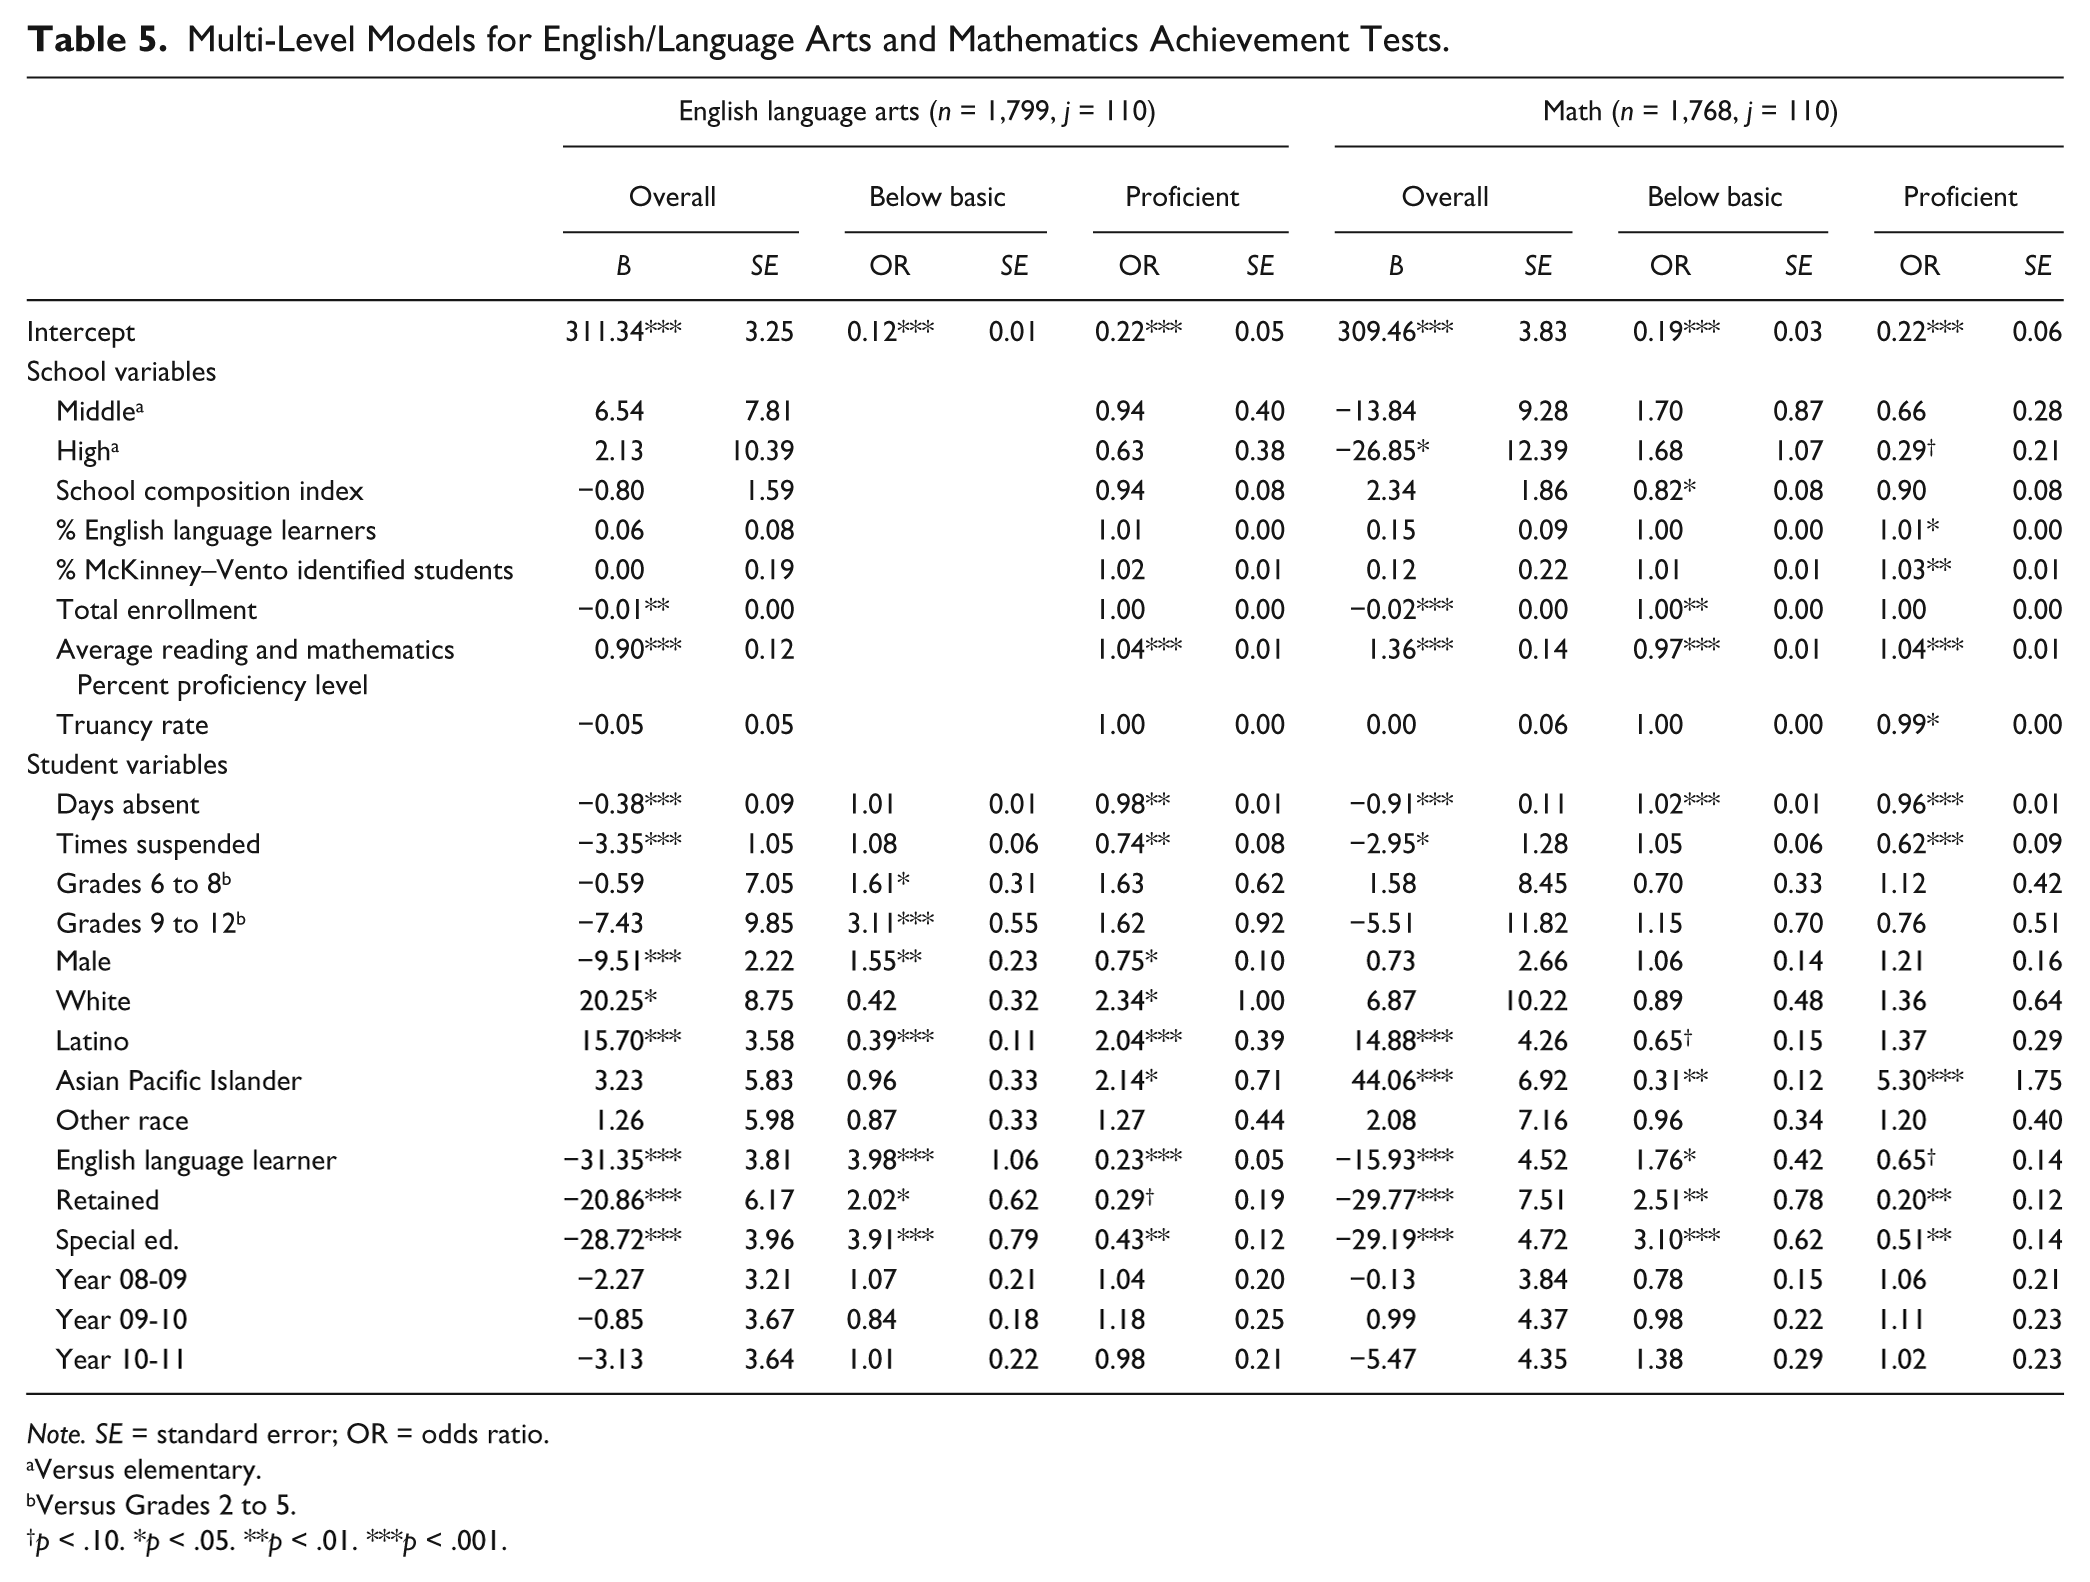
Across school and student achievement test performance indicators, results from Table 5 consistently show that school average achievement levels related to average English/language arts and mathematics performance, suggesting enhancements in individual student performance in higher performing schools. The patterning of results also suggests similar enhancements for students in schools with lower enrollments.
Multi-Level Models for English/Language Arts and Mathematics Achievement Tests.
Note. SE = standard error; OR = odds ratio.
Versus elementary.
Versus Grades 2 to 5.
p < .10. *p < .05. **p < .01. ***p < .001.
Overall, selected school characteristics played more varied roles across indicators of mathematics performance. As examples and contrary to expectations from school effects research, the odds of below-basic mathematics performance were reduced in ethno-racially and low-income segregated schools; similarly, the odds of proficient mathematics performance were enhanced in schools with higher densities of McKinney–Vento students.
At the student level, absenteeism and frequency of suspensions were almost uniformly associated with poorer outcomes, with the exception of below-basic performance on English/language arts tests. Similarly, English language learners, those who had been retained, and those receiving special education services performed relatively more poorly across all indicators. When looking within English/language arts performance, males tended to perform relatively less well and Latinos performed relatively better. For mathematics, Asian/Pacific Islanders performed relatively better.
Discussion
Given that extensive prior research considers key individual and family factors related to academic performance among this subgroup, we applied a school effects lens to directly respond to recent calls for broader ecological and school institutional accounts of the experiences of this subgroup of students (Miller & Bourgeois, 2013). Specifically, we argue that the application of a school effects lens to homeless students’ academic performance holds promise to identify school-contextual policy levers, potentially providing more information about how schools can effectively fulfill mandates under McKinney–Vento legislation. Our investigation should be interpreted as part of a set of preliminary steps in this direction (see Tobin, 2016). An added contribution is use of a sample that includes a wider cross-section of students by grade level and region than has been considered in previous research.
Our first question asked whether there was variation across schools on McKinney–Vento identified student outcomes. We found evidence that all student-level outcomes considered in the study significantly varied across schools. Furthermore, even after controlling for student covariates found to be important in prior analyses of homeless student samples, across-school variation remained in all but one case (i.e., whether a student had below-basic English/language arts achievement). These findings suggest the utility of incorporating a school effects lens to the study of the educational experiences of homeless children.
It is important to remember that school effects approaches ultimately aim to uncover malleable school features that may enhance or constrain student school performance. For student days absent, times suspended, and test-taking behavior, the set of school covariates included did not appear to uniformly account for remaining across-school variation. On the one hand, the relatively modest across-school variation in student days absent could suggest that student (vs. school) covariates better account for average school differences in these outcomes. It is also possible that traditional school structural, compositional, and performance characteristics do not capture school characteristics that may be salient to this outcome domain. That a process characteristic—school truancy rates—related to student-level absenteeism suggests that other school climate factors (e.g., the student centeredness of class and learning environments) may play larger explanatory roles. Urban school effectiveness studies link well-functioning and responsive school environments to reduced school and student-level absenteeism (Bryk et al., 2010). Kearney (2008) identifies functional school climate as a lever to reduced chronic truancy.
Our analyses, which also consider middle and high schools (as opposed to exclusively elementary school students), suggest that school dynamics in middle and high schools may be quite different from those in elementary schools. This is most evident when considering outcomes such as suspensions and test taking. Confining samples to elementary-aged students ignores potentially important setting-level dynamics, which are worthy of further investigation.
We also found attending a higher performing school and a school with lower enrollment generally enhanced achievement among students in our sample. Such findings cohere with the weight of prior school effects research on general student populations (Konstantopoulos & Borman, 2011; Rutter & Maughan, 2002) as well as related research on homeless students (Tobin, 2016). Clearly, interpreting these effects is tricky. On one hand, family and neighborhood selection processes may be at play. On the other hand, evidence suggests that high-performing urban schools often possess robust school processes—including strong principal leadership, high-quality instructional programming, responsive learning climates, and strong ties with families and communities. Such qualities likely facilitate conditions that enhance responsiveness to students in general. However, it is unclear whether such conditions are sufficient to fully equalize homeless student performance relative to housed students in the general population (Tobin, 2016).
Some prior research finds that schools with higher concentrations of students with shelter stays exert negative effects on student achievement across the general population (Fantuzzo et al., 2014), whereas other research does not (Tobin, 2016). Among students who are homeless, attending school with other homeless students does not appear to negatively influence their academic performance and, in the case of mathematics performance, may be beneficial. Both our patterning of null findings and those of Tobin (2016) occur in the context of districts with higher concentrations of poor and ethno-racial minority children. In contrast, higher concentrations of students in foster care appear to exert disorganizing influences in similar school contexts (Bryk et al., 2010).
Our findings also suggest that the influence of school levers may operate differently for reading and mathematics achievement. Specifically, student mathematics performance may be more responsive to school and classroom instructional practices than reading. Dee and Jacob (2011) found similar malleability of mathematics achievement scores in their evaluation of the impact of No Child Left Behind on student achievement (Dee & Jacob, 2011).
Given the influence of school factors, our analyses also reveal sources of heterogeneity within homeless students. Echoing prior research, our analyses find that absenteeism represents an important correlate of suboptimal test taking and performance among this subgroup (Fantuzzo et al., 2012; Tobin, 2016) as well as among the general population (Balfanz et al., 2007; Gottfried, 2009, 2010, 2011a, 2011b, 2012; Schoeneberger, 2012). It is also notable that student-level absenteeism did not play a significant role in the odds that a student would score below basic in English/language arts and that adjusting for student covariates fully explained across-school variation in this outcome. This finding suggests that there are likely important individual differences in students based on their individual skill levels in this content area that likely require intensive and individualized intervention. Our analyses also suggest that students who have repeated a grade, receive special education, or are English language learners almost consistently demonstrate less optimal performance across all outcome domains considered. These raise concerns about categorical program continuity that have been reported for other vulnerable subgroups, such as foster children (Stone, 2007).
As a whole, our findings dovetail with recent critiques of McKinney–Vento legislation, which suggest that it places disproportionate emphasis on ensuring access to school, rather than enhancing the instructional opportunities available to this group of students (Miller, 2011b). Our findings also raise questions about the extent to which school quality factors should play a role in student placement decisions, raising interesting equity questions about whether children who are unstably housed should be treated differentially from other academically vulnerable subgroups.
At minimum, our findings suggest possible redefinition or expansion of roles for McKinney–Vento Program staff that move beyond student identification, facilitating enrollment and linkage to services to that of active case management. At minimum, overall student performance in our sample suggests the need to facilitate student access, not only to school buildings but also to strategic instructional interventions to build academic skills, particularly in the area of reading. In addition, evidence-based attendance interventions such as Check and Connect, which emphasize relationship building with students and parents and monitoring of identified students, could be important models for such expanded roles (Christenson & Reschly, 2010).
Beyond expanded McKinney–Vento liaison roles, Miller and Schreiber (2012) also suggest the importance of building collaborative relationships directly between school staff (particularly principals), families, and community service providers. Building school staff competence in forming such collaborative relationships is a complex task, which involves forming trusting relationships with students and parents/caregivers who may be reluctant to divulge their housing status (Ellis & Geller, 2014). It also involves competencies in navigating often unnecessarily rigid boundaries between education and other child and family serving systems (Miller & Schreiber, 2012).
We conclude by noting key limitations of the current study. We were unable to include and, therefore, to compare students in our sample with children in the general population. It is therefore unclear whether the school effects observed reflect effects common to all students or the extent to which they differentially affect homeless students relative to non-identified students in the general population. Although prior research justifies within-group analyses of homeless children (e.g., Cutuli et al., 2013), our analyses yield a particular type of school effect, generated by average characteristics of the student body. It is important to note that school effects may be generated in many ways (e.g., through classroom interactions, through interactions within schools among homeless students and peers). Although a majority of our covariates logically precede our outcome measures, precise time ordering particularly between absenteeism, suspensions, and test taking and performance is unclear due to the cross-sectional nature of our data set. Moreover, they do not account for this sample’s performance over time and reflect short-term effects of exposure to homelessness. Our data do not allow us to specify the nature of student homeless experience (e.g., the effect of being doubled up vs. living in a shelter), although these experiences plausibly could yield different performance effects. It is important to further note that our results are generalizable to McKinney–Vento students in district contexts with similar student compositions. Perhaps most importantly, there are likely important unmeasured confounds of academic performance not captured in these administrative data. For example, children and parents who consistently attend school or, alternatively, schools that consistently support student achievement likely differ in important ways not measured here. Similarly, students who are identified likely differ from those who are not identified. Unfortunately, it is difficult to discern the nature of potentially biasing effects, which can plausibly be argued to be in either upward or downward directions (Tobin, 2016).
Despite these important limitations, this study represents an important and unique attempt to apply a school effects lens to this population. Our results suggest the viability of future research, which accounts for and examines the school-related dynamics affecting homeless and marginally housed students, by finding evidence of across-school variation in student outcomes. It also lends credence for recent calls to build more contextually informative knowledge relevant to homeless children.
Footnotes
Declaration of Conflicting Interests
The author(s) declared no potential conflicts of interest with respect to the research, authorship, and/or publication of this article.
Funding
The author(s) received no financial support for the research, authorship, and/or publication of this article.