
Abstract
Higher-income neighbourhoods in Canada’s eight largest cities flourished economically during the past quarter-century, while lower-income communities stagnated. This paper identifies some of the underlying processes that led to this outcome. Increasing family income inequality drove much of the rise in neighbourhood inequality. Increased spatial economic segregation, the increasing tendency of ‘like to live nearby like’, also played a role. It is shown that these changes originated in the labour market. Changes in investment, pension income and government transfers played a very minor role. Yet it was not unemployment that differentiated the richer from poorer neighbourhoods. Rather, it was the type of job found, particularly the annual earnings generated. The end result has been little improvement in economic resources in poor neighbourhoods during a period of substantial economic growth, and a rise in neighbourhood income inequality.
1. Introduction
This paper marries two strands of research. First, we consider the spatial consequences of rising family income inequality on neighbourhood inequality, changes in the spatial distribution of income that result from the rising income disparity among families observed in Canada during the 1990s (Heisz, 2007; Frenette et al., 2007).
The second strand relates to research on neighbourhood poverty and urban economic segregation: a growing tendency of ‘like to live with like’. The expansion of urban impoverished neighbourhoods in virtually every metropolitan area in the US over the second half of the 20th century is well documented (for example, Jargowsky, 1996, 1997; Massey and Denton, 1993). 1 Phenomena like out-migration of the more affluent, increased residential sorting by income class and the increasing concentration of poverty have led to concerns regarding the economic health of neighbourhoods at the bottom end of the neighbourhood income distribution. Fuelled by William Julius Wilson’s classic study The Truly Disadvantaged (1987), a growing body of literature attempts to find the roles of economic change, settlement patterns and their relation to the formation of urban ghettos.
As we show more formally later, rising neighbourhood inequality can result either from an increase in family income inequality in a city as a whole or because of rising economic segregation, a change in the correlation between family income and neighbourhood income (a growing tendency of ‘like to live with like’).
Canadian research on neighbourhood poverty and economic segregation is sparse. 2 In part, this is because the Canadian story differs significantly from that of the US. Unlike our southern neighbour, family income inequality in Canada did not rise through the 1970s and 1980s and hence placed less upward pressure on neighbourhood inequality. 3 This issue has also received less policy or research attention in Canada because economic segregation is often thought to be a consequence of underlying racial cleavages in the US (Kain, 1986; Jargowsky, 1996) that are not replicated in Canada (Hou and Myles, 2004).
Rising neighbourhood inequality can change the face of cities. It can result in some neighbourhoods foregoing the economic benefits of a general improvement in economic conditions. As we will see, the rising economic tide of the past quarter-century has not lifted all neighbourhoods equally. If neighbourhoods become increasingly economically homogeneous, as the tendency of ‘like living with like’ increases, then both the positive and negative neighbourhood effects on crime, health and the educational attainment of children may become more pronounced. While issues of causality remain much disputed, there is clear evidence that low-income individuals who reside in ‘poor’ neighbourhoods have inferior health and other outcomes when compared with low-income individuals living in more affluent, middle-class neighbourhoods (Hou and Myles, 2005). A review of neighbourhood effects in Canada (Oreopoulos, 2008) concludes that much of the existing evidence on neighbourhood effects is derived from regression analyses that are prone to bias and misinterpretation. After discounting such work, the author concludes that neighbourhood environment matters for an individual’s mental health and exposure to crime, but has little effect on the future economic outcomes of residents.
Our first objective is to document changes in neighbourhood income inequality in Canada’s eight largest cities over the 1980–2005 period. We go on to identify the underlying forces that contributed to such growth, notably those related to labour market phenomena and changes in government transfers. In the second part of the paper, we address the role of economic segregation. We ask whether the rise in neighbourhood inequality simply reflects an increase in family income inequality or is driven by an increased tendency of families to sort themselves into more income-homogeneous communities.
2. Data Sources and Methods
The data for this paper are drawn from the micro-data files for the 20 per cent sample of the 1981, 1986, 1991, 1996, 2001 and 2006 Canadian censuses of population. We focus on the eight largest census metropolitan areas in Canada. 4 Following conventional practice in measuring family poverty and income inequality, family income is determined for the economic family 5 and adjusted to account for economies of scale associated with larger families using the ‘central variant’ approach proposed by Wolfson and Evans (1990). Each individual in the family is assigned an ‘adult equivalent’ income, a weighted per capita income that accounts for the economies of scale associated with larger families and assumes equal sharing of resources within the family. 6
2.1 The Income Units
Unlike previous census studies that permitted analysis only on pre-tax family income, this paper employs post-tax family income. Prior to 2006, Canadian censuses did not collect information on taxes paid. To overcome the lack of information on taxes paid in earlier census years, Frenette, Green, and Milligan (2006, 2007) used a regression-based approach to impute federal and provincial income taxes and added them to the existing census micro files for the census years between 1980 and 2000. 7 In this paper, we take advantage of this imputed tax information, along with the 2006 census data, which collected taxes paid for the first time, to produce a time-series of after-tax data.
The period under study covers two complete business cycles. By comparing years that are in similar positions in the business cycles (roughly 1980, 1990, 2000 and 2005), we are able to remove cyclical effects from neighbourhood inequality trends. 8
We restrict our analyses to the eight largest census metropolitan areas (CMAs) for two reasons. First, neighbourhood segregation tends to emerge in larger cities where there is a possibility to create ‘niche neighbourhoods’. Secondly, the availability of city-specific consumer price indices (CPIs) for the largest cities enables us to estimate changes in real as well as relative income levels at the neighbourhood level. Earnings and income are deflated using the city-specific CPIs.
2.2 Neighbourhoods
As in most small-area research, we define neighbourhoods by census tracts (CTs). Census tracts are small geographical units representing neighbourhood-like communities in census metropolitan areas (CMAs) and in census agglomerations (CAs) with an urban core population of 50 000 or more. CTs are initially delineated by a committee of local specialists (for example, planners, health and social workers, educators) in conjunction with Statistics Canada. They typically have a population of 2500 to 8000. In 2006, for instance, about 41 per cent of the tracts in any city had between 3000 and 5000 persons and about 68 per cent ranged in size from 3000 to 7000 people, with an average of roughly 5300.
With respect to comparability of results over time, indices of neighbourhood inequality may be sensitive to variations in the number and population of tracts. Tracts that are initially homogeneous may become more heterogeneous as populations within tracts increase. Such changes could affect the distribution of neighbourhood income. To maintain an average population size of tracts over time, Statistics Canada sub-divides tracts when they became too populous, reducing the likelihood that changes in tract size influence the comparability of results over time.
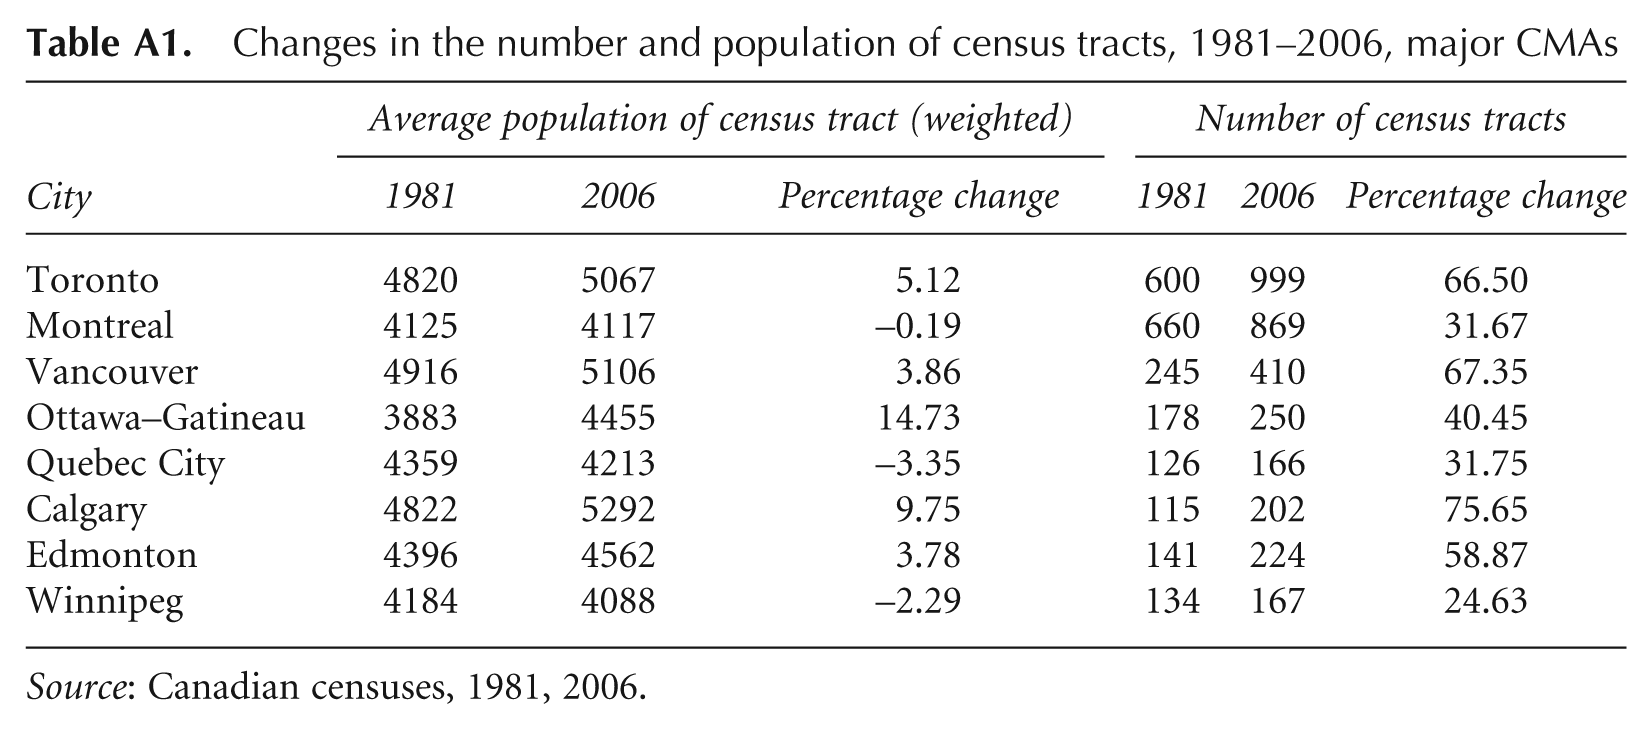
Over the period studied, we use the CT boundaries as they exist in each year. That is, the number of CTs in a CMA can change with time, mainly through the addition of new tracts in outlying areas (Appendix, Table A1). While a few census tracts split over time, most remain longitudinally consistent. To determine whether changes in boundaries had a significant effect on the analysis, we also computed the results using a set of fixed CT boundaries, excluding new census tracts that were added, mainly in the suburbs, between 1981 and 2006. The results changed little. 9
3. The Rise in Neighbourhood Inequality
Just how different are average family incomes in rich and poor neighbourhoods? In 2005, the richest 5 per cent of neighbourhoods had average after-tax family incomes that were roughly two to three times those of the incomes in the poorest 5 per cent of neighbourhoods (Table 1). Between 1980 and 2005, this 95/5 ratio increased in the majority of cities. Calgary and Toronto demonstrate the largest neighbourhood income gaps in 2005; the richest 5 per cent had average family incomes 2.9 times those of the poorest neighbourhoods. Quebec City had the lowest gap, with a ratio of 1.9.
Adult equivalent adjusted neighbourhood income at various points in the neighbourhood income distribution, 1980 and 2005, in thousands of constant 2000 dollars
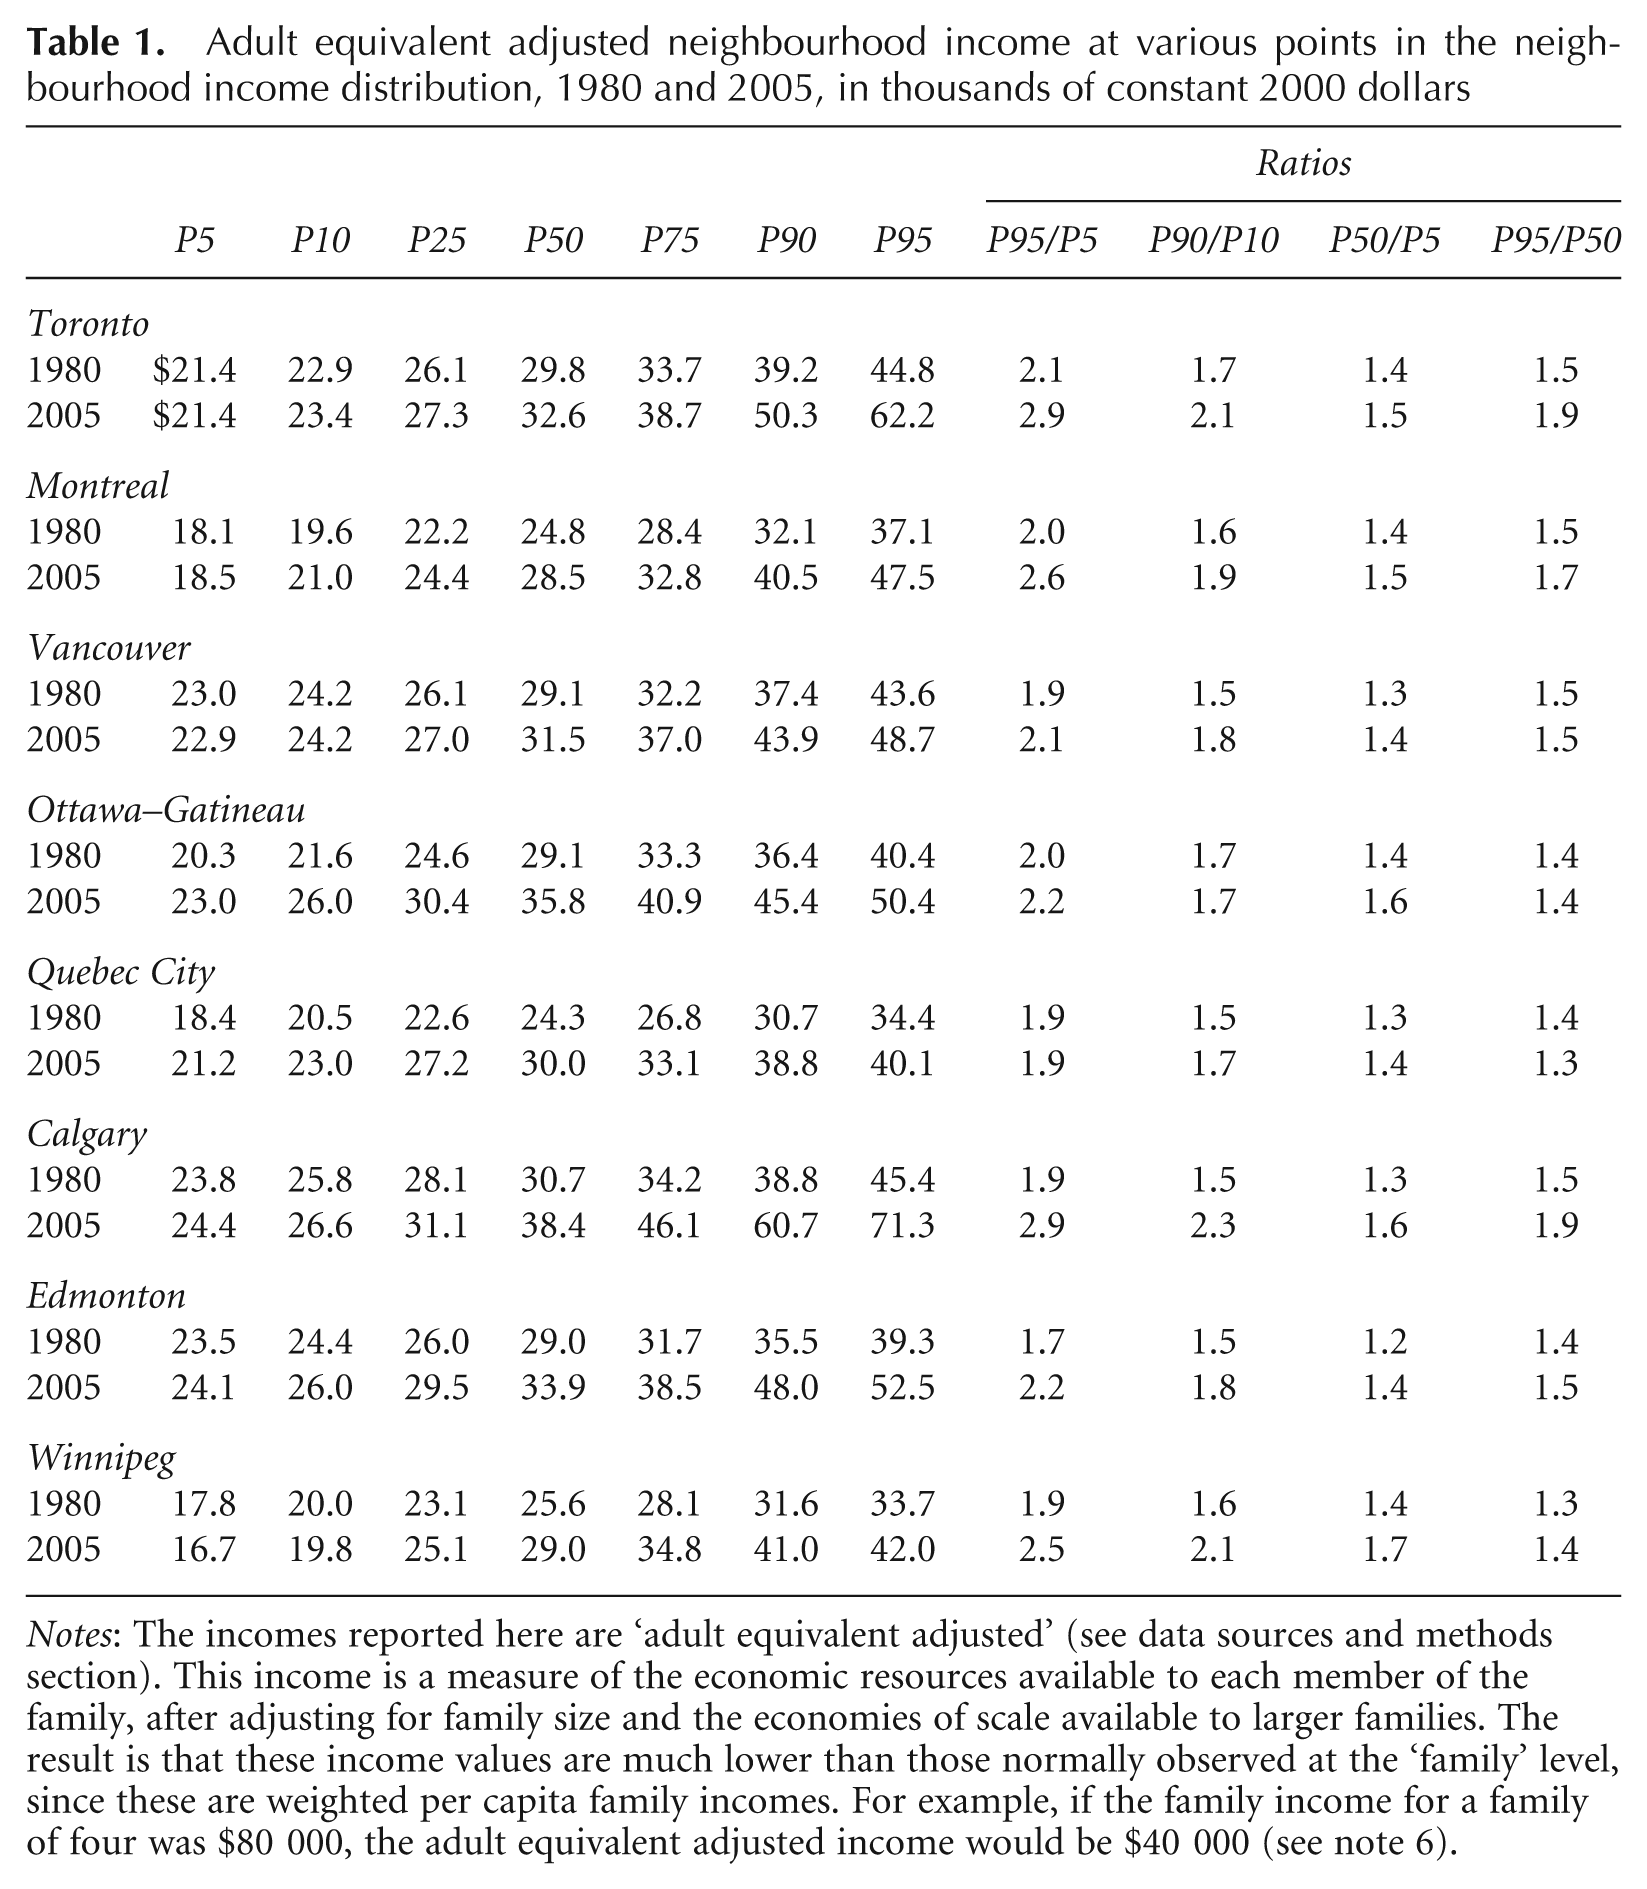
Notes: The incomes reported here are ‘adult equivalent adjusted’ (see data sources and methods section). This income is a measure of the economic resources available to each member of the family, after adjusting for family size and the economies of scale available to larger families. The result is that these income values are much lower than those normally observed at the ‘family’ level, since these are weighted per capita family incomes. For example, if the family income for a family of four was $80 000, the adult equivalent adjusted income would be $40 000 (see note 6).
Neighbourhood income inequality can rise because incomes among both richer and poorer neighbourhoods increase, but at a much faster rate among the richer than in poorer neighbourhoods.
Over the 1980–2005 period, there was essentially stagnation in average family incomes among neighbourhoods at the bottom of the distribution. Average family income in the poorest 10 per cent of neighbourhoods changed between −4 per cent and +5 per cent (Table 2). The exceptions are Quebec City and Ottawa–Gatineau, where incomes at the bottom rose around 10 per cent, still little change over such a long period. Incomes in the richest 10 per cent of neighbourhoods rose by 25 per cent to 75 per cent over the same period, depending upon the city. Thus, the average family in the poorest neighbourhood had virtually no more purchasing power in 2005 than in 1980, in spite of considerable economic growth over the period.
Percentage change in mean income by neighbourhood decile, post-tax equivalent income, 1980–2005

Source: Canadian censuses.
When indexed by the familiar Gini coefficient (Table 3), neighbourhood inequality rose substantially in six of the eight Canadian cities between 1980 and 2005. 10 Furthermore, the range in inequality increased. In 1980, the city with the highest inequality (Toronto) had a Gini index 1.4 times as high as that of the city with the lowest (Edmonton). By 2005, neighbourhood inequality in Calgary, the city with the highest inequality, was 1.8 times that in Quebec City, that with the lowest.
Neighbourhood inequality (Gini coefficients), post-tax equivalent income, 1980–2005

Source: Canadian censuses.
4. The Contribution of Earnings and Transfers to Rising Neighbourhood Inequality
The basic parameters of the rise in family income inequality since 1980 have been well documented. Canada experienced increasing inequality in family market incomes over virtually the entire 25-year period. Between 1980 and the early 1990s, however, changes in the distribution of market incomes were offset by rising transfers and taxes, so that inequality in final disposable family income remained stable. Thereafter, however, changes in the tax transfer system failed to keep pace with rising family market earnings inequality, and family disposable income inequality rose (Heisz, 2007; Frenette, Green and Picot, 2006; Frenette, Green and Milligan, 2007).
The story is much the same for neighbourhood income inequality. Changes in neighbourhood earnings have driven the rise in neighbourhood inequality and the transfer system has not offset the earnings-induced changes in neighbourhood income. To demonstrate this outcome, we assess the effect of changes over the past quarter-century in the distribution among neighbourhoods of various income components on neighbourhood inequality. The income components include employment earnings, government transfers and investments and capital gains.
Following Lerman and Yitzhaki (1985), the overall neighbourhood Gini can be decomposed by underlying income sources. The contribution of any particular income source (

That is, overall inequality is determined by inequality in the distribution of the component itself, its share in the overall income package and its covariation with the remaining income components. We consider five income components that constitute family income: employment earnings; government benefits associated with the retired population (i.e. CPP/QPP, OAS and GIS); other government benefits such as social assistance, the child tax credit and EI payments; other income such as investment income and private pensions; and, personal income taxes. 11 The last component can be regarded as a negative income. In this decomposition, as before, the census tract is the unit of analysis and the income components are average neighbourhood values. The neighbourhoods are weighted by their population.
Of the five income components, the ‘other income’ component (investment and private pension) and the retirement-related transfers (OAS/GIS and CPP/QPP) are the most unequally distributed among neighbourhoods, with Ginis ranging from 0.300 to 0.465, depending upon the city and the year. People in the richer neighbourhoods have far more income from these sources than those in poorer neighbourhoods. This compares with a Gini of only 0.130 to 0.225 for the earnings component. However, in 2005 retirement transfers were much more equitably distributed among neighbourhoods than in 1980, thus tending to reduce overall neighbourhood inequality. Furthermore, there was little change in the contribution of the investment/private pension component. Neighbourhood family earnings inequality, in contrast, rose dramatically between 1980 and 2005. In Toronto, the neighbourhood earnings Gini rose by 85 per cent (or 0.112 points), and in Calgary by 100 per cent (0.117 points). The increase in neighbourhood family earnings inequality was smaller in other cities, but still ranged from 30 per cent to 60 per cent. These are enormous increases for an indicator that is very difficult to move. By way of comparison, for Canada as a whole the rise in the family earnings Gini during the 1980s, a decade considered to have experienced a significant rise in earnings inequality, was only 6 per cent and, during the 1990s, 12 per cent (Heisz, 2007).
A more precise assessment of the contribution of each income component to the rise in the neighbourhood Gini is shown in Table 4. For example, in Calgary, neighbourhood income inequality rose by 81 per cent, representing a 0.087 point rise in the Gini. Rising neighbourhood earnings inequality contributed a 0.117 point rise in the overall Gini, accounting for more than 100 per cent of the overall rise, but this was offset by taxes, which reduced overall after-tax neighbourhood income inequality by 0.049 points. The transfer system played little if any role in this story of change. Sometimes reducing, and at other times increasing, neighbourhood inequality, the effect was always so small as to be insignificant compared with the earnings component. The cities that experienced large increases in neighbourhood inequality did so because they had large increases in neighbourhood family earnings inequality.
The contribution of income sources to rising neighbourhood inequality, 1980–2005

Note: percentages are shown in parentheses.
Source: Canadian censuses.
So the main driver of change in neighbourhood outcomes clearly lies in the labour market and changes in family composition that impact family earnings. This raises the question of whether these changes resulted from changing employment opportunities or changes in earnings among the employed.
5. Neighbourhood Changes in Employment and Earnings
Family earnings inequality among neighbourhoods can change either as a result of changes in employment rates or changes in the relative earnings of the employed. Our main conclusion in this section is that changes in relative earnings, not employment rates, were the main driver of rising neighbourhood inequality.
We use neighbourhood employment rates (proportion of the population with a job) and unemployment rates as of the reference week (in May or June, depending upon the census) to assess changes in job-holding among neighbourhood residents. 12 To assess the impact of changes in earnings among the employed, we consider average individual annual employment earnings in the neighbourhood of those employed at some time during the year. 13
With the exception of Ottawa and Quebec city, the two cities that experienced little change in neighbourhood inequality, employment rates either declined or increased more slowly in the poorest neighbourhoods, while rising in the richer neighbourhoods (Table 5). However, the poorer employment outcomes in the lower-income neighbourhoods were largely a product of the 1980s. Over the 1990–2005 period, the poorer neighbourhoods actually gained more than richer ones with respect to employment levels, often dramatically more. This is particularly true in the western cities, where employment rates expanded rapidly in the poorer neighbourhoods (by 5 to 7 percentage points), while changing little in the richer neighbourhoods. With the exception of Toronto, employment and unemployment levels did not become more spatially concentrated in the poorer neighbourhoods over the 25-year period. The pattern with respect to earnings is very different. With the exception of Ottawa–Gatineau, the earnings of job-holders aged 25 to 54 fell in the poorer neighbourhoods while rising in the richer neighbourhoods (Table 6). Earnings among job-holders fell by between 5 per cent and 15 per cent in the poorest 10 per cent of neighbourhoods, while rising between 7 per cent and 80 per cent in the richest neighbourhoods. Toronto and Calgary saw earnings fall 6 per cent to 8 per cent at the bottom, while rising 62 per cent to 82 per cent in the richer neighbourhoods. Hence, it is not so much the ability to locate jobs that accounts for the rise in the earnings gap between richer and poorer neighbourhoods, but rather the type of job found and, more specifically, the annual earnings in the jobs held.
Percentage point change in employment and unemployment rates, by neighbourhood deciles

Notes: Neighbourhood employment rates are measured as the proportion of neighbourhood population with a job in the reference week. The unemployment rates are measured as the proportion of neighbourhood labour force without a job in the reference week. In all cases, we focus on workers 25–54 years old.
Source: Canadian censuses.
Percentage change in mean annual individual earnings, by neighbourhood deciles
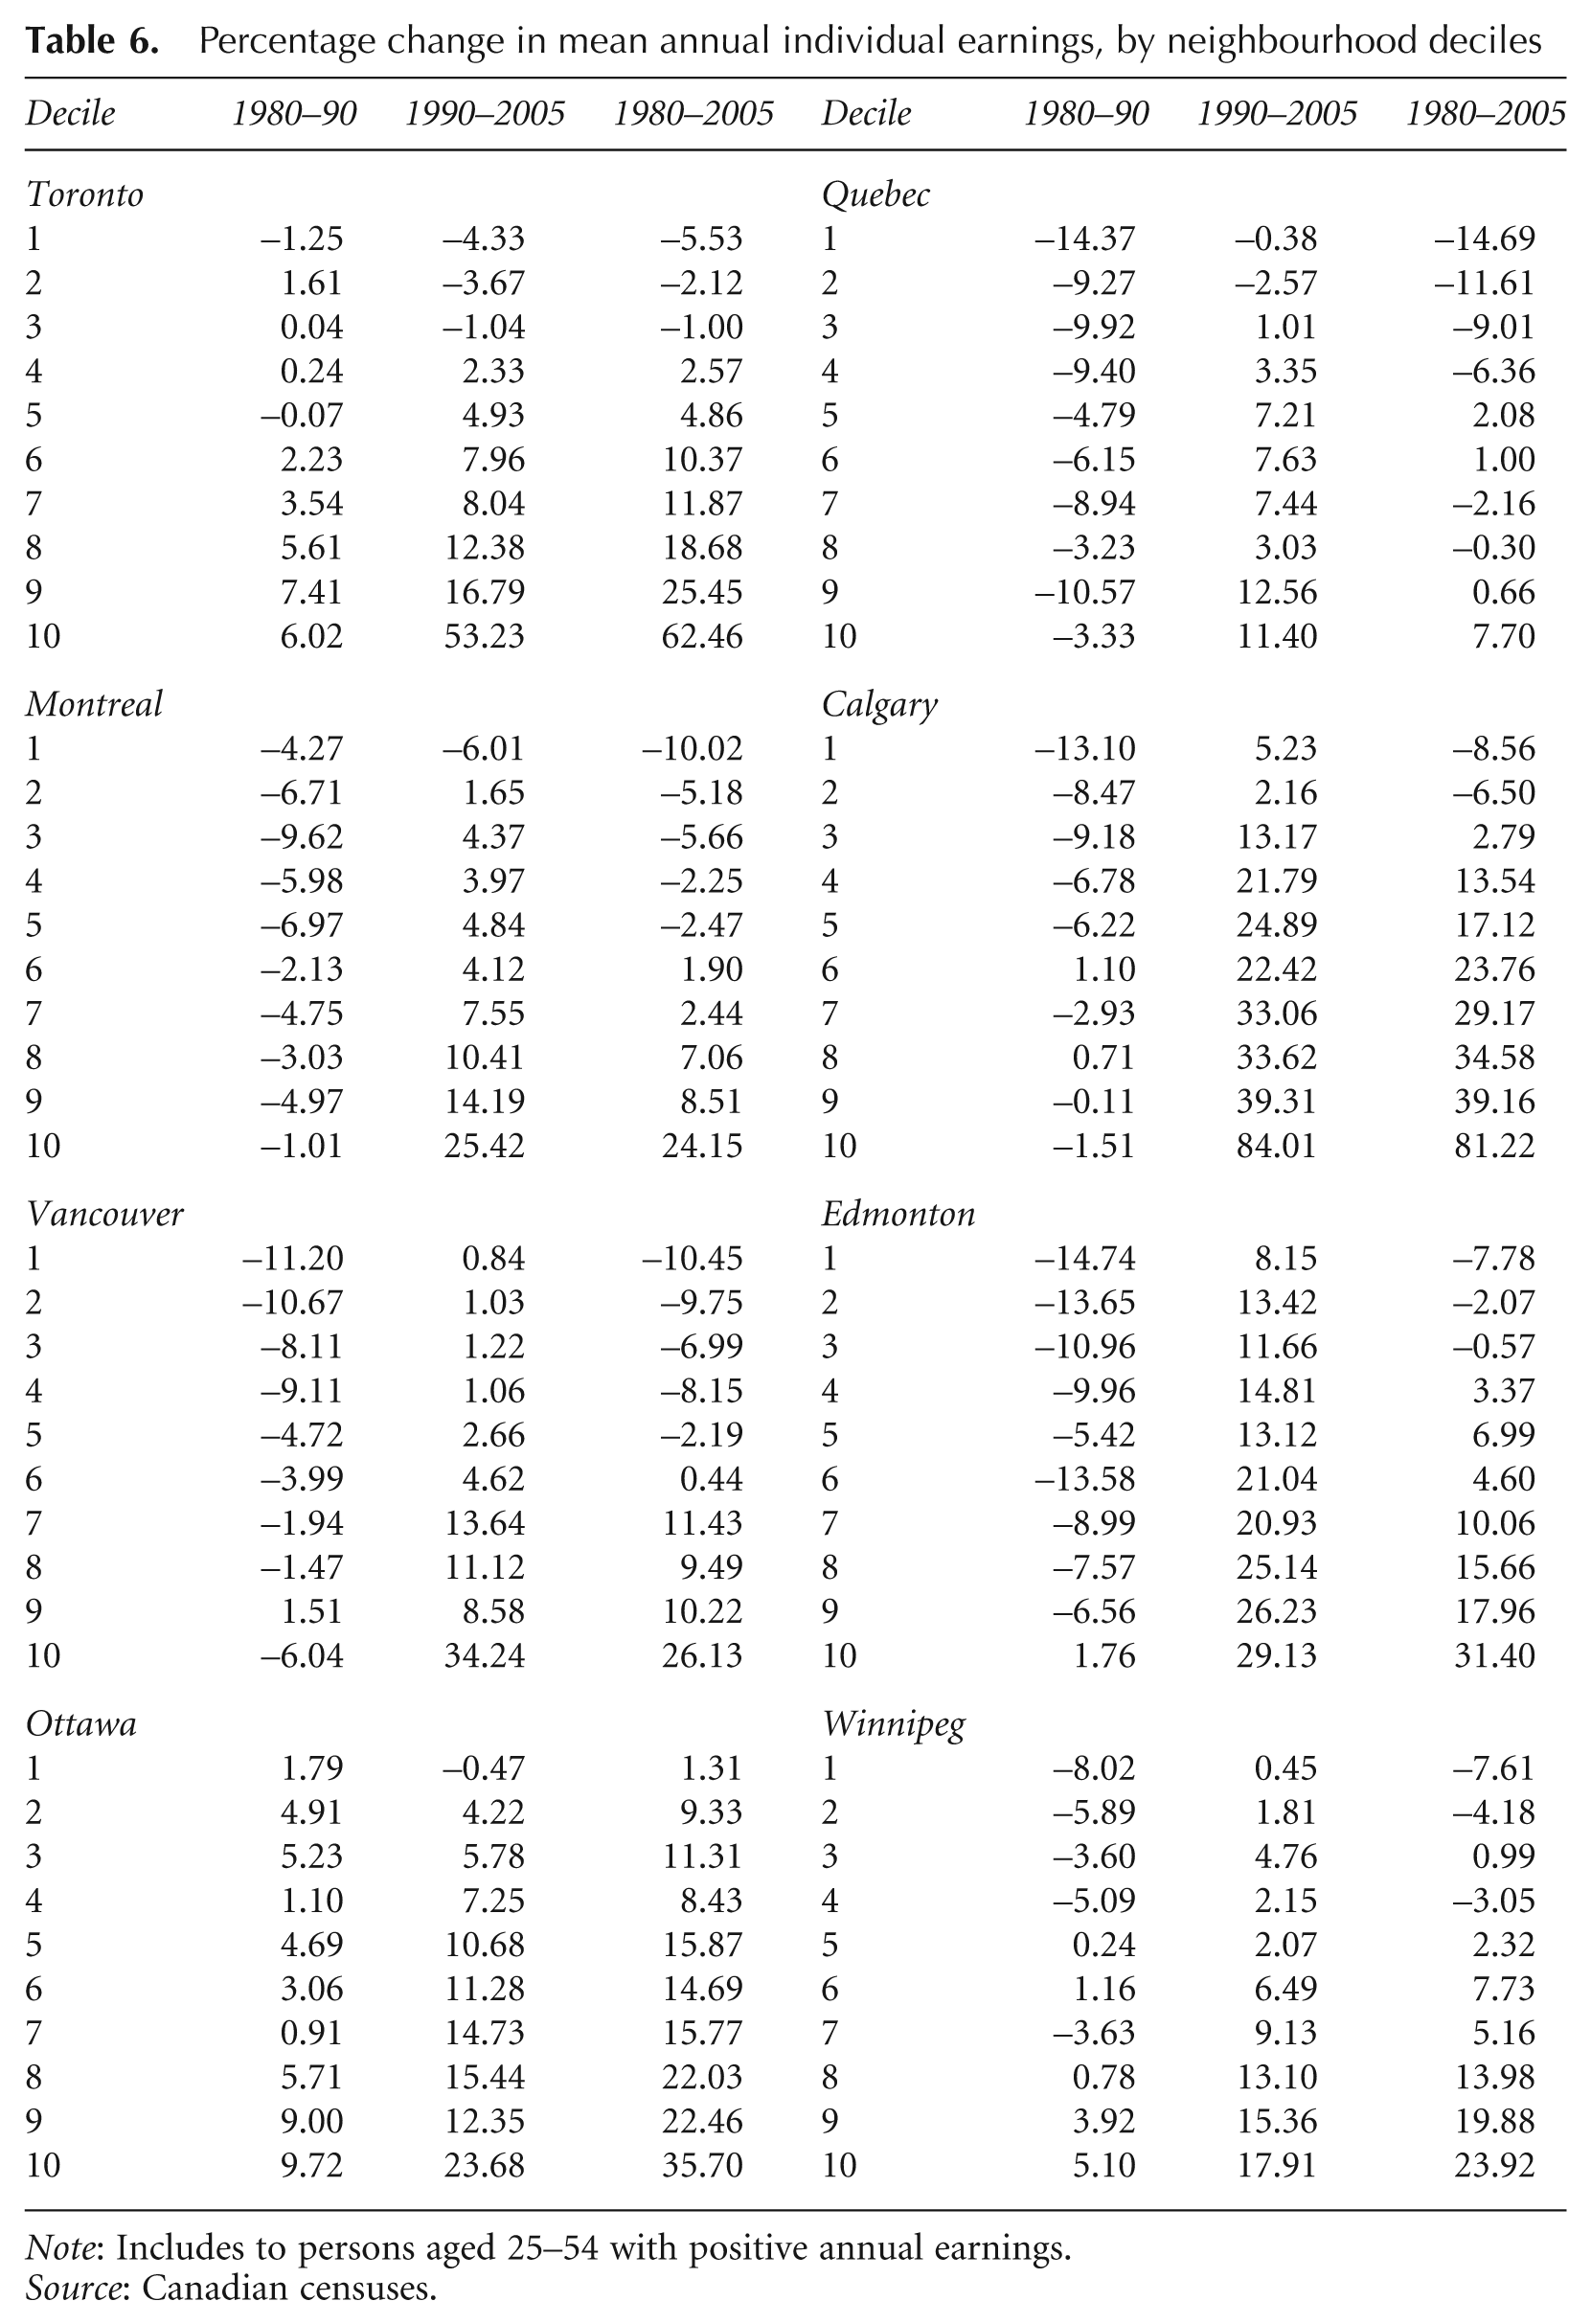
Note: Includes to persons aged 25–54 with positive annual earnings.
Source: Canadian censuses.
6. The Role of Residential Segregation
Rising neighbourhood income disparity may simply reflect the well-documented trend of growing overall family income inequality at the city level. However, this may not always be the case. Rising neighbourhood inequality may also reflect the manner in which poorer and richer families sort themselves into neighbourhoods, independent of family income inequality levels. If low-income families become increasingly concentrated in low-income neighbourhoods and high-income families in high-income neighbourhoods (i.e. if the correlation between family and neighbourhood income rises so that neighbourhoods become more homogeneous with respect to incomes), this too can result in rising neighbourhood income inequality. We refer to this possibility as economic spatial ‘segregation’.
There is considerable interest in this concept. Planners often strive for heterogeneity in neighbourhoods—neighbourhoods with a mix of low- and high-income families. Economic heterogeneity dampens ‘neighbourhood effects’, particularly for poorer families. Neighbourhood effects, driven by peer group effects or local financing possibilities, can result in poorer education, crime and health outcomes for poorer families clustered in poor neighbourhoods. If economic spatial segregation is increasing and neighbourhoods are becoming more homogeneous with respect to income, then such neighbourhood effects could be increasing.
To untangle the role of economic segregation from that of rising family income inequality in the city as a whole, we start with a standard accounting framework (Allison, 1978; Cowell, 1995) where total inequality for a metropolitan area (

Rearranging the identity in equation (2), neighbourhood inequality can be rewritten as:
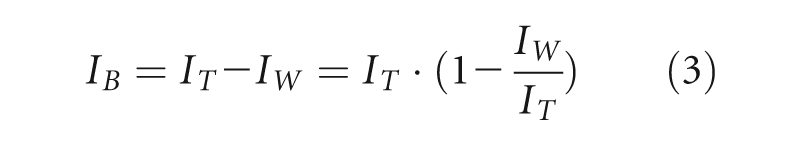
which can be expressed as a function of total city-wide inequality (

Equation (3) implies that there are two ways in which neighbourhood inequality can increase: as a result of an increase in city-wide inequality among all families; and, as a result of increased neighbourhood sorting—i.e. rising economic segregation.
To reach a better understanding of the ‘neighbourhood sorting index’, (NSI), we note that the index ranges between 0 and 1. Consider the unlikely event that all neighbourhoods have the same mean income. In this case, the between-tract inequality is zero (
Neighbourhood segregation indices, 1980–2005
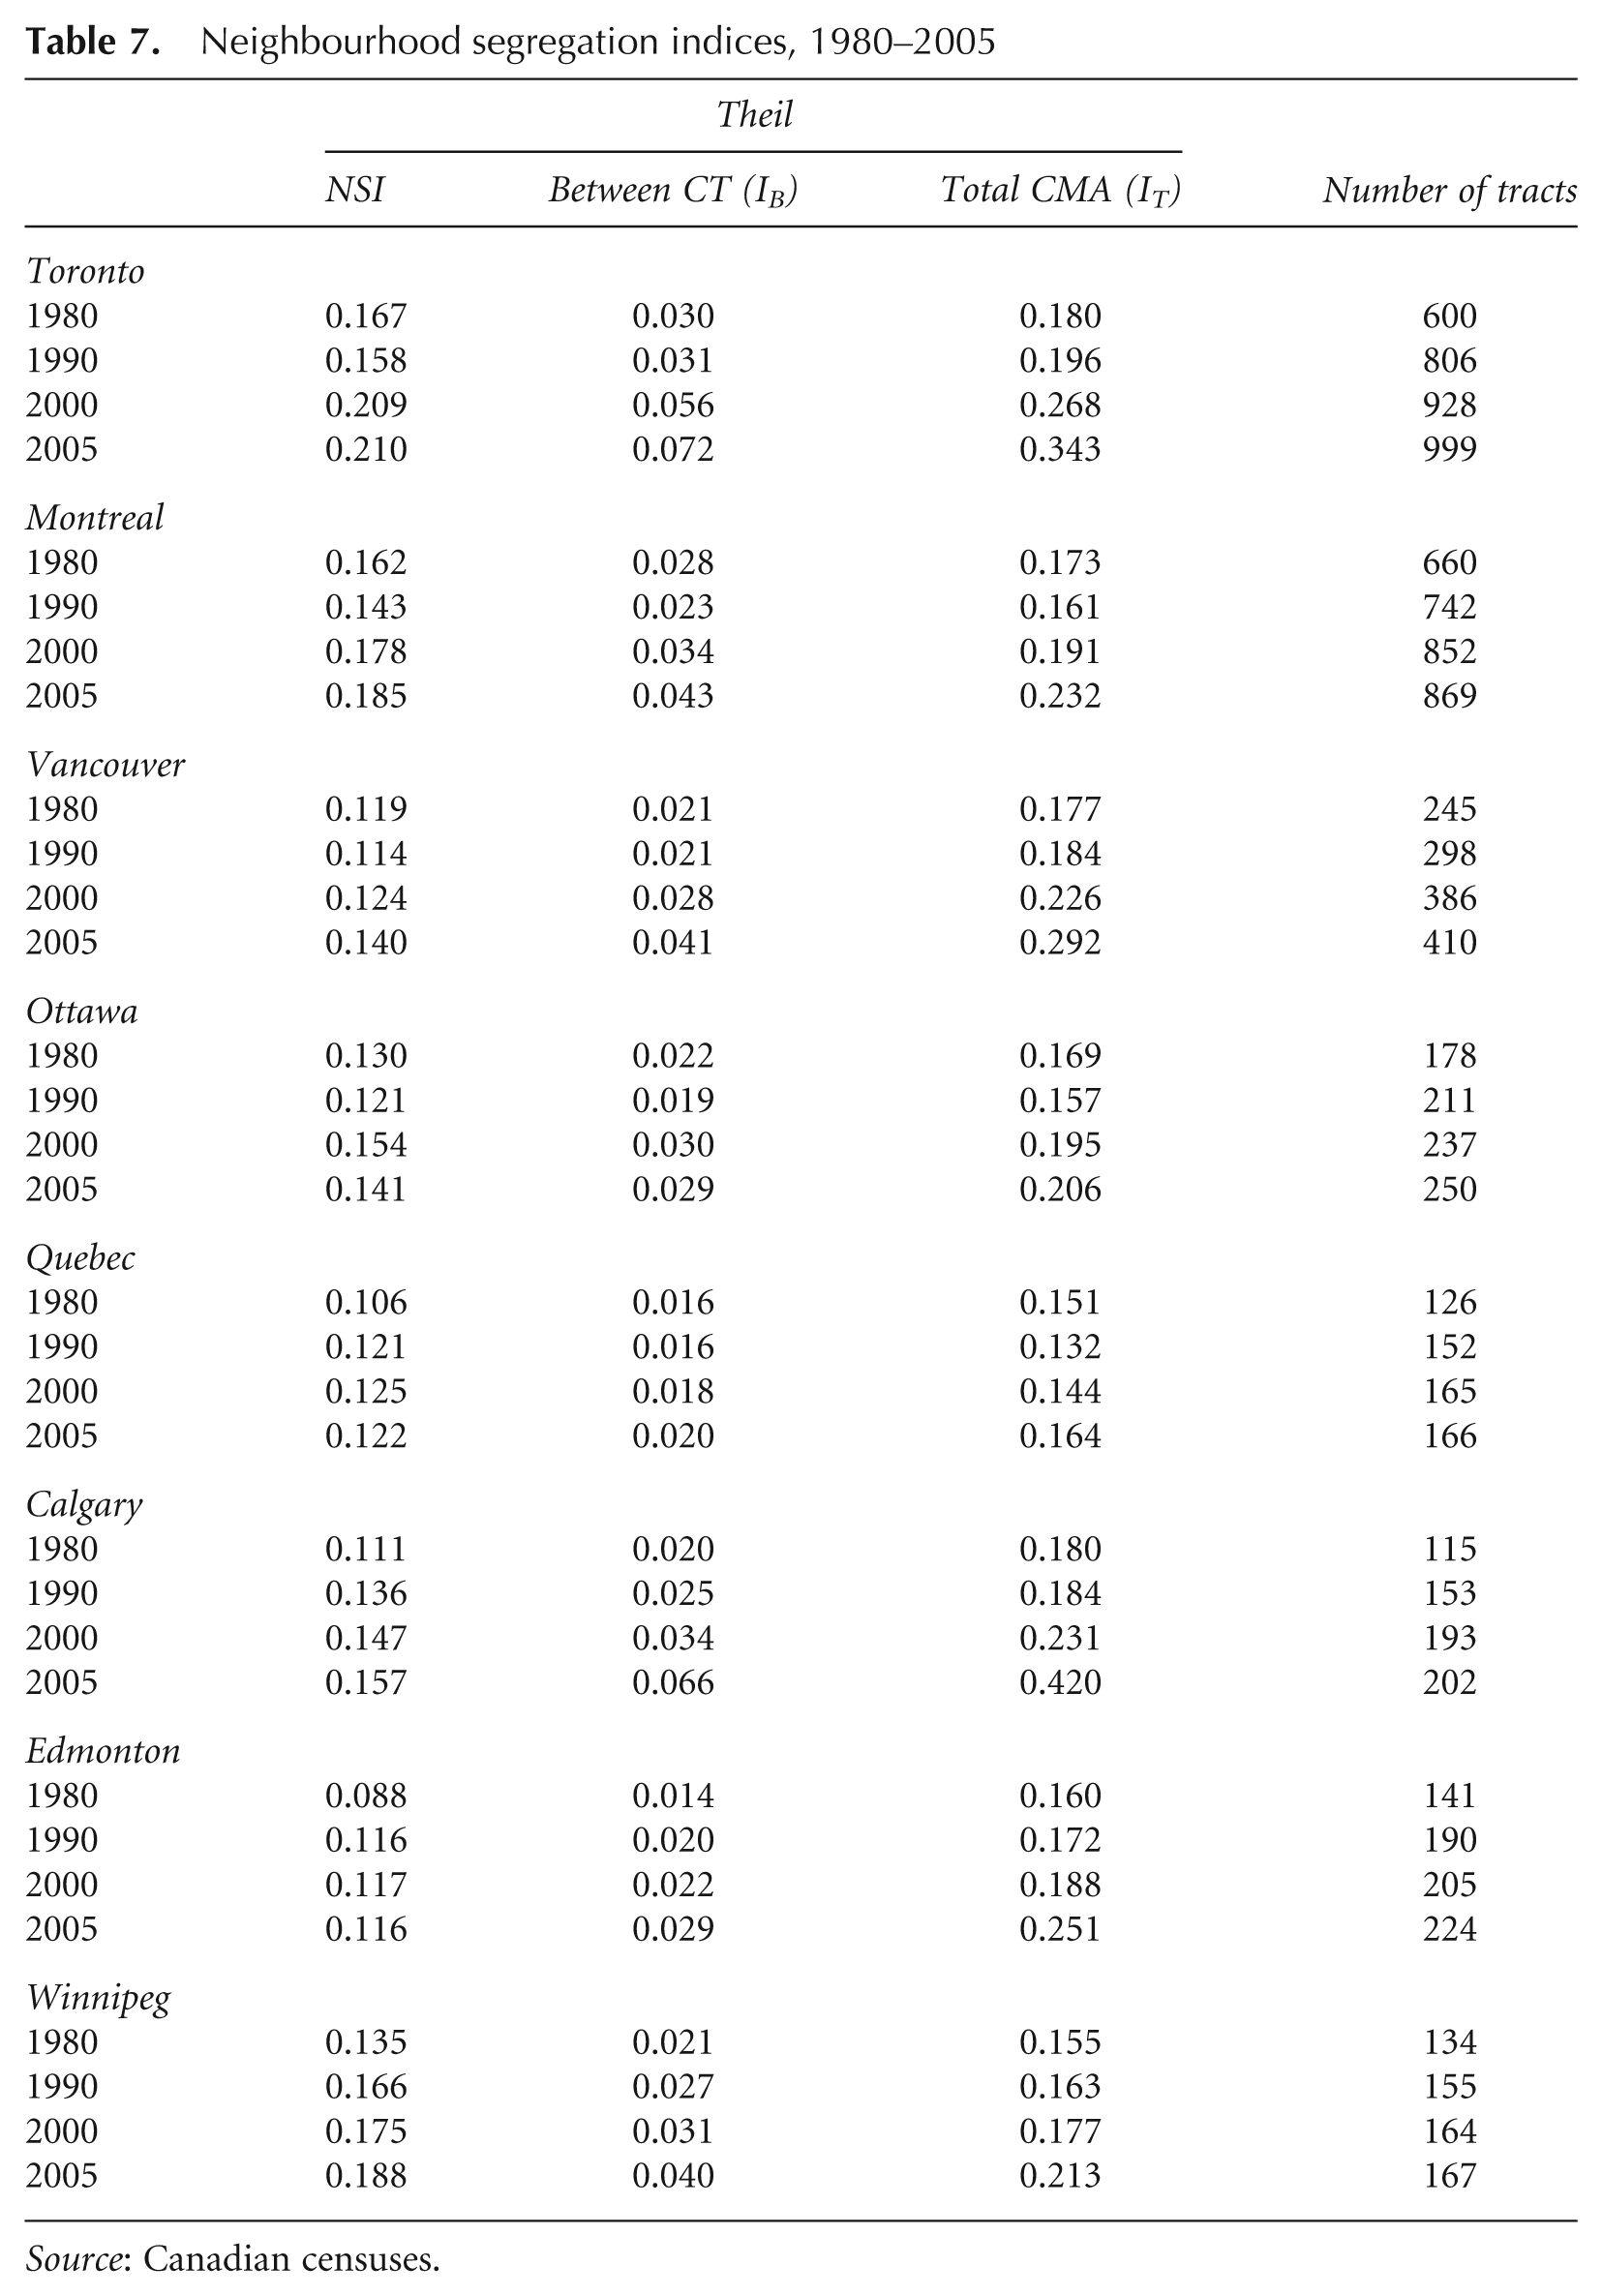
Source: Canadian censuses.
However, we are mainly interested in determining the extent to which the rising neighbourhood inequality observed earlier is due to an increase in city-level family income inequality, or to rising economic segregation (i.e. to increased neighbourhood sorting). To answer this question, we express equation (3) in log form as

The overall change in

This exercise shows that rising economic segregation accounted for a significant share (from one-quarter to one-half) of rising neighbourhood inequality in all metropolitan areas (Table 8). In Toronto, for instance, neighbourhood inequality rose by nearly 0.9 log points between 1980 and 2005; and more than one-quarter of the increase (0.23 log points) was associated with a rise in the sorting index. Rising economic segregation played an even more important role in Winnipeg where changes in the sorting index contributed about half of the increase in neighbourhood inequality (i.e. 0.33 out of 0.64 log points) over the entire period. The rise in neighbourhood sorting in the four western cities took place during the 2000–05 period of strong economic growth associated with the commodities boom. The eastern cities saw neighbourhood sorting rise during the 1990s.
Decomposing change in neighbourhood inequality (Theil index), by CMA
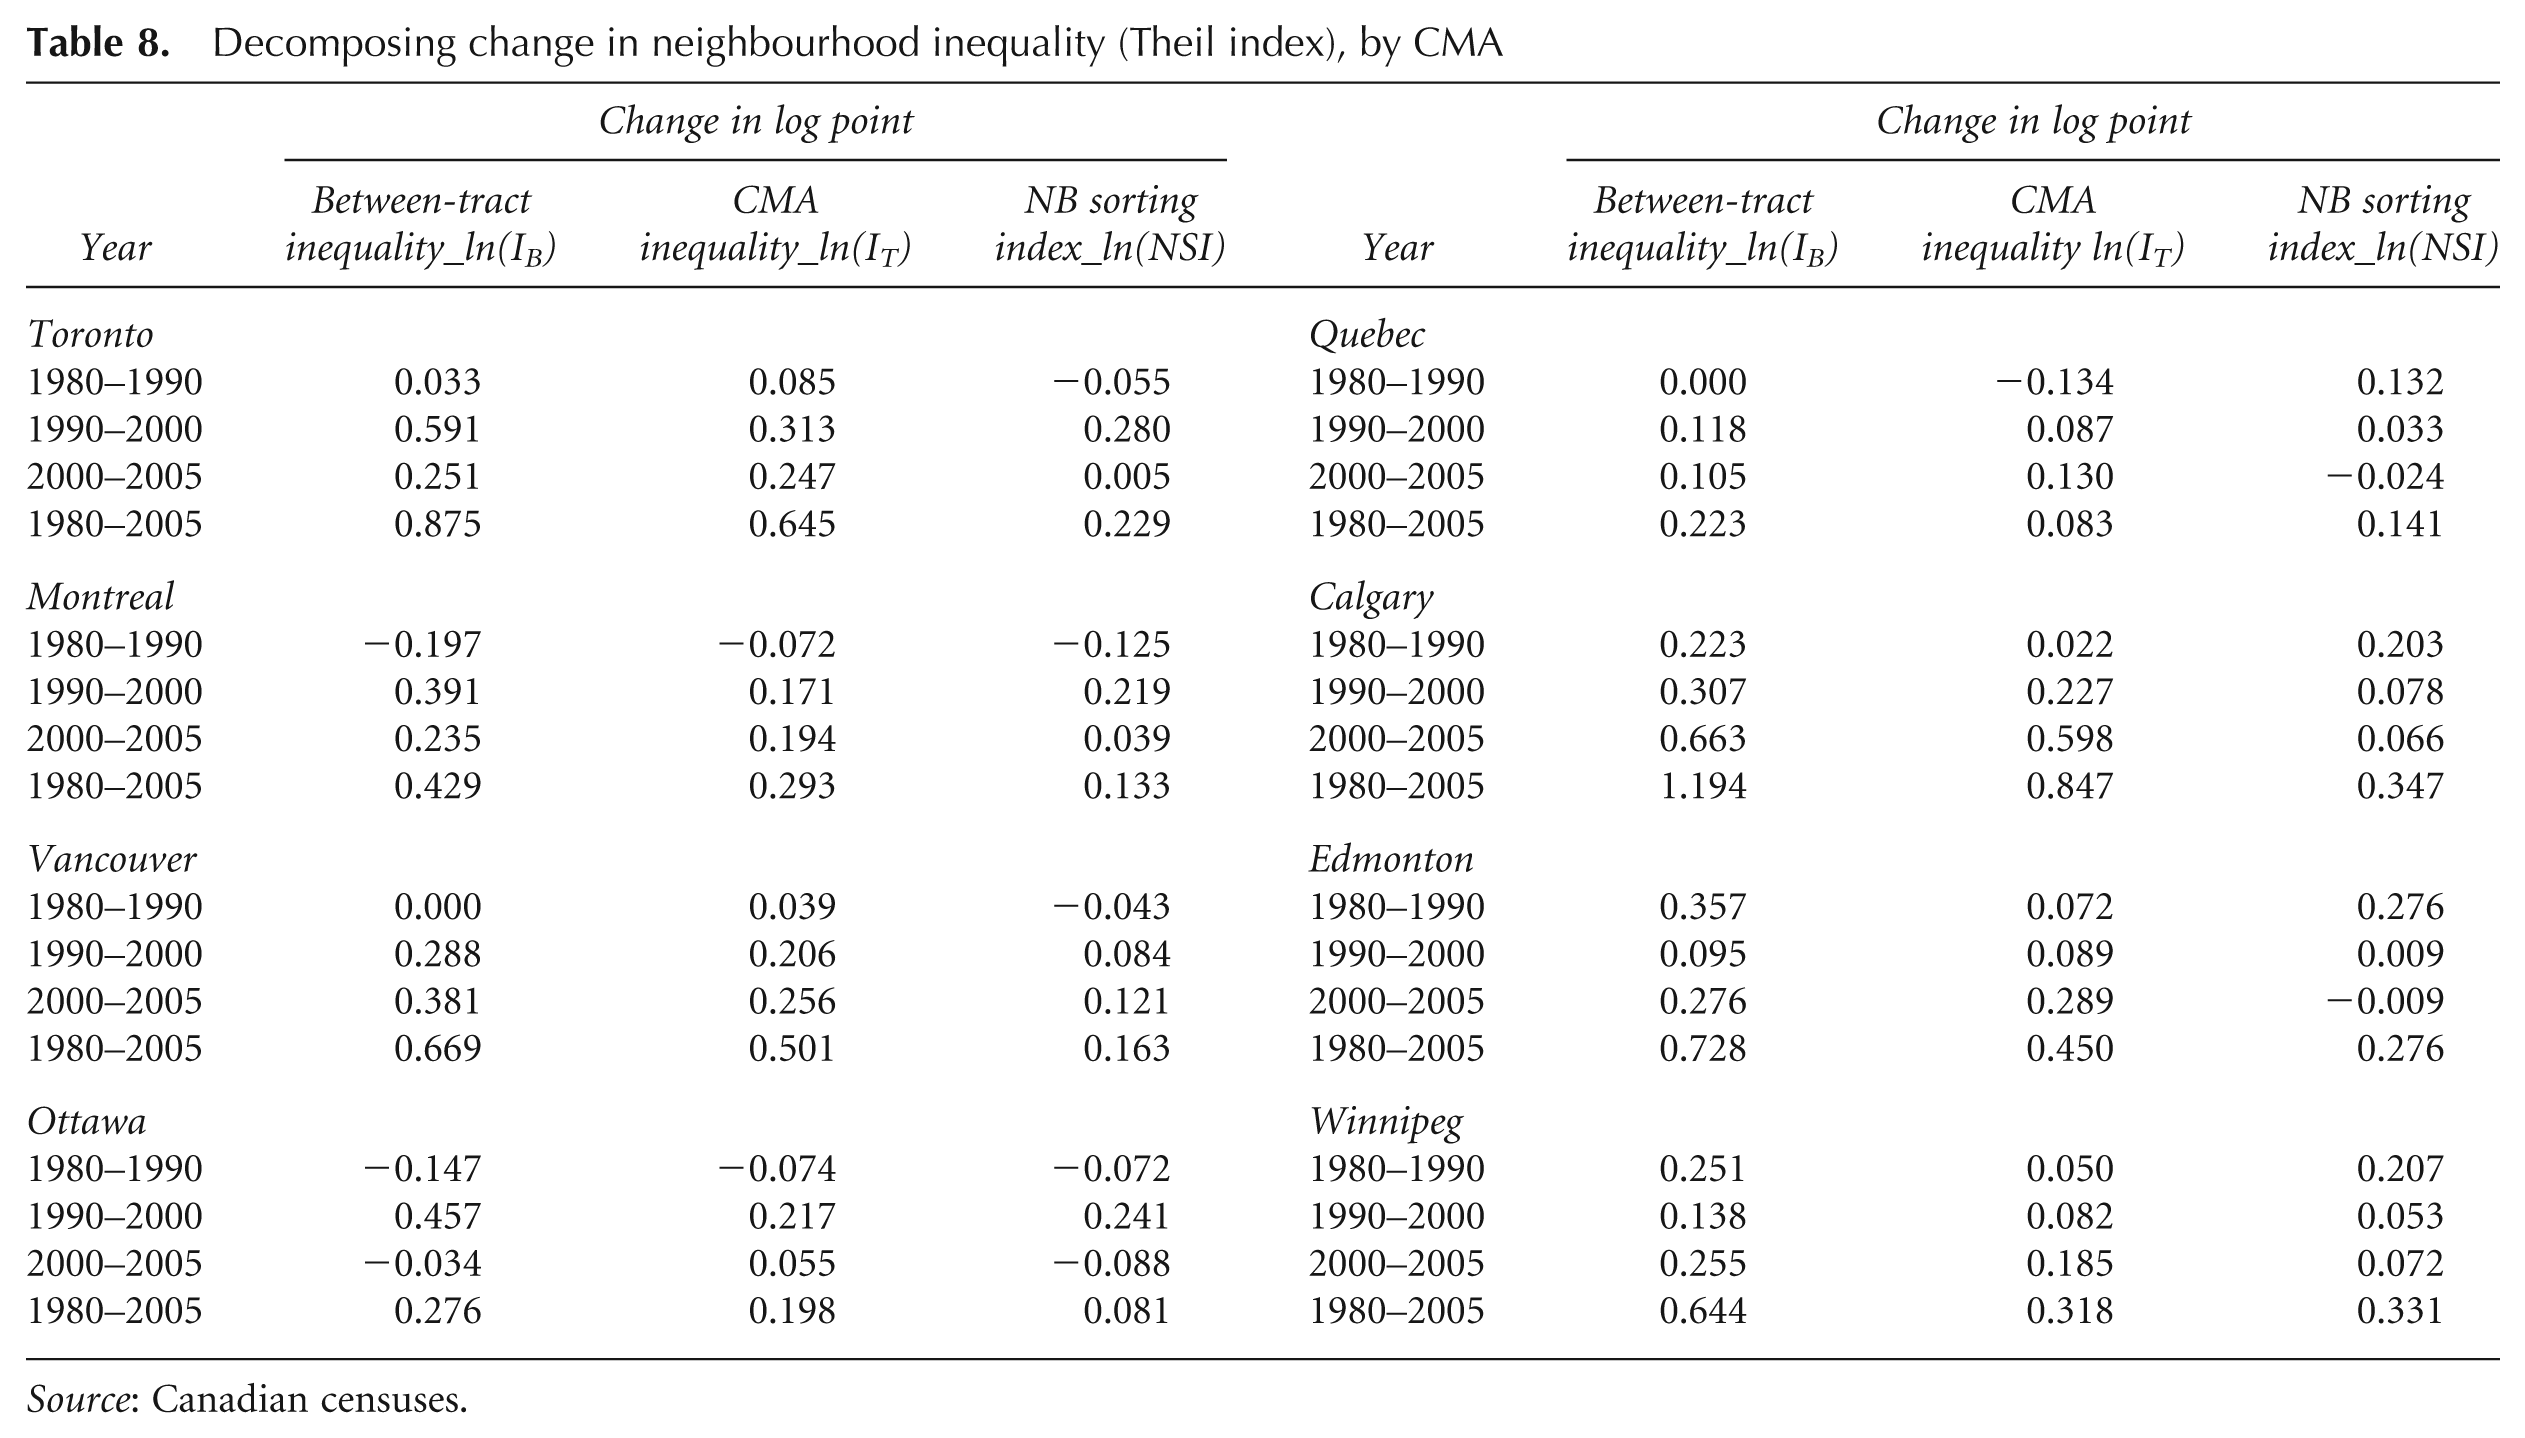
Source: Canadian censuses.
7. Conclusion
Neighbourhood clustering by income level has always been a feature of urban life. The supply and demand for more and less costly residential housing means that like attracts like. As a result, whenever total family income inequality rises, neighbourhood income inequality also tends to rise. Yet neighbourhood inequality can also increase due to changes in economic segregation (‘neighbourhood sorting’)—changes in the propensity of families with similar income levels to live together in the same neighbourhoods, even in the absence of rising family income inequality.
Between 1980 and 2005, neighbourhood income inequality (measured by the Gini coefficient) grew only slightly in Ottawa–Gatineau (10 per cent) and Quebec City (12 per cent), somewhat more in Montreal (22 per cent) and in the remaining five large metropolitan regions from 36 per cent (Vancouver) to a high of 81 per cent (Calgary).
We show that most, but not all, of these increases in most cities were driven by the rise in family income inequality. Hence, for most Canadians, the rising neighbourhood income gap was mainly a byproduct of the rising family income gap. The overall rise in neighbourhood inequality would have been fairly modest in the absence of the changes in total family income inequality that occurred over the period. And we may be underestimating the effect of rising family income inequality relative to that of rising economic segregation. US research suggests that some portion of the rise in neighbourhood economic segregation may itself be driven by rising family inequality (Reardon and Bischoff, forthcoming). Greater inequality in incomes can lead to greater inequality in the quality of the housing that individuals can afford and, as a result, greater neighbourhood economic segregation or ‘sorting’. Empirical research by Reardon and Bischoff indicates a positive association between rising inequality and economic segregation. While establishing causality presents serious challenges, they conclude that it was more likely to run from inequality to segregation, rather than the reverse. If true, some of the effect on neighbourhood inequality attributed here to rising neighbourhood economic segregation could in fact be driven by rising family income inequality.
We show that the differential outcome between richer and poorer neighbourhoods was almost entirely the result of differential growth in family earnings. Family earnings stagnated or declined at the bottom of the neighbourhood income distribution, while rising substantially at the top. Changes in the distribution of investment or pension income, transfers and other sources of income played only a minor role in the rising income gap between richer and poorer neighbourhoods. 14
Recent research suggests that much of the rise in family earnings inequality was related to changing family formation patterns: the increased tendency of high (and low) earners to live with partners with similar earnings power. This increased clustering of high (and low) earners within families contributed significantly to rising family earnings inequality (Fortin and Schirle, 2006; Lu et al., 2009). Unemployment is of course higher in poorer neighbourhoods, but there was no increase in the concentration of unemployment in these communities. Rather, the jobs in which members of poorer communities increasingly found themselves were, in most cities, generating lower annual earnings, unlike those found by the residents of richer neighbourhoods.
Differences in neighbourhood income levels are the product of historical urban settlement patterns that are partially policy-induced (the result of zoning and other regulations governing urban development). However, the stagnation of disposable family income at the bottom of the neighbourhood income distribution since the 1980s is mainly a byproduct of broader trends in the distribution of family earnings that are the result of changes in labour markets and family composition.
Nevertheless, our results also demonstrate that rising economic segregation cannot be entirely discounted as a contributing factor to the increase in neighbourhood inequality. We have pointed to the possibility that rising economic segregation may be partially endogenous, the result of higher levels of family income inequality. As usual, we have to conclude with a call for better theory and more research.
Footnotes
Notes
Funding Statement
This research received no specific grant from any funding agency in the public, commercial or not-for-profit sectors.
Appendix
Changes in the number and population of census tracts, 1981–2006, major CMAs
| Average population of census tract (weighted) | Number of census tracts | |||||
|---|---|---|---|---|---|---|
| City | 1981 | 2006 | Percentage change | 1981 | 2006 | Percentage change |
| Toronto | 4820 | 5067 | 5.12 | 600 | 999 | 66.50 |
| Montreal | 4125 | 4117 | –0.19 | 660 | 869 | 31.67 |
| Vancouver | 4916 | 5106 | 3.86 | 245 | 410 | 67.35 |
| Ottawa–Gatineau | 3883 | 4455 | 14.73 | 178 | 250 | 40.45 |
| Quebec City | 4359 | 4213 | –3.35 | 126 | 166 | 31.75 |
| Calgary | 4822 | 5292 | 9.75 | 115 | 202 | 75.65 |
| Edmonton | 4396 | 4562 | 3.78 | 141 | 224 | 58.87 |
| Winnipeg | 4184 | 4088 | –2.29 | 134 | 167 | 24.63 |
Source: Canadian censuses, 1981, 2006.