
Abstract
This paper assesses the residential segregation of German immigrants from Turkey, Italy, the Balkans and eastern Europe with a special focus on the link between social and ethnic segregation. Microdata from the German Socioeconomic Panel Study (SOEP) are used. A new dataset provided by the microm Micromarketing-Systeme und Consult GmbH makes accessible information on participants’ immediate residential environments at the micro-neighbourhood level where an average neighbourhood contains only eight households. Substantial levels of residential isolation in the form of own-group overexposure are found for all four migrant groups. Based on previous research, an enhanced methodology is proposed to measure the effect of socioeconomic neighbourhood sorting on ethnic residential segregation. It is shown that differences in income, education, language skills and village/city size have the potential to account for 29–84 per cent of the residential isolation of the four migrant groups.
1. Introduction
Residential segregation of racial and ethnic minority groups is subject to recurring debate and frequent controversies. It is often portrayed as the most visible feature of the divides between population groups inherent in many modern societies. This paper aims to assess the residential segregation of migrant groups in Germany and to understand its causes. A relatively new dataset provided by the microm Micromarketing-Systeme und Consult GmbH contains information about the residential environment for participants in the German socioeconomic Panel Study at a micro-neighbourhood level. The analysis of residential segregation in such small geographical areas presents a novelty for the study of segregation. This paper first aims to quantify the residential isolation of the principal migrant populations in Germany measured as own-group overexposure. Secondly, it assesses how far the observable levels of residential isolation can be explained by differences in socioeconomic characteristics among population groups. The results show that there is substantial residential segregation of the principal migrant groups in Germany, a large portion of which can be attributed to deficits in socioeconomic status. The differences in socioeconomic characteristics not only account for a substantial portion of the observed levels of residential segregation, but also for most of the divergence among migrant groups.
2. Literature Overview
2.1 Theories of Segregation
The separation of ethnic and racial groups in urban space has received great attention since the first contributions by researchers working within the Chicago School in the 1920s (Park et al., 1925/1967; Park, 1926). Observing the tendency of immigrants to North American cities to cluster in ethnically concentrated neighbourhoods, they developed a theory of assimilation which states that improving the socioeconomic status of immigrants would lead to their geographical dispersion and eventual acculturation. In the 1970s, this ‘melting pot’ hypothesis was increasingly rejected (for example, Glazer and Moynihan, 1970) and alternative theories emerged, most notably that of ghettoisation caused by a cycle of deprivation (Wilson, 1987; Massey and Denton, 1993). Forrest et al. (2003, p. 500) describe the various conceptualisations of segregation as a “homogeneity–heterogeneity continuum” between ghettoisation and assimilation. These theories mainly differ with respect to assumptions regarding the form and strength of underlying dynamics which determine residential and social outcomes. Possible such factors include, but are not limited to, individual preferences for ethnic neighbourhood composition (for example, Schelling, 1969; Farley et al., 1978), discriminatory forces in the housing market (for example, Bailey, 1966; Courant, 1978; Yinger, 1986), housing policy (for example, Murie and Musterd, 1996; Wessel, 2000; Bolt et al., 2008) and socioeconomic segregation (for example, Clark, 1986; Galster, 1988; Musterd, 2005). This paper focuses on socioeconomic neighbourhood sorting which has the potential to explain ethnic residential segregation in the presence of status differentials between population groups (for example, Borjas, 1998). The theory of socioeconomic neighbourhood sorting is mainly based on ideas of a polarised occupational structure (Castells, 1989; Sassen, 1991) and residential choice in respect to the provision of public goods and redistributive policies, such as income transfers (Westhoff, 1977; Epple and Romer, 1991; Benabou, 1993; Fernandez and Rogerson, 1996). Previous research has attempted to quantify the influence of social status on ethnic segregation with ambiguous results. Bayer et al. (2004) find that socioeconomic factors such as educational attainment, income and language have the potential to explain sizeable portions of Hispanic (over 90 per cent) and Asian (over 50 per cent) segregation in the San Francisco Bay Area in 1990, while most of African American segregation remains unexplained. Peach (1999), on the other hand, shows that social class only accounts for 8 per cent of Black segregation and 10 per cent of Bangladeshi segregation in London. Similarly, Maloutas (2007) finds that, in Athens in the 1990s, increasing income inequality was accompanied by decreasing segregation levels.
Research on the effect of socioeconomic status on residential outcomes is mirrored by research on neighbourhood effects (see Brooks-Gunn et al., 1997; Sampson et al., 2002). Part of this literature has focused on the effect of residential segregation on the socioeconomic status of minority members, be it in the form of human capital externalities (Borjas, 1992, 1994 and 1995), excessive reliance on ethnic networks (Bates, 1994) or reduced incentives for acculturation (Massey and Denton, 1987). There is indeed increasing evidence for negative effects of living in a segregated neighbourhood on socioeconomic outcomes of minority members (for example, Galster et al., 1999; Musterd et al., 2008). The potential duality in the causal relationship between social and residential outcomes is a major hurdle in interpreting observed correlations thereof.
2.2 Measures of Segregation and the Issue of Scale
In the past, a multitude of measures for residential segregation have been applied. Massey and Denton (1988) evaluate 20 such potential measures and classify them according to five dimensions. The most common measure is the index of dissimilarity (ID) as proposed by Duncan and Duncan (1955) to measure the evenness of a group’s residential distribution. This paper bases its analysis on the P* isolation index which has been proposed by Lieberson (1981) to measure the exposure of one group to the other due to geographical proximity. In this paper, own-group exposure is the relevant number. While the application of single indicators to measure residential segregation is subject to continued debate (for example, Simpson, 2004; Johnston et al., 2005; Peach, 2009), it is a useful tool for quantitative analyses such as that undertaken in this paper.
A common characteristic of segregation measures is that they rely on the division of urban space into smaller sub-divisions. It seems intuitive that levels of segregation can vary strongly depending on the chosen size of these sub-divisions (Openshaw, 1984; Reardon et al., 2006). In much of the research on segregation, the issue of scale has been ignored and most studies rely on rather large divisions, such as census tracts containing more than 1000 households. This is mostly dictated by the available data. However, recent studies stress the importance of micro-level analysis (Rosenbaum et al., 2002; Lupton, 2003; Oliver and Wong, 2003). Especially when relating geographical location to the likelihood of intergroup contact, does it make sense to apply small spatial units because one would expect individuals to be more likely to interact with immediate neighbours rather than anyone merely living in the same part of town. Hipp (2010) shows that the structural characteristics of micro neighbourhoods exhibit a stronger influence on neighbourhood satisfaction than those of larger aggregates. There have been first attempts to assess residential segregation at the micro level. Notably, Deurloo and de Vos (2008) look at small concentration districts in Amsterdam, ranging in area between 5 and 30 hectares. They find that spatial attraction and avoidance between ethnic groups can differ markedly between neighbourhoods with a similar ethnic mix. Drever and Clark (2006) find some evidence that, while ethnic groups in Germany might be mixed at the neighbourhood level, they almost never share the same residential building. This paper aims to quantify the effect of socioeconomic neighbourhood sorting on ethnic residential segregation at the level of micro neighbourhoods in Germany.
3. Methodology
Most analyses of residential segregation focus on the uneven distribution of population groups over spatial units, using large-area indicators of location to calculate segregation indices (for example, Musterd, 2005; Bolt et al., 2008), which quantitative analyses then use in regression analysis to find the causes of segregation (for example, Fahey and Fanning, 2010; Vang, 2010). Due to the availability of new data which provide information about the immediate neighbours of each household, this paper assesses residential segregation in the exposure dimension for very small geographical areas—namely, neighbourhood segments containing at least five and on average eight households. In order to study residential segregation in Germany, these neighbourhood characteristics are linked with information about individual socioeconomic characteristics such as income and educational attainment. Four major questions are answered using various techniques
Question 1: Is there residential segregation of migrant groups in Germany?
The first question asked is whether or not there is residential segregation of ethnic groups in Germany. The data allow an analysis of residential segregation by providing the ethnic composition of each individual’s immediate residential environment. It is especially suited to assess individual residential exposure to certain population groups which amounts to the likelihood of interaction caused by residential proximity (Massey and Denton, 1988). This paper compares the fraction of own-group household heads in the individuals’ immediate neighbourhoods (a particular version of P*) with that averaged over the whole population. The resulting own-group overexposure can be interpreted as an indicator of residential isolation (Bayer et al., 2004).
Question 2: Are there differentials in socio-economic status between those groups?
In order to establish a link between socioeconomic characteristics and residential segregation, one first needs to assess the distribution of those characteristics over population groups. Using simple descriptive statistics, population groups are compared on a broad scale of socioeconomic characteristics from the fields of employment, education, health and housing.
Question 3: Does socioeconomic status affect residential choice?
In order to assess the explanatory value of these socioeconomic characteristics with respect to the residential isolation of ethnic minority groups, one would ideally build a full model of residential choice rooted in empirical observations on how changes in socioeconomic status affect residential decisions. Due to lack of data, such an approach is not feasible here. However, an analysis of average neighbourhood indicators of socio-economic status is possible in the dimensions of income and education. If socioeconomic status is indeed the driving force of residential sorting and minority status is but a marker, one would expect there to be significant correlation between an individual’s socioeconomic status and that of his/her neighbours. Also, this link should be invariant to migrant background. Again, descriptive statistics are used to depict the link between an individual’s socioeconomic characteristics and those of his/her immediate neighbours.
Question 4: Can differentials in socioeconomic status explain residential segregation?
Assuming the causal link to run from socioeconomic neighbourhood sorting to ethnic segregation, this paper assesses the explanatory power of socioeconomic status differentials with respect to the residential segregation of the four largest socially as well as spatially isolated migrant groups in Germany (Turkish, Italian, East European and Balkan). In doing so, it builds on a measurement framework proposed by Bayer et al. (2004) which basically consists of two steps. First, simple regression analysis is used to determine the effect that socioeconomic characteristics have on the isolation levels of minority members (baseline regression). The resulting regression coefficients are then used to predict how segregation levels would change if the differentials in socioeconomic status between population groups were abolished (prediction).
In the neighbourhood sorting model proposed by Borjas (1998), individuals with higher skill levels among the low-skill group should face less segregation, while segregation should increase for individuals with higher skill levels among the high-skill group. Hence, if using classical econometric frameworks such as linear regression models, one should assess the effects of socioeconomic variables on residential segregation separately for population groups.
The baseline regression to assess the effect of socioeconomic status on ethnic segregation is a standard multiple linear regression (MLR) which is applied to each population group separately

Here,
Aiming to quantify the theoretical change in average segregation levels which would result from the abolishment of status differentials, Bayer et al. (2004) multiply the regression coefficients obtained for each group with the averages of socioeconomic indicators over the whole population. This paper applies the same procedure, only with the average socio-economic characteristics of the German population, resulting in the prediction

where,
This results for each population group in a single number: the predicted own-group exposure (or P*) under the assumption of abolished status differentials. Then, the relative drop in isolation levels is calculated to assess how much of each group’s segregation level can be accounted for by status differentials. This is referred to as ‘Method A’.
Method A produces predicted average segregation levels for each minority group based on German averages of status variables and thus only accounts for the levels, but not for the distributions of socioeconomic characteristics and residential segregation within population groups. These distributions, however, are relevant for two reasons. First, an individual’s various indicators of status are most likely to be correlated in some way (i.e. income and education), which makes it desirable to base predictions not on population averages but rather on sets of status variables observed in single individuals. Secondly, not only the average levels of segregation, but also the share of minority members who face especially strong isolation can be of interest. Hence, a second, slightly modified, methodology (‘Method B’) is applied which generates for each population group a whole distribution of segregation levels based on the underlying distribution of status variables in the German population. For that purpose, predictions are run that generate for each member of the German majority group a fitted value of own-group exposure under the assumption that he/she was subject to the same effects (i.e. regression coefficients) associated with socioeconomic status as the respective minority group.
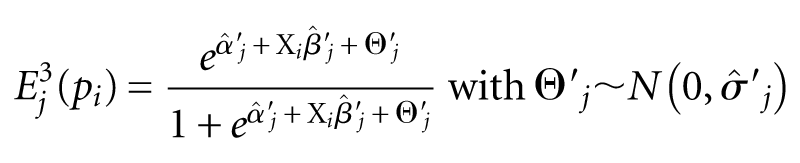
In sum, while in Method A minority coefficients from the baseline regression are multiplied with averages of German status variables, in Method B they are multiplied with the status variables of each German individual. However, the distribution of these predictions is subject to smaller dispersion than actually observable in migrant groups because they represent values fitted to a theoretical regression line. This is corrected by adding to the fitted values a random error term imitating the distribution of the respective group’s observed error term. The predicted values take the form

for all individuals i who belong to the German majority. As in Method A,

This only differs from the first baseline regression in that the dependent variable, own-group exposure, is transformed before applying linear regression. The resulting residuals are now fairly normal. This makes possible generating predicted values for each group including a random error term which results in a distribution of predicted levels of residential isolation for population group j in the form
This differs from
4. Data
In this paper, data from the German Socioeconomic Panel Study (SOEP) are used. The SOEP is a panel study of around 12 000 private households and their inhabitants based on yearly questionnaires. Started in 1984, it encompasses micro data on a wide array of socioeconomic characteristics “centred on the analysis of the life course and well-being” (Wagner et al., 2007, p. 8). In addition, regional indicators are provided by the micro-marketing enterprise microm Micromarketing-Systeme und Consult GmbH (MICROM). 1 MICROM indicators have been matched on the level of housing blocks and households are clustered into segments containing at least five and on average eight households. Variables included are mostly relevant for consumer marketing, but can be used in research to describe systematically the immediate environment of the households. Unfortunately, precise information on the data collection process of MICROM is not available to the author. The following analysis is based on the assumption of adequate information collection and the random distribution of errors, especially of missing values (MCAR).
MICROM data have been matched to the SOEP starting with the year 2000, with a renewed and broadened set available for 2008. The key sample used in this analysis consists of 18 003 German residents over the age of 16 who live in private households, participated in the 2008 SOEP and for whom adequate weights were obtainable to ensure comparability with the German Micro Census (representative of about 66 million German residents over the age of 16).
4.1 Population Groups
For each household, the MICROM data provide an estimate of the neighbourhood shares of household heads belonging to 12 regions of origin. 2 MICROM states that this grouping is based on first-name analysis (Goebel et al., 2007). Since group membership is not indicated for individuals, it has to be reconstructed using the data available in the SOEP. Of the key sample containing 18 003 individuals, 2754 are listed as having a migration background. The country of origin is assigned based on, in that order, country of origin, current and previous nationality, father’s and mother’s nationalities, or second nationality. For 324 individuals, it is not possible to assign a definite foreign country of origin despite the classification as possessing a migration background. An additional seven individuals are stateless.
Membership of the 12 population groups used in the MICROM data is then reconstructed on the basis of origin. For most groups, the grouping is relatively straightforward. The assignment of the other groups has potential for non-correspondence with the MICROM grouping, especially in the case of ‘Balkan’ and ‘East European’. The latter is combined with the group ‘Ethnic German repatriates from the former Soviet Union’. For these regions, high ethnic heterogeneity makes likely some misalignment since the MICROM grouping is based on name analysis and individuals are grouped according to country of origin.
5. Results
5.1 Residential Segregation of Migrant Groups in Germany
In order to assess the degree of segregation in Germany, the average own-group exposure (or P*) of the population groups with migration background will be compared with the exposure to the respective group averaged over the whole sample. The results of this exercise are presented in Table 1 and show that all of the major population groups (n >200) experience significant residential overexposure to own-group members. The share of ‘(strongly) isolated’ individuals amounts to those who face an own-group exposure more than twice (four times) as high as that of the overall population. This indicator was first used by Borjas (1998).
Residential segregation of principal migrant groups in Germany, 2008

Source: SOEP/microm data; author’s calculations.
All groups are subject to statistically significant own-group overexposure in absolute terms, but certain groups face higher overexposure in relative terms (isolation) and a significantly higher likelihood of extreme isolation. While the population group ‘Other Western’, driven mostly by western European nations, only experiences economically non-significant own-group overexposure, people with a Turkish background seem to be isolated the most. Results for other migrant groups not included due to limited sample size (n≤200) also show significant levels of residential isolation.
5.2 Socioeconomic Status Differentials among Population Groups
The first pre-condition for any socioeconomic characteristic to be able to explain residential segregation is that it be unequally distributed among population groups. The broad spectrum of socioeconomic indicators contained in the SOEP makes possible extensive comparison between population groups. Results of this exercise (presented in Table 2) reveal that there are substantial differences in socioeconomic status among population groups. These differentials are not always, but mostly, in favour of the German majority.
Socioeconomic differentials among population groups
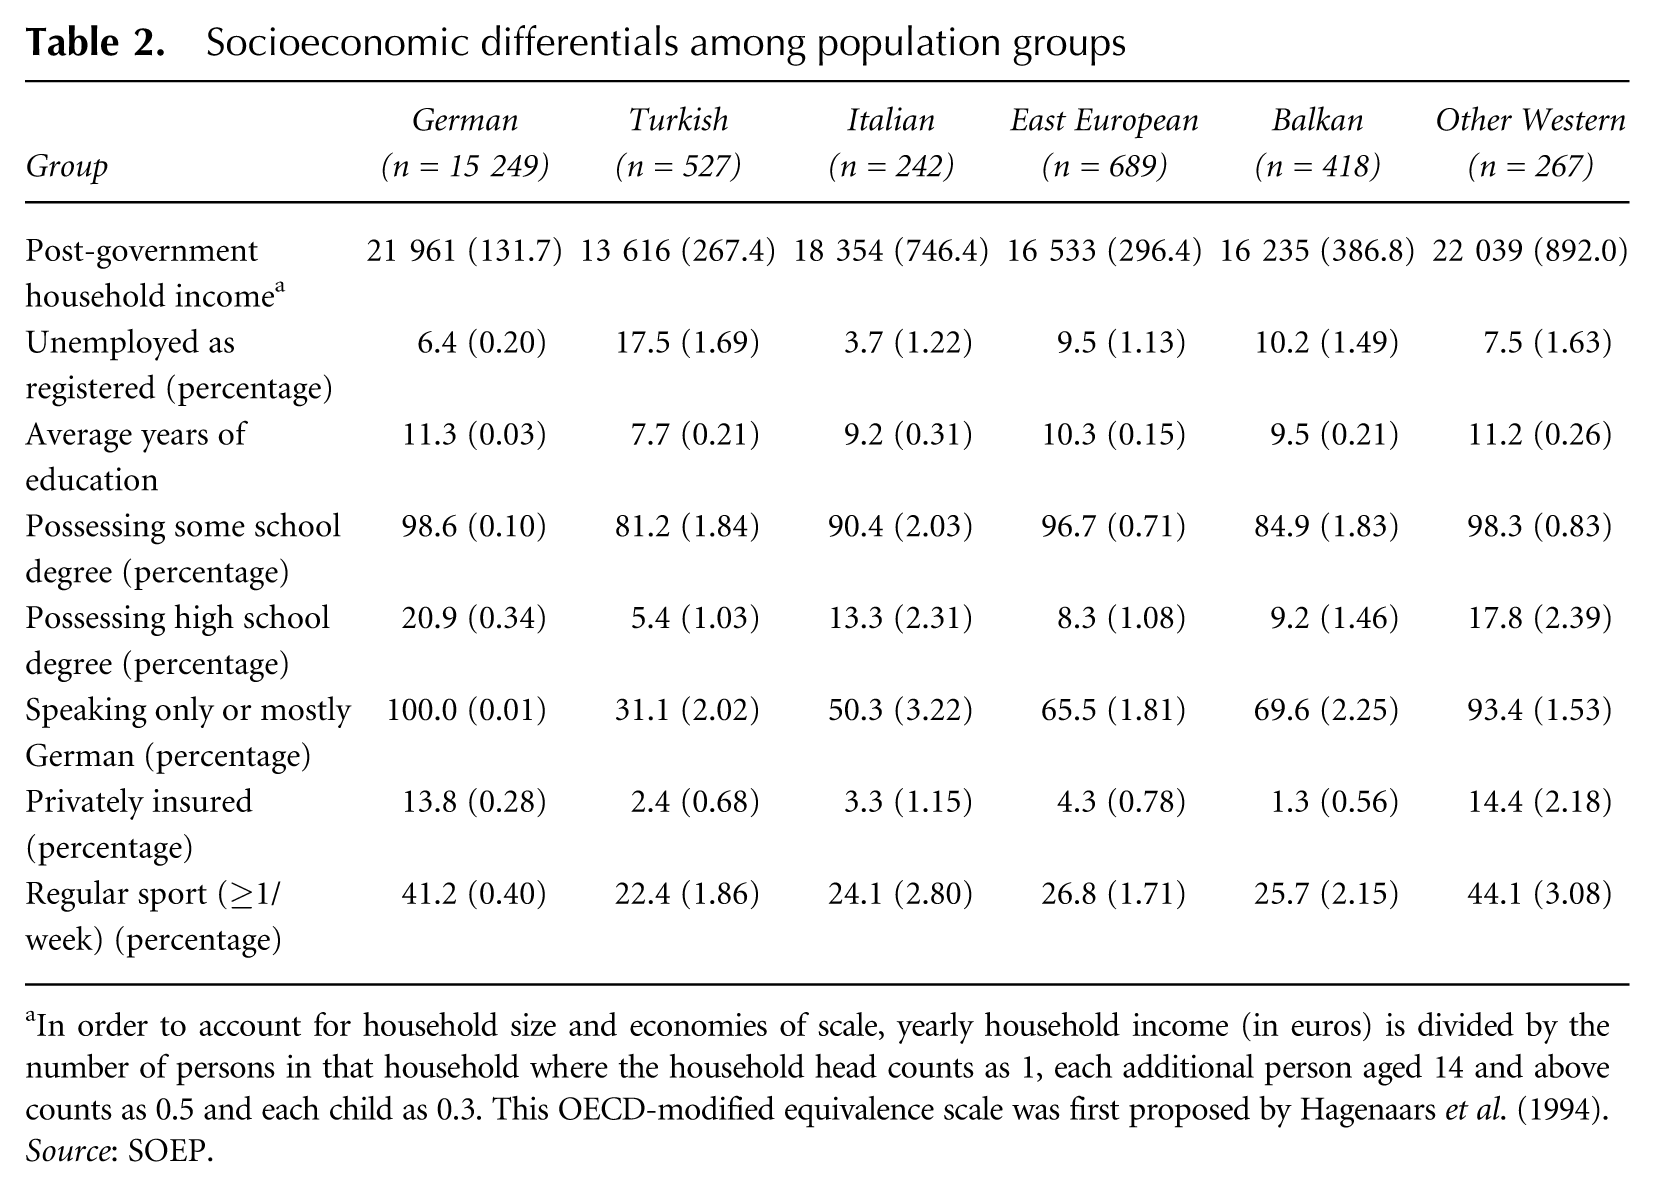
In order to account for household size and economies of scale, yearly household income (in euros) is divided by the number of persons in that household where the household head counts as 1, each additional person aged 14 and above counts as 0.5 and each child as 0.3. This OECD-modified equivalence scale was first proposed by Hagenaars et al. (1994).
Source: SOEP.
Furthermore, population groups differ significantly with respect to certain housing characteristics. Table 3 shows that migrants from Turkey and the Balkans are spatially concentrated in larger villages or cities. Further, data from the Federal Statistical Office show that an overproportionate share of migrants reside in western Germany. While slightly more than 22 per cent of residents in western Germany possess some kind of migrant background, this is true for less than 5 per cent in the new Bundeslaender (Statistisches Bundesamt, 2009). This uneven spatial distribution on a very large level could partly account for the overexposure in individual MICROM segments. Migrant groups are also less likely to reside in one- or two-family homes, have a lower homeownership rate and live on average in smaller apartments/houses with more household members. This could point to some degree of spatial concentration of migrant groups, even though it is not possible to construct classical measures of concentration in the absence of fixed neighbourhood definitions. Again, Western migrants (‘other Western’) show the smallest differentials.
Housing differentials among population groups
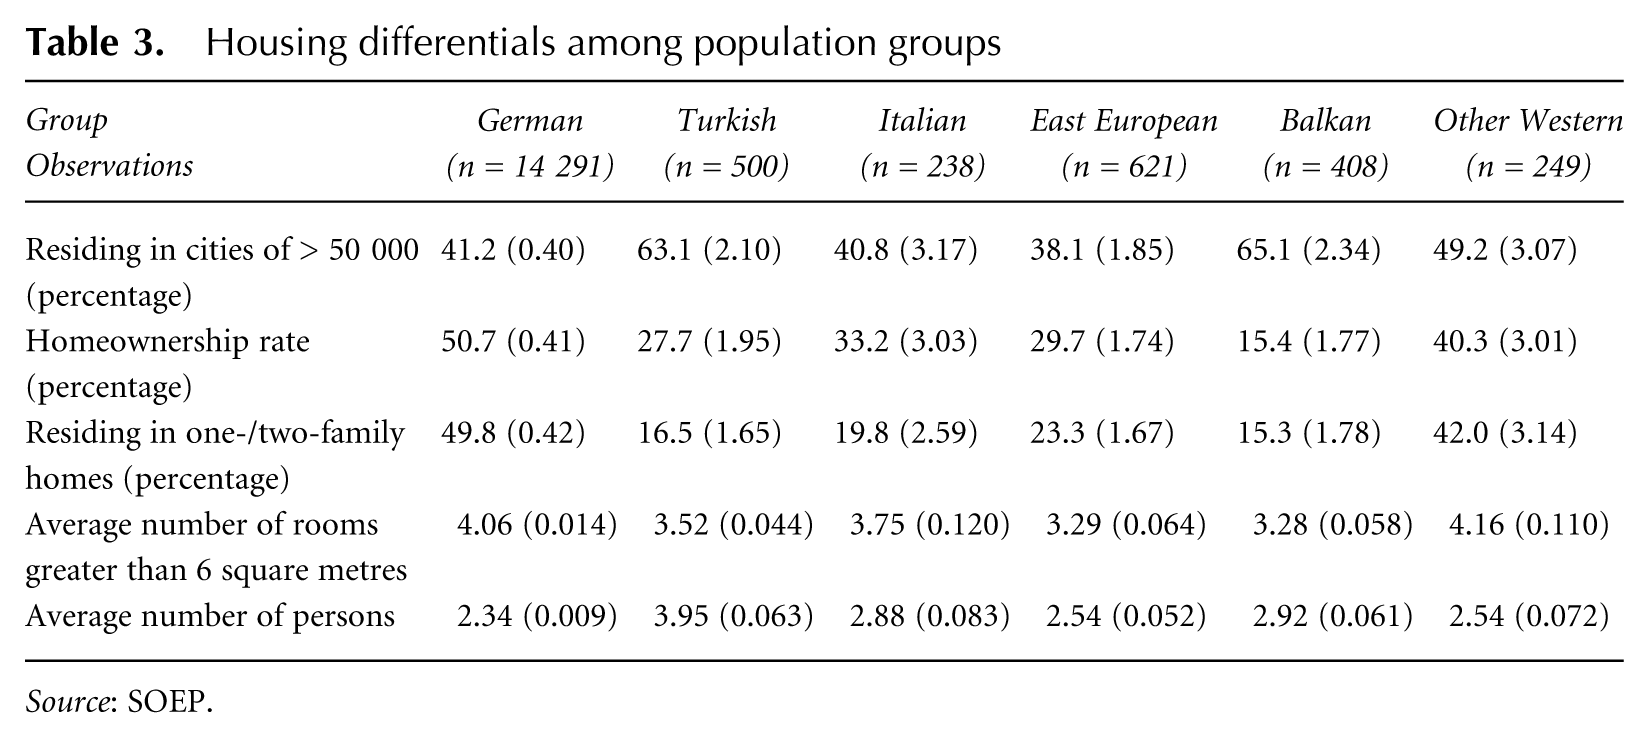
Source: SOEP.
5.3 Socioeconomic Status as a Primary Factor in Residential Sorting
Evidence that segregation might not take place along ethnic but socioeconomic divides is given by the fact that the individuals in higher-income households also tend to have neighbours with higher purchasing power. This can be seen in Table 4 where individuals were grouped in septiles on the basis of yearly household income adjusted to the OECD-modified scale. The data show a positive correlation between the household income and the purchasing power of the neighbours. Also, individuals with a high school degree (Abitur) face on average a significantly higher number of academics as immediate neighbours. Strikingly, the link between individual socioeconomic characteristics and those of neighbours is not significantly different for people with a migration background from that for the natives. This leads to the conclusion that individuals, regardless of ethnic origin, experience residential sorting based on socioeconomic status.
Evidence of socioeconomic neighbourhood sorting
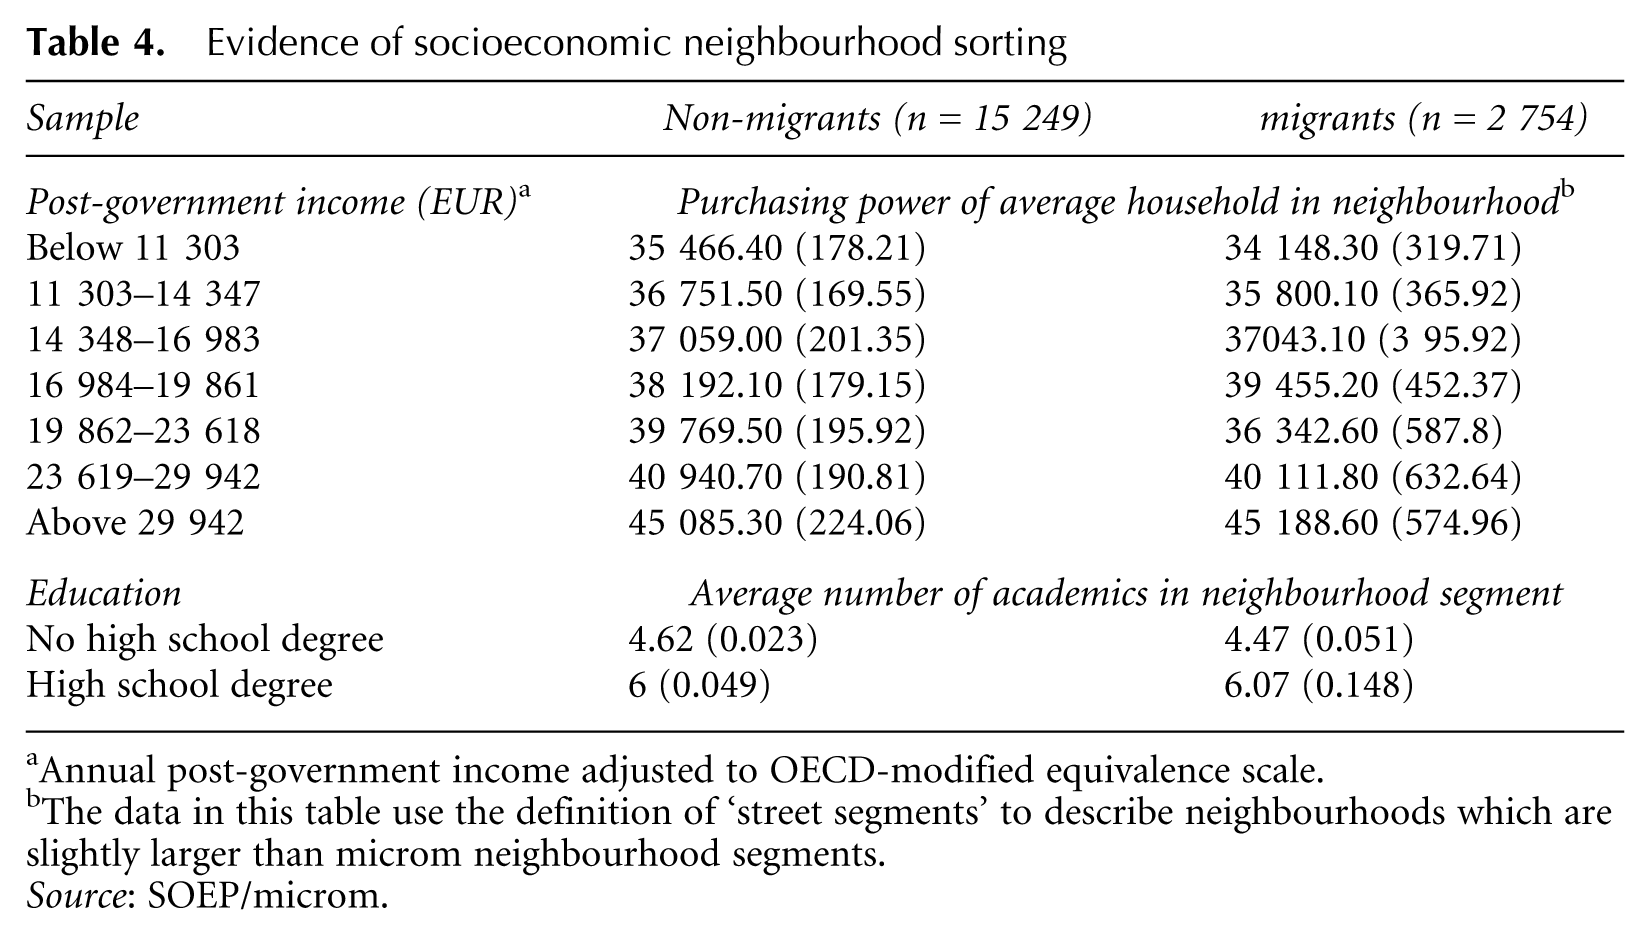
Annual post-government income adjusted to OECD-modified equivalence scale.
The data in this table use the definition of ‘street segments’ to describe neighbourhoods which are slightly larger than microm neighbourhood segments.
Source: SOEP/microm.
5.4 Socioeconomic Status as the Primary Cause of Residential Segregation
Having found that socioeconomic neighbourhood sorting takes place, it is now possible to assess the link between socio-economic status and the residential segregation of migrant groups. Due to limited sample size, not all of the indicators are included in the regression. For the indicators on income and employment status, the yearly post-government household income has been selected because it closely corresponds to the money available to each household. Educational attainment is accounted for by an indicator whether or not the individual has accomplished the equivalent of a German high school degree (Abitur). Further independent variables are a dummy if German is the primary language used and the village/city size. In order to account for non-linearity in the effect of post-government income, mostly seen as one of the strongest indicators of socioeconomic status, dummies for seven equally sized income groups have been added. Also the town size has been broken up into categories.
Method A
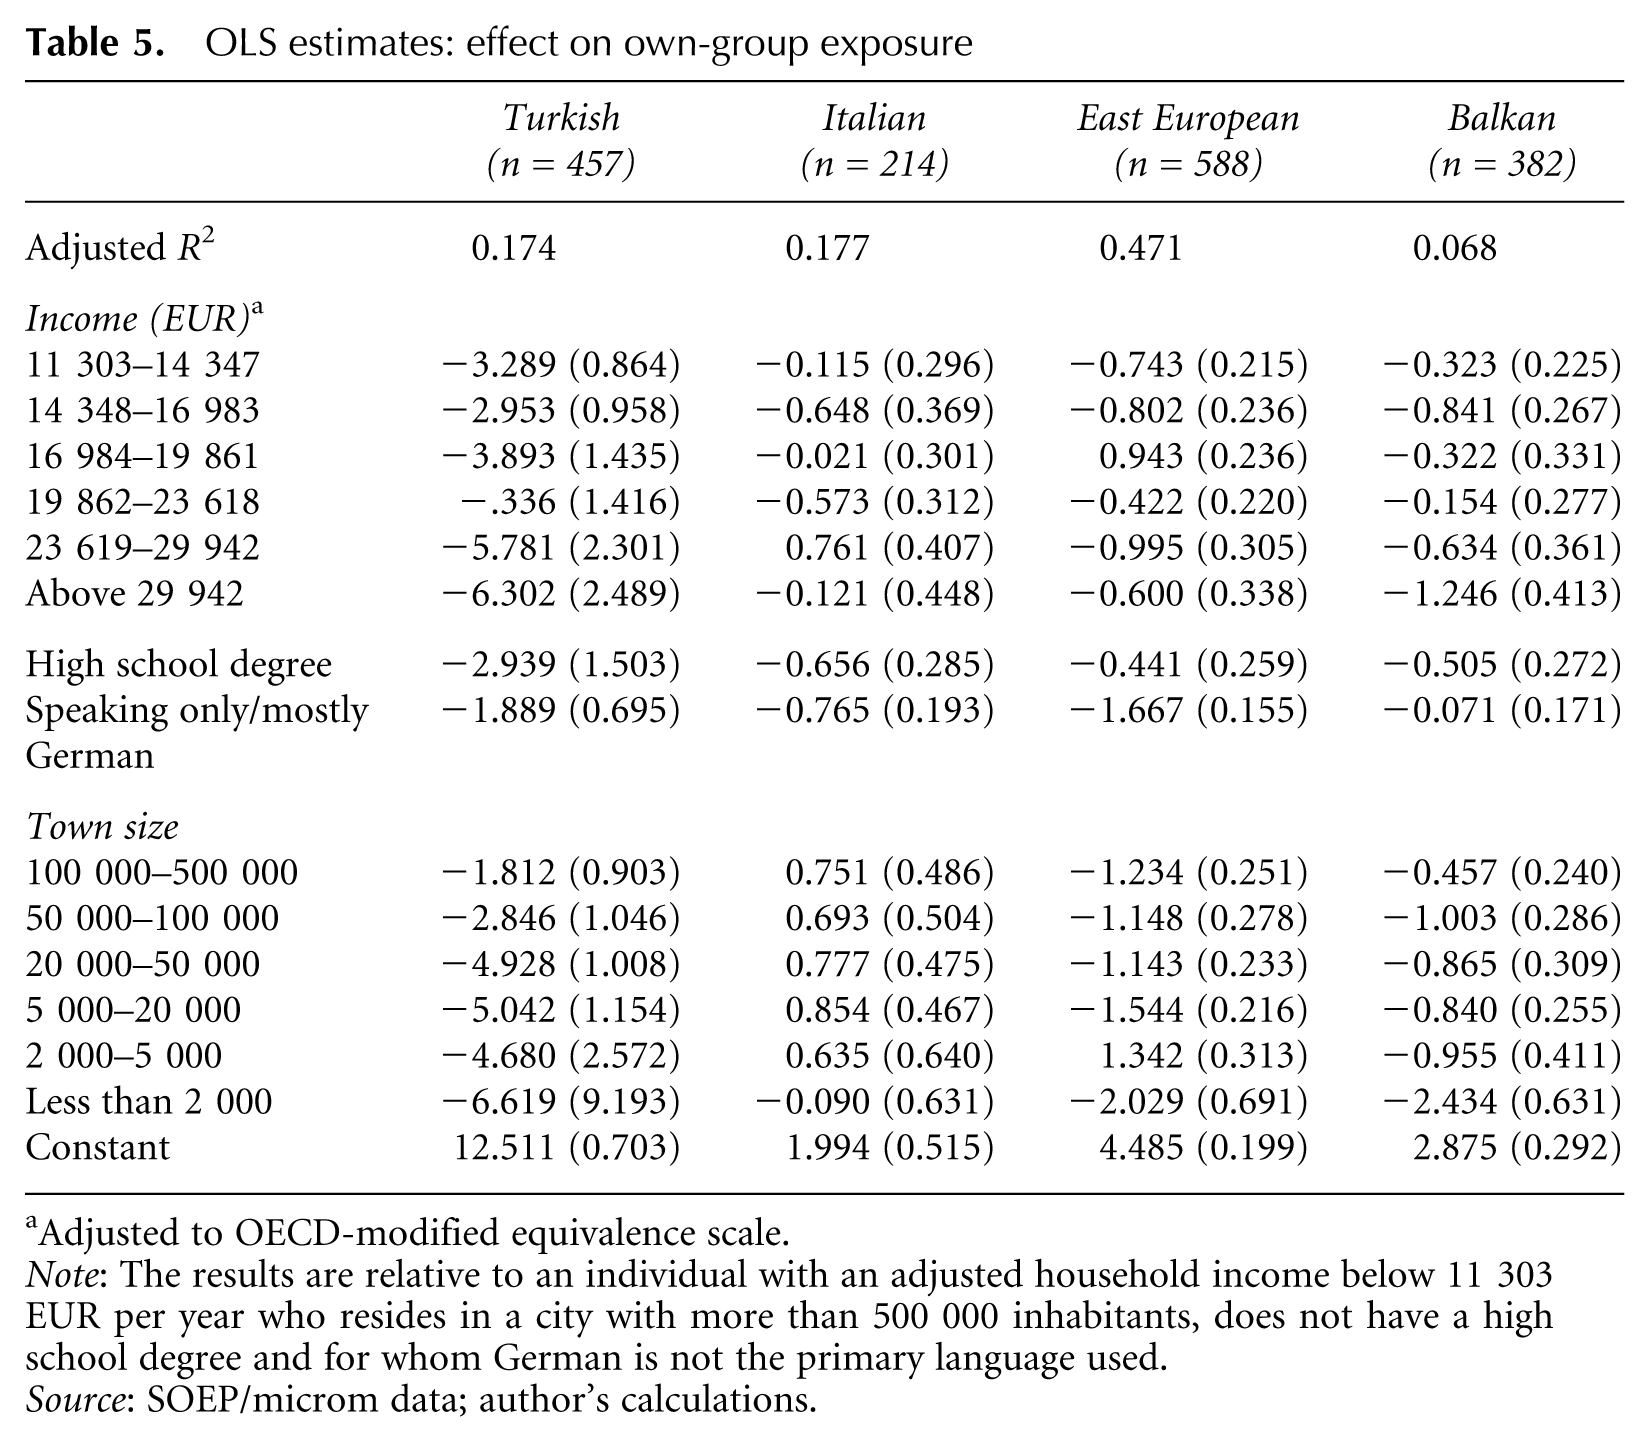
Ordinary least squares (OLS) estimates of these regressions for the primary non-Western migrant groups (n >200) are summarised in Table 5. They show that most socioeconomic indicators are linked to own-group exposure in the expected manner. For all migrant groups, rising income is connected to a decrease in own-group exposure. Also, speaking only or mostly German and possessing the equivalent of a German high school degree significantly decrease residential isolation. Finally, the effects of town size differ between migrant groups. All groups except for migrants with an Italian background seem to be more concentrated in the larger cities.
OLS estimates: effect on own-group exposure
Adjusted to OECD-modified equivalence scale.
Note: The results are relative to an individual with an adjusted household income below 11 303 EUR per year who resides in a city with more than 500 000 inhabitants, does not have a high school degree and for whom German is not the primary language used.
Source: SOEP/microm data; author’s calculations.
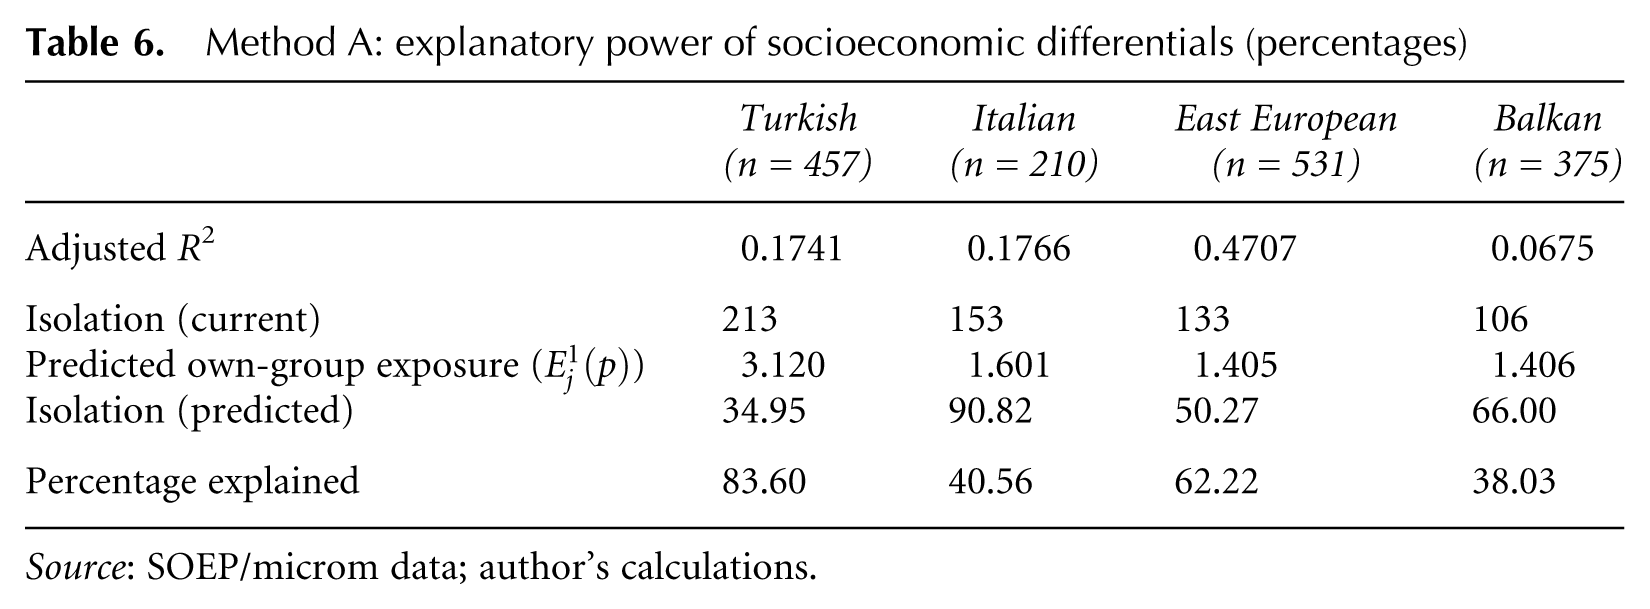
In order to assess the explanatory value of these socioeconomic characteristics with respect to residential segregation, segregation levels are then predicted under the assumption of abolished status differentials between population groups. Results of the Method A predictions are found in Table 6. The first row of that table restates the current levels of residential isolation from Table 1, which equate to relative own-group overexposure. The second row contains the predicted levels of own-group exposure (P*) in the absence of status differentials. The corresponding levels of residential isolation are presented in the third row. Finally, the last row states the predicted relative decreases in levels of residential isolation resulting from abolished status differentials. They show that a significant amount of residential isolation seems to be linked to levels of income, education, language skills and village/city size. However, there seem to be additional unobserved factors driving the residential segregation of minority groups. Whether these stem from cultural differences, discriminatory forces in the housing market, racial preferences or some other source is not distinguishable.
Method A: explanatory power of socioeconomic differentials (percentages)
Source: SOEP/microm data; author’s calculations.
Method B
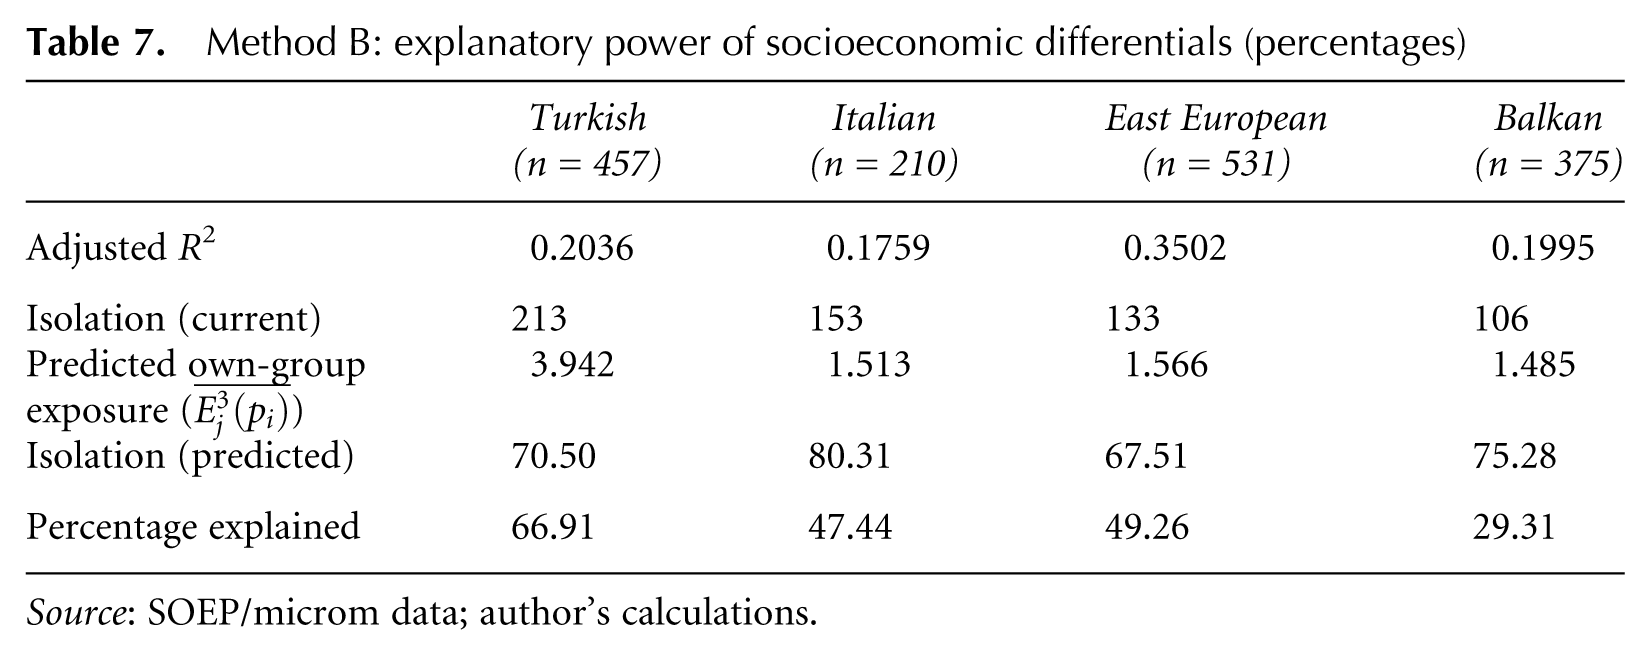
As already pointed out, the comparison of means does not sufficiently capture the effects of distributions which seem to be important for the analysis of residential segregation. The second method applied is more viable in this respect. Method B results in a drop of segregation levels between 29 and 67 per cent (Table 7). It thus explains a smaller proportion (except in the case of Italians) of segregation than Method A.
Method B: explanatory power of socioeconomic differentials (percentages)
Source: SOEP/microm data; author’s calculations.
It is especially notable that the Method B results not only include more reasonable estimates of the proportion of residential segregation which can be explained by socioeconomic characteristics, but also seems to imply convergence in segregation levels between migrant groups. Notably, after substituting German socioeconomic characteristics, all four principal migrant groups are estimated to be subject to own-group overexposure levels of 67–80 per cent. This could indicate that socioeconomic differentials account for much of the difference in segregation levels experienced by various migrant groups.
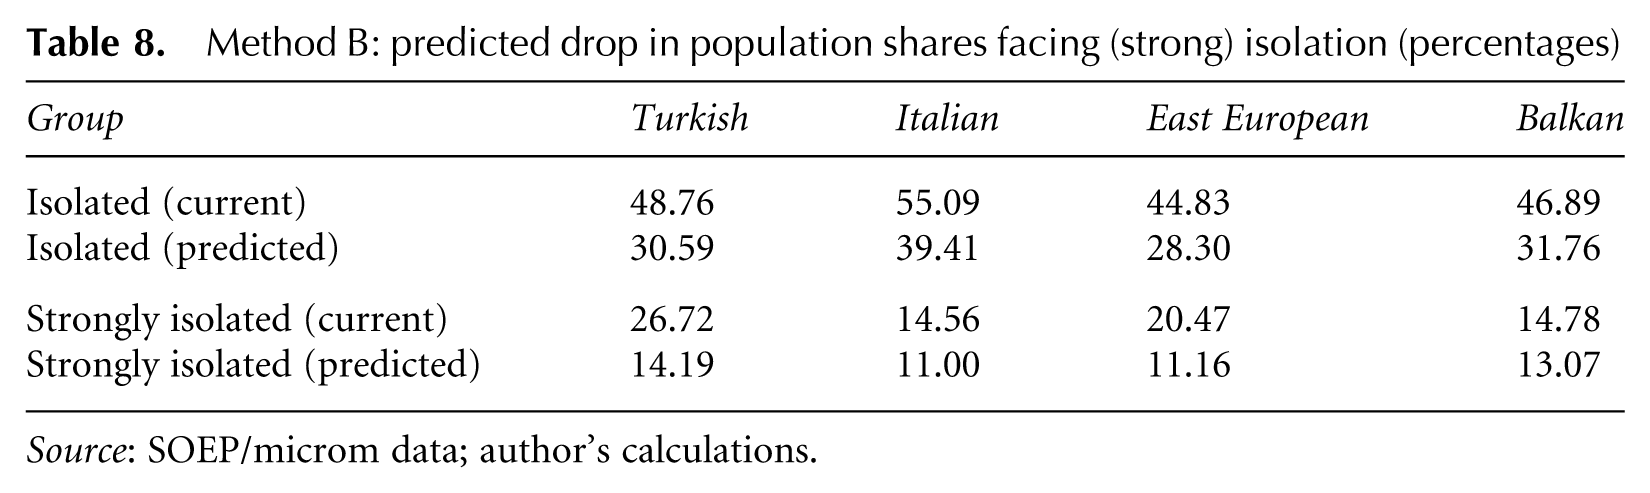
Method B also makes possible a comparison of population shares which face (strong) residential isolation. The results of this exercise are presented in Table 8. The first and third rows restate the respective group’s share of (strongly) isolated individuals who face own-group exposure more than twice or even four times as high as that of the overall population. Rows two and four contain the respective population shares which result from the Method B prediction. They show that there is not only a significant reduction in the average level of residential segregation, but that the shares of individuals who face (strong) residential isolation decrease strongly for the groups of Turkish and eastern European migrants. Again, a convergence of levels is observable among migrant groups. This indicates that the socioeconomic characteristics included in the model account not only for different levels of segregation, but also for differences in distributions among population groups. This is especially important in the case of the Turkish migrant population which suffers not only from a generally high level of segregation, but also from a high share of strongly isolated individuals.
Method B: predicted drop in population shares facing (strong) isolation (percentages)
Source: SOEP/microm data; author’s calculations.
6. Limitations
It is possible that the reconstruction of membership of SOEP participants in migrant groups is non-congruent with the grouping carried out by MICROM. In addition, some bias is possible due to the relatively high number of individuals for whom no country of origin was obtainable but a migration background was indicated. It is very likely that an overproportionate number of these individuals represent second-generation (or higher) migrants. The likelihood of major systematic misalignment bias is limited, however, due to the fact that each constructed population group showed the highest level of exposure to itself among all population groups. Furthermore, the key sample is only statistically representative of German residents over the age of 16 and thus does not account for additional effects due to differences in age structure between population groups.
The econometric framework used is subject to the general limitations of a classical linear model (CLM). An alternative to strictly linear modelling is the application of logistic regression models (LRM), approximating the effect of socioeconomic characteristics on the likelihood to be ‘isolated’ or ‘strongly isolated’. Such an approach produces similar qualitative results but quantitative accuracy suffers from fuzziness at the margins since the binary indicators of isolation are based on arbitrarily chosen cut-offs in a continuous variable (own-group exposure). Also, multicollinearity between the explanatory variables, especially income and education, is conceivable. However, an analysis of the variance–covariance matrix showed no alarming levels of linear correlation.
As mentioned earlier, the main issue in the analysis of social and spatial segregation is that of causal inference. It is possible that neighbourhood composition affects socio-economic status which could account for at least some of the correlations reported here. In that case, the analysis would be likely to overstate the importance of social status in explaining ethnic segregation. The available data only allow an incomplete assessment of the issue. First, descriptive statistics have shown that there seems to be socioeconomic neighbourhood sorting invariable to migrant status. Also, one would expect status to be more closely affected by the environment during childhood since many socioeconomic characteristics, most significantly education, are determined then. Hence, effects should be stronger for second- and third-generation migrants. This is not the case. This, however, does not disprove theories of neighbourhood effects. Hence, ambiguity concerning causality remains an important issue for further analysis.
Finally, while residential segregation and socioeconomic differentials were observable for all migrant groups, regression analysis was only carried out for the four principal segregated groups. Thus, generalisation of the results to all migrants in Germany should be handled with care.
8. Conclusion
This analysis finds that strong residential isolation of the principal migrant groups in Germany is observable at the micro-neighbourhood level. Further, depending on the method applied, between 29 and 84 per cent of this segregation can be attributed to differences in socioeconomic characteristics between these groups. Strikingly, including not only levels but whole distributions of socioeconomic characteristics and residential segregation seem to explain most of the divergence in segregation rates and shares of (strongly) isolated members between migrant groups.
In the methodological sphere, the use of micro neighbourhood information such as that provided by MICROM has proved valuable for the assessment of residential situations. However, more precise information on population grouping and additional information on the socioeconomic composition of micro neighbourhoods would make possible more detailed analyses. In particular, the intergenerational dynamics of residential segregation and socioeconomic performance deserve attention in order to shed light on the crucial issue of causality. Also, it has been shown that summary statistics alone are not sufficient for the analysis of residential segregation. Also, the distribution of socioeconomic characteristics as well as residential levels provides valuable information.
Finally, while the observed classical indicators of socioeconomic status account for most of the divergence in levels of residential segregation among migrant groups, no conclusion is possible as to what causes the remaining levels of own-group overexposure of between 67 and 80 per cent. It is essential to understand if these levels can be accounted for by further socioeconomic characteristics or if they are rather a sign of additional social barriers in the form of prejudice and discrimination.
Footnotes
Acknowledgements
The author would like to thank Martin Kolmar and Olaf de Groot for their guidance and support as well as the four anonymous reviewers for their useful comments.
Funding Statement
This research received no specific grant from any funding agency in the public, commercial or not-for-profit sectors.