
Abstract
This study addresses the knowledge gap concerning the demand for fresh fruit in an urban food desert, where healthy foods are scarce by definition. Using register data from a non-profit greengrocer in Detroit—one of America’s largest and most severe food deserts—expenditure and price elasticities of fresh fruits are estimated. The results show that, if urban food desert consumers are given access to normally priced produce of acceptable quality, they will purchase it. Expenditure was found to play a major role in determining fruit demand. The food desert consumers were also found to be more price responsive than the average US consumer. The policy implications are clear: introducing neighbourhood stores providing access to good quality produce at competitive prices could be an important component of increasing fruit consumption.
1. Introduction
Large numbers of African Americans live in inner-city food deserts—neighbourhoods in which nutritious food is scarce, of low quality, expensive or simply unavailable (Moore and Diez Roux, 2006; Morland et al., 2002). 1 For example, Detroit residents are 82.7 per cent African American (US Census Bureau, 2011) and approximately one-half of the city’s residents live in a food desert (Gray, 2008). Detroit is America’s oldest and largest food desert, and arguably its worst in terms of number of people impacted. A critical factor is that there are no full-service supermarket chains operating within the 139 square mile city. The last surviving supermarket chain within the city was Farmer Jack (an A&P subsidiary), which closed its last two Detroit stores in 2007 (Duggan, 2010; Smith and Hurst, 2007). 2 Most residents of inner-city Detroit rely on convenience, liquor or other non-mainstream grocery stores for their local retail supply of food. These ‘fringe retailers’ focus on the sale of high-calorie, high-fat and/or salty snack foods and sugary drinks, and are located on average 0.2 miles from the household; mainstream grocers are two to three times that distance (Gallagher, 2007). Within the city of Detroit, majority Latino census tracts averaged 0.41 miles to the nearest supermarket or grocer (even small grocers), majority White tracts averaged 0.75 miles and majority African American tracts averaged 0.56 miles. 3 In 2007, 92 per cent of Detroit’s Food Stamp retailers were gas stations, liquor stores, party stores, dollar stores, bakeries, pharmacies, convenience stores and other fringe food retail venues that offer limited if any nutritious food choices (Gallagher, 2007). Neal (2006) noted Detroit’s unique food desert location within the city centre, where other food deserts are mostly peripheral or distant from urban centres.
A growing body of literature has established that food deserts are associated with lower quality diets and higher rates of obesity (Franco et al., 2009; Mobley et al., 2006; Moore and Diez Roux, 2006; Morland et al., 2002, 2006; Ver Ploeg, 2010; Schafft et al., 2009). Obesity and related morbidities are disproportionately high in African Americans (Flegal et al., 2002; Hedley et al., 2004; Mobley et al., 2006; Ver Ploeg, 2010). Overweight and obesity rates in African American men (non-Hispanic, age-adjusted) are higher than those of non-Hispanic White men, by 32.3 per cent and 26.8 per cent respectively (Office of Minority Health, 2009). Obesity rates among African American women are also disproportionately high (Ogden et al., 2006; Ogden, 2009; The Obesity Society, 2001; Ogden and Carroll, 2010) and continue to rise (Flegal et al., 2002; Hedley et al., 2004). A disturbing 78 per cent per cent of African American (non-Hispanic, age-adjusted) women age 20 and older are overweight (including obese) (National Center for Health Statistics, 2011) and one-half are obese—a rate 70 per cent higher than among non-Hispanic White women (National Center for Health Statistics, 2011; Office of Minority Health; Ogden, 2009). With regard to obesity-related morbidities, non-Hispanic African American women are 1.9 times more likely than White non-Hispanic women to have suffered a stroke, 1.8 times more likely to have contracted diabetes and 2.4 times more likely to die from complications from diabetes (Office of Minority Health, 2009).
Fruit and vegetable (F&V) consumption is a key factor—arguably the primary key—to a healthy diet (Franco et al., 2009; Glanz et al., 1994) and is certainly associated with reduced obesity (He et al., 2004), diabetes risk (Bazzano et al., 2008; Ford and Mokdad, 2001) and other positive health outcomes. The diets of low-income urban African Americans tend to foster obesity, morbidity and premature mortality (Devine et al., 1999; Hargreaves et al., 1989; Jen et al., 2007; Miller et al., 1996). Their diets are low in F&V (Bazzano et al., 2003; He et al., 2006; Kapiszewska, 2006; Liu et al., 2000; Rolls et al., 2004; Vainio and Weiderpass, 2006); and high in processed high calorie, high sodium, high fat fast foods (Berkey et al., 2004; Bowman and Vinyard, 2004; Duffey et al., 2007; Lucan et al., 2010; Pereira et al., 2005; Prentice and Jebb, 2003). Therefore, non-nutritious diets may be especially prevalent among African Americans living in food deserts. For example, African Americans in Detroit consume fewer servings of F&V than Whites or the average US African American (Kieffer et al., 2006). A recent qualitative survey of African Americans living in Philadelphia found that the most salient constraints to increased fruit consumption were cost and availability, and the top three constraints to increased vegetable consumption were taste/preference, cost and availability respectively (Lucan et al., 2010). Rose and Richards (2004) estimated that easy access to supermarkets was associated with increased household consumption of F&Vs. Similarly, Wrigley et al. (2003) found a significant link between proximity to a newly opened superstore and increased F&V consumption. It is therefore not surprising that urban food deserts with limited access to F&Vs, such as Detroit, have high rates of obesity and related morbidities.
The proximate solution—to increase the number of grocery retailers in a food desert—is complicated by the fact that retailers are reluctant to locate in food deserts for a variety of security and profitability reasons, one of which is the perception that food desert residents will not purchase F&V at a profitable level even if they are offered. Non-mainstream ‘grocery’ stores may not carry a good selection of fresh produce and may choose to focus on high-volume goods such as ketchup, high calorie snacks, coffee, cereal (Gray, 2008) and canned goods instead. Mainstream supermarket chains do not have any experience or reliable demographic purchasing data to gauge profitability in urban, poor food desert areas and hence are unlikely to locate there. This lack of F&V retailers, and thus F&V purchasing data, makes it difficult to assess F&V demand among food desert residents, especially African Americans.
This begs the question: what are the characteristics of demand for F&Vs among residents of predominantly African Americans food deserts?
This paper addresses the knowledge gap concerning the demand for F&V in a predominantly African American food desert, using data from a natural experiment in Detroit. 4 Understanding F&V demand among low-income African Americans requires a directed approach to the analysis of data specific to the sub-population in question (Kumanyika et al., 2007; Lucan et al., 2010). In the Piety Hill community of inner-city Detroit, the non-profit Central Detroit Christian Community Development Corporation (CDC) has opened a retail outlet selling nutritious foods, specialising in fresh fruits and vegetables (FFV), called Peaches & Greens. Retail data (register tapes) from this outlet provide an opportunity to understand the FFV demand among residents from this food desert area, which has been subjected to an intervention that addresses healthy food access although it is at a local scale.
Specifically, the objective of this paper is to estimate the expenditure and price elasticities of fresh fruit among residents of the Piety Hill, low-income, food desert community of Detroit. The paper proceeds as follows. Section 2 provides background information on the Detroit food desert and the sample area. Section 3 describes the estimation model and procedures. Data are described in section 4. Results followed by discussion and conclusions are presented in sections 5 and 6 respectively.
2. Background: Detroit and the Target Population
In 2009, 54 per cent of Detroit’s children under the age of 18 and 46 per cent of all families with children under 18 lived below the poverty line (Annie E. Casey Foundation, 2011; US Census Bureau, 2011). Income disparity is enormous: Detroit has a median household income of $25 787 (2009 dollars) compared with the US median household income of $50 046 (US Census Bureau, 2011), and a Gini coefficient of 0.488 ± 0.01 compared with the Michigan coefficient of 0.451 ± 0.003 (US Census Bureau, 2011). In comparison, Bloomfield Hills (a suburb of Detroit) had a 2005–09 median household income of $123 409 and a poverty rate of 1.1 per cent (US Census Bureau, 2010). Bloomfield Hills is 89.1 per cent White with a 4.3 per cent Black or African American population (US Census Bureau, 2010). In 2010, the Detroit metropolitan area ranked ninth among US cities with the most millionaires, with over 92 000 millionaires (Capgemini, 2011). However, Detroit also has one of the highest unemployment rates in the country, 22.7 per cent (Michigan Department of Technology, Management and Budget, 2010). In 2008, Forbes magazine ranked Detroit among the 10 fastest-dying cities (Zumbrun, 2008).
Food access problems in Detroit are complicated by an inadequate public transport system and a high proportion of disabled persons. Public transport in Detroit is limited to a small light rail train covering a three-mile loop in the downtown area and a limited number of bus routes connecting Detroit with suburban areas. Travel distances are large because Detroit spans an area of 139 square miles (City of Detroit, n.d.) that once supported a population of over 2 million. The city now contains 40 square miles of vacant/abandoned land—an area the size of San Francisco (Gallagher, 2009). Detroit also has a high proportion of disabled persons—19.5 per cent compared with 11.9 per cent in the US (US Census Bureau, 2011). Disabled persons are more likely to have difficulty grocery shopping than able-bodied persons, especially if significant travel to the nearest store is required.
Detroit is the fifth most obese city in the US (Centers for Disease Control and Prevention, 2010; Ruiz, 2007). A recent study of elementary school children in 10 urban locations showed that, of those who purchased food before or after school at a local corner store proximate to the school that they attended, the average purchase consisted of 356 kilocalories, primarily of calorie-dense, low-nutritive items, costing just over $1. Of those interviewed, over half shopped at the corner store on a daily basis (Borradaile et al., 2009). There is an undisputed need for “public health intervention strategies to increase retail availability of F&V in urban inner city neighborhoods”, especially relative to minority populations who have disproportionately high rates of diet-related diseases (Hosler et al., 2008, p. 5). The Gallagher Report concludes that Unless access to healthy food greatly improves, we predict that, over time, [Detroit] residents will continue to have greater rates of premature illness and death from diabetes, cardiovascular diseases, cancer, hypertension, kidney failure, and other diet-related complications. Food imbalance will likely leave its mark directly on the quality, productivity, and length of life, and indirectly on health care costs, school test scores, and the economic vitality of the city and the region (M. Gallagher, 2007, p. 6).
Despite the undeniable need for public health intervention, there is a lack of both efficacious interventions and research supporting the development of more effective public health policy pertaining to urban food desert areas (Bitler and Haider, 2010; Ver Ploeg, 2010). For example, the Centers for Disease Control and Prevention (2007) recommended behaviours (for example, hiking, fitness centres, jogging, walking, gardening, trying an exotic fruit) are incongruous with unsafe inner-city streets and limited neighbourhood amenities. Rose and Richards conclude that Environmental factors are importantly related to dietary choice in … low-income households, reinforcing the importance of including such factors in interventions (Rose and Richards, 2004, p. 1081).
Although there is a growing literature analysing pieces of the food desert and obesity puzzle, this literature provides neither a systemic perspective to obesity reduction nor policy guidance on how to improve the ecology in which obese persons function (Bitler and Haider, 2010; Ver Ploeg, 2010). The research gap pertains to the lack of knowledge about how context-specific factors affect food and lifestyle choices that directly influence obesity (Ver Ploeg, 2010). Such factors include neighbourhood and environment characteristics, specifically nutritious food access, as well as race, gender, socioeconomic status (SES) and household characteristics such as number of children and number of adults. The confluence of factors associated with obesity requires systemic approaches to research on obesity and to the design of efficacious treatments (Egger and Swinburn, 1997; Geronimus and Thompson, 2004; Hill and Peters, 1998).
This study examines how context-specific factors affect food choices in the Piety Hill neighbourhood of Detroit. Piety Hill is a small, predominantly African American, neighbourhood north-east of downtown Detroit, located north of the New Center (a vibrant district in the Downtown Detroit area). It is roughly bounded by the John C Lodge Freeway (M 10) on the west, Clairmount Street on the north, Woodward Avenue on the east and Euclid Street on the south (see Figure 1). It is less than 1 mile from the epicentre of the 1967 race riot at Clairmount Street and Rosa Parks Boulevard.
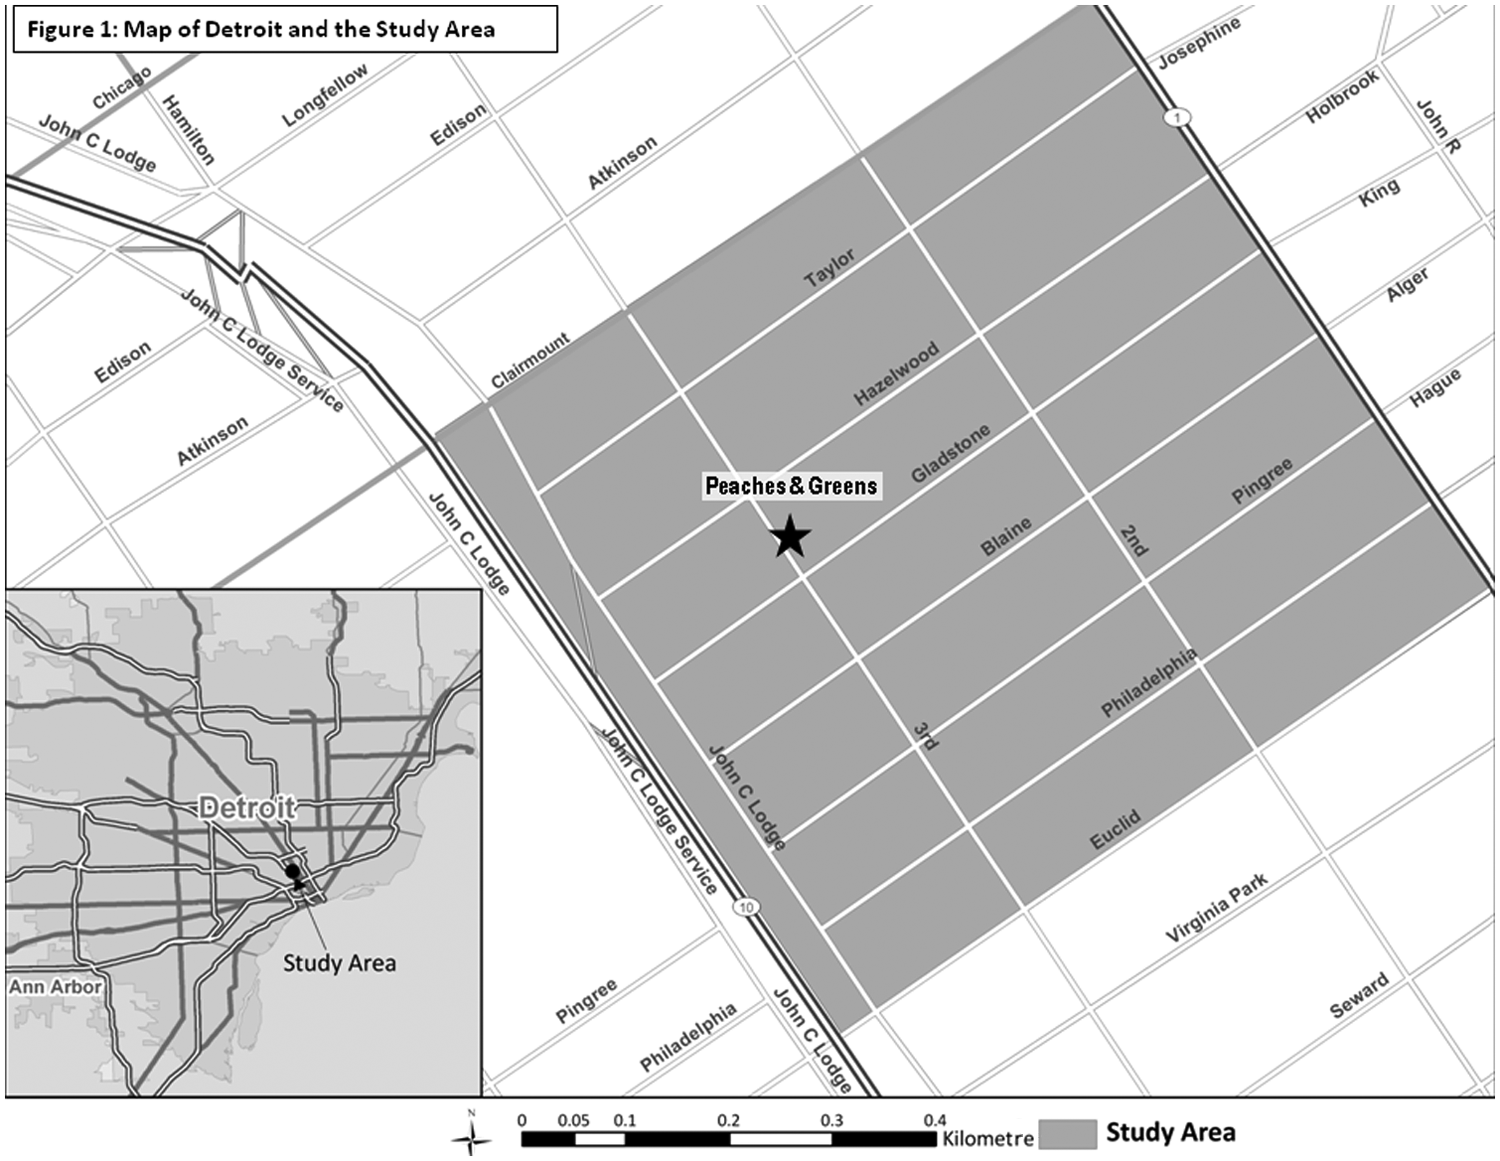
Detroit and the Study Area.
Piety Hill has a mean income lower than 95.6 per cent of US neighbourhoods and a childhood poverty rate of 38 per cent, higher than 89.9 per cent of US neighbourhoods. Nearly 49 per cent of households do not own a car. Piety Hill residents span all age-groups, from young singles to families with children to senior citizens. Average rental rates are $225 per month (NeighborhoodScout, n.d.). The neighbourhood contains numerous abandoned, occupied and/or burnt buildings in various states of disrepair. Reported violent crime rates are almost three times the Detroit metro area average and over 11 times the national average (NeighborhoodScout, n.d.). A custom report (MAPAS, n.d.) for the one-quarter mile radius circle centred approximately in the middle of the neighbourhood revealed a population that is 91.9 per cent African American. 5 The poverty rate exceeds 60 per cent for the 18–64-year age-group and the unemployment rate exceeds 34 per cent. Only 20.1 per cent of the population holds an Associate’s degree or higher, but 27 per cent of the population neither finished high school nor obtained a General Equivalency Diploma (MAPAS, n.d.).
Before Peaches & Greens began operations, the neighbourhood’s single food retail outlet was a windowless, gated corner store with a single sign that advertised liquor, beer/wine and lotto tickets. King Cole Foods, located just north of the neighbourhood, offered a limited selection of FFV (recently they have improved their FFV offerings) and other grocery items. From the study location, it takes 56–66 minutes to reach the nearest Meijer’s (a regional big-box supermarket and department store) and 72 minutes or more to reach the nearest Wal-Mart Supercenter; 6 each of these trips requires walking to and from the bus stop and making a transfer to a second bus, which adds additional travel time and difficulty when carrying groceries.
3. Data
The non-profit greengrocer Peaches & Greens provided the retail-level data. The store sales receipts included the date, time, transaction number, quantity, price and type of fruit for 19 fruits. Data were hand-entered into Excel spreadsheets. The data series is from July 2009 to mid May 2011. Peaches & Greens was open 445 days (20 days per month on average), or 95 calendar weeks, during this time-period.
Table 1 reveals the demand for FFV in terms of total sales, quantity sold and average number of transactions per month. The average weekly revenue from FFV by month for Peaches & Greens for the 23 months was $284, with 72 per cent of sales revenue and 79 per cent of units sold coming from fruit when only FFV are considered. 7 Stated another way, fruit purchases were 3.8 times as large as vegetable purchases in terms of quantity. The store’s range of vegetables is similar to its fruit offerings in terms of quality and variety. A companion primary data collection effort in the neighbourhood confirmed that not all households have the facilities to cook and/or store produce. Hence consumers may prefer products that can be consumed raw and which do not require special storage. Nearly 48 per cent of Piety Hill residents indicated that the inability to store or cook produce limited their FFV purchases (Coleman et al., 2011). The fruits that were most often purchased—bananas, apples, oranges and grapes—are easy to store and consume. On average, there were 94.21 transactions/week (20 a day), at $3 per transaction. This implies overall F&V consumption of 1–2 servings per person per day, 8 which is consistent with national trends. 9
Average weekly revenue, number of units sold and number of transactions
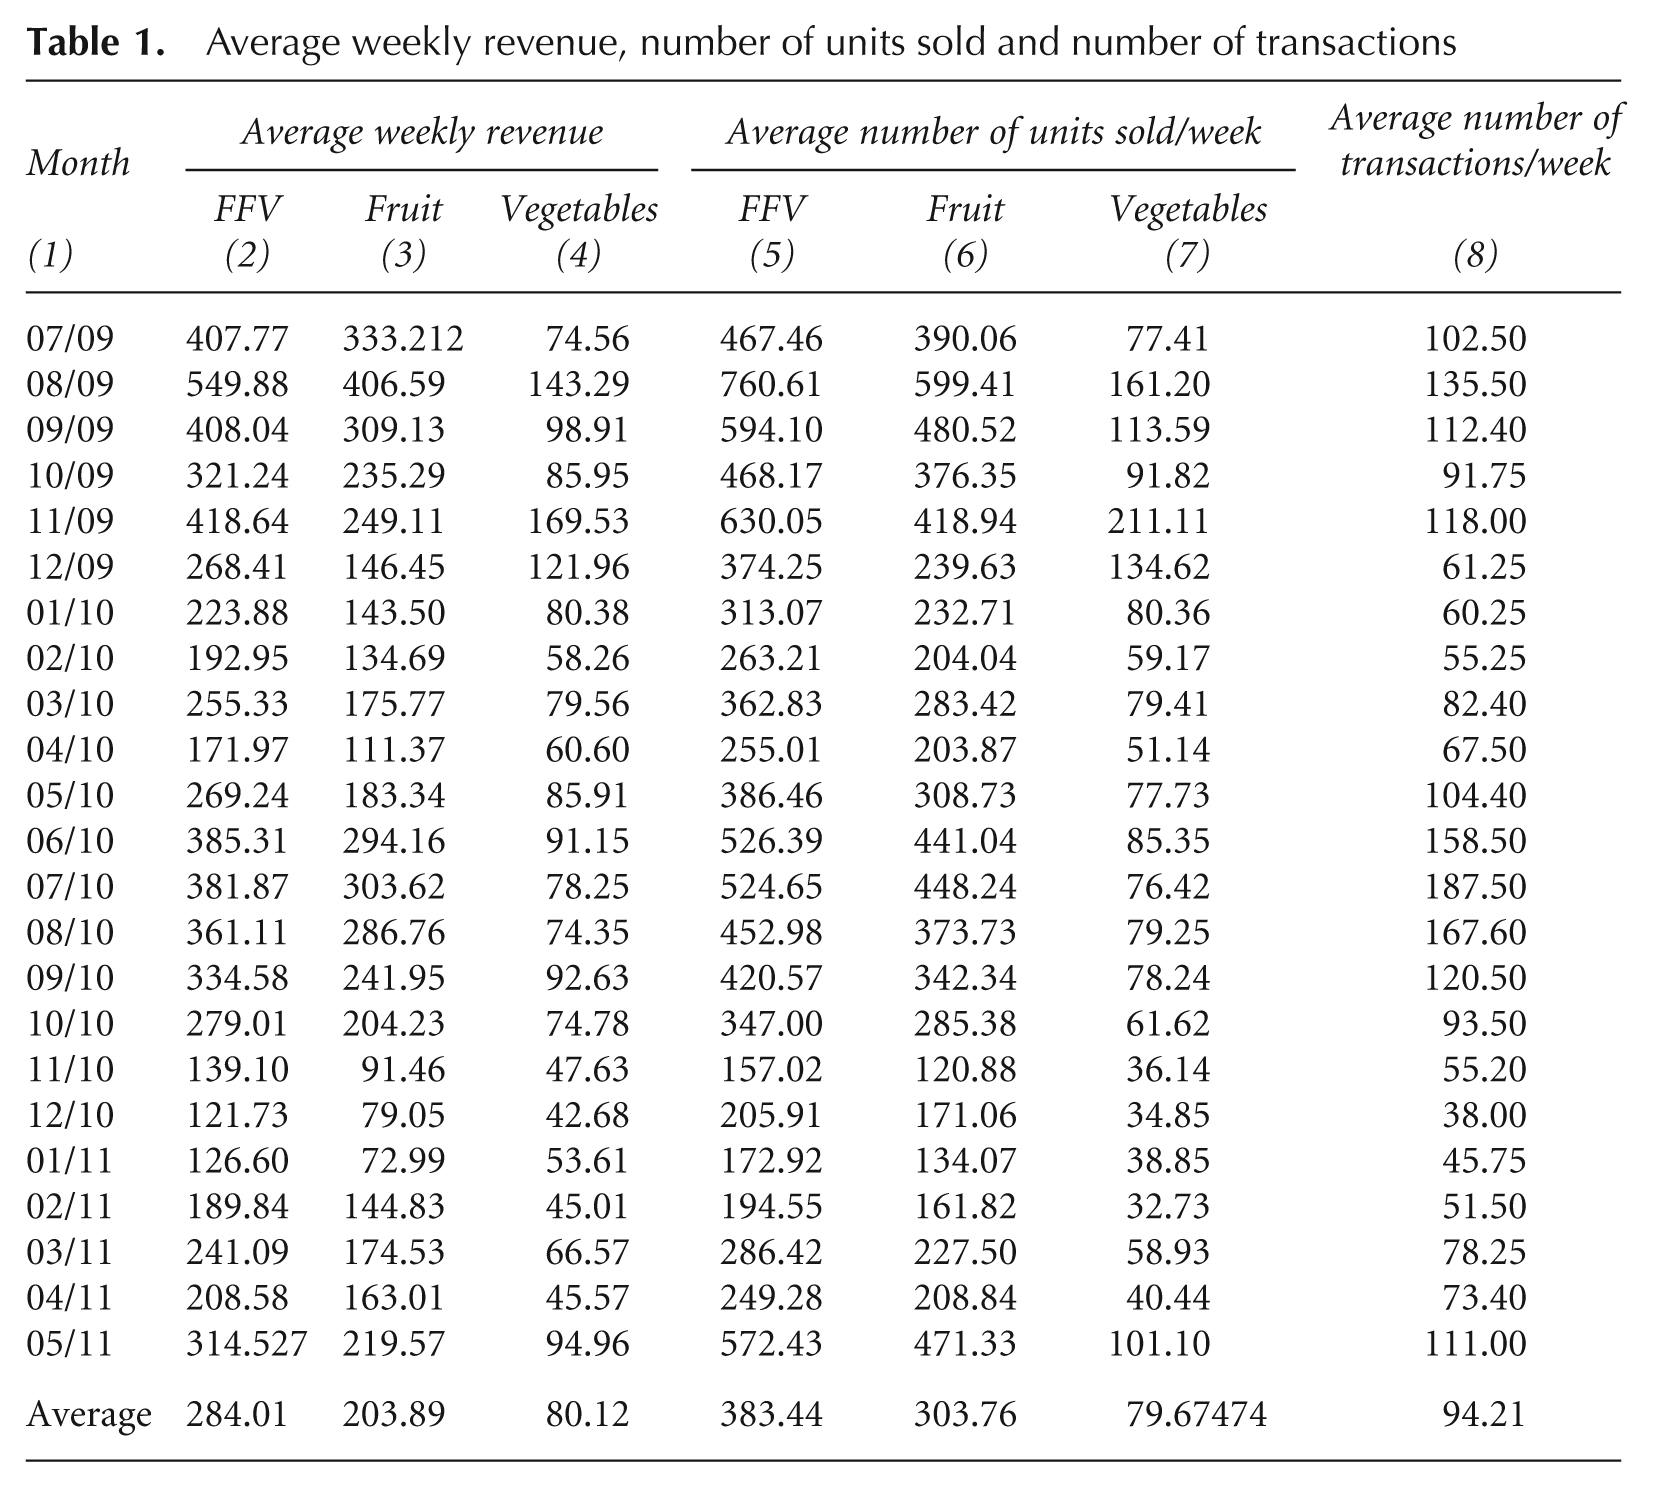
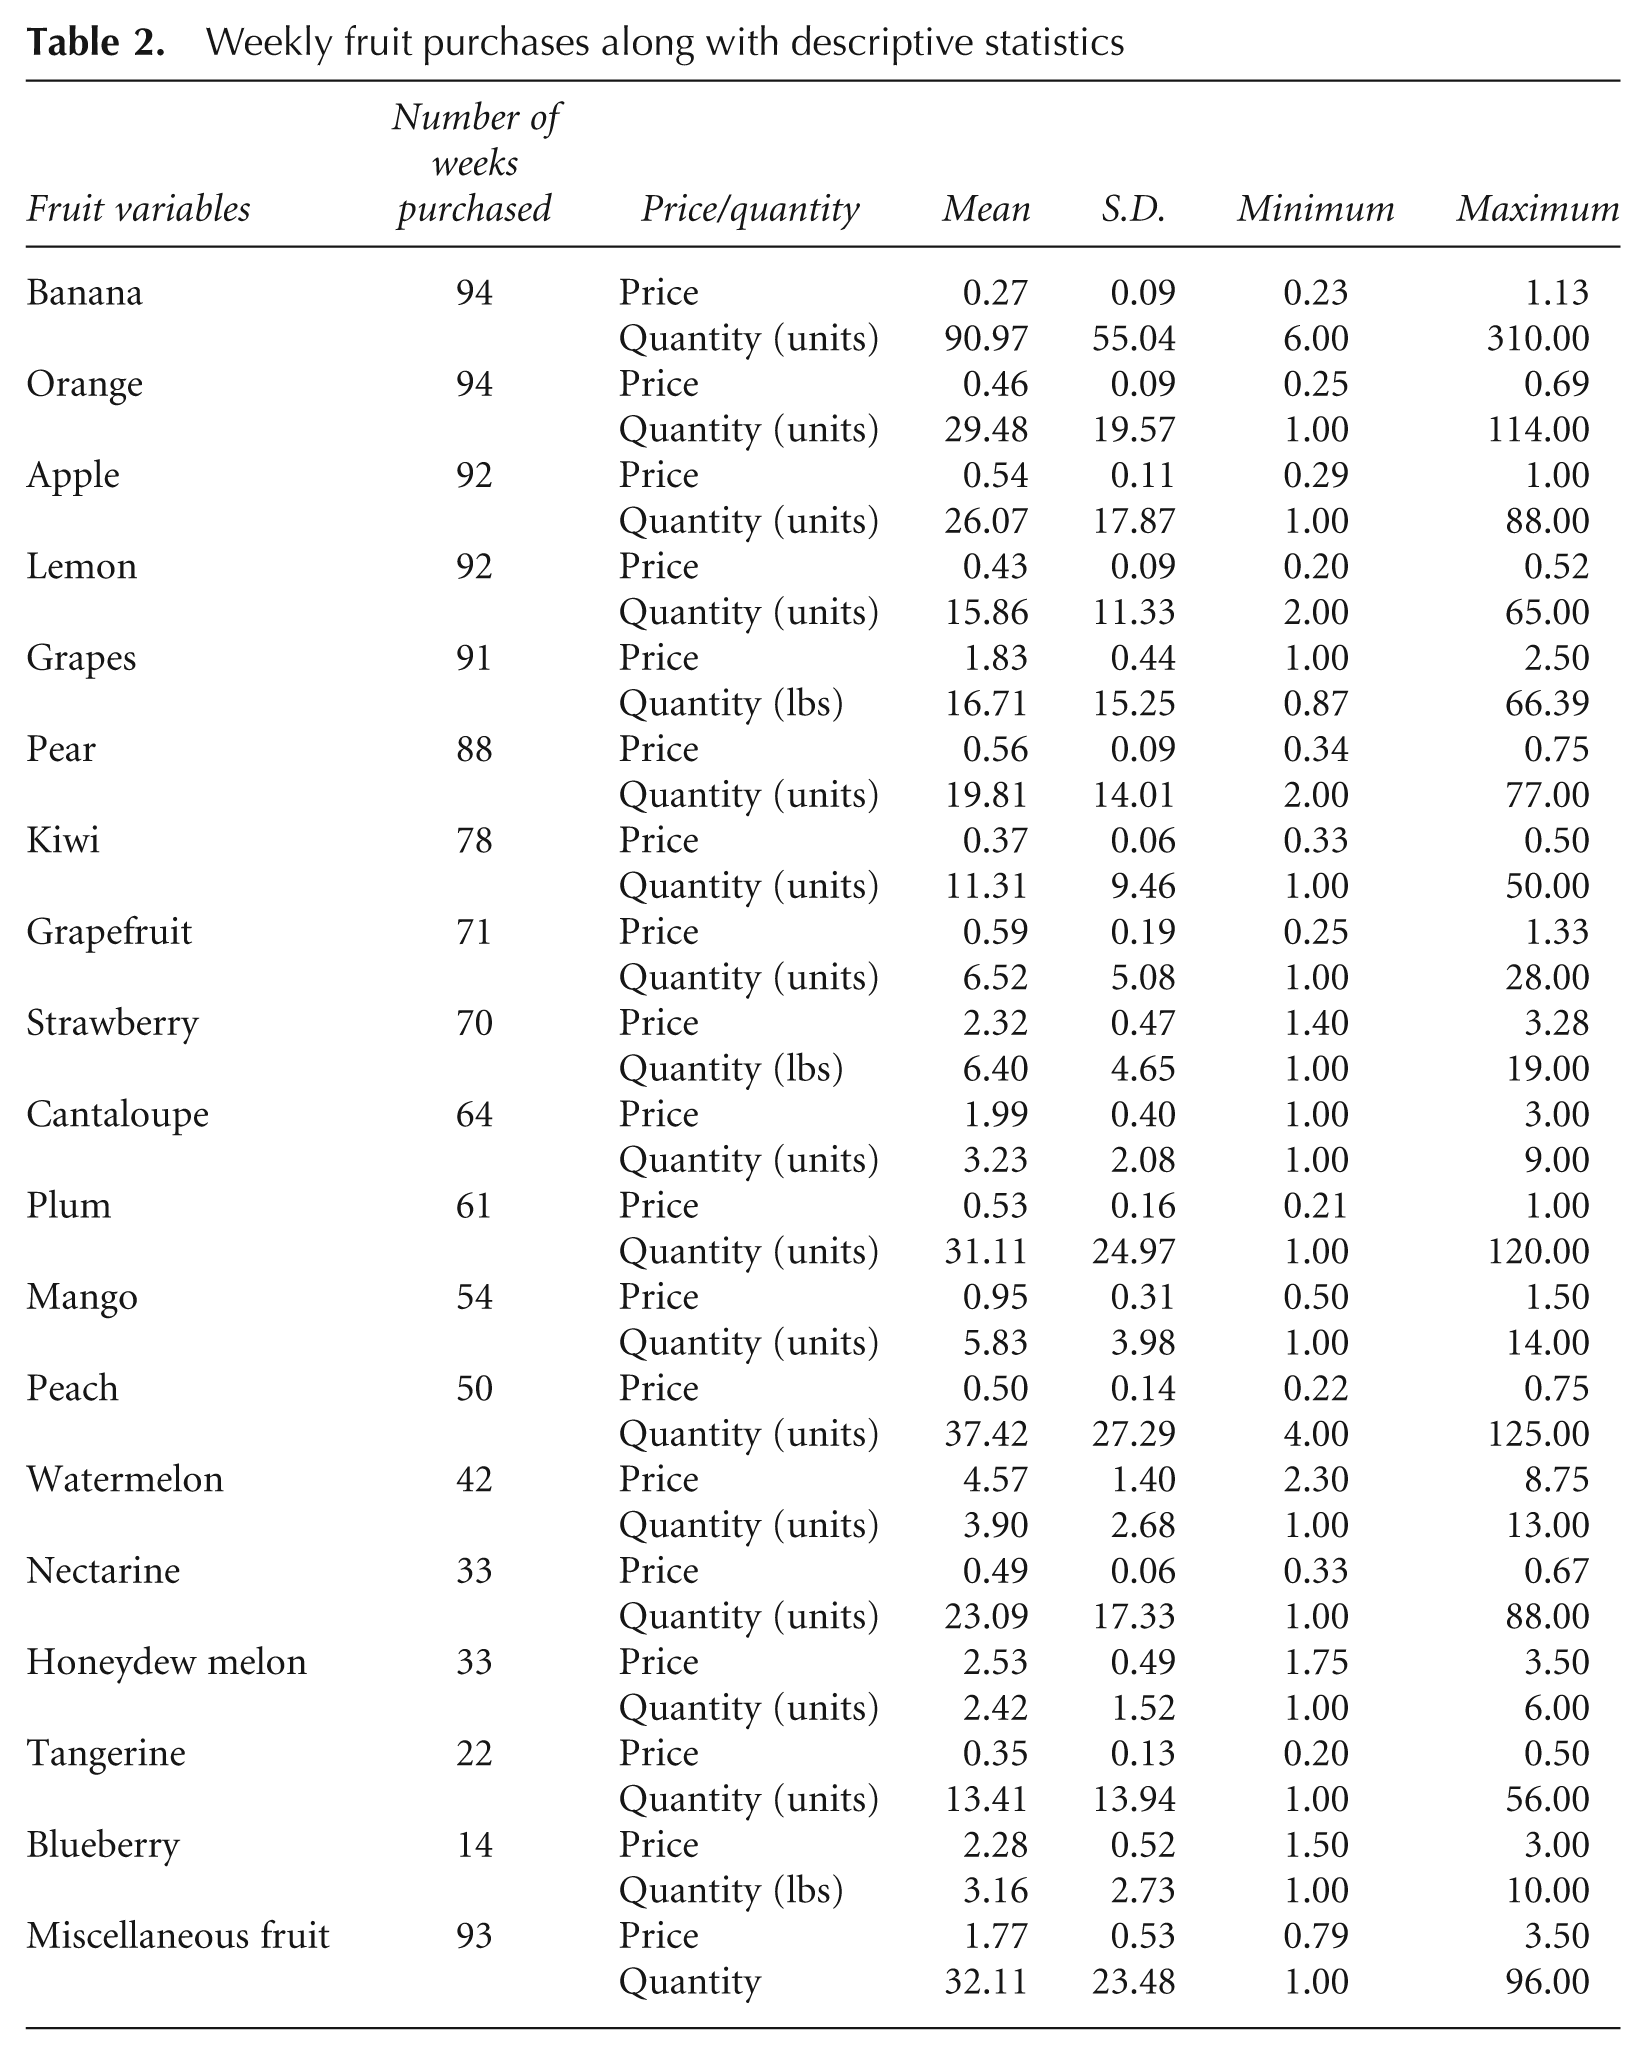
Table 2 provides descriptive statistics for weekly fresh fruit sales. Bananas, oranges, apples and lemons were purchased more than 90 out of the 95 weeks—i.e. over 95 per cent of the weeks the store was open, these fruits were purchased by at least one person. The average quantities purchased and prices paid per week were: 91 bananas at an average price of $0.27/banana, 29.5 oranges at an average price of $0.46/orange, 26.1 apples at an average price of $0.54/apple and 15.9 lemons at an average price of $0.43/lemon. As stated earlier, the fruits that were most often purchased require no special storage or processing and are easy to consume. A study on demand for fresh fruit in an average US community in the Pacific Northwest similarly identified apples, oranges and bananas as the top-selling fruits (Durham and Eales, 2010).
Weekly fruit purchases along with descriptive statistics
The regular transaction activities at the store and the upward purchasing trend evident in Tables 1 and 2 show that food desert residents will purchase fresh produce if it is made available at affordable prices. This is consistent with the findings of Wrigley et al. (2003) who observed a positive impact on food consumption patterns of a retail-provision intervention in a previously deprived community in the UK, particularly among those with the poorest diets. That study also found evidence of a notable shift away from fringe retailers as a primary shopping source for F&V, concluding that improved access had the largest impact on those who had thus far suffered the greatest constraints (Wrigley et al., 2002, 2003).
4. Method of Analysis: The Rotterdam Model
The development of empirical methods to analyse data, test demand theory and predict consumer behaviour has been crucial to the field of economics. The Rotterdam model, an econometric time-series model, was first developed and applied to consumer demand problems in the mid to late 1960s (Theil, 1965, 1975a,b; Barten, 1964, 1968, 1977). It is unique because it was the first consumer demand model to be derived from economic theory. Since its introduction, this model has been used extensively with both theoretically and empirically robust results. The advantages of the Rotterdam approach over other options such as the translog and AIDS models are that the resulting empirical model is easy to estimate (as it can be estimated in a linearised form), theoretical restrictions are easily imposed and, by first differencing the variables, non-stationarity problems are alleviated.
This study utilises a system-wide Rotterdam approach (versus a single equation approach). The model is estimated in the absolute price form and relies on multistage budgeting under the assumption of block independence (Theil, 1976, 1980) or weak separability (Barten, 1977). Intuitively, this means that the allocation problem facing the consumer is to allocate income (expenditure) among broad groups of goods (for example, F&V, other food, clothing, transport, education), which are assumed to be separable. Accordingly, the consumer’s utility functions are additive in groups
The Rotterdam model is usually applied as a differentiated system of equations. The conditional demand equation for fruit can be written as follows (time subscripts are suppressed)

where,
The theoretical demand restrictions for the Rotterdam model are as follows (Mountain, 1988)


Homogeneity of degree zero for the Slutsky parameters means that if all prices and income were to double, given a level of utility, then demand would not change. The adding-up restriction basically states that the total expenditure is equal to the sum of individual expenditures on different fruits. Slutsky symmetry conditions state that the cross-substitution effect between goods X and Y (for example, apples and oranges) must be the same as the cross-substitution effect between goods Y and X.
The formula used to estimate the conditional expenditure elasticity is
The conditional Slutsky (compensated) price elasticities (

at sample means. Slutsky elasticities hold real income constant, thus reflecting pure substitution effects. 12 Cournot (uncompensated) elasticities are calculated as

and are calculated at sample means and reflect both substitution and income effects.
To operationalise the model, the data were aggregated by calendar week to minimise the number of zeros for non-expenditures by individuals on specific fruit products. The weekly aggregates q, p and Q were divided by the number of receipts for the week so that we estimated a model based on the weekly average consumer. This resulted in a dataset with
5. Results
5.1 Model Performance
The model was estimated for the top four fresh fruit sellers (banana, orange, apple and lemon) and all other fruit, resulting in a five-equation system. The adding-up restrictions result in singularity of the error covariance matrix and therefore, as customarily done (Barnett, 1979; Barten, 1969), the ‘other fruits’ equation was dropped for estimation purposes. Homogeneity, adding up and symmetry were imposed, leading to 67 degrees of freedom. 14 The log likelihood value was 588.21. A Wald test was performed to test the significance of the model. The joint hypothesis of all parameters being equal to zero could be rejected at the 0 per cent level (chi2(14) = 352.2). The system-wide R2 (T. G. Schmitz and Seale, 2002) was 0.54. In accord with economic theory, the own price elasticities were all negative and three of them (banana, orange, apple) were statistically significant. Overall, the model fits the data well.
5.2 Expenditure Parameters and Elasticities
The estimated (conditional) expenditure parameters,
Top four fruit parameter estimates, homogeneity, adding up and symmetry imposed, R2 = 0.54; n = 81

Notes: Standard errors are reported in parentheses. *** p<0.01; ** p<0.05; * p<0.1.
The (conditional) average expenditure elasticity of demand for the Rotterdam model is calculated as
Conditional Slutsky (compensated), Cournot (uncompensated) and expenditure elasticities at sample means
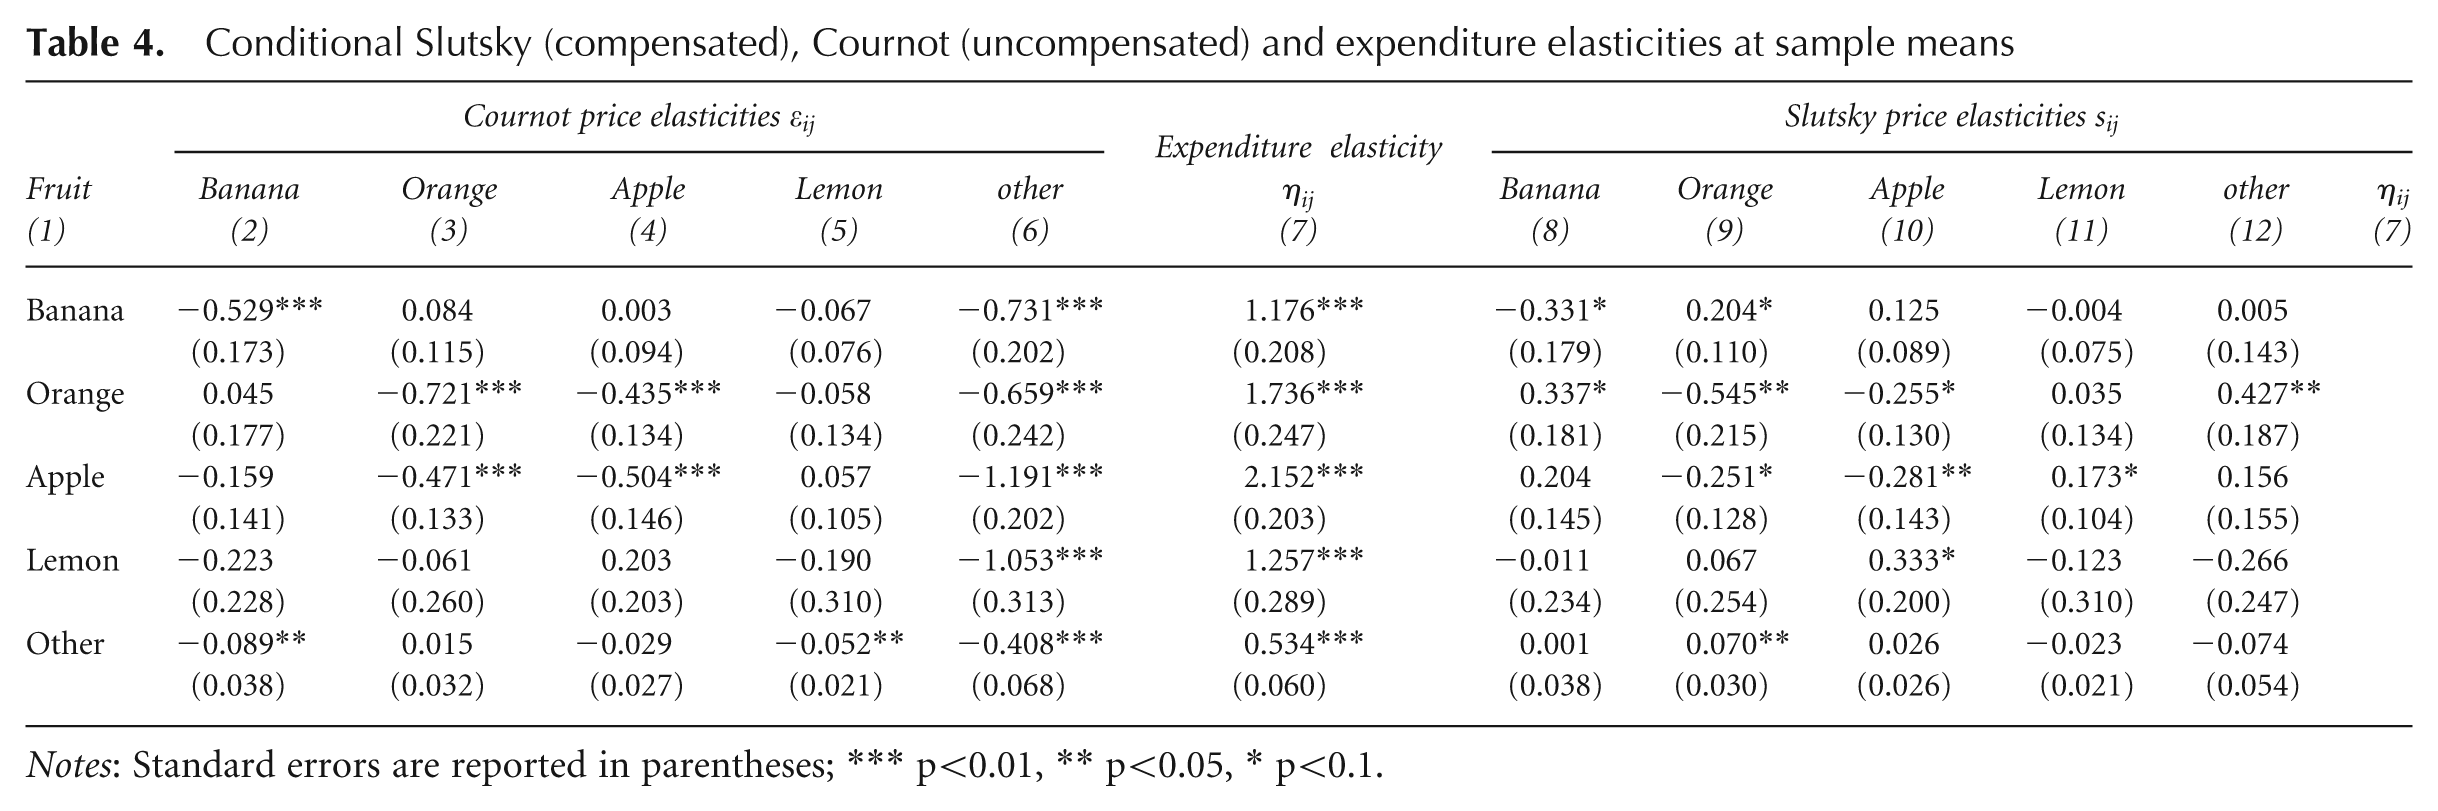
Notes: Standard errors are reported in parentheses; *** p<0.01, ** p<0.05, * p<0.1.
For all except ‘other fruits’, expenditure elasticities were greater than one—meaning that a 100 per cent expenditure increase yields a greater than 100 per cent increase in purchases. Accordingly, all bananas, oranges, apples and lemons represent superior, or luxury, goods within the fruit group in this food desert community. Specifically, a 1 per cent increase in expenditure on fruit increases purchases by 1.18 per cent for bananas, 1.74 per cent for oranges, 2.15 per cent for apples, 1.26 per cent for lemons and 0.53 per cent for all other fruit.
5.3 Price Parameters and Elasticities
The conditional Slutsky price parameters are reported in columns 2–6 of Table 3. They represent compensated demand responses to price and thus denote pure substitution effects. 15 All estimated own price parameters are negative, as expected (indicating that there is a negative demand response to price increases). Banana, orange and apple own price parameters were statistically significant at the 10 per cent, 5 per cent and 5 per cent levels respectively. This indicates that own prices play a role in explaining purchasing behaviour for bananas, oranges and apples, but they are not important for lemons in this community.
Slutsky cross-price parameters (Table 3) are indicative of cross-relationships between goods. They were significant for the banana–orange (
Price elasticities are a measure of sensitivity to price changes. They denote the percentage change in demand caused by a percentage change in price. Two types of elasticities can be calculated from Slutsky parameters: Slutsky and Cournot elasticities. Slutsky (compensated) elasticities 16 represent pure substitution effects while Cournot (uncompensated) elasticities comprise both income and substitution effects (Frisch, 1959). Slutsky elasticities indicate the demand response to a 1 per cent change in price, holding real expenditures on fruit constant. Cournot elasticities indicate demand response to a 1 per cent change in price, holding nominal expenditures on fruits constant. Slutsky and Cournot elasticities are reported in Table 4. They were calculated at the sample mean.
Slutsky own price elasticities of bananas, oranges and apples were negative and statistically significant; thus, a 1 per cent increase in price would lead to a decrease in purchases by 0.33 per cent, 0.54 per cent and 0.28 per cent respectively. The compensated own price elasticities are all smaller than unity, indicating an inelastic demand response (i.e. a price change leads to a proportionally smaller demand change). Slutsky own price elasticities for lemons and all other fruit were very small and not statistically significant, indicating that their own price is not important in the purchasing decision.
Slutsky cross-price elasticities (Table 4) indicate the percentage change in demand of fruit i with respect to price of fruit j. A positive Slutsky cross-price elasticity indicates net substitutes, while a negative Slutsky cross-price elasticity designates net complements. Thus, bananas and oranges, oranges and all other fruit, and apples and lemons are net substitutes while oranges and apples have a complementary relationship.
The Cournot own price elasticity includes real income effects and was therefore lower than the respective Slutsky elasticity for all fruits. However, all elasticities remained in the inelastic range, indicating a less than proportional demand response to a price change.
All Cournot own price elasticities were negative and all but the lemon own price elasticity were statistically significant. Specifically, if their own price increased, banana purchases would decrease by 0.53 per cent, orange purchases by 0.72 per cent, apple purchases by 0.5 per cent and purchases of all other fruits would decrease by 0.41 per cent. Our results correspond to previous studies but are considerably less elastic than the uncompensated elasticities estimated by Durham and Eales (2010) for two stores in the pacific Northwest, who found an elastic response to price changes in apples, oranges, bananas and grapes. Conversely, Durham and Eales (2010) found substantially lower expenditure elasticities—particularly for apples and bananas, which were in the inelastic range. This means that, within the fruit group, income plays a much more important role in the purchasing decisions of Detroit food desert residents than price compared with consumers more representative of the average American. Furthermore, while apples and bananas were found to be necessities in Portland, Oregon, (Durham and Eales, 2010) they are luxury goods in the Detroit food desert with respect to the fruit group.
The income effect can outweigh the price effect in Cournot cross-price elasticities and therefore they can have opposite signs as their Slutsky counterparts (Schmitz and Seale, 2002). Eight Cournot cross-price elasticities (six of which involved ‘other fruit’) were significant and negative, indicating gross complements (Table 4). The significant combinations of goods were banana–other fruit, orange–apple and lemon–other fruit. Orange and apple demand elasticities with respect to other fruit price were negative and significant (indicating gross complements). However, the inverse relationship was not significant.
6. Conclusions
This seminal study on understanding the purchasing behaviour of food desert consumers is unique in that it is the first to use retail-level data to estimate expenditure and price elasticities for specific fruits among a low-income, minority, urban population. The study was made possible by the opening of a small, non-profit greengrocer in what was formerly a severe food desert.
The daily average FFV sales at the grocer were approximately $60 (20 transactions of $3 each). This implies an overall F&V consumption of 1–2 servings per person per day—corresponding to the national average. This finding shows that food desert residents will purchase fresh produce if it is made available.
This is consistent with the findings of Wrigley et al. (2002, 2003), who observed a strong impact on F&V shopping patterns of a retail-provision intervention in a previously deprived community in Leeds, in the UK.
Econometric estimation of the Rotterdam system of weekly purchase expenditures allowed the analysis of income and price effects at the community level. The results show that expenditures (a proxy for income) play a significant role in determining the purchasing behaviour of consumers. Specifically, if expenditures on the fruit category increased by 1 per cent, expenditures on bananas, oranges, apples and lemons would increase by more than 1 per cent.
The urban food desert consumers were similarly price responsive as the average US consumer. Specifically, if the prices of bananas, oranges and apples were decreased by 1 per cent, the purchases of those goods would increase more than 0.5 per cent. This indicates that income plays a much more important role in the purchasing decisions of Detroit foot desert consumers than price.
These results show that increasing income and/or lowering price will increase the amount of fruit consumed. Since F&V consumption is linked to a healthy diet and reduced obesity (Franco et al., 2009; He et al., 2004), this implies that the obesity crisis could be positively impacted in food desert areas by offering a variety of suburban-priced fruit products.
Increasing access to competitively priced, quality fruit may not be that difficult. The opening of Peaches & Greens in this food desert lowered both the local retail price and the overall cost of fruit, by lowering the transport and transactions costs for consumers with formerly latent demand. This suggests that increasing the number of retailers that sell fruit in a food desert—even if only by one—may lower the price of that category, improve quality and increase purchases. Similar opportunities may be available in other food desert areas, especially for a retailer who is willing to price competitively.
However, retail strategies have to be carefully devised: introducing large stores could exacerbate the food desert problem by causing existing stores to close. Clarke et al. (2002) showed that opening a number of smaller shops may be more successful, especially in areas of low mobility, such as Detroit. Non-mainstream ‘grocery’ and convenience stores that locate in food deserts usually focus on high-volume goods such as juices, soda, chips and candy. Good-quality FFV could represent a profit centre if priced right and if the right mix of goods is offered. In fact, this could be a growth category for many of these smaller operations.
This paper is the first step in addressing the (mis)perception that food desert residents will not buy fresh F&V at any price, by showing that food desert residents are even just as price responsive than the average US consumer. However, more data and interventions are required to address fully the concerns of the grocery store managers. These concerns include
— Does the introduction of a non-profit greengrocer induce greater FFV selection among neighbourhood food retailers competing with the grocer?
— Is the introduction of a new retailer necessary, or is the introduction of competitively priced FFV at existing small retailers sufficient to generate increased FFV demand?
— Can small retailers (or supermarkets) sell FFV profitably in a food desert?
— Are the resolution of consumers’ storage issues (availability of a refrigerator/cabinets, pests, housemates consuming food) tantamount to the increased purchases of FFV?