
Abstract
This paper uses data from the national survey of third-sector organisations in England to show, for the first time, important variations between organisations and localities in government funding of third-sector activity. It shows that organisations serving the personally or socially disadvantaged are most likely to be publicly funded and that deprived neighbourhoods and local authorities have the highest share of publicly funded organisations. Further, at the neighbourhood scale there is evidence for an interaction effect between kind of organisation and area deprivation, such that organisations working in deprived areas with disadvantaged groups are particularly likely to receive some public funding. These results have particular resonance at a time when many third-sector organisations are faced with cuts in their public funding. They also have relevance to theoretical work on the relationship between government and the voluntary sector.
1. Introduction
The UK’s Coalition government’s policies clearly envisage that voluntary organisations will play a much greater role than hitherto in responding to social needs. Simultaneously, the government are pursuing substantial reductions in public expenditure. Public funding has played an increasingly significant role for the voluntary sector in the UK in recent years, raising questions as to whether these two objectives are compatible. In this paper, we argue that, because of geographical variations in the share of voluntary organisations in receipt of public money, there are certain locations in which funding reductions are likely to have particularly severe effects. We make this case by presenting the most detailed analysis to date of the numbers and types of voluntary organisations which receive public funding in England and the kinds of places with a high share of publicly funded voluntary organisations.
The total public income of voluntary organisations increased from £8 billion to £12.8 billion between 2000/01 and 2007/08, an increase of 53 per cent, outstripping increases in other sources of income (Clark et al., 2010). However, these estimates are compiled from a sample of accounts designed to capture the bulk of the economic weight of the sector and consequently they provide little spatially disaggregated evidence on the characteristics of organisations, and the characteristics of communities which receive such funding. Such a disaggregated analysis is highly desirable for two reasons. First, it can facilitate a better understanding of the present context in which recent developments in public policy and finance, both in terms of the ‘Big Society’ and public expenditure reductions, are taking place. Secondly, it allows exploration of theoretical propositions about the reasons why voluntary organisations might receive public funding. Indeed, this work arguably constitutes the first attempt to test the predictions from such theories on a dataset which is fully representative of the voluntary sector in England. We discuss these two main themes, of policy and of theory, in turn.
1.1 Public Policy and Finance
Recent policy and financial developments have increased interest in the relationship between government and voluntary organisations. On the one hand, the government has launched its ‘Big Society’ project (Mohan, 2012) in which the assumption appears to be that voluntary effort is to be the first port of call for meeting a range of social needs. This initiative goes hand-in-hand with a new localism in public policy: the belief that power should be decentralised, as far as possible, by placing the responsibility for decision-making squarely at the local level. There is also interest in further extending the role of voluntary organisations in public service delivery (Cabinet Office, 2010). These policies present opportunities for voluntary organisations. On the other hand, the reductions in public funding being implemented by the Coalition government have been characterised as reducing public expenditure to a level comparable with that of the US (Taylor-Gooby, 2012; Taylor-Gooby and Stoker, 2011). Once the scale of prospective public expenditure reductions became clear, concerns were expressed about the likely effect on voluntary organisations.
Given these two developments it is timely that, through analysis of a substantial new dataset, the national survey of third-sector organisations (NSTSO) conducted in 2008, we can provide detailed information about voluntary organisations’ public funding for the first time. This information can, first, provide a useful benchmark against which to describe future changes in the relationship between the state and the voluntary sector. Secondly, it can provide a description of the kind of organisations potentially vulnerable to cuts in public funding. In particular, if certain kinds of places have a particularly high share of publicly funded organisations, this would suggest that the impact of changes in funding will not be felt equally across the country. The survey is especially useful in providing an opportunity to explore, in a fine-grained way, the geographical implications of exposure to public funding streams, because it is possible to disaggregate results by local authority (the 149 upper-tier local authorities in England) and by levels of deprivation.
1.2 Theory
The comprehensiveness and coverage of the NSTSO also render it very useful for testing whether the characteristics of organisations which receive government funding are consistent with what would be predicted from theories about the non-profit sector. Efforts to establish a theoretical justification for non-profit forms of social organisation have been based—as in Hansmann (1980)—on the idea that markets were inappropriate for some kinds of service in which either price signals in a conventional sense could not be applied, or in which there was an asymmetric relationship between providers and users of services. Other justifications saw voluntary provision of services as being an appropriate response to the difficulties of obtaining democratic endorsement for public provision of welfare services (Weisbrod, 1975).
Salamon (1987) sought to reformulate theories of the existence of the voluntary sector (and of the welfare state) to accommodate the reality of government funding of voluntary organisations. Previous theories, like Weisbrod (1975) and Hansmann (1980), had characterised welfare as a zero-sum game, in which voluntary organisations came into existence because of state and market failure to supply collective goods. Salamon (1987) therefore introduced the theory of ‘voluntary-sector failure’, in which the voluntary-sector provides the ‘first line of response’ to market failures and government action was then needed to address certain voluntary-sector failures. He argued that there were four elements of voluntary-sector failure: philanthropic insufficiency (the adequacy of funding levels in relation to the challenges faced by societies), philanthropic particularism (a tendency on the part of donors to support a fairly narrow range of causes), philanthropic amateurism (a result of the fact that services were run principally by volunteers and therefore did not always achieve high standards) and philanthropic paternalism (services reflected the preferences and perceptions of donors and trustees as much as the needs of beneficiaries).
Most pertinent to the current context is the notion of philanthropic insufficiency the inability to generate resources that is both adequate enough and reliable enough to cope with the human-services problems of an advanced industrial society (Salamon, 1987, p. 39).
Where voluntary contributions are inadequate, government funding—in turn raised through taxation—is needed. We emphasise variations between local authorities, and between areas experiencing different levels of prosperity, because of the extensive historical evidence that one important manifestation of philanthropic insufficiency is that voluntary resources and organisations are often least available in the most needy communities (Salamon, 1987; Mohan, 2003). Note that, in the English context, needy communities are concentrated in urban areas, where poverty has been associated with processes of economic decline (Green, 1996). We also consider the question of philanthropic particularism—the idea that organisations which rely completely on charitable donations are likely to target a particular, and perhaps narrow, range of causes. This implies that public funding is more likely to be received by non-profit organisations working with other, perhaps more marginalised, client groups.
Salamon’s (1987) theory is particularly powerful when combined with Billis and Glennerster’s (1998) theory of comparative advantage. While the theory of voluntary-sector failure argues that government strengths complement voluntary-sector weaknesses, the theory of comparative advantage argues that voluntary-sector strengths can complement government weaknesses. The hierarchical bureaucracies which characterise the public sector may provide inflexible and unresponsive services. In contrast, voluntary agencies are characterised by stakeholder ambiguity—where there is a less clear-cut differentiation between employer and employee, provider and recipient, management committee and staff, etc.—which can lead to a reduced gap between users and those in authority and can also enhance the potential for “greater motivation, sensitivity to and knowledge about client need” (Billis and Glennerster, 1998, p. 91). Billis and Glennerster argue that this gives voluntary agencies a comparative advantage compared with other sectors when aligned with certain categories of user disadvantage: the ‘personally disadvantaged’ (those who require others to act on their behalf since they are not able coherently to articulate their preferences); the ‘societally disadvantaged’ (stigmatised individuals and groups); and those suffering from ‘community disadvantage’ (since they live in areas “where the market, political and civil structures have broken down” (p. 88)). In contrast, the state is well placed to support those at ‘financial disadvantage’ (those lacking purchasing power in the marketplace) and the voluntary sector is unlikely to have a comparative advantage here unless financial need is combined with personal, societal or community disadvantage.
Note that we are not seeking to test the theory of voluntary-sector failure, or the theory of comparative advantage, per se. Instead we seek to use them to make predictions about what kinds of organisations are most likely to be in receipt of public funding. We will then examine the extent to which our empirical findings are consistent with these predictions. At the organisation level, on the basis of the theory of comparative advantage, we predict that a higher proportion of organisations serving the personally, socially or community disadvantaged would be in receipt of public funds than, for example, those that serve the financially disadvantaged specifically. This is because there may be more impetus for government to fund organisations catering for those less well served by the hierarchical structure of a public bureaucracy. At the level of communities, on the basis of the theory of voluntary-sector failure, we might expect the most deprived areas to have the highest proportion of publicly funded organisations. This is where the resource insufficiency of the voluntary sector would be expected to be most marked, such that government funding is needed.
The paper proceeds as follows. First, we explain the advantages of our data. Then we describe the analytical methods used in exploring how the likelihood of an organisation receiving public funding varies according to the kind of organisation, where it is located, and the interaction between the two. Discussion of these analyses is presented and the conclusion considers the implications for policy.
2. Data
The national survey of third-sector organisations (Cabinet Office et al., 2010) is the best data source for this paper for a number of reasons. First, organisations were asked directly about whether they received particular kinds of statutory income according to itemised lists (Table 1). This allows clarity about what we are measuring as income from government. Secondly, the NSTSO was designed to provide a representative sample of third-sector organisations—including not only charities, but also community interest companies (CICs), companies limited by guarantee (CLGs) and industrial and provident societies (IPSs). Note that this is particularly important given the different traditions of voluntary action—for example, the distinction between ‘philanthropy’ and ‘mutual aid’ (Davis-Smith et al., 1995)—in different areas. Thirdly, and importantly, organisations were asked to provide information about their scale of operation—including whether or not they work specifically at the neighbourhood scale. Thus, for the first time, we are able to isolate these organisations and relate them to the nature of area deprivation at a local scale (see Clifford, 2012).
Sources of funding to third-sector organisations included in the NSTSO

The target population of the survey was third-sector organisations in England. Selection of organisations was informed by the ‘structural/operational’ definition: to be considered a third-sector organisation, a body must be a formal organisation, self-governing, independent of government, not profit-distributing and voluntary (Kendall and Knapp, 1993). In practice, regulatory information from the Charity Commission and Companies House provided the basis for the sampling frame and Gill (2008) provides details of the decisions made to move from this frame to the target population.
The unit response rate was 47 per cent: questionnaires were sent out to 104 931 organisations and 48 939 organisations responded (including 40 692 charities, 5622 non-charitable companies limited by guarantee, 271 community interest companies and 2354 industrial and provident societies). This is a reasonable response rate to a survey of this kind, but there is a significant issue of non-response nonetheless. Weights were used to adjust for differences in the probability of responding to the survey between different legal forms and local authorities, but we are unable to adjust for any differences in response rates according to whether an organisation receives income from the state. However, unless any difference in response probability between non-publicly-funded and publicly funded organisations itself varies across areas or between different beneficiary groups, the comparative aspect of the analysis should be robust.
The survey data were linked to the level of area deprivation at the lower super output area (LSOA) level. 1 LSOAs are geographical areas, with an average population of 1500 people, designed for the presentation of statistics derived from census data. The index of multiple deprivation, used in this paper, is a summary of seven domains of deprivation relating to: income; employment; health and disability; education, health and training; barriers to housing and services; crime; and characteristics of the local environment (see DCLG, 2007, for more information). We use the LSOA measure of deprivation to analyse the relationship between place and public funding for organisations working at a neighbourhood level. For local authorities, we link to the NSTSO data a summary of local deprivation at the local authority (non-metropolitan county/metropolitan district/unitary authority/London borough) level—the population-weighted average of the combined LSOA scores. We use this to analyse the relationship between place and public funding for organisations working at the local authority scale.
3. Analytical Methods
The general questions relevant to both theory and policy are: which kinds of voluntary organisations receive public income and which kinds of places have a high share of publicly funded organisations? We explore the former by showing how, at the organisation level, the probability of receiving public income varies according to the size of the organisation (measured by income), the beneficiary groups that it serves and other organisation characteristics. We explore the latter by showing how the proportion of organisations receiving public income varies according to the level of deprivation of the neighbourhood or local authority in which the organisation is located.
We then explore the inter-relationship between these organisation and place-level effects. There are three ways in which this relationship might be conceptualised. First, differences between places are simply ‘compositional’, reflecting the kinds of organisations in that area. The theory of comparative advantage would predict that organisations serving the personal, socially and community disadvantaged are likely to receive public income, and we would expect more of these organisations in certain areas than others. Secondly, there are also independent and additive place-level effects, over and above any compositional influences. The theory of voluntary failure would predict resource insufficiency, and therefore the need for public funds, to be most acute in deprived areas. Thirdly, there are both organisation and place-level effects, and these cannot be understood independently. The effects are not additive but interact—the effect of being in a deprived area varies according to the kind of organisation. Resource insufficiency and comparative advantage—the need for and impetus to provide government funds—are more of an issue for certain kinds of organisations than others.
We use logistic regression to help distinguish between these scenarios. 2 Note that in practice this is not easy to do with observational data. Scenario 2 is in effect assuming an experimental scenario in which we would be able to isolate a place effect—assuming that the kinds of organisations in different areas were identical, would there be variation between areas in the probability of receiving public funds? With observational data, we can adjust for differences between areas in terms of organisational characteristics that we observe, but there is always the possibility that there remain important unobserved differences that we are not controlling for. (See Lieberson (1987) for an excellent overview of these issues.) However, it is possible to distinguish scenario 3. Whether or not we interpret any remaining variation between places, after controlling for observable organisation characteristics, as a genuine ‘place’ effect (scenario 2) or simply as a reflection of unobserved heterogeneity (variation) at the organisation level (scenario 1), we can test to see whether this variation is the same for organisations with different observable characteristics: are organisations working with certain kinds of groups more likely to receive public funding if they are located in certain kinds of areas? We do this by performing a test for the significance of the change in likelihood for nested regression models, one with the main additive effects and one with an interaction term between the kind of place and the observable organisational characteristic of interest.
Finally, we consider variation in the share of publicly funded organisations between local authorities. This is of substantive interest since the local authority is a key source of funding to third-sector organisations: we estimate that a quarter of third-sector organisations received funding from local authorities in 2008, in the form of either grants or contracts from district or county councils, or from unitary authorities. For this stage of analysis, we pool together all organisations nested within local authorities, thus including those that operate at a neighbourhood scale and those working across the local authority. Since there is a significant sample size in each local authority, we are able to present estimates from a model which includes a separate parameter for each local authority. Note that, since for this stage in the analysis we are interested in the absolute differences between local authorities, we do not control for any compositional differences in terms of their organisational profile. Given that deprivation is concentrated in urban areas, we expect the local authorities with the highest share of publicly funded organisations to be urban areas.
4. Results and Discussion
Overall, 36 per cent of third-sector organisations received public income in 2008, in that they receive income from at least one of the sources in Table 1. More specifically, around 18 per cent receive income specifically from local sources, 5 per cent specifically from national sources and 14 per cent receive income from both. However, there are very considerable variations between organisations and places in the likelihood that they receive public money.
4.1 Organisation-level Variation
Table 2 shows variations between beneficiary groups in the probability of receiving public money. Organisations serving groups experiencing some specific dimensions of disadvantage, although relatively small in number, were much more likely to receive public funding than organisations serving other groups. This is consistent with predictions based on Salamon’s (1987) notion of philanthropic particularism: where not all sub-groups of the population are favoured by philanthropists, there is a role for government in ensuring that these groups are adequately catered for. It is also consistent with predictions based on the theory of comparative advantage (Billis and Glennerster, 1998): since stakeholder ambiguity can mean that voluntary organisations are well placed to meet the needs of certain disadvantaged groups compared with state delivery agencies, there may be a particular impetus for government to fund voluntary organisations working in these areas. Thus, to use Billis and Glennerster’s (1998) categories, organisations serving the ‘socially disadvantaged’ (including the general category ‘socially excluded/vulnerable people’, people with mental health needs, offenders/ex-offenders and their families, asylum-seekers/refugees, homeless people and people with addiction problems) and the ‘personally disadvantaged’ (including people with learning difficulties) are much more likely to receive public income than organisations serving other groups. In contrast, examining those organisations catering specifically for ‘people with a particular financial need’—and which do not also cater specifically for those at a ‘social’, ‘personal’ or ‘community’ disadvantage—only 24 per cent receive income from government (not shown in Table 2). This is consistent with our expectation, on the basis of theory, that these organisations do not have a comparative advantage over state delivery agencies.
Organisation variation: probability of receiving public income according to beneficiary group
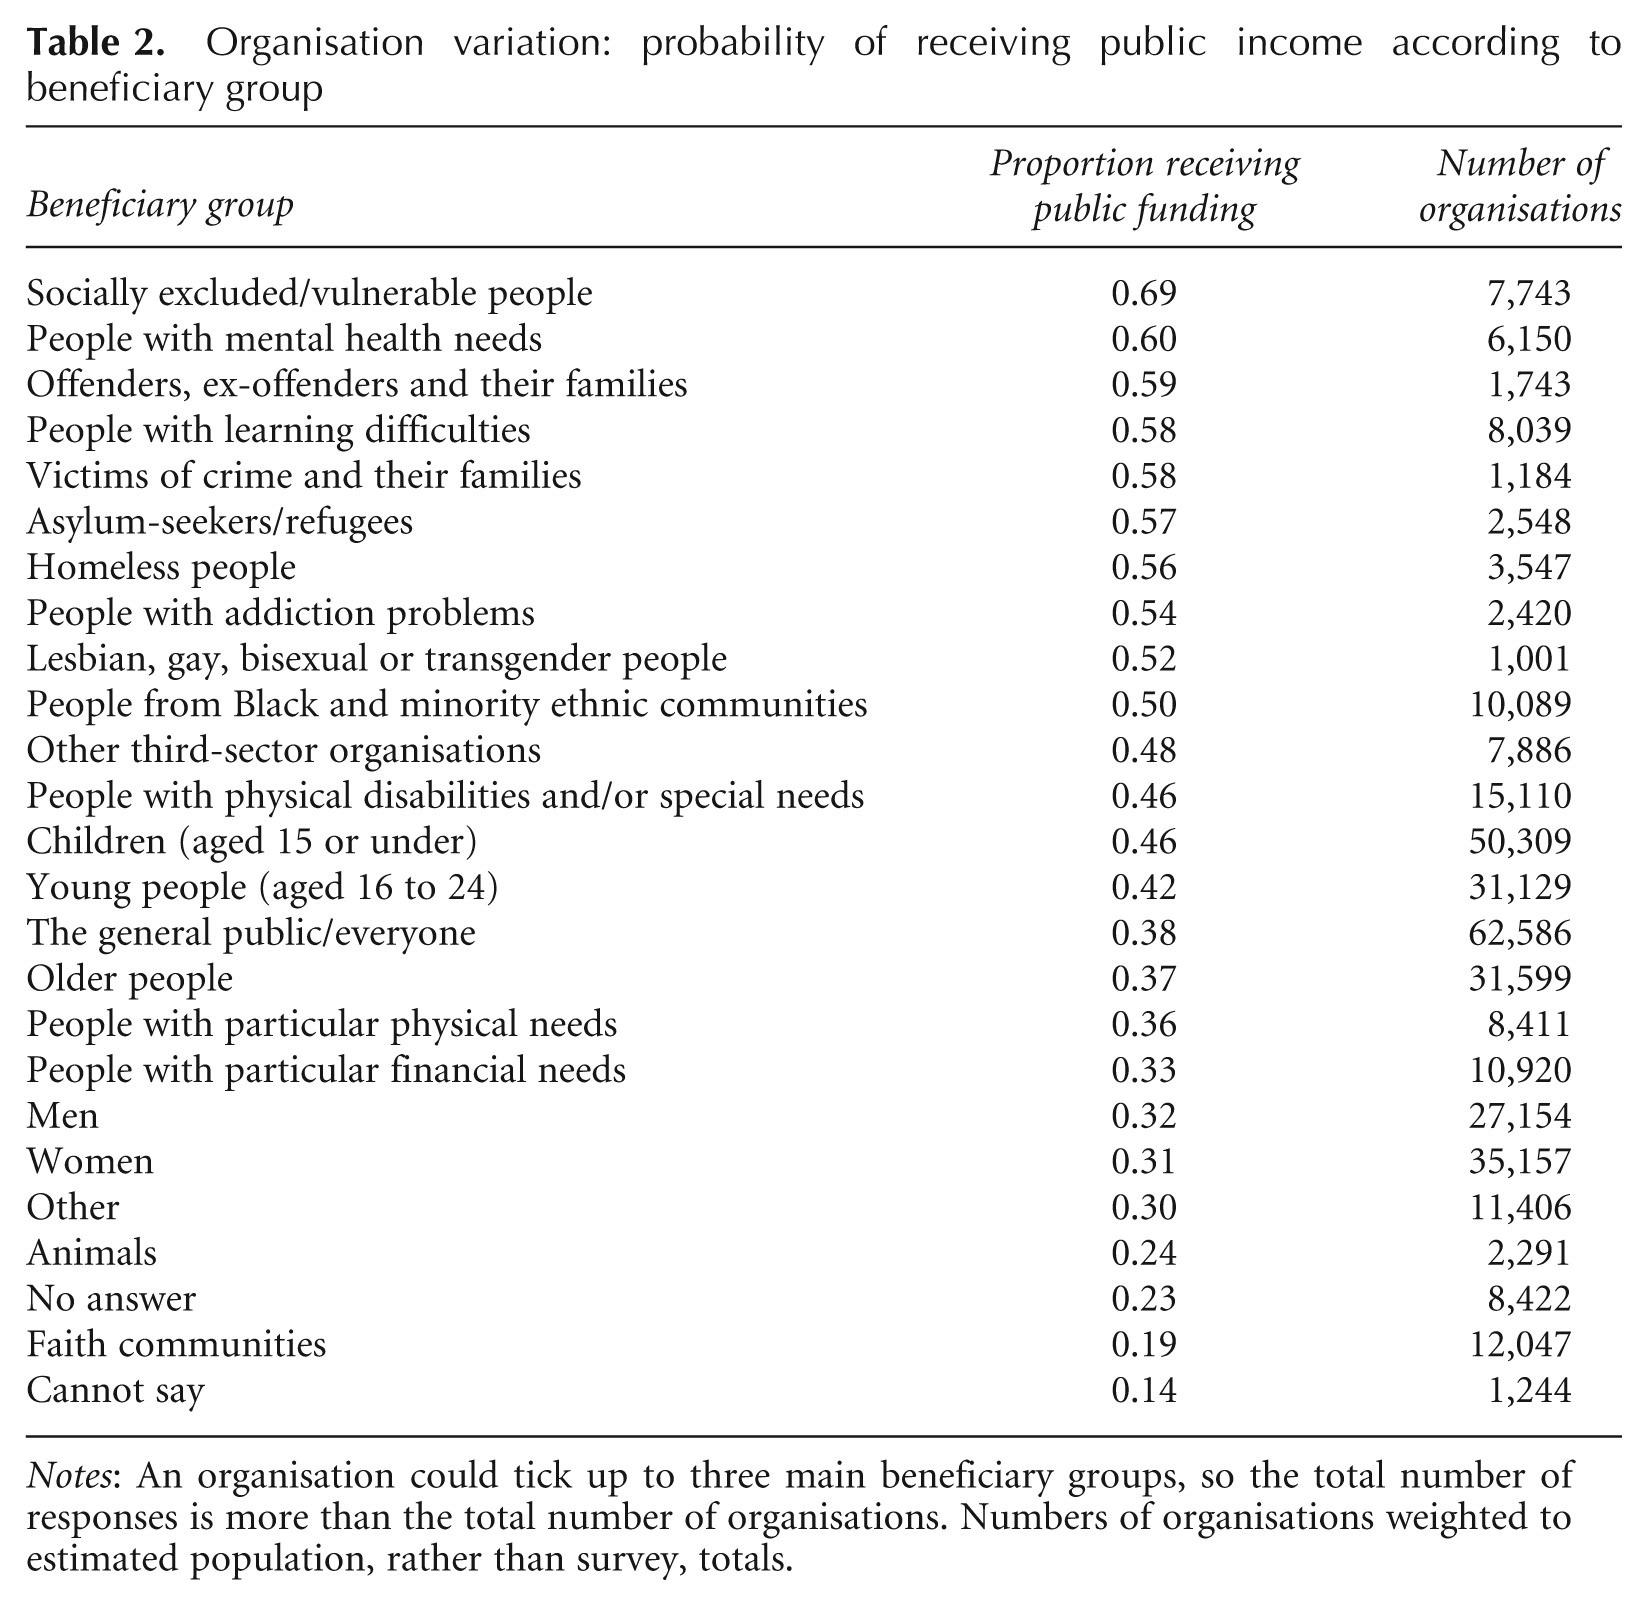
Notes: An organisation could tick up to three main beneficiary groups, so the total number of responses is more than the total number of organisations. Numbers of organisations weighted to estimated population, rather than survey, totals.
Larger organisations, as measured by total income, are more likely to receive income from government. We find that there is a consistent increase in the probability with increased size: 16 per cent of those with income of c. £1000 receive public income; 28 per cent of those with income c. £10 000; 49 per cent of those with income c. £100 000; and more than 60 per cent of those with income of £1 million or over. Aside from the circularity that organisations with more income are more likely to have a wider range of income sources, this is consistent with literature predicting that smaller organisations often lack the desire, capacity and skills to enter into a formal relationship with the state (Lewis, 1993; Charlesworth et al., 1996).
4.2 Variation between Places
Third-sector organisations working in deprived areas are much more likely to be in receipt of public income. 3 This is true both at the neighbourhood and local authority level. For organisations working at a neighbourhood scale, those located within deprived LSOAs (i.e. in the lowest per centiles of the deprivation distribution) are more likely to be in receipt of public funds than those located within less deprived LSOAs (Figure 1, left). For organisations working at a local authority scale, those working within more deprived local authorities are more likely to be in receipt of public funds than those located in less deprived local authorities (Figure 1, right).

Area variation: probability of receiving public income. Left: organisations working at the neighbourhood level, by percentiles of area deprivation at LSOA level; right: organisations working at the local authority level, by percentiles of area deprivation at the local authority level. Note: spikes represent 95 per cent confidence intervals.
These results are consistent with expectations based on the theory of voluntary-sector failure. Salamon (1987, p. 40) argues that philanthropic insufficiency is a failure of the voluntary sector in general, but that it is manifested particularly in certain areas “since the resources are frequently not available where the problems are most severe”. Since resource insufficiency is most marked in deprived areas, this is where there is the highest share of organisations relying on some public income. However, before making firmer conclusions about the implications of differences in the share of publicly funded organisations between places, it is important to check the extent to which they reflect compositional differences between places in the profile of organisations.
4.3 Inter-relationships between Organisation and Place-level Effects
We begin by examining the clear compositional differences between areas in terms of the mix of organisations present within them. Given the variety of different beneficiary groups that organisations serve, we developed a mutually exclusive three-fold classification of organisations based on Billis and Glennerster’s (1998) framework: those organisations serving the personally or socially disadvantaged; those serving the financially disadvantaged, but not the personally or socially disadvantaged; and other organisations. For clarity, Table 3 lists the detailed beneficiary categories within the NSTSO included within the more general three-way classification. It also includes information on what proportion of organisations serving a particular beneficiary group operate at the neighbourhood or local authority scale.
Classification into three beneficiary groups, showing sub-categories of personal/social disadvantage

Note: Numbers of organisations weighted to estimated population, rather than survey, totals.
As expected, in more deprived areas a higher proportion of organisations serve those at social/personal disadvantage than in less deprived areas. Also, in more deprived areas a higher proportion are large in size (more than £100 000 in annual income). These compositional differences are evident both at the neighbourhood level and at the local authority level. 4 Since we have seen that organisations serving the socially/personally disadvantaged, and larger organisations, are more likely to receive public income, this would suggest that differences in the share of publicly funded organisations between areas (Figure 1) are, at least in part, a reflection of differences in the kinds of organisations within them.
Over and above this compositional influence, is there also evidence for a place-level effect on the probability of receiving public income—and does this effect vary according to the kind of organisation? We present the results from two logistic regression models for different sub-populations of organisations: model (a), for organisations working at the neighbourhood scale (exploring the relationship with local deprivation at the LSOA level); and model (b), for organisations working at the local authority scale (using the local authority deprivation measure). For each model, we considered the same candidate explanatory variables: at the organisation level, beneficiaries (three-fold classification), income, and form (charity/non-charitable company/industrial and provident society); at the area level, level of multiple deprivation and the urban/rural local authority classification. Since the substantive interest is in the interrelationship between organisation and place effects, we tested for the significance of all possible two-way interactions between each of our three organisation-level variables and level of deprivation. Specific details of the final models are provided in a note. 5
At the neighbourhood level (model (a)), all two-way interactions between area level of deprivation and the three organisation-level variables were significant. Therefore, whether we interpret the remaining variation between areas—after adjusting for differences in organisational form, beneficiaries and income—as a reflection of unobserved differences at the organisational level or as a ‘place’ effect, it is unhelpful to consider this variation independently of organisation characteristics. The effect of being in a deprived area on the probability of receiving public income varies for different kinds of organisations (the third scenario in our analytical framework). Here, we focus on presenting results for the interaction between level of deprivation and the beneficiaries of the organisation. We use our logistic regression model to calculate marginal predicted probabilities, averaged over organisations in the sample, for each of the three beneficiary groupings across various per centiles of the LSOA deprivation distribution (deciles, plus the 1st and 99th per centiles). As Figure 2 shows, neighbourhood organisations serving different beneficiaries have different relationships with area level of deprivation. In less deprived areas, organisations serving the personally or socially disadvantaged have a similar probability of receiving funding to those organisations not serving those client groups (‘other’ organisations); in more deprived areas, they have a much greater probability of receiving public funds. In less deprived areas, organisations serving those at financial disadvantage (but not social or personal disadvantage) have a very low probability of receiving public funds; in more deprived areas, they have a much higher probability. In other words, not only is there evidence for an organisational effect, and a ‘place’ effect associated with deprivation (or unobserved heterogeneity at the organisation level), but also the effect of area deprivation is compounded for those organisations serving the disadvantaged.
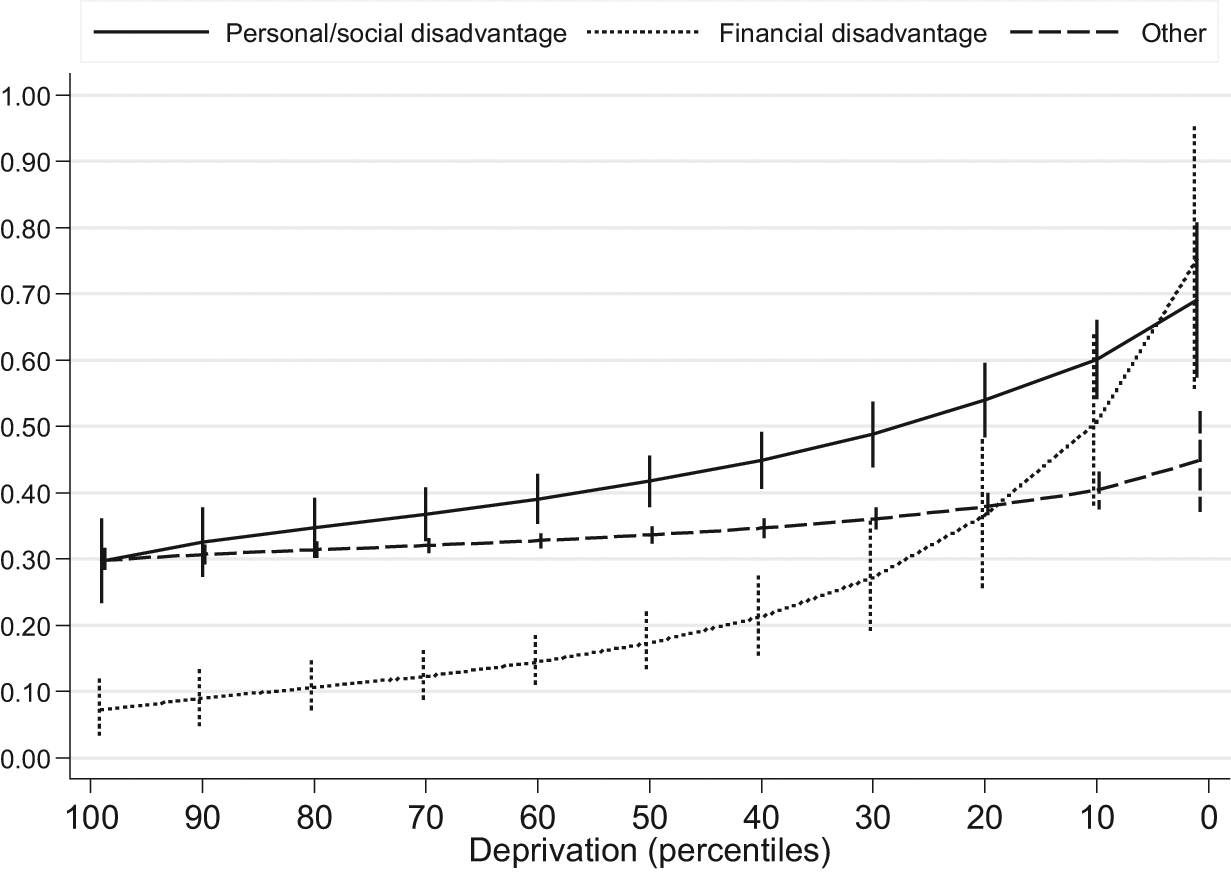
Interaction effects: predicted probabilities of receiving public income for organisations working at the neighbourhood level, by beneficiary group and across percentiles of area deprivation (LSOA level). Note: spikes represent 95 per cent confidence intervals.
These results at the neighbourhood scale are consistent with predictions based on the theory of comparative advantage. Billis and Glennerster (1998) argue that voluntary organisations serving the financially disadvantaged are unlikely to have a comparative advantage over state delivery agencies unless this financial need is combined with personal, societal or community disadvantage. Indeed, the results presented here show that, for organisations serving the financially, but not the personally or socially disadvantaged, it is only in the deprived areas—where financial need is compounded by community disadvantage—that there is a particular tendency for government to fund voluntary organisations. The results are also consistent with predictions based on the theory of voluntary-sector failure: even after adjusting for differences between places in the income, form and beneficiary groups of organisations, more deprived areas tend to have a higher share of publicly funded organisations. Further, the results suggest that it is when the theory of comparative advantage is combined with the theory of voluntary-sector failure that we have particular explanatory power: when voluntary organisations are working with certain disadvantaged groups, and where philanthropic insufficiency is most marked, organisations are particularly likely to receive public funds.
Model (b) considers those organisations operating at the local authority level. Here, while there was a significant interaction between local authority area deprivation and organisational income and form, there was no evidence that the effect of being in a deprived local authority varies according to organisation beneficiaries. Figure 3 presents the marginal predicted probabilities. There is evidence for an organisation-level effect: those serving the personally/socially disadvantaged have the highest probability of receiving public funding. There is also evidence for a small ‘place’ effect, but much smaller than the effect that is found when we do not account for differences between local authorities in the beneficiary groups, income and form of organisations. In other words, organisations working at the local authority level are more likely to receive public funding if they are located in more deprived local authorities (Figure 1, right) – and this largely reflects the profile of organisations located within these areas. When we compare across similar kinds of organisations (Figure 3), there is not much difference in the probability of receiving public income according to deprivation.
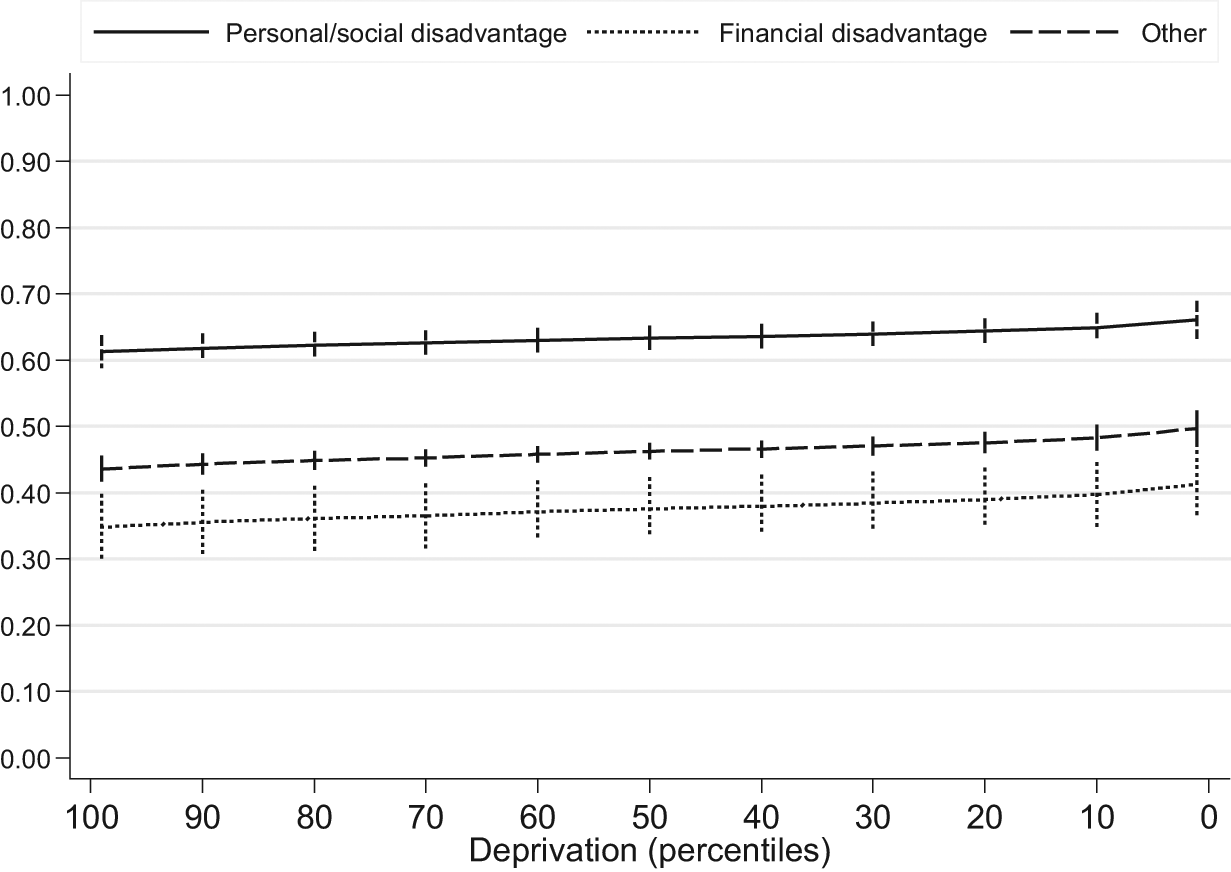
Predicted probabilities of receiving public income for organisations working at the local authority level, by beneficiary group and across percentiles of area deprivation (local authority level). Note: spikes represent 95 per cent confidence intervals.
4.4 Variation between Local Authorities
Finally, we consider variation in the share of publicly funded organisations between each of the different local authorities. For this stage in the analysis, we consider all those organisations nested within a particular local authority, either working at the neighbourhood or local authority scale. Figure 4 shows the clear differences between local authorities. As before, there is a clear relationship with the level of deprivation, with generally a higher share of publicly funded organisations in more deprived local authorities. Indeed, variations in the resources available to local authorities are likely to reflect levels of deprivation since a substantial proportion of funds were, at the time of this survey, derived from central government grants: under New Labour, funds were targeted to tackle area-based deprivation, in keeping with an understanding of social exclusion as being geographically concentrated (Durose and Rees, 2012).

Local authority variation: share of publicly funded organisations within each local authority, across percentiles of area deprivation (local authority level), by urban/rural status of local authority.
Given the relationship between level of deprivation and the share of publicly funded organisations, and since the most deprived local authorities are urban, it is not surprising that the local authorities with the highest proportion of organisations receiving public funds are urban areas (Figure 4). These include Liverpool, Knowsley, Halton, St Helens, Manchester and Salford in the north-west, Kingston upon Hull and Hartlepool in the north-east, Tower Hamlets and Islington in London, and Nottingham and Luton.
5. Conclusions
This analysis reveals the detail and complexity of the relationships between government and the voluntary sector. The probability of receiving public income varies according to, at the organisation level, the beneficiaries that it serves and its income and, at the place level, the level of deprivation of the neighbourhood or local authority in which the organisation is located. However, it is more complex than that. We used logistic regression to explore the relationship between these organisation and place-level effects. We found that, for neighbourhood organisations, there was evidence for an interaction effect such that the effect of being located in a deprived area was compounded for organisations serving certain disadvantaged groups. In contrast, for those organisations working specifically at the local authority scale, there was no such interaction between place and beneficiary group, and differences between local authorities in the share of publicly funded organisations largely reflected the profile of organisations within those areas. This suggests that geographical (rather than simply compositional) variations in government funding of voluntary organisations are most evident at a local scale. In turn, it is likely that this reflects awareness of, and policy responses to, the spatially concentrated nature of deprivation; it has long been recognised that small areas of deprivation can exist within relatively wealthy local authorities, but the development and refinement of appropriate social indicators has made possible a finer degree of targeting. This implies that such targeting has been relatively effective, although it is not possible, given the nature of the data in the survey, to map it precisely against the distribution of areas eligible for regeneration funding streams. However, we do find that the local authorities with the highest share of publicly funded organisations are deprived urban areas.
The results we present are relevant to theoretical work on the relationship between government and the voluntary sector. Some theories, including Weisbrod (1975) and Hansmann (1980), see the existence of the voluntary sector as a substitute for state and market failure to provide collective goods, but this does not provide a rationale for a financial relationship between the state and the voluntary sector. In contrast, Salamon’s (1987) theory of voluntary-sector failure explicitly starts from the need to accommodate and explain the reality of government funding of voluntary organisations. The NSTSO data provide the first opportunity in the UK to relate this existing theory to detailed patterns of the kinds of voluntary organisations, and kinds of places, receiving public funding.
At the organisation level, our results are consistent with predictions based on the theory of comparative advantage (Billis and Glennerster, 1998): organisations serving the socially or personally disadvantaged, who may be less well served by hierarchical public bureaucracies, are most likely to receive public funds. At the place level, we find evidence consistent with predictions based on the theory of voluntary-sector failure (Salamon, 1987): deprived areas, where resource insufficiency is most marked, have the highest share of publicly funded organisations. Interestingly, at the neighbourhood level, we find that our understanding of the empirical patterns is enhanced by combining the theory of comparative advantage with the theory of voluntary-sector failure, through interacting beneficiary and place-level effects. This makes substantive sense: if the theory of comparative advantage argues that voluntary-sector strengths complement government weaknesses, the theory of voluntary-sector failure argues that government strengths complement voluntary weaknesses—so in understanding the reasons for government funding of voluntary organisations, both are important. This also implies that relations between government and the sector cannot simply be characterised as a zero-sum game; these findings point to the interdependence of the two spheres.
The results are also relevant to recent developments in public policy and finance. In particular, they are timely, given concern about the effect of cuts in public funding on voluntary organisations. If voluntary-sector income from government were to fall at the same rate as total government spending, the sector will lose an estimated £1.2 billion a year by 2015/16, a fall of 9.4 per cent (Clark et al., 2012). Of those third-sector organisations on regulatory registers and therefore included in the NSTSO sampling frame, we estimate that around 36 per cent receive some public funding. We have also shown the extent of variation in this proportion—and understanding these variations is important. If public funding were reduced proportionately across the board, our evidence suggests that the effects on the third sector would be felt most severely in disadvantaged communities, simply because those areas already have a high proportion of organisations in receipt of public money. Yet we also know that local government expenditure will be reduced by 26 per cent over four years and that funding to local authorities will be reduced much more substantially in deprived local authorities than in the shire counties (House of Commons Library, 2011). Furthermore, various spatially targeted funding streams associated with neighbourhood renewal will be withdrawn (Durose and Rees, 2011). In other words, we would expect a compound effect: that funding reductions will particularly affect the most deprived local authorities, which are those in which the highest proportion of voluntary organisations receive public income. In terms of supporting the development of the sector, this will mean that areas where the presence of the sector is relatively weak are also those most exposed to reductions in funding.
Having said that, the precise impact will depend on decisions taken locally and there is some evidence—albeit from only a subset of local authorities—that local authorities are taking divergent approaches to supporting the voluntary sector (Compact Voice, 2011). There are some small funding opportunities on which organisations might draw, such as the Transition Fund, the Community First fund and the Big Lottery Fund’s “Big Local” programme. 6 They offer relatively small amounts of money, are allocated according to divergent criteria and in one case require matched funding. As a result, they may therefore not have the effect of channelling resources back into those areas and organisations that appear most at risk from our analysis. Welcome though these funds are, there is no guarantee that the areas in which voluntary organisations are most reliant on public funding will benefit. Unless organisations in such communities replace public funding with other income sources, this has the potential to undermine the government’s desired expansion of voluntary action in places that arguably need it most.
Footnotes
Acknowledgements
Many thanks to the anonymous referees for their thoughtful, constructive comments and suggestions. Many thanks to Peter Smith, for advice on survey non-response; to Stephen McKay, for thoughtful comments on an initial draft of the paper; and to Andrew McCulloch, for assistance in matching geographical covariate data to the NSTSO. The analysis in this paper is based on the National Survey of Third Sector Organisations (NSTSO). We acknowledge the data collectors and principal investigators: the Cabinet Office, Office of the Third Sector, who also sponsored the survey, Ipsos MORI Social Research Institute, and GuideStar UK. The data are deposited at the UK Data Archive. The original data creators, depositors or copyright holders, the funders of the Data Collections and the UK Data Archive bear no responsibility for their further analysis or interpretation. Crown copyright material is reproduced with the permission of the Controller of HMSO and the Queen’s Printer for Scotland.
Notes
Funding
This research is part of the programme of research at the Third Sector Research Centre, funded by the Economic and Social Research Council, the Office for Civil Society and the Barrow Cadbury Trust.