
Abstract
This paper analyses the ‘ripple’ effect of house prices in large-, medium- and small-sized houses of five major metropolitan areas of South Africa—namely, Cape Town, Durban Unicity, Greater Johannesburg, Port Elizabeth/Uitenhage and Pretoria—based on available quarterly data covering the period of 1966:Q1 to 2010:Q1. Following the extant literature, the issue is contextualised as a unit root problem, with one expecting the ratios of metropolitan house price to national house price to exhibit stationarity to an underlying trend value, if there is diffusion in house prices. Using Bayesian and non-linear unit root tests, besides the standard linear tests of stationarity with and without structural break, overwhelming support is found for the existence of robust ripple effects. Also factor analysis conducted suggested that ripple effects originate in Cape Town for the large housing segment and in Durban for the medium- and small-sized houses.
1. Introduction
This paper analyses the so-called ripple effect of house prices in five major metropolitan areas of South Africa—namely, Cape Town, Durban Unicity, Greater Johannesburg, Port Elizabeth/Uitenhage and Pretoria. In the presence of a ripple effect, house price shocks in one area are likely to have transitory or permanent implications for house prices in other metropolitan areas (Pollakowski and Ray, 1997). Following Meen (1999) and more recently Canarella et al. (2010), we formulate the presence of a ripple effect as a unit root problem. In other words, we consider the time-series properties of each of the five metropolitan house prices relative to the national house price in South Africa, based on available quarterly data covering the period of 1966:Q1 to 2010:Q1, with one expecting the ratios to exhibit stationarity or mean reversion to an underlying trend value, if there is diffusion in house prices. If the ratio of metropolitan house prices to the national house price is stationary, they eventually reach a steady path driven by a common process. Besides analysing if a ripple effect exists in the South African housing market, we also try and detect as to where this effect originates from, based on factor analysis.
The motivation for the analysis emanates not only due to the lack of any studies analysing the ripple effect in the South African housing market, but more generally, because of the importance of analysing the behaviour of regional house prices due to boom and bust cycles undergone by many local housing markets across the world (Canarella et al., 2010), including South Africa (see for example, Gupta and Das, 2008; Das et al., 2011; Gupta et al., 2010; Balcilar et al., 2011). Moreover, with most analysts attributing the recent world-wide financial crisis to the collapse of house prices, the need for careful investigation of the time-series properties of house prices, to check if a house price shock in one metropolitan area ripples over to other areas and the economy as a whole, cannot be underestimated. This is of crucial importance, since, if a regional shock gets transmitted to all regions, there exist implications for the entire economy. Theory suggests that the impact of house prices on the aggregate economy comes through several channels. For instance, as indicated by Case et al. (2005), Benjamin et al. (2004), Campbell and Cocco (2007), and Carroll et al. (2006), changes in house prices affect aggregate consumption and saving. Further, house-price adjustments have implications for risk-sharing and asset pricing (Lustig and van Nieuwerburgh, 2005; Piazzesi et al., 2007) and also distributional effects in heterogeneous-agent economies (Bajari et al., 2005). Das et al. (2011) point out that housing accounts for a major proportion of housing assets and wealth, with the numbers standing at 29.40 per cent and 21.68 per cent respectively. More importantly, they show that there exists significant spillover from the housing market onto aggregate consumption. With South Africa being an inflation targeting country, 1 the wealth effect following a house price increase or decrease is likely to be inflationary or deflationary due to higher or lower aggregate demand. In light of this, it is important to find out if a house price shock in one region is likely to ripple to the entire economy, since it is likely to result in inflationary or deflationary pressures. If a ripple effect exists, identifying where the ripple effect originates from is also of paramount importance, since a house price change in that specific region, if identified, would allow the government to react much earlier to curb inflationary or deflationary effects from spreading to the entire economy. Although the relationships are weak, house prices also affect labour mobility as well as migration. 2 Finally, as far as the ability to predict house prices in a specific region of South Africa is concerned, it is likely to improve if we consider the significant effect of other regional house prices (see Gupta and Das, 2008, in this regard). And given that house prices have been shown to be a leading indicator of economic activity and inflation in South Africa by Gupta and Hartley (2011), the importance of designing appropriate models of house price forecasting, incorporating a spatial dimension, cannot be understated.
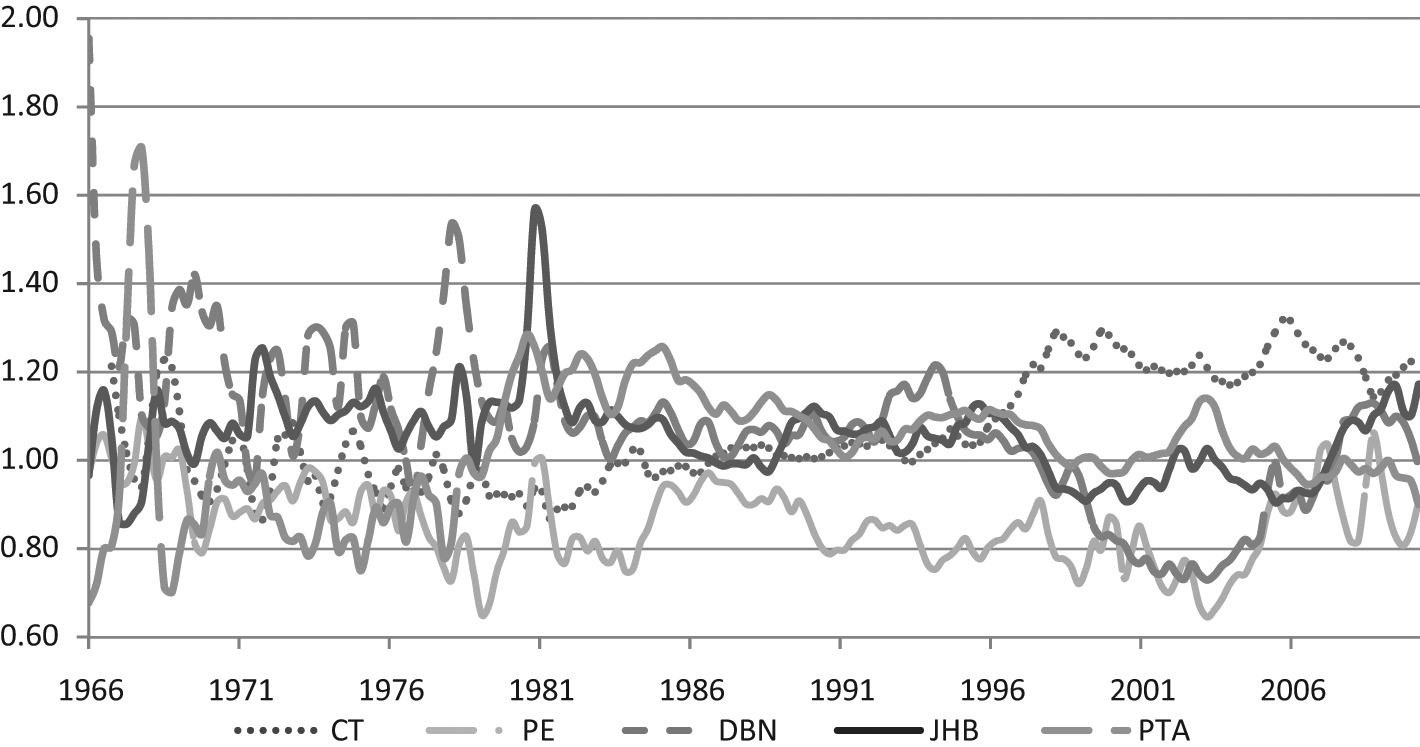
Against this backdrop, this paper is the first to provide a comprehensive analysis of the existence or non-existence of ripple effects in the South African housing market based on standard linear parametric tests of stationarity, with and without structural breaks, Bayesian and parametric non-linear unit root tests. Lee et al. (2006) indicate that empirical verification of theories, in general, is sensitive to structural change in the data. While, Burger and van Rensburg (2008) and Das et al. (2010) highlight the importance of recognising the possibility of structural breaks in South African regional house prices. Casual observation of the regional house price ratios reported in Figures 1–3 tends to suggest one structural break.3,4 In this regard, note that, while the Bayesian approach to unit root testing provides a more reasonable summary of sample information than the conventional parametric unit root approach, the unit root tests accounting for structural breaks allow one to detect structural change in the variable under consideration that results in a shift in the mean, or in the growth rate or both, whereby determining whether the series is a trend-stationary process with a one time break occurring at an unknown point in time. The non-linear approach, on the other hand, helps one to account for possible structural breaks or regime switches in the variable under consideration, without making any assumptions regarding the number of structural breaks. Non-linear models do not assume exogenous breaks occurring at known dates; rather, they are capable of generating intrinsic breaks by allowing the process to switch from one regime to others via its dynamics. They also fit well to frequent outliers in the data rather than assuming these as the result of extreme events (see Granger and Teräsvirta, 1993). Note, over and above accounting for structural changes, the non-linear unit root tests allow shift in the autoregressive parameters—that is, the dynamics of the model also change, since the persistence is allowed to change as well. Moreover, Balcilar et al. (2011) have highlighted that prices of the five segments of the South African housing market are characterised by non-linearity. Given this, it is well known that linear unit root tests have low power and lead to wrong conclusions regarding stationarity at times. Due to the lack of robustness of the linear unit root tests in the presence of structural breaks and regime-switching in the data-generating process, the importance of linear unit root tests with structural breaks and non-linear unit root tests needs to be considered explicitly while testing for the ripple effect.
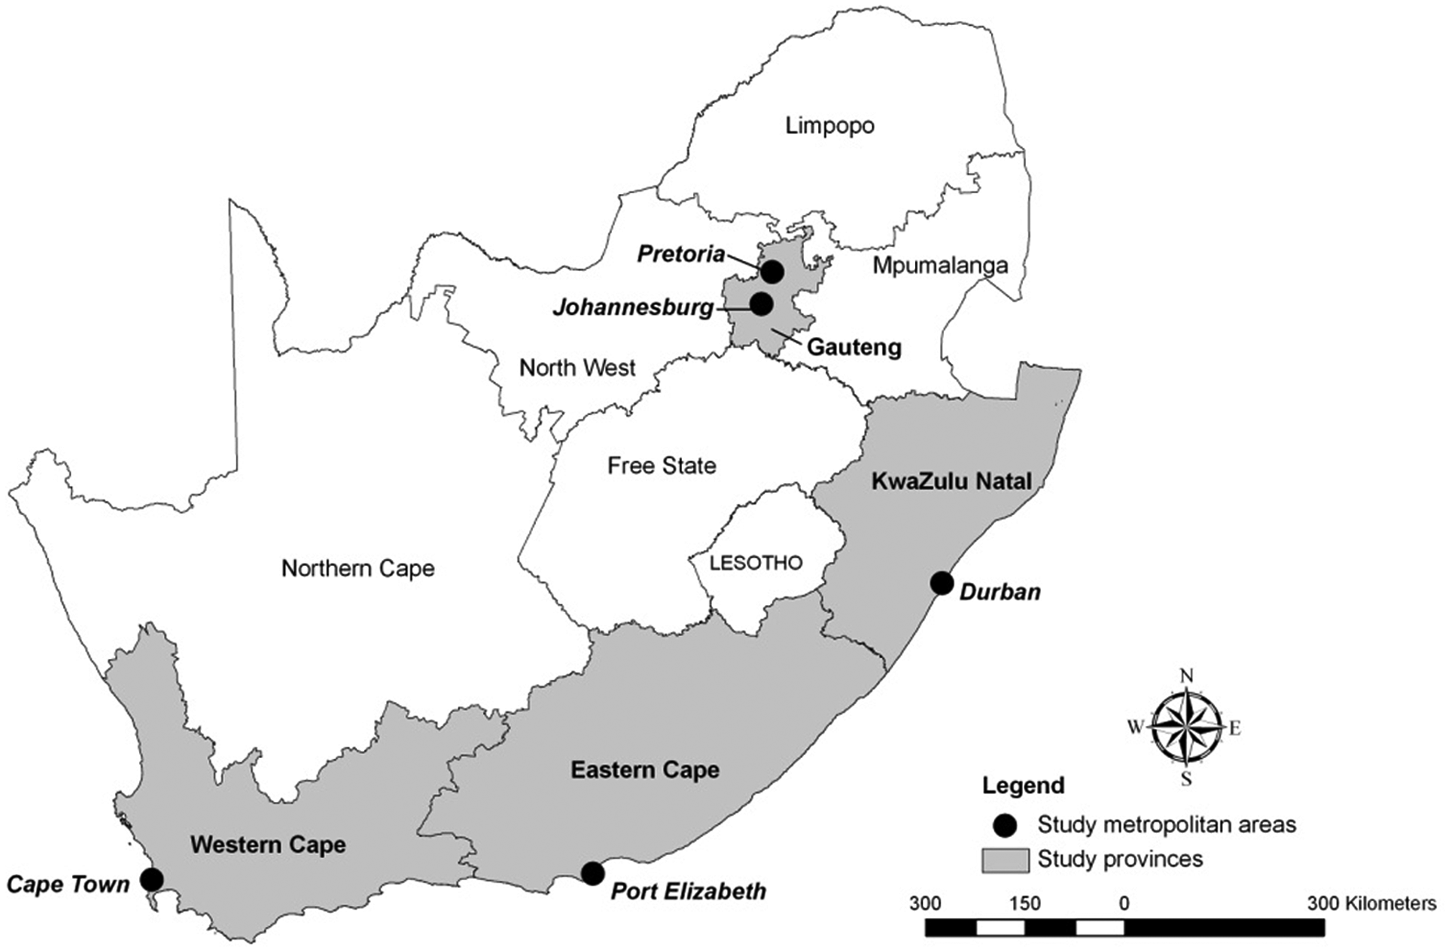
Provincial map of South Africa. Source: Council for Scientific and Industrial Research (CSIR), Pretoria.
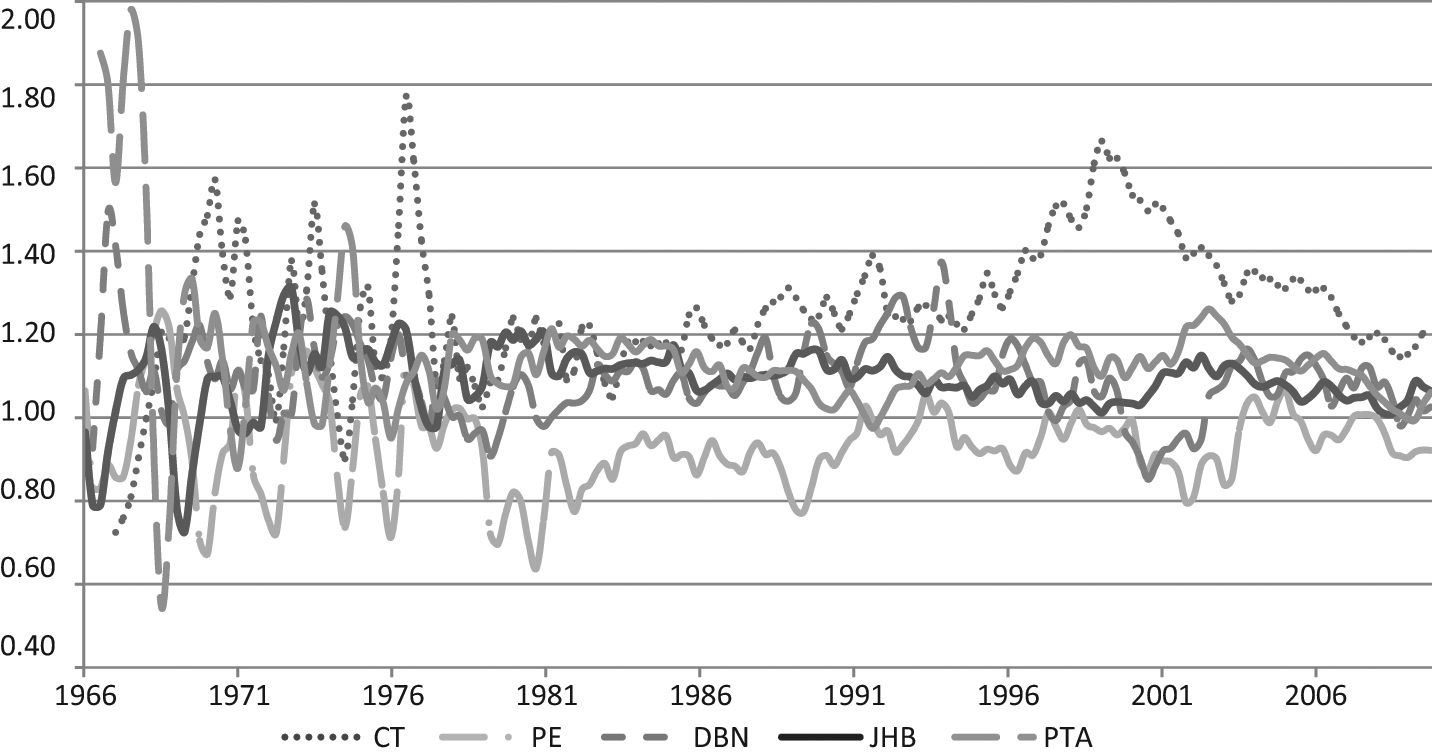
House price ratios for the large middle-segment in the five metropolitan areas.
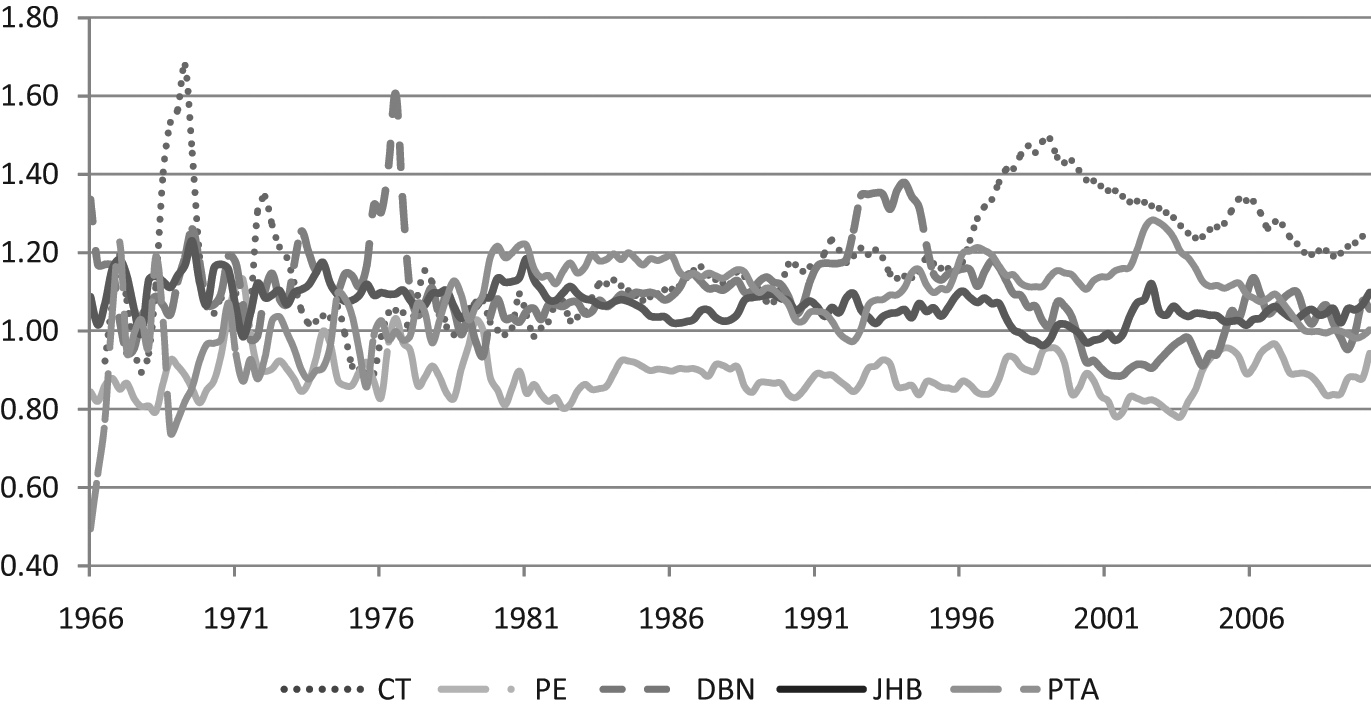
House price ratios for the medium middle-segment in the five metropolitan areas.
The remainder of the paper is organised as follows: Section 2 presents a literature review of international studies dealing with the ripple effect, while section 3 outlines the basics of the various unit root tests. Section 4 discusses the similarities and dissimilarities of the five major metropolitan areas considered, the structure of the housing market in South Africa, besides the data used for the analysis. Section 5 presents the empirical results relating to the existence or non-existence of the ripple effect and also provides evidence regarding the metropolitan areas that could be driving this effect. Finally, section 6 concludes.
2. Literature Review
The literature on ripple effects in house prices is quite extensive, to say the least. 5 UK housing experts identified a ‘ripple effect’ of house prices that begins in the south-east UK and proceeds towards the north-west. Using the ADF unit root test, Meen (1999) failed to find significant evidence of stationarity in the house-price ratios for the UK. However, Cook (2003) detected overwhelming convergence in a number of regions in the UK, using an asymmetric unit root test. Further, Cook (2005) detected stationarity by jointly applying the DF-GLS test (Elliott et al., 1996) and the Kwaitkowski–Phillips–Schmidt–Shin (KPSS) stationarity test (Kwiatkowski et al., 1992). Although early evidence (Tirtiroglu, 1992; Clapp and Tirtiroglu, 1994) for the US economy provided little support for the existence of the ripple effect, recent studies by Pollakowski and Ray (1997), Meen (2002), Gupta and Miller (2012a, 2012b) and Canarella et al. (2010) tend to show the existence of the ripple effect, not only in census, but also metropolitan regions in the US.
Other than in the UK and the US, Berg’s (2002) test indicates that the real price change of the second-hand housing market in the Stockholm area has a ripple effect on six other areas. Oikarinen’s (2005) results show that housing price changes diffuse first from the Helsinki metropolitan area to the regional centres and then to the peripheral areas. Luo et al. (2007) detected the existence of ripple effects in eight capital cities of Australian states based on tests of stationarity and cointegration. Using data on 20 districts of Paris, Roehner (1999) finds that the housing price diffusion originates from the wealthy districts of the south-west and then moves northwards and eastwards to medium-priced districts, then finally reaching the cheapest districts. Quite a bit of evidence for the ripple effect is found for Chinese cities. For example, Hong et al. (2007) and Wang et al. (2008) provide evidence of the existence of ripple effects in 5 and 35 cities respectively across China based on cointegration and panel data techniques. While Huang, Zhou and Li (2010) use cointegration tests, error correction models, impulse response analysis and variance decomposition to find evidence of the ripple effect in nine Chinese cities. Huang, Li and Li (2010) extend the evidence to 19 Chinese cities using a two-stage procedure of non-parametric testing and business cycle dating techniques. In addition Li et al. (2010) indicated the existence of a ripple effect within the urban regions of Wuhan. For Taiwan, Chien (2010) could not reject the existence of the ripple effect in regional house prices based on the endogenous two-structural-break test developed by Lumsdaine and Papell (1997) and Lee and Straizicich (2003). More recently though, Lee and Chien (2011) use the seemingly unrelated regressions augmented Dickey–Fuller (SURADF) test developed by Breuer et al. (2002) to illustrate that Taiwan’s regional house prices are a mixture of stationary and non-stationary processes, showing that the stationarity properties of these prices are dependent on the structure and properties of the various regions. Clearly, the literature on ripple effects is quite large, but to the best of our knowledge this is the first attempt to analyse the existence and the nature of the same in South Africa.
3. Alternative Unit Root Tests
In detecting ripple effects in the house price of the five major metropolitan areas of South Africa, we analyse whether or not the ratios of the metropolitan house prices to the national house price are stationary. In this regard, to test for the existence of a ripple effect, we employ a Bayesian, a non-linear and a host of linear unit root tests, the basics of which we outline next.
3.1 Linear Unit Root Tests
It is widely agreed that conventional unit root tests such as the augmented Dickey–Fuller (1981) (ADF) and the Phillips–Perron (1988) (PP) tests have low power. Therefore, this paper uses other efficient and robust procedures for testing the null hypothesis that each series contains a unit root. These include the Dickey–Fuller test with generalised least squares detrending (DF-GLS); the Kwiatkowski, Phillips, Schmidt and Shin (KPSS) (1992) test; the Elliot, Rothenberg and Stock (ERS) (1996) point optimal test; the Ng–Perron (2001) modified versions of the PP (NP-MZt) test; and the ERS point optimal (NP-MPT) test. Since these tests have been widely used in various applications of detecting stationarity, the mathematical details of these tests have been suppressed to avoid unnecessary lengthening of the paper. Conventional unit root tests, which assume structural stability and linear adjustment, can interpret departures from linearity and structural instabilities as permanent stochastic disturbances. We control for two sources of non-linearities in the dynamics of the relative house prices when applying unit root tests. First, non-linearities can exist in the form of threshold effects, whereby the relative price dynamics follow a non-stationary process at some threshold, but follow a stationary process outside the threshold (Teräsvirta, 1994). Kapetanios et al. (2003) propose a non-linear unit root test, which permits a stable dynamic process with an inherently non-linear adjustment caused by market frictions and transaction costs, and show that the non-linear test proves more powerful than the standard unit root tests. Secondly, non-linearities can also exist when the economic series suffer from structural changes. Perron (1989) showed that the power to reject a unit root decreases when the stationary alternative is true and a structural break is ignored. Given this, we consider the Zivot and Andrews (1992) unit root tests with endogenously determined one structural break and non-linear unit root tests.
3.2 Linear Unit Root Test with Endogenous One Structural Break
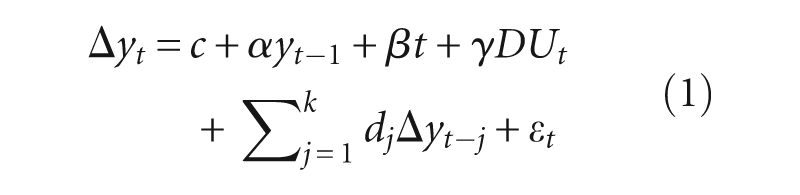
As already indicated, the conventional unit root tests fail to allow for the possibility of a structural break. Perron (1989) therefore developed an approach that incorporated an exogenous structural break in the model and then tested for the presence of a unit root. However, Zivot and Andrews (1992) argued that selection of the structural break a priori could lead to an over-rejection of the unit root hypothesis. Therefore, Zivot and Andrews (ZA) developed a variation of Perron’s (1989) original test and they assumed that the exact time of the break point is unknown. They used the following regression equations to test a unit root hypothesis against the alternative of a one-time structural break

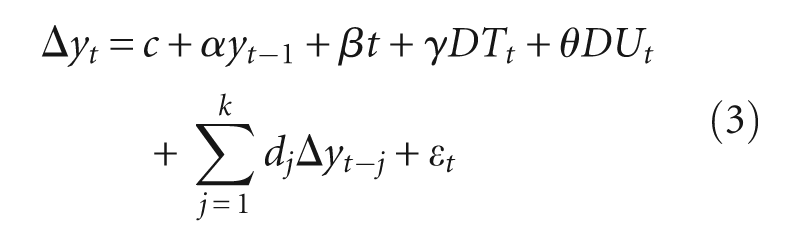
where,
Therefore


Equation (1) presents model A, which allows for a one-time change in the level of the series; equation (2) depicts model B and allows for a one-time change in the slope of the trend functions and model C is presented by equation (3) and combines one-time change in the level and the slope of the function of the series. In the literature, model A has primarily been applied, hence in this paper, we conventionally choose model A for our analysis, even though we report results from models B and C as well for the sake of completeness. The choice of model A, more importantly, is also vindicated by the behaviour of the housing price ratios depicted in Figures 1, 2 and 3, since there are no evident changes in the slope of trend functions, but mainly one-time change in the level of the series.
3.3 Bayesian Unit Root Test
Consider the simple univariate model:

Suppose we initially put a probability of
3.4 Non-linear Unit Root Tests
The parametric non-linear unit root tests used in this paper include the Kapetanios, Shin and Snell (2003) (KSS) test. In the KSS (2003) test, the null of a unit root process is tested against an alternative of a non-linear exponential smooth transition autoregressive (ESTAR) process, which is globally stationary. Consider the exponential smooth transition autoregressive model of order one, ESTAR(1)
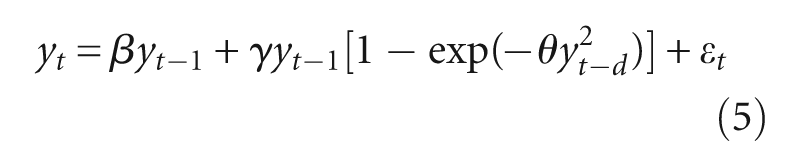
where,
Equation (5) can be reparameterised as follows

where,
Keeping with the empirical practice to date, we set

The focus is to test


Testing the null hypothesis of a unit root in equation (8) against the non-linear stationary alternative given in equation (9) is not directly feasible since

Hence the t-statistic for

where,
4. The Five Metropolitan Areas, the South African Housing Market and the Data
Figure 1 presents a map of South Africa indicating the five major metropolitan areas considered in this paper. Johannesburg, Pretoria, Cape Town, Durban and Port Elizabeth have common attributes in the sense that all of them have strong manufacturing, tourism, transport, finance and government sectors, allowing for job creation in a variety of skill types. 6 Johannesburg, Pretoria, Cape Town, Durban and Port Elizabeth are South Africa’s largest metropolitan cities, with their population having increased over the past 15 years on average between 26 per cent and 32 per cent for all the cities except Port Elizabeth, which had only an increase of 7.7 per cent. The population estimates of the cities, based on last available estimates in 2007, stand at: 3 888 180, 2 345 908, 3 497 097, 3 468 086 and 1 050 930 for Johannesburg, Pretoria, Cape Town, Durban and Port Elizabeth respectively. All the cities also contribute significantly to the gross domestic product of South Africa, with Johannesburg contributing a large proportion (14.98 per cent), followed by Cape Town (14.01 per cent), Pretoria (8.55 per cent), Durban (7.77 per cent) and Port Elizabeth (2.46 per cent). Industries in Durban have developed around manufacturing and trade (automotive, steel, plastic, food products, clothing and textiles, shipbuilding and repair); agriculture (fishing, sugar); followed by finance or business services, tourism, transport, wholesale and retail trade. Cape Town’s major sectors are manufacturing and trade (paper, textile and clothing, shipbuilding, wine); also business services which include finance, tourism and transport. Port Elizabeth is recognised for its automotive manufacturing and port and harbour facilities. In Pretoria and Johannesburg, the major sectors are services (financial, telecommunication and media, research and development); followed by manufacturing (telecom, high-tech appliances) and heavy industries (steel, iron and mining).
Therefore, the basic range of industries is quite uniform across these metropolitan areas; however, their importance varies based on their geographical locations—i.e. whether they are a port-city or not, and also their weather conditions, especially in terms of agricultural production. Pretoria and Johannesburg are quite densely populated, given that they are smaller in area compared with the other cities, but have the highest population due to them being the political and financial capitals respectively. The decision to use data for only metropolitan areas rather than a combination for both metropolitan and non-metropolitan (rural) areas, originates from this high degree of homogeneity observed in the former segment of the housing market. Further, considering only metropolitan areas also helps us to avoid issues relating to data availability and clarity regarding the area of coverage.
The average year-on-year house price inflation has consistently been around 6 per cent for the entire sample period, with it increasing sharply and staying above the average since the mid to late 1980s. Post-2000, this figure escalated to double digit numbers and reached as high as 30 per cent during 2004–06. This is due to a large number of factors: the domestic financial market liberalisation in 1985 that led to lowering/abolition of the credit constraints; the creation of democratic South Africa in 1994 which resulted in higher labour market participation for the previously disadvantaged community; and an increased and stable growth rate of over 5 per cent since 1994 due to foreign direct investment and controlled inflation in the wake of the informal inflation targeting in 1990 and the formal inflation targeting in 2000 (Kasai and Gupta, 2010; Balcilar et al., 2011; Das et al., 2011). The financial crisis which hit South Africa in 2008 and 2009, caused property prices to register negative nominal growth rates. However, recent figures stand close to an 8 per cent growth rate. 7 As far as the information on house prices is concerned, we use seasonally adjusted quarterly house price data obtained from the Allied Banks of South Africa (ABSA) 8 Housing Price Survey, for the period 1966:Q1 to 2010:Q1, covering the earliest to the most recent period of data available. The survey distinguishes between three price categories as: affordable (R430 000 and a floor area below 40–79 square metres), middle (R430 000 to R3.1 million) and luxury (R3.1 million to R11.5 million). The data are further sub-divided for the middle segment of the housing market, based on size (square meters), into small (80–140 square metres), medium (141–220 square metres) and large (221–400 square metres). We focus on the three categories of middle-segment housing since house price data for the metropolitan areas—namely Cape Town (CT), Durban Unicity (DBN), Greater Johannesburg (JHB), Port Elizabeth/Uitenhage (PE) and Pretoria (PTA)—are not available for the luxury and affordable segments of the South African housing markets. We apply different unit root tests on the regional house price ratios constructed by dividing the house price of each metropolitan area for the three middle-segments with the national house price corresponding to the appropriate middle-segment under consideration (see Figures 2–4). If the unit root is rejected, this is interpreted as evidence in favour of the ripple effect since the house prices then converge to common trend in the long run rather than drifting apart. 9
House price ratios for the small middle-segment in the five metropolitan areas.
5. Evidence of ‘Ripple’ Effects
In this section, we discuss the results from the unit root tests reported in Tables 1–4 and hence provide evidence on the (non-) existence of ‘ripple’ effects in the five major metropolitan areas of South Africa across different house-size categories. We also use factor analysis to determine which metropolitan area(s) within a specific housing category might be driving the housing market for that particular category.
Linear unit root results (large, medium and small middle-segments)

Notes:*, ** and *** denote significance levels of 10 per cent, 5 per cent and 1 per cent respectively, at which the null hypothesis of unit root is rejected for all tests barring the KPSS test. For the latter, *, ** and *** denote significance levels of 10 per cent, 5 per cent and 1 per cent respectively, at which the null hypothesis of stationarity is not rejected.
Result of the Zivot–Andrews (1992) one endogenous structural-break test
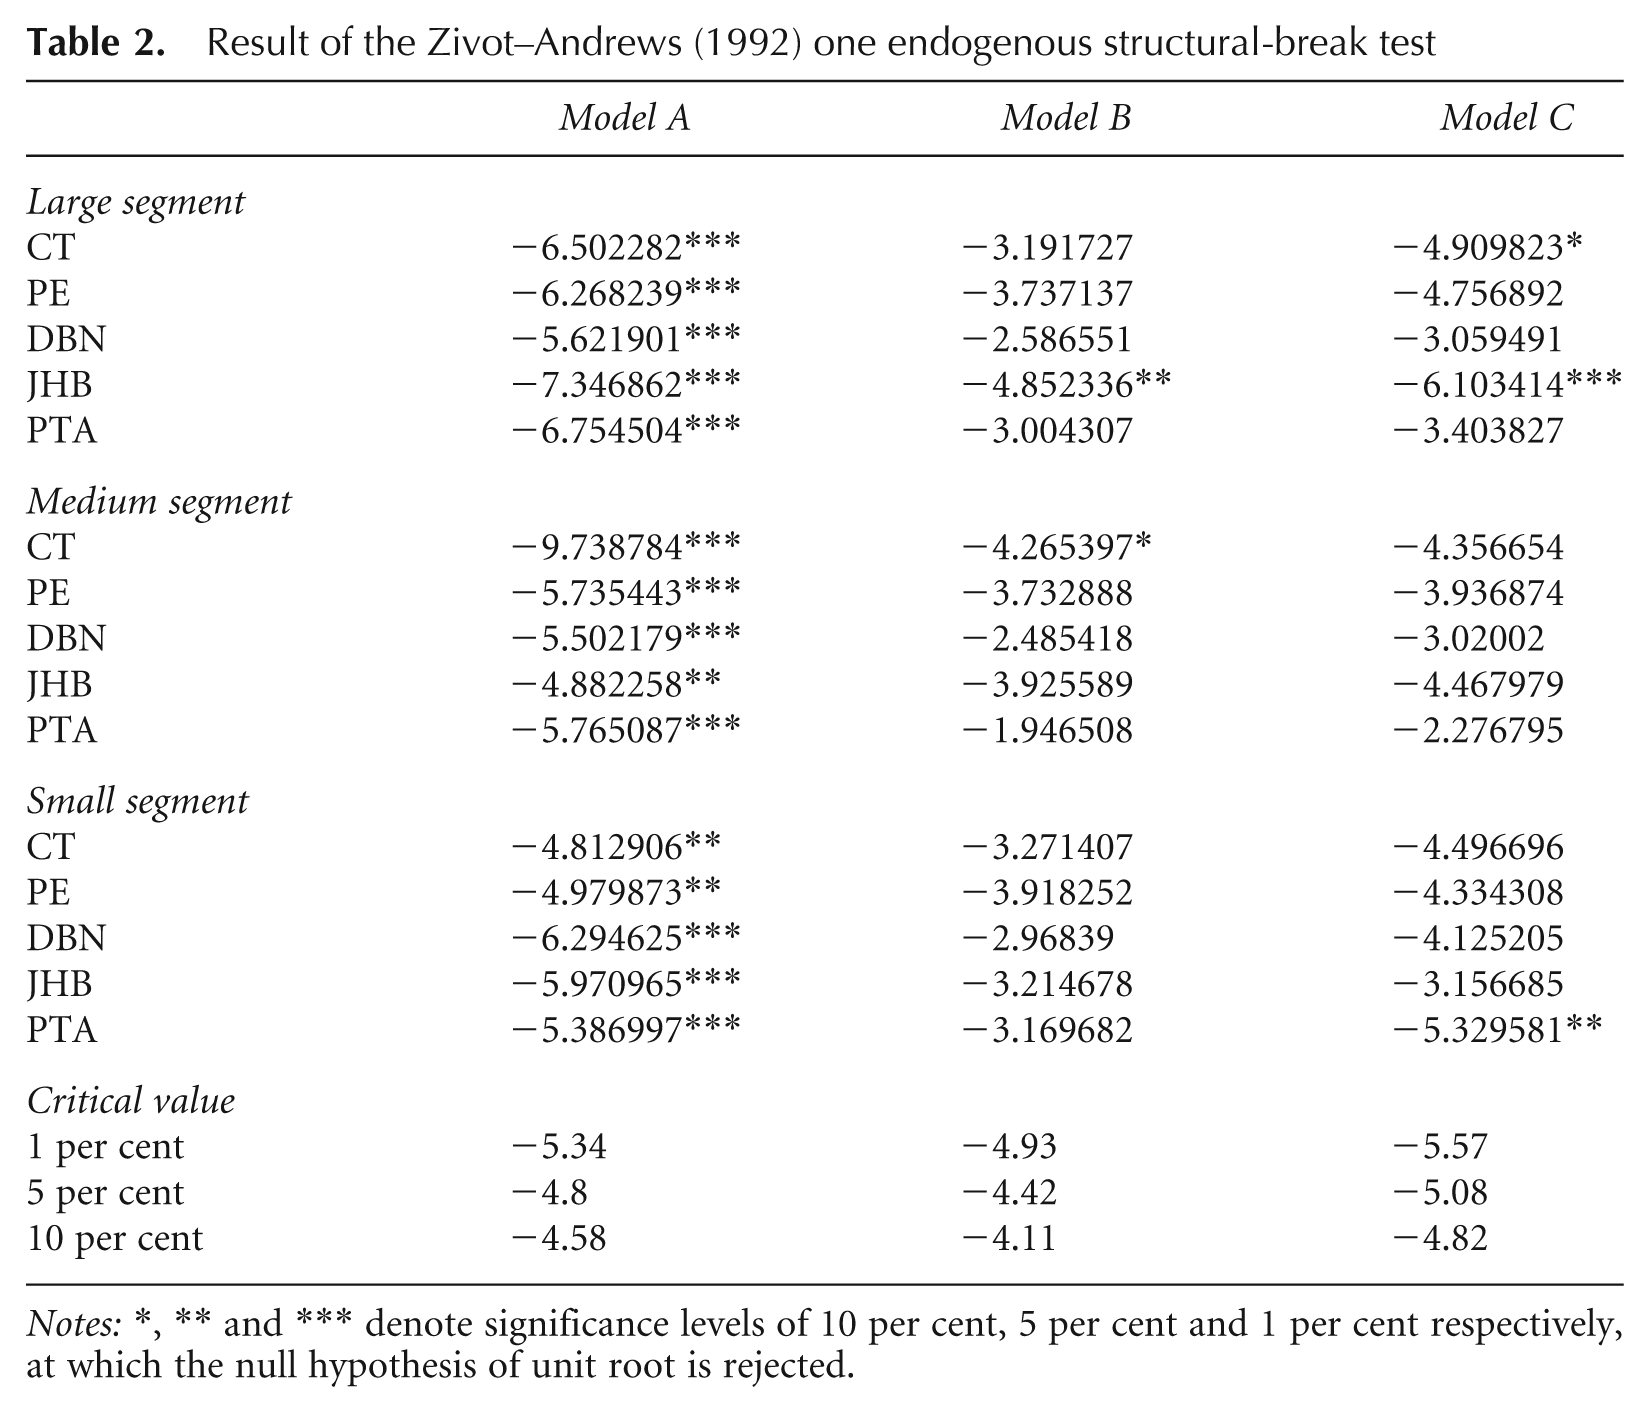
Notes:*, ** and *** denote significance levels of 10 per cent, 5 per cent and 1 per cent respectively, at which the null hypothesis of unit root is rejected.
Bayesian unit root test results

Notes: If the test statistic is greater than both the Schwarz and small sample limits, then one would reject the unit root hypothesis. However, if the test statistic lies between the Schwarz limit and the small sample limit, the test fails to reject the unit root hypothesis using a large sample approach but not the small sample limit. The value corresponding to the ‘Marginal alpha’ is the value of ‘alpha’ for which the posterior odds for and against the unit root are even. A small value indicates strong evidence against unit root in the data.
Non-linear unit root tests: Kapetanios, Shin and Snell (KSS) STAR unit root test results (with drift and with trend)
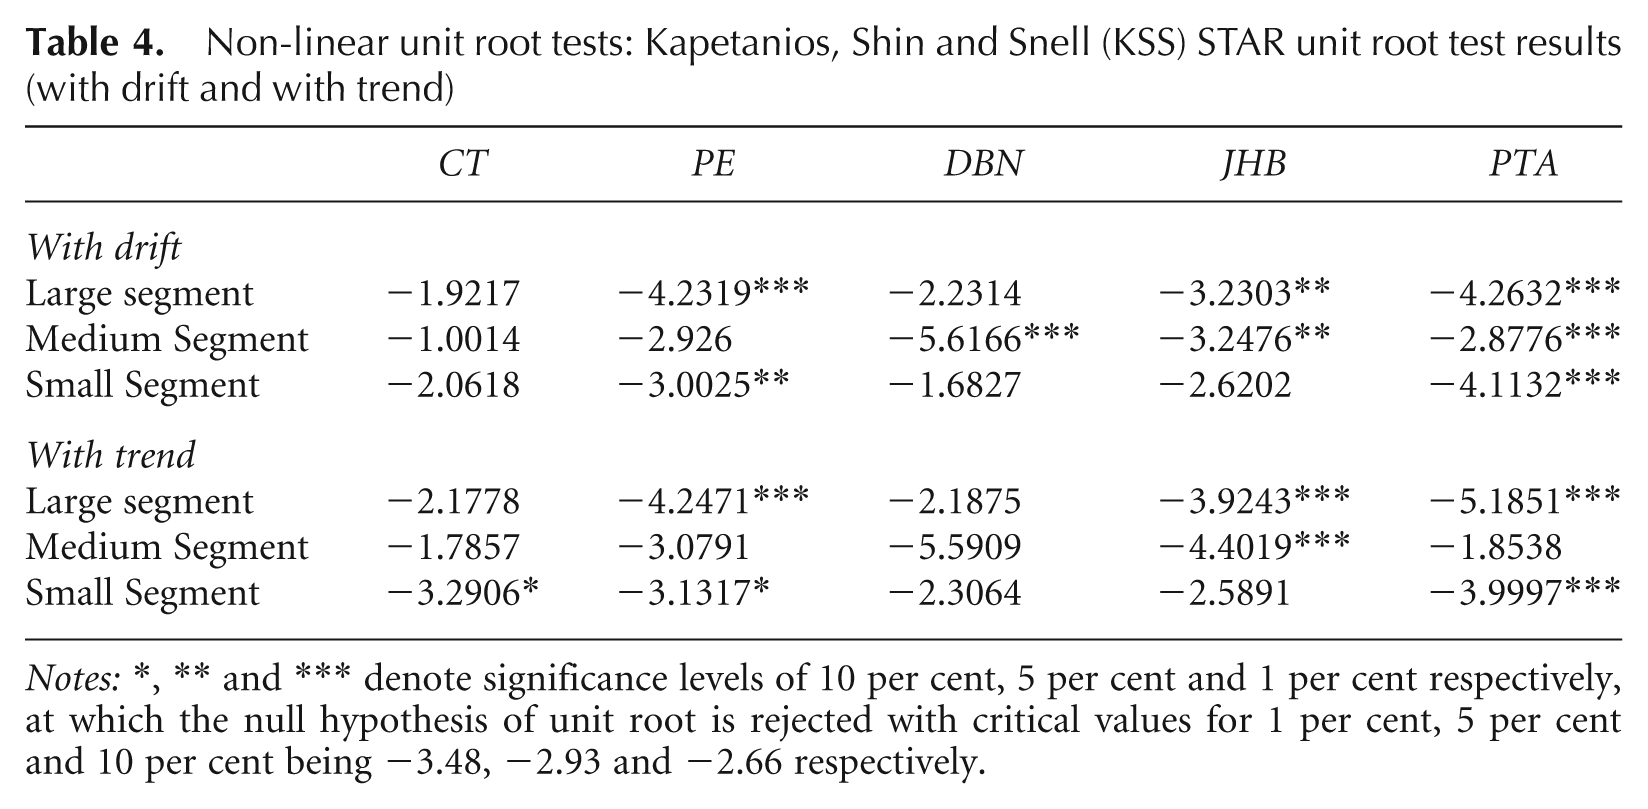
Notes:*, ** and *** denote significance levels of 10 per cent, 5 per cent and 1 per cent respectively, at which the null hypothesis of unit root is rejected with critical values for 1 per cent, 5 per cent and 10 per cent being −3.48, −2.93 and −2.66 respectively.
As can be seen from Table 1, the linear unit root tests provide ample evidence of stationarity and hence of the existence of ripple effects in all the five metropolitan areas across the three house-size categories. The null of unit root is rejected consistently by at least four of the six linear tests utilised across the three housing categories for all the five metropolitan cities. These results are overwhelmingly supported by model A (the appropriate model in our case) of the Zivot and Andrews (1992) test of one endogenous structural break reported in Table 2. 10 This implies robustness of the findings in the presence of non-linearity, when the same is characterised by structural changes. The Bayesian unit root test proposed by Sims (1988) and reported in Table 3, which provides a more reasonable summary of sample information than the conventional parametric unit root approach, also presents strong evidence of stationarity and thus of a single housing market. The evidence for a ripple effect is somewhat diluted when we consider the Kapetanios et al. (2003) test which, in turn, allows non-linearities to exist in the form of threshold effects. As reported in Table 4, house price diffusion seems to exist for three out of the five metropolitan areas each for the large (Johannesburg, Port Elizabeth and Pretoria), medium (Durban, Johannesburg and Pretoria) and small (Cape Town, Port Elizabeth and Pretoria). Since, there exists quite strong evidence of ripple effects for all the five metropolitan cities across all the three house-size categories when allowing for structural breaks, the results of the KSS test could be interpreted as follows. Although it is impossible to gauge exactly the data-generating processes for these 15 relative prices, it seems that the main form of non-linearity that exists in the relative house prices arises via structural changes, with 9 of these 15 cases also having an additional form of non-linearity due to threshold effects. 11 Overall, it will not be unfair to conclude that there exists overwhelming evidence of the presence of ripple effects in the housing markets of metropolitan areas of South Africa.
Having established the existence of a ripple effect, we now turn our attention to detecting which city could be driving or leading the ripple effect within each of the three size categories. For this purpose, we take a principal component or factor analysis approach, whereby we derive one common factor for each of the three housing-size categories and then analyse which of the five metropolitan areas within a size category best explains the movement of this specific factor. We do this by regressing the factor of a specific housing category on each of the five relative house prices for the same housing category considered individually, and then capturing the R2 value for that regression, with the idea that the specific relative house prices that produce the highest R2 value will be considered to be driving the market within that specific category. In this regard, we borrow from del Negro and Otrok (2007) and Ludvigson and Ng (2009, forthcoming). Based on the R2 values obtained from these 15 bivariate regressions, we could draw the following conclusions. In the case of the large middle-segment, we found that Cape Town had the largest R2 (0.5906), followed by Pretoria (0.4755), Port Elizabeth (0.3365), Johannesburg (0.1350) and Durban (0.0684). For the medium segment, Durban leads the pack with an R2 value of 0.4741, followed closely by Pretoria (0.4700) and Johannesburg (0.4173). Cape Town and Port Elizabeth had respective R-square values of 0.2768 and 0.1699. Finally, for the small-middle segment, as with the medium segment, Durban produces the highest R2 value of 0.7368. Cape Town and Johannesburg came in second and third with R2 values of 0.7013 and 0.5761. Pretoria was found to explain virtually nothing of the movements in the common factor with an R2 value of 0.0050, while Port Elizabeth produced a relatively better fit with an R2 value of 0.1935. The results seem to suggest that Cape Town drives the large middle-segment, with Durban being the driving force in the medium and small middle-segments. Note, as a robustness check, we carried out Granger causality tests by putting the prices of the five metropolitan areas within each category, along with the national price for that specific housing size, in a VAR model. The results, suppressed here to conserve space, but available upon request from the authors, yielded similar conclusions to the factor analysis, in the sense that Cape Town for the large middle-segment and Durban for the medium and small middle-segments were found to Granger cause the maximum number (and being Granger caused by the minimum, if any) of house prices, including the national house price within that category.
As indicated earlier, this is the first study to analyse ripple effects in the South African housing market. Hence, no prior empirical evidence exists to confirm or invalidate our results regarding where the ripple effects might be originating from. However, the results seem to make lot of sense when we account for what we have heard from private-sector housing analysts over the years regarding the propagation of shocks within the housing market. Land values in Cape Town are, in general, exceptionally high, mainly due to its brilliant geographical location resulting in stunning scenic beauty. Besides, house sizes in Cape Town also tend to be on the larger side and houses are bought and owned by not only the richer South Africans, but also by foreigners. In Durban, the importance of buying and owning a property tends to follow suit, with people in the next income category acquiring housing, due to its great beaches on the warm Indian Ocean. Hence, a shock to the aggregate economy is likely to affect the housing markets in these two cities first. Also, note that the basic area size of these two cities, and to a certain extent in Port Elizabeth, that is available for construction is limited due to their respective ocean boundaries and the fact that, being port-cities, these cities were subjected to the earliest settlements and construction carried out in the country. Hence, a demand shock in these cities, with limited posisibility of a matching increase in supply, is likely to increase house prices in these cities first, before getting transmitted to the rest of the economy. Hence these cities, unlike Pretoria and Johannesburg, have not tended to grow in area. Pretoria and Johannesburg, being the political and financial capitals respectively, have large populations that reside there due to work-related purposes mainly, rather than the idea of owning property. In light of all these factors, our results regarding Cape Town and Durban being the drivers of a house price shock do not seem to be too far-fetched.
6. Conclusion
This paper analyses the ‘ripple’ effect of house prices in five major metropolitan areas of South Africa—namely, Cape Town, Durban Unicity, Greater Johannesburg, Port Elizabeth/Uitenhage and Pretoria. Note that, if a ripple effect exists, the five metropolitan house prices relative to the national house price in South Africa, based on available quarterly data covering the period of 1966:Q1 to 2010:Q1, are expected to exhibit stationarity or mean reversion to an underlying trend value. In other words, we cast the issue as a unit root problem.
To the best of our knowledge, this is the only study that looks into the existence of ripple effects in the context of South Africa. We find overwhelming evidence of the existence of ripple effects in South Africa based on standard linear unit root tests. The results are robust to non-linearities in the form of structural breaks and threshold regimes. Further, Bayesian unit root tests, which allow for a more reasonable summary of sample information than the conventional parametric unit root approach, also confirm that South Africa—within each of the three housing-size categories—has a unified market. Finally, based on factor analysis, we identify Cape Town and Durban to be the cities that tend to drive the housing markets in South Africa—a result in line with the existing anectotal views of housing experts in the country.
Footnotes
Acknowledgements
The authors would like to thank three anonymous referees and the Editor, Professor Kenneth Gibb, for many helpful comments. Any remaining errors are, however, solely those of the authors.
Notes
Funding
This research received no specific grant from any funding agency in the public, commercial or not-for-profit sectors.