



Abstract
The community cohesion agenda in Britain has focused attention on the ethnic character of neighbourhoods and how population change affects cohesion. This paper examines the relationship between neighbourhood ethnic group population change and belonging. The paper measures population change as immigration, gross internal migration and with a categorisation of ethnic group population dynamics that combines migration and natural change. Pooled 2005 and 2007 Citizenship Survey data are analysed using multilevel logistic regression models. The paper does not find evidence for relationships between immigration or local population turnover and levels of neighbourhood belonging; nor is there evidence that ethnically differentiated population change matters. However, belonging does vary by individual’s ethnicity; and strong belonging is associated with high co-ethnic density for minorities. In addition, the overall population change of an area may be significant: highest levels of belonging were found in areas of White and Minority population growth driven by migration.
Introduction
Community building was a political priority in Britain in the first decade of the 21st century, stimulated by a perceived threat from increasing ethnic diversity (Finney and Simpson, 2009). What emerged from the combination of fears of changing ethnic geographies and place-based policy thinking were strategies of ‘community cohesion’ (Flint and Robinson, 2008). These aim for communities where diversity is valued, there is equality of opportunity, there are positive relationships between people of different backgrounds and, most pertinently for this paper, there is a common vision and sense of belonging (Laurence and Heath, 2008). In policy discourses, ethnic diversity and population change are seen as a threat to belonging and community cohesion, as demonstrated in a speech by the UK Prime Minister David Cameron at the Munich Security Conference in 2011 For too long, immigration has been too high … and it has placed real pressures on communities up and down the country. … Because real communities aren’t just collections of public service users living in the same space. Real communities are bound by common experiences … forged by friendship and conversation … knitted together by all the rituals of the neighbourhood, from the school run to the chat down the pub. And these bonds can take time. So real integration takes time. That’s why, when there have been significant numbers of new people arriving in neighbourhoods … perhaps not able to speak the same language as those living there … on occasions not really wanting or even willing to integrate … that has created a kind of discomfort and disjointedness in some neighbourhoods (David Cameron, 14 April 2011).
This paper aims to examine how ethnic diversity and, particularly, changes in the ethnic make-up of neighbourhoods, affects community cohesion, as represented by neighbourhood belonging. The analysis aims to identify what distinguishes people with a very strong sense of neighbourhood belonging from others in terms of their individual characteristics and the characteristics of the neighbourhood in which they live. The central question of this paper is: how is belonging related to neighbourhood changes in ethnic group populations? In addressing this question, the paper also considers the following: how does neighbourhood belonging vary across ethnic groups? Does neighbourhood belonging vary between neighbourhoods (beyond the differences in neighbourhood population composition)? How is belonging related to neighbourhood co-ethnic density? By addressing these questions this paper contributes to debates, which are as yet inconclusive, about the effects of population change on belonging and place attachment (Bailey et al., 2012), and extends these debates to assess whether the type of population change matters (as called for by Saggar et al., 2012) and whether ethnically differentiated population change matters.
Neighbourhood and Belonging
Neighbourhood belonging represents an emotional bond to a place which, as understood in community cohesion debates, is seen to be positive—for example, because it can result from and in local social networks and engagements which are associated with individual wellbeing and building of community identity. Understanding the meaningful relationships that people have with place(s) has been of academic interest for several decades (Relph, 1976; Altman and Low, 1992; Lewicka, 2011). Recent theorisations have asserted that belonging encompasses “moral claim making” as people “jostle with each other in their search for homes and territory” (Savage, 2010, p. 115). Savage et al. (2005) develop the concept of elective belonging, to describe how (middle-class) migrant consumers appropriate place physically and symbolically. This is contrasted with ‘nostalgia’ and ‘dwelling’ narratives of attachment and is distinguished from them along lines of choice—whether an individual has the power and resources to reconcile their needs and hopes in terms of housing and locality with their situation. Thus, belonging is political, a force for territorialised social sorting and inequality.
Two aspects of the theory of elective belonging are particularly relevant for this paper: the way in which ethnic identity (intersecting with other aspects of identity, particularly class) shapes perceptions of place; and the temporality of belonging. Phillips et al. illustrate, for Asian populations in Leeds and Bradford the continuing importance of ‘community’ spaces, which were seen to engender feelings of familiarity, security and support … and, importantly, enhance a sense of belonging (Phillips et al., 2007, p. 224).
Conversely, other neighbourhoods were seen as less safe with a greater chance of encountering racism (Phillips et al., 2007). Similarly, Devadason (2010, p. 2947) finds that “sense of belonging and cosmopolitan imaginaries are not evenly accessed by difference ethnic groups” and notes, in particular, that Bangladeshis in north London had less sense of belonging to the locality than residents of other ethnic groups.
An emphasis on elective belonging and its class distinctions questions the temporality of belonging; it challenges the idea that the forming of bonds in and to places takes time and instead asserts migrants’ powers for appropriating place. Devadason (2010) also demonstrates that, for Bangladeshis in north London, being resident in a place for a long time does not necessarily bring a strong sense of belonging.
Population Change and Neighbourhood Belonging
There are reasons to theorise that (ethnically differentiated) population change in a neighbourhood can affect the experiences of its residents and, potentially, be detrimental to belonging and cohesion. Two broad and related sets of theories can be identified: first, those whose premise is that population instability reduces place-based connections between people which decreases sense of belonging to a neighbourhood; secondly, those that propose that changes to the (ethnic) composition of the neighbourhood, which increase diversity, reduce cohesion because general preferences tend towards homophily (desire to live with ‘people like us’).
The first body of work engages with theories of social disorganisation (Sampson, 1988; Raudenbush and Sampson, 2004). The basic premise here is that disorganised communities are less socially cohesive than others, with one aspect of disorganisation being neighbourhood population stability. Where the local population experiences a lot of change, it is more difficult for neighbourhood-based social networks to be developed. Social disorganisation studies have tended to focus on (perceptions of) crime but an argument can also be made that, by reducing local ties, greater residential instability lessens neighbourhood belonging. Furthermore, if that instability results in increased ethnic diversity, the erosion of community feeling could be exacerbated; the arrival of racialised ‘others’ in a neighbourhood can be perceived to have “disrupted the cultural familiarity of place” (Watt, 2010, p. 154).
A limited number of studies in the UK have attempted to assess the relationship between local population change and attitudes towards neighbourhood and have produced somewhat differing results. Using the Citizenship Survey, Laurence and Heath (2008) found that population turnover did not have a significant effect on perceptions of community cohesion in a neighbourhood. Similarly, Saggar et al. (2012, p. 3) concluded that “immigration has no significant impact on neighbourhood cohesion”. However, Livingston et al. (2010) and Bailey et al. (2012) found that, by undermining social cohesion, high population turnover leads to lower levels of neighbourhood attachment. Interviewees in Greater Manchester associated rapidly changing ethnic mix with increased anxiety and reduced neighbourhood attachment (Livingston et al., 2010). However, in quantitative analyses, the effect of population turnover was eliminated when individuals’ perceptions of neighbourhood cohesion, trust and safety were accounted for (Bailey et al. 2012). Given the relative youth of studies specifically addressing cohesion and population change in the UK, it is difficult to determine whether the differing findings are primarily the result of the employment of different concepts and different operationalisation of those concepts—a point that Lewicka (2011) and Saggaar et al. (2012) make in relation to place attachment and cohesion literatures more generally.
A relevant aspect of the extant literature questions whether the relationship between population change and belonging varies for different types of population change and different types of neighbourhood. Laurence and Heath (2008) showed that inflows of large numbers of non-White immigrants negatively affected cohesion. This suggests that the type of local population change matters in relation to feelings of neighbourhood belonging. In addition, as already discussed, the impact of population change on belonging may be experienced differently by different ethnic groups (Phillips et al., 2007; Devadason, 2010; Bailey et al., 2012).
Bailey et al. (2012) addressed the question of whether local population change and social mix were differently associated with place attachment for deprived areas compared with other areas. They proposed that the detrimental effects of population turnover on place attachment in deprived areas would be higher than in other areas because of the expectation that new residents would be disruptive (given that their choice about where to live was severely limited). They found that attachment to neighbourhood was indeed lower in deprived neighbourhoods (theorised as a result of weaker social cohesion), but that the drivers of attachment, including turnover, were the same in deprived areas as in other areas.
A somewhat more established body of work has investigated how (ethnic) diversity of neighbourhoods affects social cohesion. Perhaps the most influential aspect of this debate has been around diversity’s relation to social capital, stimulated by the work of Putnam (2007). Putnam's study found greater ethnic diversity to be associated with less neighbourhood trust, the argument being that ethnic grouping is a social marker defining individuals’ belonging and that trust is greater within rather than between social groups. Counter-arguments have been made and questions raised about the causal pathways of the associations between social capital and diversity, such as the role of intergroup contact (for example, Letki, 2008; Hooghe et al., 2009) and whether it is deprivation rather than diversity that is having the effect (Laurence and Heath, 2008; Forrest and Kearns, 1999). In Britain, a number of studies have challenged Putnam’s thesis in relation to various social outcomes including place attachment (Bailey et al., 2012), trust in neighbours (Sturgis et al., 2011) and social cohesion (Becares et al., 2011). Some studies have demonstrated an alternative perspective, that there are positive effects of neighbourhood ethnic heterogeneity (for example, Becares et al., 2011).
Given the literature, what may be expected in relation to the questions asked by this paper? First, individuals living in neighbourhoods with high levels of population change can be expected to have lower levels of belonging than others. Secondly, this effect can be expected to be greater where ethnic diversity is greater, as indicated by high growth of minority populations or high proportions of minority residents. Thirdly, belonging can be expected to vary between neighbourhoods, beyond the effects of the population composition of the neighbourhood—for example, with respect to deprivation.
Methods
Data
The 2005 and 2007–2008 Citizenship Surveys, combined, provide the data for this paper. These data include information on demographics (e.g. age, sex, ethnicity, marital status), socioeconomic characteristics and neighbourhood experience including length of time resident in the neighbourhood. A version of the Surveys was commissioned with population dynamics variables, a deprivation indicator and a Department for Environment, Food and Rural Affairs (DEFRA) urban/rural classification attached at ward level.
The Surveys consist of a core sample and a boost sample of respondents from ethnic minority groups. The analyses in this paper used pooled data from the two years of the Survey in order to give large sample sizes for minority ethnic groups. The combined (core and boost) 2005 Citizenship Survey has 14,081 cases and the 2007-2008 Citizenship Survey has 14,095 cases. Thus, the analyses in this paper are based on a total sample of 28,000 people.
Defining the Outcome Variable: Neighbourhood Belonging
Neighbourhood belonging is measured by the following question (in both the 2005 and 2007/08 Citizenship Surveys): how strongly do you feel you belong to your immediate neighbourhood? The response options are ‘very strongly’, ‘fairly strongly’, ‘not very strongly’, ‘not at all strongly’ and ‘don’t know’. For the analysis in this paper, the variable has been recoded into a binary outcome where 1 indicates very strong feeling of neighbourhood belonging and 0 indicates all other responses except ‘don’t know’. This categorisation sets up the analysis to distinguish the individual and neighbourhood characteristics of the people in the Survey—around a third—who had the highest levels of belonging. 1
In quantitative studies, belonging, place attachment and cohesion have been operationalised in numerous ways. For example, Bailey et al. (2012) combine survey responses on belonging and enjoyment living in a neighbourhood to give a measure of place attachment; Saggar et al. (2012) use a variety of measures of neighbourhood experience, identity, belonging, civic participation and trust to examine cohesion and integration, as do Laurence and Heath (2008). Responses to one survey question on belonging are used here for clarity and simplicity, and directly to access perceptions of belonging—without normative assumptions about whether this is positively or negatively experienced—in relation to the theoretical discussions already outlined.
Defining the Independent Variables of Interest: Neighbourhood Population Change
Neighbourhood population change is operationalised in three ways in this paper: immigration, gross internal migration (turnover) and a categorisation of ethnic group population dynamics. The purpose of including three different measures of population change is: first, to enable comparison with previous studies that have considered immigration and/or internal migration; secondly, to assess whether the process of population change, be that international or internal migration or natural change (births minus deaths), has a differing relationship with belonging; and, thirdly, to examine whether the ethnic character of the population change matters in terms of the outcome of neighbourhood belonging. The three measures of local population change are all based on 2001 Census data, this being the only source of comprehensive population figures for neighbourhoods. In using these data in combination with the Citizenship Surveys of 2005 and 2007/08, we are making the assumption that the levels and drivers of local population change remained generally stable in the years between 2001 and 2005.
Immigration and internal migration data for wards are sourced from the 2001 Census and migration is defined as a change of usual address between 2000 and 2001. Immigration and internal migration rates are used with the 2001 neighbourhood population as the denominator. Immigration is measured by the number of people who lived outside the UK one year before the 2001 Census. For internal migration, the sum of in- and out-migration between the neighbourhood and elsewhere in the UK (2000–01), i.e. gross migration, is the measure used to indicate the total levels of movement (turnover) for the ward.
The third indicator of population change is local ethnic group population dynamics. This measure uses a typology of local population dynamics that takes into account migration and natural change. The typology is based on original estimates of components of population change—births, deaths and net migration—for ethnic groups in wards in Britain for the decade 1991–2001. The ethnic group components of population change estimates for wards and districts of Britain are available from the UK Data Archive. For further details of the typology, see Finney (2012).
The typology has eight categories, four of population growth and four of population decline. Population growth can result from an excess of births over deaths, or family building, accompanied by net out-migration (category 1) or net in-migration (categories 2 and 3). Neighbourhoods with net in-migration that exceeds natural loss (more deaths than births, category 4) also have overall population growth. Population decline results from an excess of deaths over births, or ageing loss, accompanied by net in-migration (category 5) or net out-migration (categories 6 and 7). Population decline also occurs where net out-migration exceeds growth due to family building (category 8).
The advantage of using this typology rather than, for example, a measure of migration alone, is that it captures all the components of population change in a neighbourhood and the relative importance of the mechanisms of that change. It thereby provides a categorical depiction of the demographic function of the neighbourhood and allows us to compare how this varies for population sub-groups, in this case ethnic groups. Neighbourhoods (wards) are categorised according to the population dynamics of their White and Minority residents.
Defining Ethnic Groups
‘Ethnic group’ is used in this paper to identify groups who differ in terms of their ancestral (im)migration history, their colour, their religion and their customs and traditions. Particular age structures and levels of education and wealth are associated with different ethnic groups. Eight ethnic group categories are used to generate 1991–2001 estimates of components of population change and these are based on 1991 and 2001 Census categories (see Sabater and Simpson, 2007). These eight categories are the most robust over the intercensal decade and are internally coherent in terms of age structure and main period of immigration (Finney, 2012). There is much debate about the meaning of the census ethnic group categories and the extent to which they successfully capture the ethnic diversity of Britain; there is considerable heterogeneity within the ethnic groups (for example, see Aspinall, 2000). In this paper, ethnic groups are used in either eight categories or two categories (White, Minority).
Defining Neighbourhoods
There is considerable debate about what size constitutes a neighbourhood and, indeed, how this varies for different research questions and affects the results of analyses (see, for example, Galster, 2001; Kearns and Parkinson, 2001). The neighbourhood analysis in this chapter is based on Census Area Statistics (CAS) wards. There is a total of 8850 CAS wards in England and Wales which were used for the 2001 Census outputs. They have an average population (in 2001) of just under 6000 (with a standard deviation of 4077).
Wards may be seen as large for a study of neighbourhood belonging, although Saggar et al. (2012, p. 68) call for analysis of the relation between migration and social cohesion at ward level. Wards incorporate what Kearns and Parkinson (2001) refer to as the ‘home area’ and ‘locality’ layers of neighbourhood which together provide psycho-social benefits (including belonging), activities and social status. With the exception of very rural districts, the bounded area of a ward commonly equates to one which can be walked across in around 20 minutes. It has functional meaning in that it is electorally represented and the boundaries respect physical features such as roads, railways and rivers.
Modelling
In order to distinguish between the effects of individual and neighbourhood characteristics on neighbourhood belonging, a multilevel modelling approach was taken. The variables in the models represent those of particular interest for the research questions, together with those identified in the literature as being known to be associated with neighbourhood belonging (such as age and length of residence in the neighbourhood; see Lewicka, 2011, for a review).
Multilevel logistic models are estimated in this paper using MLwiN 2.23 and pooled unweighted data from the 2005 and 2007–08 Citizenship Surveys (combined sample) with commissioned ward-level variables including on ethnic group population dynamics. The substantive results are insensitive to the probability of selection weights when these are used in a single-level model framework (results available from authors on request).
The multilevel models predict the log of the odds of respondents reporting very strong belonging to their neighbourhood. Two levels are used: level one is the individual respondents (28 176) clustered within wards of residence, which are the primary sampling units of the Citizenship Survey; at level two (1776 neighbourhoods). The intercept value is allowed to vary randomly for respondents across neighbourhoods in each model, but the relationship between the dependent variable and the explanatory variables is assumed to be constant.
A staged approach was taken to the modelling. First, a null model was fitted (model 1) with no covariates. This provides a test of whether there is significant between-neighbourhood variation with respect to the dependent variable. The subsequent models include explanatory variables entered in a series of steps. The ethnic group of the respondent is the only variable entered in model 2. Model 3 includes additional individual-level control variables (age, sex, socioeconomic status (NS-SEC), marital status and years lived in the neighbourhood).
Ward-level characteristics are included in two steps. Model 4 includes two ward-level variables that indicate population change due to migration (immigration rate and gross internal migration rate) as well as individual and ward-level control variables (Government Office Region, Townsend deprivation quintile, urban/rural indicator, percentage of children, percentage of elderly and percentage of a respondent’s own ethnic group in the ward). The immigration rate and gross internal migration rate refer to the migration of all people. The model was also run with variables that provide the immigration and internal migration rates of White and Minority respondents separately, but did not produce substantively different findings from the rates for all people.
The percentage of a respondent’s own ethnic group is calculated by matching the aggregated ethnic group concentration using the 2001 census to a Citizenship Survey respondent’s ethnic group identity using the eight group classification already described. This variable is preferred to a measure of ethnic minority concentration as a whole because it is hypothesised that people will feel a stronger sense of belonging to their neighbourhood if they are surrounded by people of the same ethnic origin. Moreover, when a measure of the Minority (or Black and Minority Ethnic, BME) concentration was included, this was not significant in the model.
Model 5a and model 5b include the ward ethnic group population dynamics classification which provides an indication of the processes of population change by ethnic group (BME 2 and White). Before entering the categorisation into the model, the other ward-level variables are removed, with the exception of Government Office Region. This is because of potential confounding with the other ward variables that describe, directly or by proxy, processes of population change. For example, the immigration rate and gross internal migration indicate population change due to migration which the population dynamic categorisation includes as part of its construction.
Relationships between Neighbourhood Population Change and Belonging
This section presents a series of charts showing the relationship between neighbourhood belonging and population change at the ward level as measured by the immigration rate, gross internal migration rate and White and BME population dynamics category. These are bivariate results; no control variables are included. The charts show the results for all respondents and BME respondents. Results for White respondents are not reported because they are very similar to those for all respondents. These results are based on data that have been weighted using the combined individual sample weight created for the core sample and the ethnic minority boost sample of the Citizenship Survey.
Overall around a third of respondents to the Citizenship Survey reported very strong feelings of neighbourhood belonging. Figure 1 shows how this varies for people living in neighbourhoods with differing concentrations of recent immigrants (immigrants who arrived in the UK in the year before the 2001 Census). Wards are divided into quintiles based on the proportion of immigrants resident there (in 2001); thus, the number of wards (and the population) in each quintile will differ. For all people, the wards with the lowest concentration of immigrants have the highest proportion of respondents with very strong neighbourhood belonging. This is not unexpected given theories about population change, population diversity and place attachment; nor given that areas of high immigration are disproportionately urban and relatively deprived, characteristics that are also associated with lower levels of belonging and cohesion. For BME respondents, there is no statistically significant relationship between the immigrant density of a ward and the proportion of residents who feel very strong neighbourhood belonging.
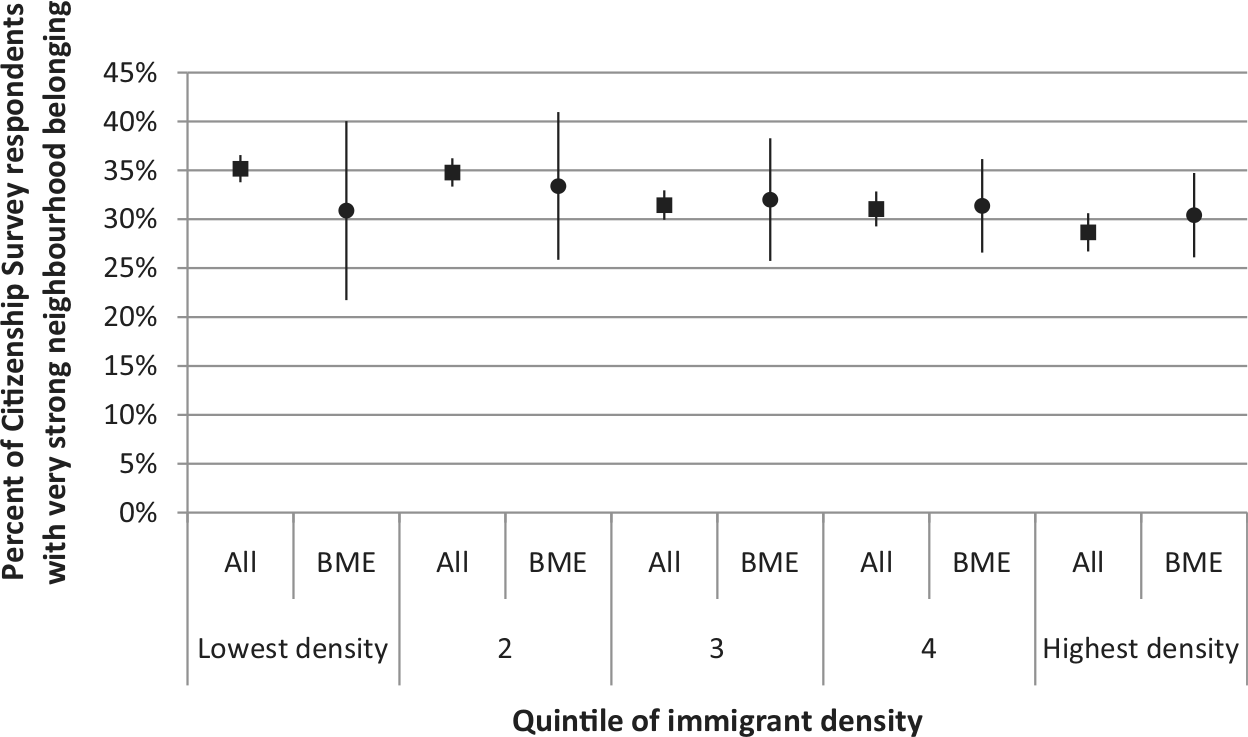
Neighbourhood belonging by immigrant density in a ward (quintiles).
There is a linear relationship between the proportion of respondents with very strong neighbourhood belonging and the gross internal migration rate of a ward (Figure 2). Wards with a lower population turnover rate have significantly higher levels of very strong neighbourhood belonging than those with high population turnover. This result accords with that of Bailey et al. (2012). The relationship holds for BME respondents. However, there are not statistically significant differences in levels of belonging between quintiles of gross internal migration for BME respondents.
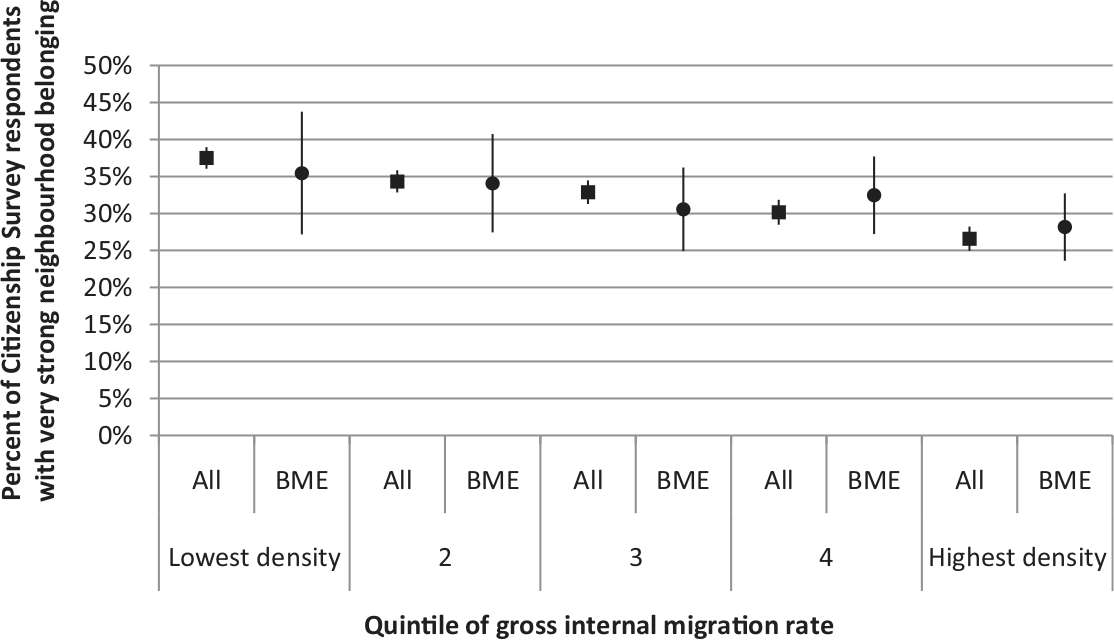
Neighbourhood belonging by gross internal migration rate in a ward (quintiles).
Figures 3 and 4 show the proportion of residents in a ward who expressed very strong belonging, comparing wards in different categories of White population dynamics (Figure 3) and BME population dynamics (Figure 4). Neighbourhood belonging is highest in wards of White population decline driven by ageing (together with out-migration) and lowest in wards with White population growth. This is the case whether considering all people or BME respondents only, although differences in levels of belonging between wards of differing White population dynamics are not significant for minority ethnic respondents (Figure 3).
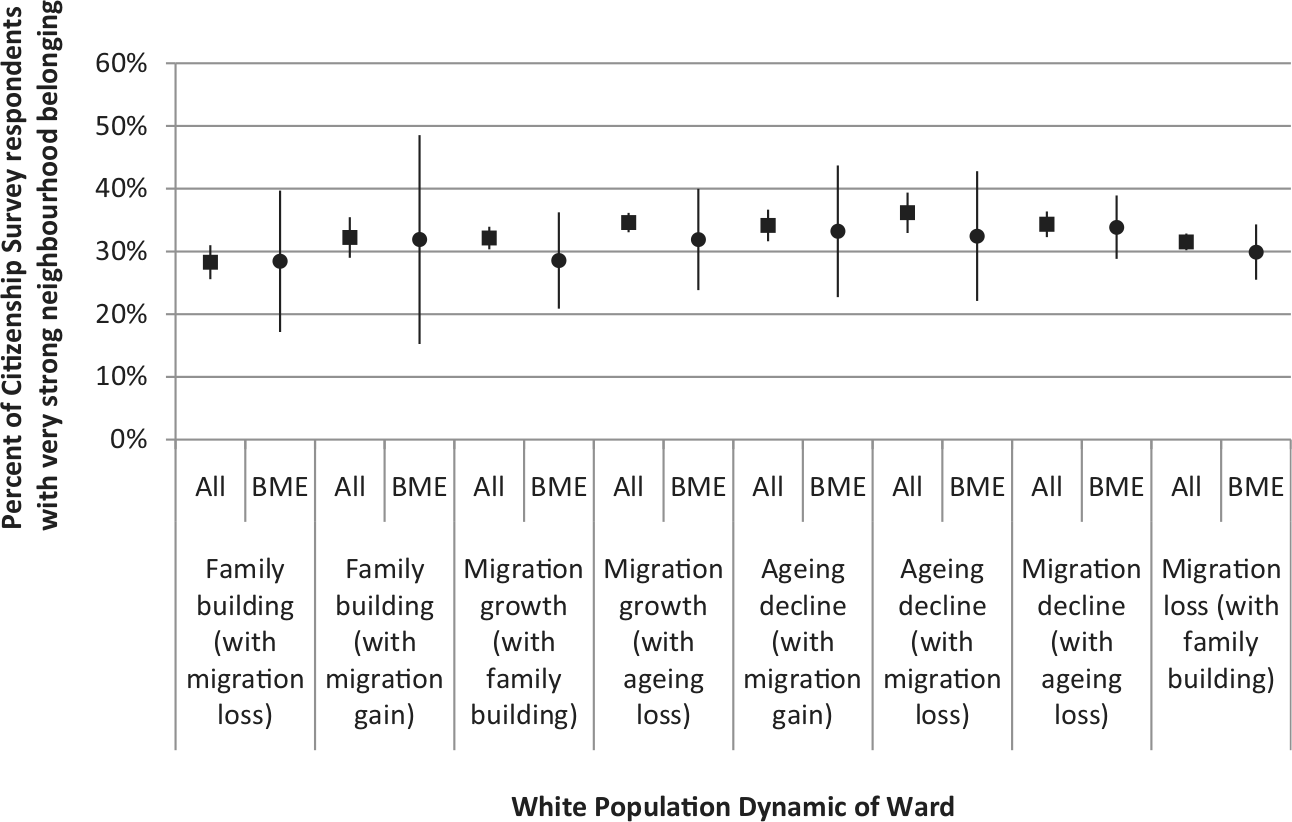
Neighbourhood belonging by White ethnic group population dynamics of a ward.
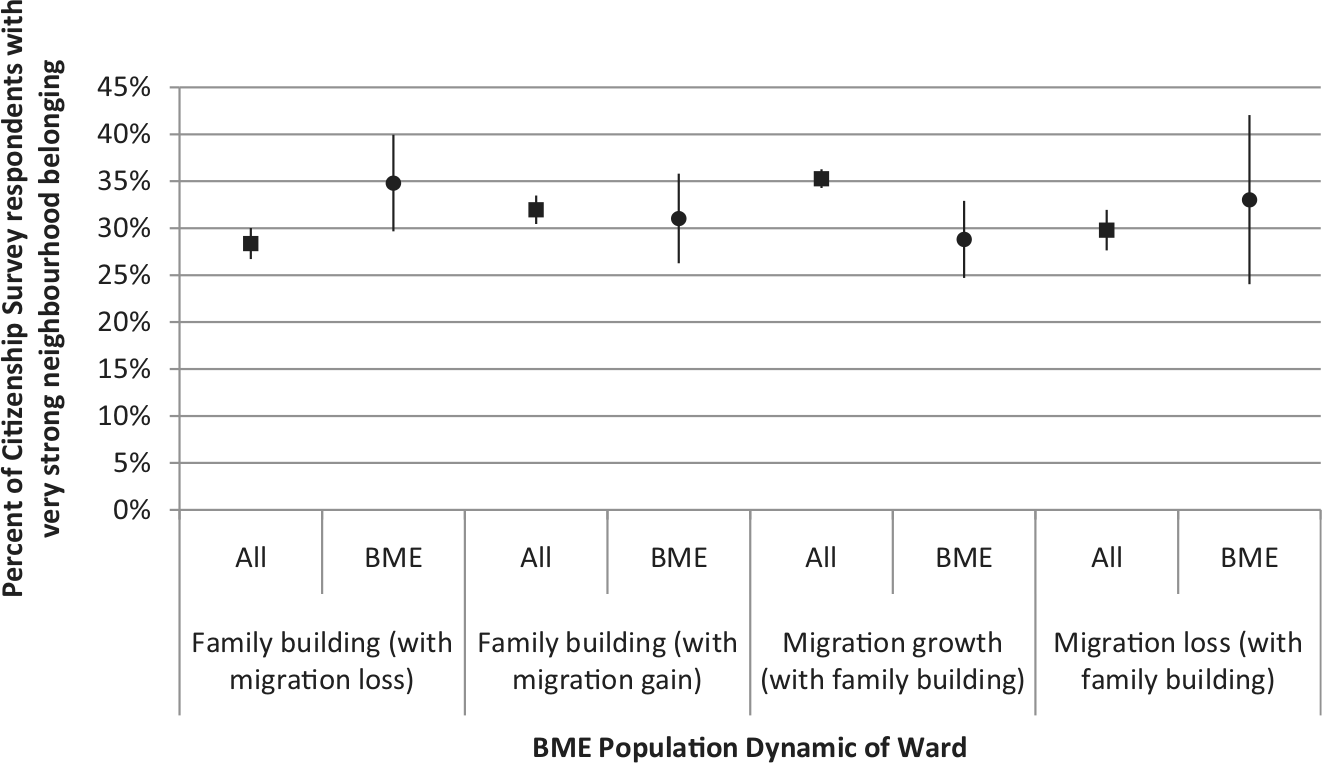
Neighbourhood belonging by Minority ethnic group population dynamics of a ward.
If the nature of minority population change in a ward is considered in relation to levels of neighbourhood belonging, Figure 4 shows that neighbourhood belonging is highest in wards of minority ethnic population gain through migration and lowest in wards of population loss through migration. The relationship is reversed when only considering minority ethnic respondents. However, the differences are not statistically significant.
In summary, and as expected, there are significant differences in levels of neighbourhood belonging by the rate of immigration and gross internal migration in a ward. Wards with a higher rate of immigration and gross internal migration have lower levels of neighbourhood belonging which is in line with the theories that high levels of population change undermine community cohesion. There are no significant differences in these patterns for minority ethnic respondents. The relationships between ward population dynamics and levels of belonging are more difficult to interpret. Neighbourhood belonging is highest in wards that are gaining minority population through family building (natural growth) and migration and in wards where White population is declining due to an ageing population (natural loss). Neighbourhood belonging is lowest in wards that are losing minority population (through migration) and gaining White population (through family building and migration). In the next section, multilevel models will determine whether these relationships remain when controlling for individual and other area-level characteristics.
Modelling Neighbourhood Belonging
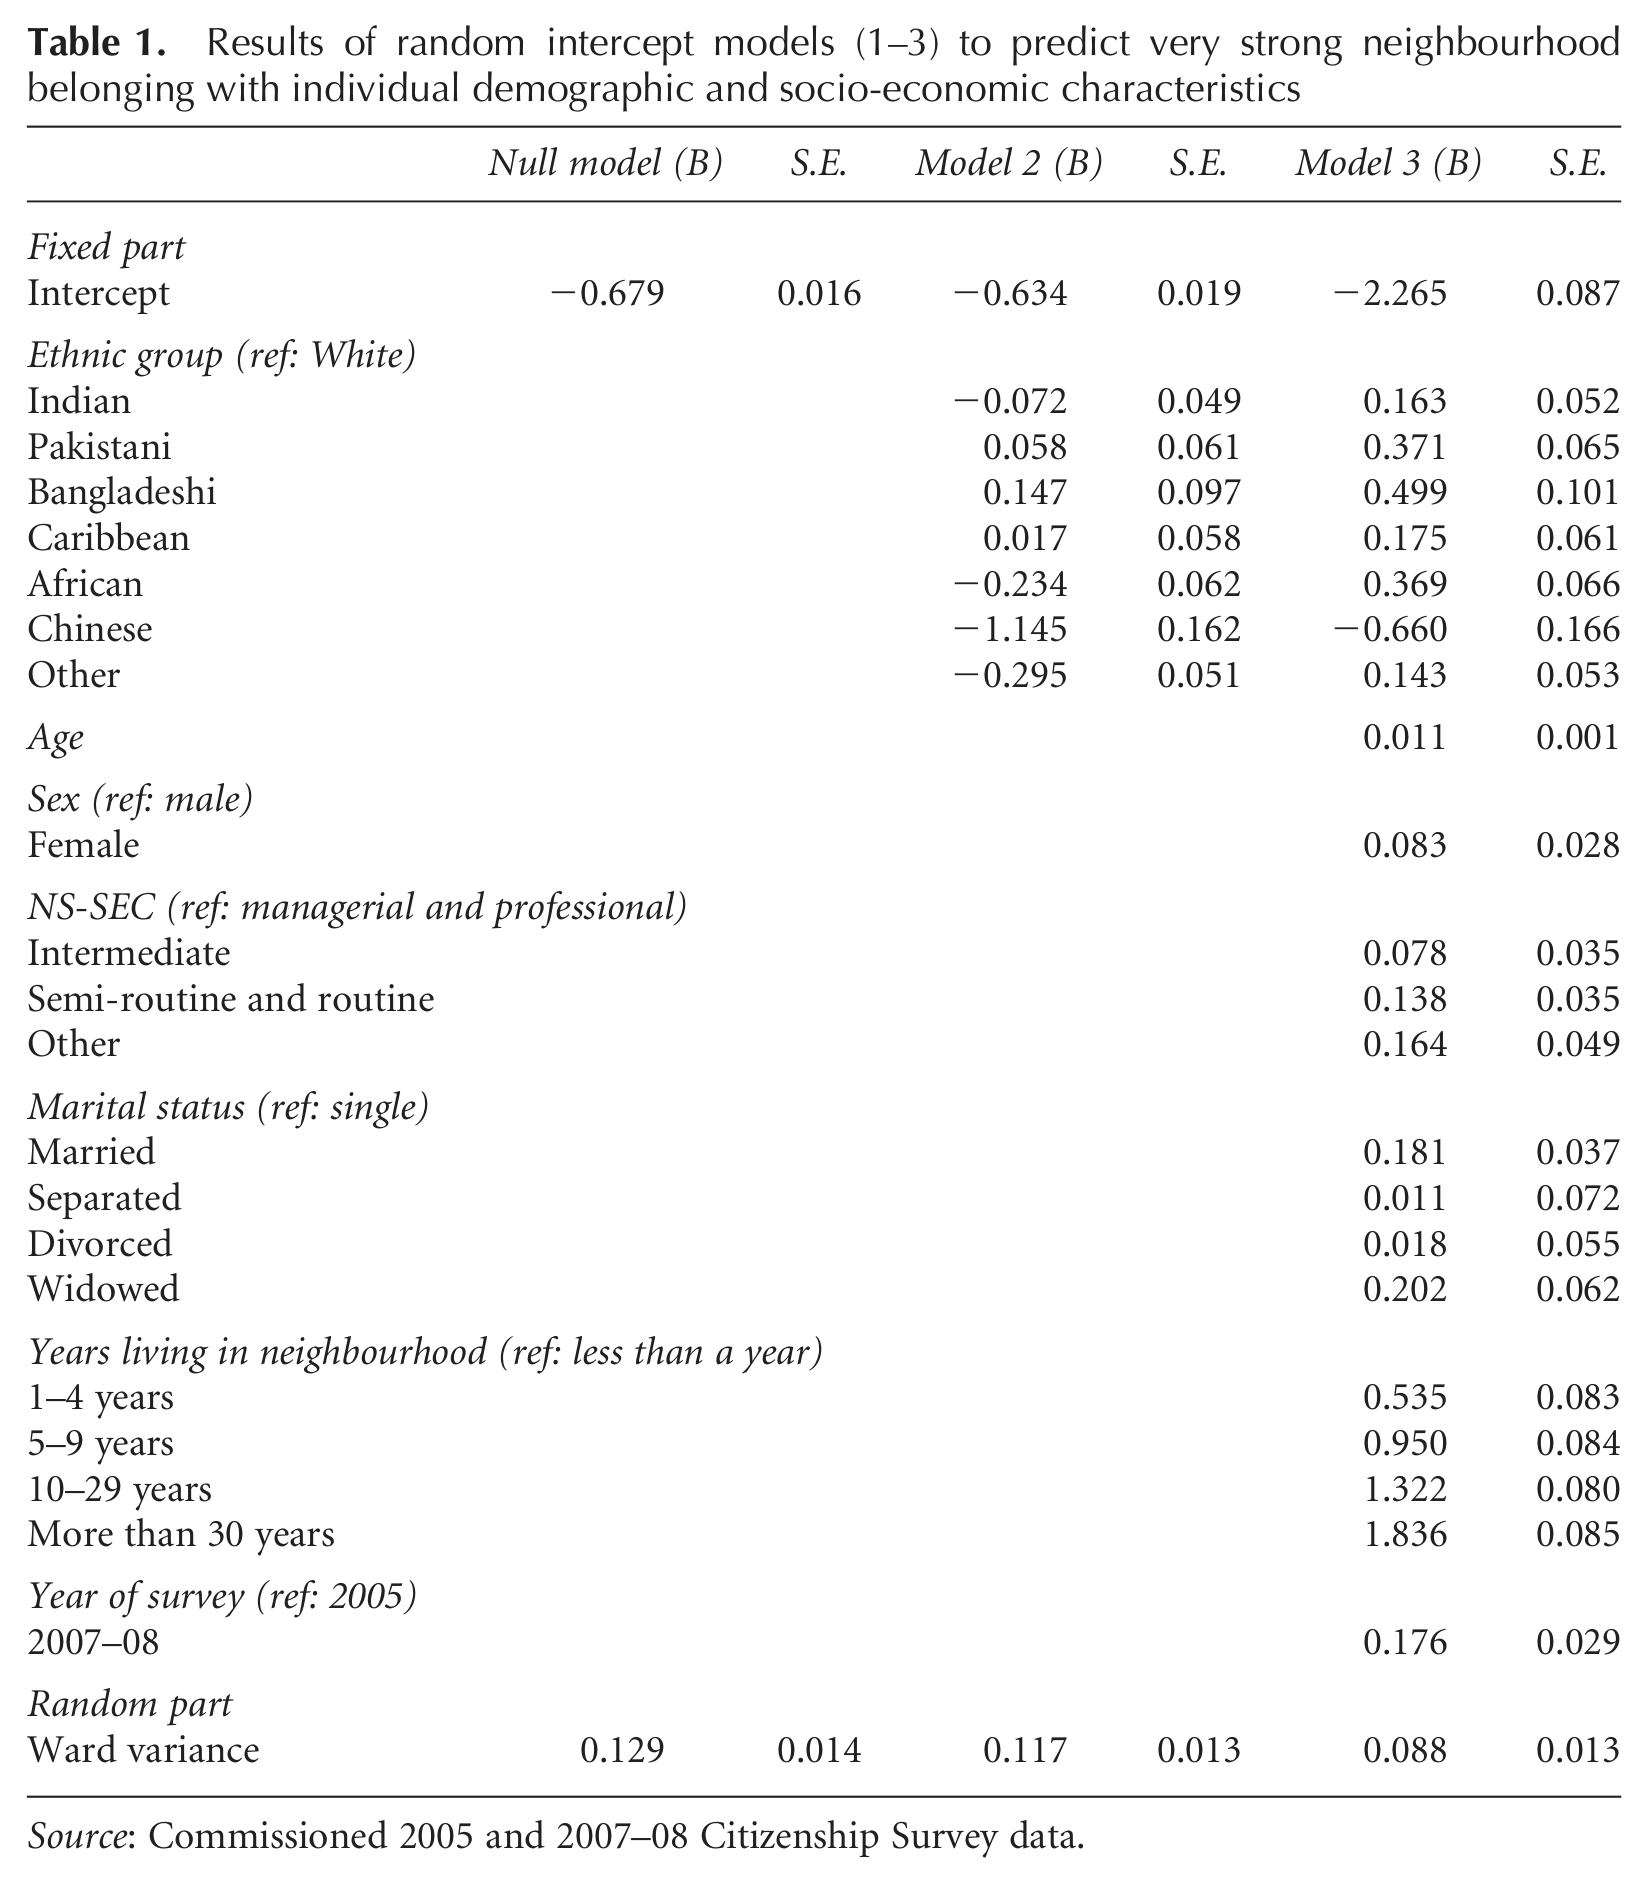
The models results shown in Table 1 aim to establish whether neighbourhood belonging varies across wards (null model), whether there is variation for individuals in different ethnic groups (model 2) and how belonging is associated with individual characteristics (model 3). The null model shows that the log-odds of having very strong neighbourhood belonging is -0.679 with a ward-level variance of 0.129. The corresponding probability is 0.337 in an average ward. The null hypothesis that the ward-level variance equals zero is rejected as the Wald statistic is 84.235. In other words, the model confirms that there is statistically significant variation across wards in levels of very strong neighbourhood belonging.
Results of random intercept models (1–3) to predict very strong neighbourhood belonging with individual demographic and socio-economic characteristics
Source: Commissioned 2005 and 2007–08 Citizenship Survey data.
There is also significant variation in levels of very strong neighbourhood belonging across ethnic groups. Particularly, individuals in Caribbean, Chinese and Other ethnic groups have significantly lower log-odds of feeling very strong neighbourhood belonging than those in the White ethnic group. The inclusion of additional individual characteristics—namely, age, gender, socioeconomic status, marital status and years lived in neighbourhood (model 3, Table 1)—allows us to assess whether the ethnic differences observed are a result of differing demographic and socioeconomic composition of ethnic groups rather than ethnicity per se. When other individual characteristics are considered, all ethnic groups have significantly higher log-odds of very strong neighbourhood belonging relative to the White ethnic group except for the Chinese ethnic group which has significantly lower log-odds.
The associations between the other individual variables and very strong neighbourhood belonging are also of interest and generally as expected. Females have higher log-odds of very strong neighbourhood belonging compared with males; married and widowed are more likely to feel very strong neighbourhood belonging than their peers who are single; and living longer in the neighbourhood is associated with higher odds of feeling very strong neighbourhood belonging. Living in the neighbourhood for longer is by far the strongest effect. The predicted probability shows that, when controlling for other variables, respondents who have lived in the neighbourhood for more than 30 years are six times more likely to report very strong neighbourhood belonging than respondents who have lived in the neighbourhood for less than a year. An unexpected finding is that lower status socioeconomic (NS-SeC) groups have higher log-odds relative to the managerial and professional group.
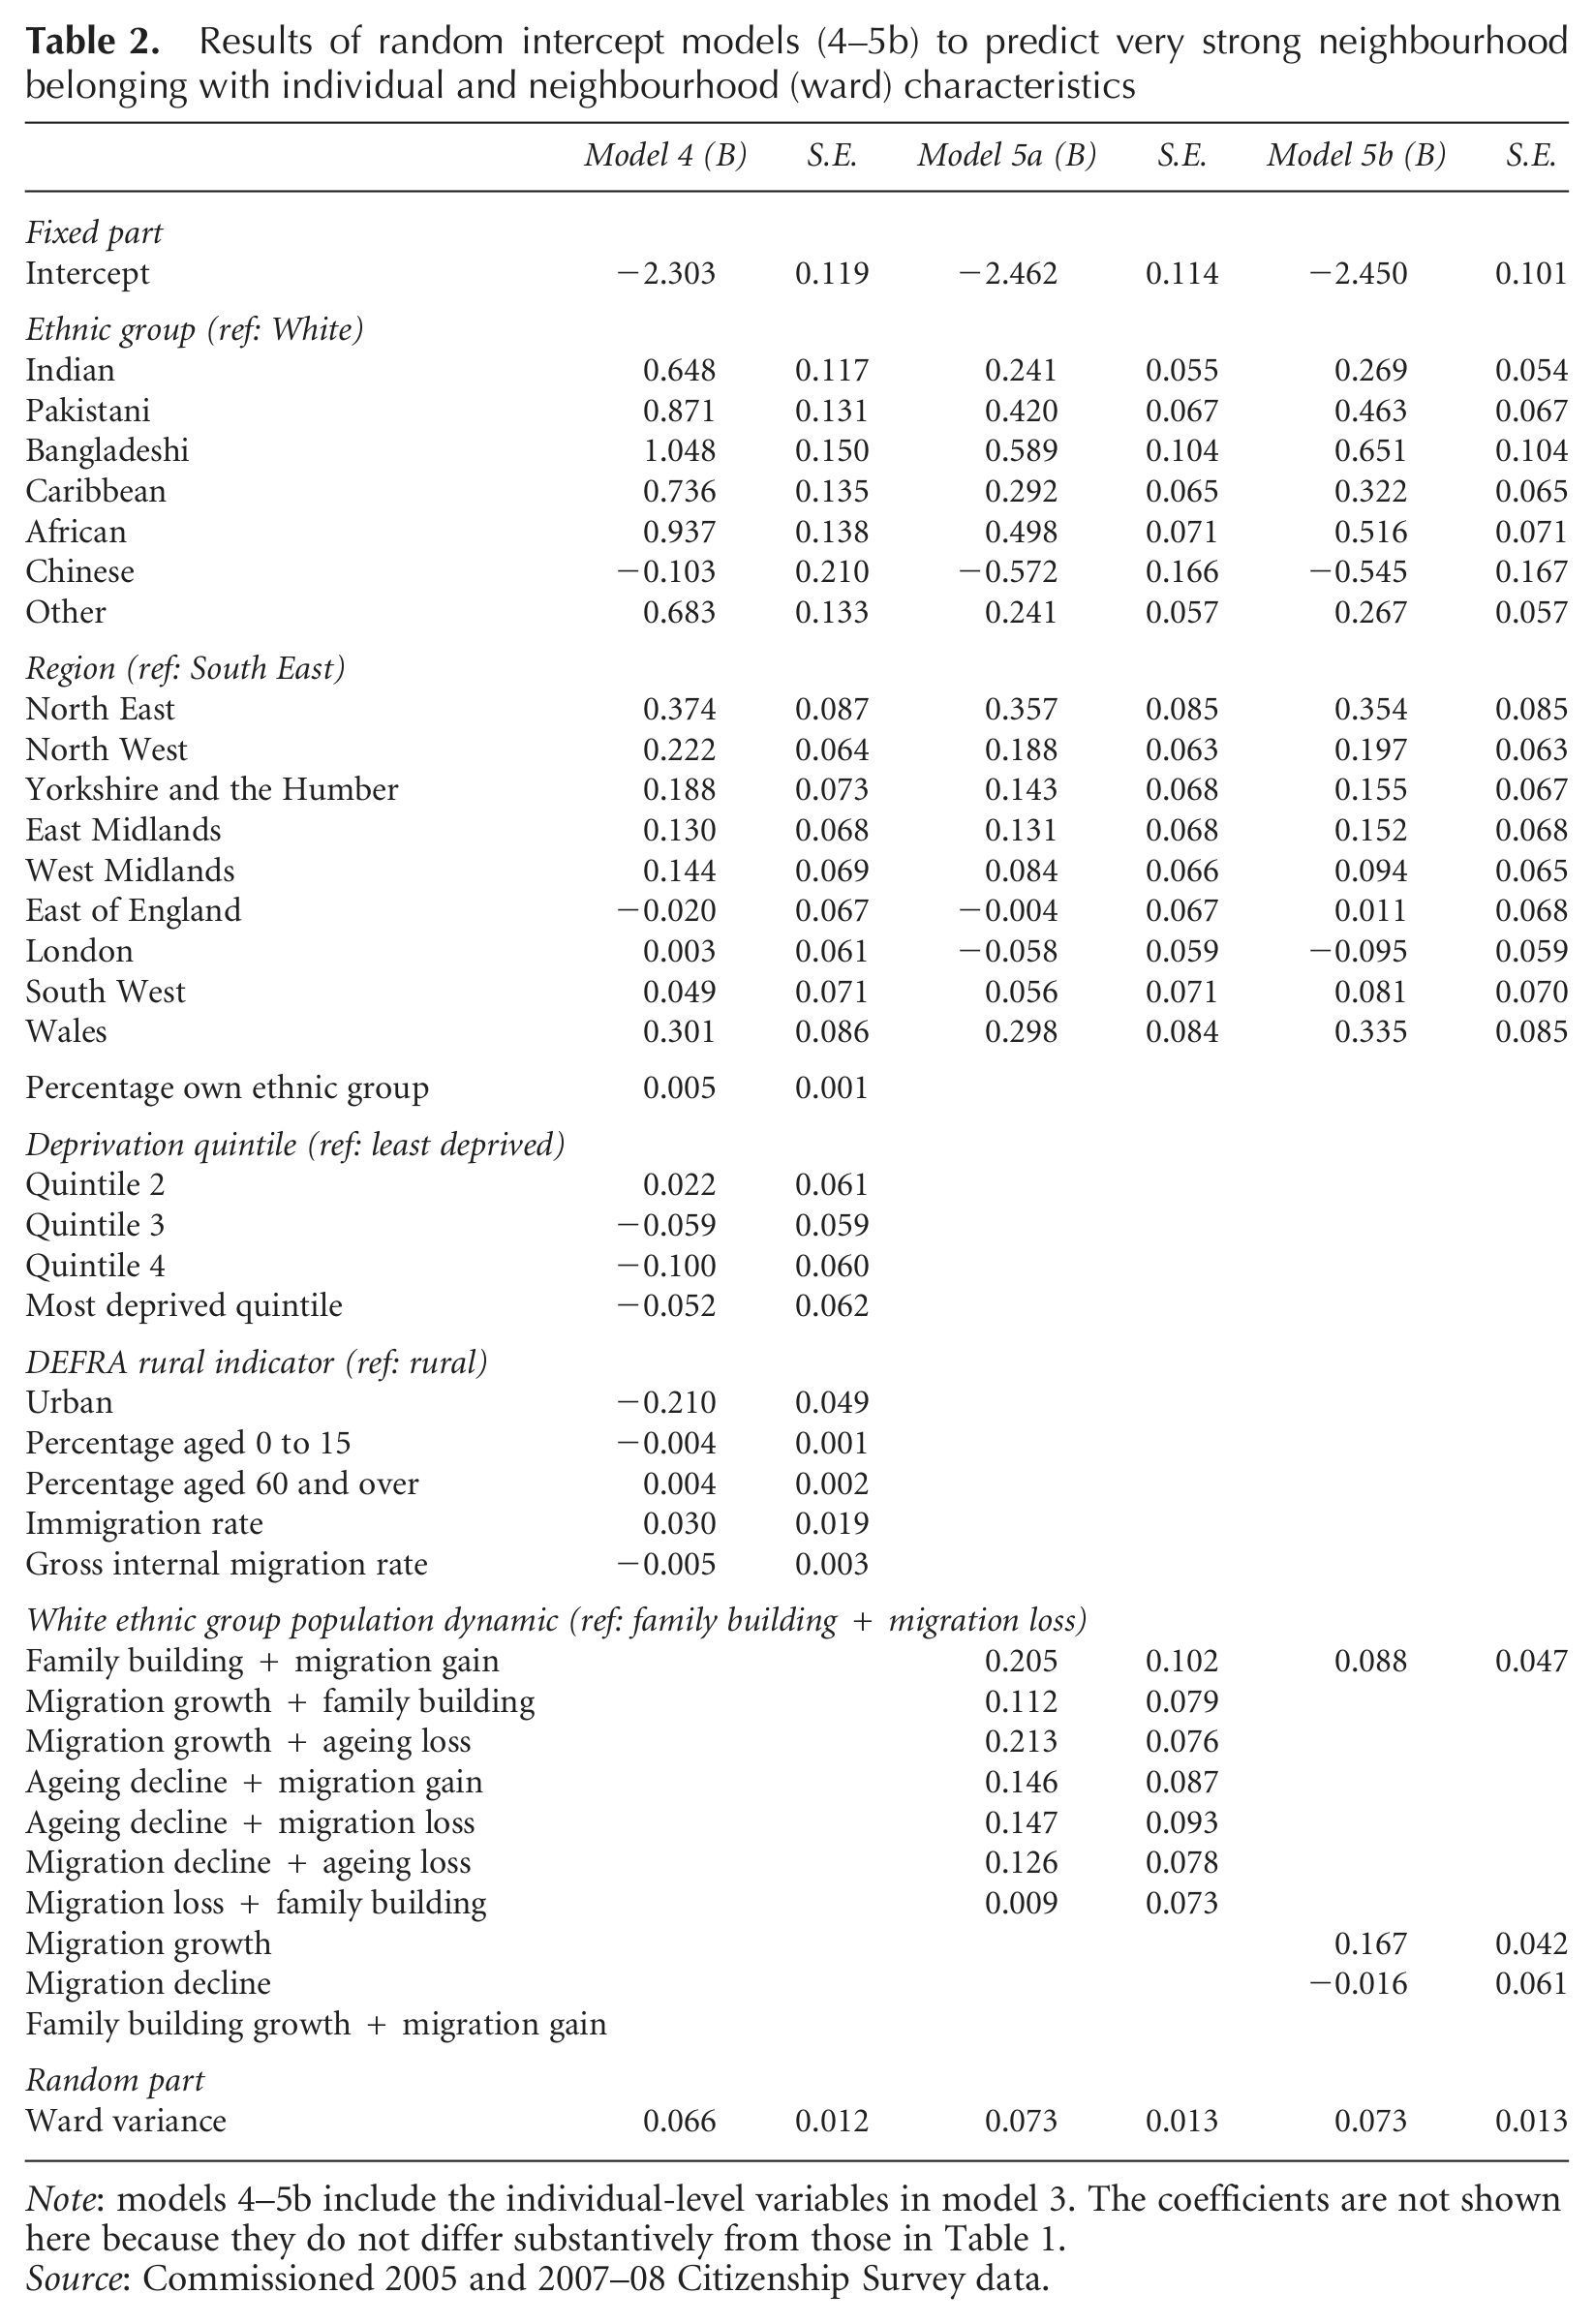
The next stage of the modelling introduces neighbourhood-level variables in addition to individual characteristics (model 4, Table 2). When ward-level variables are included, the coefficients for the individual characteristics remain stable except for the Chinese ethnic group effect which is no longer significantly different from the White group. This suggests that the low level of neighbourhood belonging found for this group is associated with the types of wards that the Chinese respondents live in rather than Chinese ethnicity.
Results of random intercept models (4–5b) to predict very strong neighbourhood belonging with individual and neighbourhood (ward) characteristics
Note: models 4–5b include the individual-level variables in model 3. The coefficients are not shown here because they do not differ substantively from those in Table 1.
Source: Commissioned 2005 and 2007–08 Citizenship Survey data.
Wards in the North East, North West and Yorkshire and the Humber regions of England and in Wales have a higher log-odds of very strong neighbourhood belonging relative to wards located in the South East of England. Urban wards have a lower log-odds of very strong neighbourhood belonging compared with rural wards. When the urban-ness of the ward has been accounted for, the deprivation (quintile) of the ward has a non-significant relationship with neighbourhood belonging. In terms of the demographic composition of wards, those with higher percentages of respondents’ own ethnic group have higher log-odds of very strong neighbourhood belonging; and those with a higher proportion of children (aged 0 to 15) have lower log-odds of very strong neighbourhood belonging. After these ward-level characteristics have been accounted for, the effects of the ward immigration rate and gross population turnover are not significantly associated with neighbourhood belonging. The gross turnover rate is significant when added as the only ward-level variable. Wards with a higher gross turnover rate have lower log-odds of very strong neighbourhood belonging. As already mentioned, these results do not differ if the ward immigration and internal migration rates for White and BME populations are separately included.
Models 5a and 5b (Table 2) include ward White and Minority ethnic population dynamics respectively. When controlling for the individual characteristics and the region a ward is located in, the log-odds of very strong neighbourhood belonging are higher in categories of White population dynamics with migration growth (‘family building with migration gain’ and ‘migration growth with ageing’) compared with wards where there is ‘family building with migration loss’. The log-odds of very strong neighbourhood belonging are higher in wards in the minority ‘migration growth’ category relative to wards where there is minority ‘family building with migration loss’ (model 5b).
Models 1 to 5 have also been run separately for White and BME respondents (not shown here). The results of note for these stratified models are that gender is not significant in BME models; own ethnic group is not significant in the White models (but has a positive effect in BME models—i.e. higher percentage of own ethnic group is associated with higher levels of neighbourhood belonging); for Minorities, neighbourhood belonging is greater in more deprived than in less deprived wards; urban-ness of ward, percentage of children and percentage of elderly are not significant in BME models.
These separate White and BME models are not reported fully because they are sensitive to weighting when fitted within a single model framework. This might be a result of the inappropriateness of the Citizenship Survey combined sample weights when only analysing White or BME respondents. The weights take account of the over-representation of ethnic minorities in the data relative to the core sample. Moreover, results grouped by BME respondents are also limited because they do not take into account the heterogeneity of minority respondents in terms of their probability of having very strong neighbourhood belonging. Interaction terms were included to take account of this. They were fitted for ethnic groups and each ward-level variable in model 4. Only the effect of ethnic group by own ethnic group concentration was significant: Pakistanis and Bangladeshis have a higher log-odds of very strong neighbourhood belonging with increasing concentration of their own ethnic group in the ward relative to Whites.
One further modelling result is noteworthy. As variables are added to the model, the proportion of ward-level variance falls, from 3.8 per cent in model-1 to 3.4 per cent in model-2, 2.6 per cent in model-3 and 2.0 per cent in model-4. Thus, inclusion of ward characteristics accounts for around half of the difference in levels of very strong neighbourhood belonging between wards that is not attributable to the ward population composition.
To summarise the key results of the modelling, very strong neighbourhood belonging is higher among people in minority ethnic groups (except Chinese), who are older, female, of lower socioeconomic class, who have lived longer in the neighbourhood and are married or widowed. It is also higher in wards in the North of England, rural areas, wards with a higher percentage of a respondent’s own ethnic group (particularly for Pakistani and Bangladeshi repondents) and a lower proportion of children. In terms of population change, the bivariate results of very strong neighbourhood belonging in immigrant-dense and high population turnover wards are not seen in the models, leading to the conclusion that these effects are explained by individual and other ward-level characteristics. Highest levels of strong neighbourhood belonging are found in wards where there has been White and/or minority population growth due to migration (immigration or internal migration), whether this was accompanied by natural population growth (family building) or decline (ageing).
Discussion and Conclusions
In the context of political concerns about the effect of local population change and increasing ethnic diversity on community cohesion, this paper has examined what distinguishes people with a very strong sense of neighbourhood belonging (around a third of people) from others in terms of their individual characteristics and the characteristics of the neighbourhood in which they live. The analysis was particularly interested in the question of how neighbourhood belonging is related to neighbourhood changes in ethnic group populations. Additional questions of interest were: how does neighbourhood belonging vary across ethnic groups; how is belonging related to neighbourhood ethnic density; and, does neighbourhood belonging vary between neighbourhoods (beyond the differences in neighbourhood population composition)? These questions have been addressed through multilevel modelling of pooled data from the 2005 and 2007–08 Citizenship Surveys of England and Wales.
Social disorganisation theory suggests that high levels of population change undermine community cohesion (Raudenbush and Sampson, 2004). Despite some confirmation of this from Bailey et al.’s (2012) study using the same data source as this paper, the results presented here do not provide evidence that, after controlling for demographic and socioeconomic characteristics of individuals and the wards in which they live, high levels of immigration or population turnover are associated with lower levels of neighbourhood belonging. This concurs with Saggar et al.’s (2012, p. 3) headline conclusion that “immigration has no significant impact on neighbourhood cohesion”. The differences in the findings of this study and Bailey et al.’s (2012) are at least partly the result of differences in the analyses (including the years of the Survey used, the specification of the outcome and independent variables and the neighbourhood scale used) which are a result of the different foci of the two studies. Undoubtedly, the results presented here are shaped by the data sources and the operationalisation of neighbourhood belonging from the Citizenship Survey question. Although the question can be relied upon as a general indicator of respondents’ sense of belonging to their neighbourhood, and we have demonstrated that alternative formations of the outcome variable do not alter the results, further work that includes qualitative investigation alongside survey analysis is needed to understand the various nuances of feelings about neighbourhood that are contained within individuals’ responses to such a survey question. The value of qualitative approaches is clearly shown by, for example, Savage et al. (2005), Phillips et al. (2007) and Livingston et al. (2010).
Although immigration and turnover were not found in this analysis to be related to neighbourhood belonging, a significant relationship was found with the population dynamics of a ward. The population dynamics category of a ward aims to capture a more complete picture of the population change experienced, combining measures of migration (immigration and internal migration) and natural change (family building and ageing). Highest levels of strong neighbourhood belonging were found for wards with overall population growth, for White and Minority populations, where this growth was due primarily to migration. This finding appears to hold whether the migration gain was accompanied by family building or ageing. This result can be interpreted as identifying areas that can be considered to be ‘attractor’ neighbourhoods where one characteristic is a strong sense of community, or belonging, be that a cause or consequence of the neighbourhood attraction. Given the insignificant model results for immigration and population turnover, the population change in these neighbourhoods—growth driven by migration—is somewhat different from high levels of immigration or population change alone. Further work is needed to identify these areas to understand better how the population dynamics relate to cohesion—for example, to examine whether they represent regenerated or gentrified neighbourhoods, or ones where there is, for example, gradual replacement of ageing population with upwardly mobile families. If the latter is the case, it may be that in neighbourhoods with White and Minority populations growing through migration the dominant narrative is elective belonging (Savage, 2010); that is, the in-migrants are appropriating their neighbourhoods.
A specific interest of this paper was whether the ethnic character of population change differently affected belonging. No evidence has been found for this. Indeed, including White immigration, Minority immigration, White population turnover, Minority population turnover and ward population dynamics categories for respondent’s own ethnic group (eight groups) did not add any significant explanatory power to the models. This is contrary to Laurence and Heath’s (2008) finding that non-White immigration was negatively associated with an indicator of community cohesion that asked whether people from different backgrounds get on well together.
However, ethnicity was found to be important in relation to neighbourhood belonging in other respects. First, there are differences in levels of very strong neighbourhood belonging between people of different ethnic groups. After controlling for the demographic and socioeconomic composition of ethnic groups, the analysis in this paper shows that individuals from Minority ethnic groups, with the exception of Chinese, have higher likelihoods of very strong neighbourhood belonging than White individuals. There is also some indication (to be taken with caution due to weighting issues) that the relationship between area type and belonging may vary across ethnic groups. For example, for Minorities, belonging is greatest in the more deprived wards, whereas this is not the case for the White population. Although place attachment has been found to be lowest in deprived areas (Bailey et al., 2012), it may be that other attributes of these places relating to ethnic community, including feelings of safety and absence of racism, may lead to higher levels of belonging for Minority residents (Devadason, 2010; Phillips et al., 2007).
This relates to the second way in which ethnicity was found to be important for neighbourhood belonging: the overall proportion of Minorities in a neighbourhood does not have a statistically significant relationship with very strong neighbourhood belonging whereas co-ethnic density has a positive relationship with belonging i.e. the higher the proportion of people living in a neighbourhood who are in the respondent’s own ethnic group, the higher the likelihood of them feeling very strong neighbourhood belonging (other factors considered). This result is found to be particularly strong for people in Pakistani and Bangladeshi ethnic groups. This finding supports studies that emphasise the benefits of ethnic diversity and co-ethnic density (for example, Becares et al., 2011) and thereby challenges discourses of diversity eroding cohesion (for example, Putnam, 2007).
A note of caution should be added to this positive message about the benefits of co-ethnic density: if neighbourhood belonging is greatest for those living amongst people of the same ethnic group, does this also indicate exclusion of minorities from less diverse (or more White) areas? As Phillips et al. (2007, p. 224) identify, “continuing racialization of space circumscribes opportunities and mobility for many British Asians”. Appropriating neighbourhood, or electing to belong, may be very difficult if minorities do not feel safe or ‘accepted by the majority’ (Devadason, 2010, p. 2949; Savage, 2010).
This paper has confirmed that there is neighbourhood variation in levels of neighbourhood belonging that can be partly explained by the population composition of the neighbourhood and by the socioeconomic, urban and demographic character of the neighbourhood. The results have by no means concluded the debate about the effects of local population change on cohesion; rather, they have added to suggestions that the relationships are very complex. Two findings from this paper can be taken as leads for further studies to unravel these complexities. First, the type of population change may be important. Focusing on the overall population change and its demographic drivers may offer more insight into the mechanisms of the effects of population change by encouraging an understanding of local population dynamics based on demographic cycles and functions, rather than crude measures of immigration or turnover. For example, areas of population growth due to migration and family building may be ‘attractor’ areas where strong sense of community and belonging is one component of the areas’ characteristics. If policy-makers are looking for community exemplars, identifying and examining such neighbourhoods may be a fruitful approach.
Secondly, no evidence has been found in this paper that the ethnic character of population change, either generally or in relation to the ethnic identity of individuals, differently affects belonging. Focusing on the effects of ‘White’ or ‘Minority’ immigration, for example, may therefore be less important than overall population change or other area indicators. In terms of ethnicity, it may be more interesting, and instructive for those policy-makers wishing to increase levels of belonging and cohesion, to investigate why minorities have higher levels of neighbourhood belonging and what it is about living in areas of high co-ethnic density that brings a very strong sense of community for minority populations.
Footnotes
Acknowledgements
The authors are grateful to NatCen for provision of commissioned Citizenship Survey data and to the Economic and Social Data Service (Government) for access to published Citizenship Survey data and documentation. The referees of this paper provided insightful comments and we thank them.
Funding
This research was conducted as part of a Hallsworth Fellowship at the University of Manchester (Finney).