



Abstract
Attention to ‘sustainability’ and energy efficiency rating schemes in the commercial property sector has increased rapidly during the past decade. In the UK, commercial properties have been certified under the BREEAM rating scheme since 1999, offering fertile ground to investigate the economic dynamics of ‘green’ certification in the commercial property market. This paper documents that, over the 2000–09 period, the expanding supply of green buildings within a given London neighbourhood had a positive impact on average rents and prices, but reduced rents and prices for environmentally certified real estate. The results suggest that there is a gentrification effect from green buildings. However, each additional “green” building decreases the marginal effect of certification in the rental and transaction markets by 2 per cent and 5 per cent respectively. In addition, controlling for lease contract features, like contract length and the rent-free period, modifies the impact of environmental certification on rental prices.
1. Introduction
In the current debate on global climate change, buildings are increasingly considered by policy-makers, corporations and institutional investors to represent vehicles for achieving energy efficiency, carbon abatement and corporate social responsibility. This shift in the perception and use of buildings is gradually moving commercial property markets towards increased levels of energy efficiency and ‘sustainability’.
Anecdotally, London’s 2015 skyline provides testimony to this development. For example, The Shard, towering 72 storeys and 306 metres into the London sky, is expected to consume 30 per cent less energy than an otherwise similar building; Bishopsgate Tower generates electricity through 2000 square metres of photovoltaic cells; and Broadgate Tower, through its extensive heat recovery system and efficient cooling plant, aims to reduce carbon emissions by 40 per cent. In general, for most of the new or renovated commercial real estate coming to market in London, energy efficiency and sustainability features are primary building characteristics.
Part of the focus on energy efficiency is driven by the UK’s regulatory framework regarding the carbon abatement and energy efficiency potential of the built environment. This framework is embedded in EU legislation, where buildings represent a strategic cornerstone of the recently recast Energy Performance and Buildings Directive and the Energy Efficiency Plan of 2011. To comply, the UK has enforced building energy efficiency regulations through two initiatives. First, it has implemented the mandatory display of Energy Performance Certificates, Declaration of Energy Certificates and zero-carbon building initiatives. Secondly, the UK has instituted a carbon market, solely aimed at building energy consumption, with the Carbon Reduction Commitment of 2010. This legislation is among the first to price the negative externalities from energy consumption in buildings and ranks landlords through carbon performance league tables.
Besides regulation, private-sector involvement in the energy efficiency of buildings is growing. In 1990, the UK commercial real estate market was the first to introduce a private third-party assessment tool to measure a building’s environmental impact—the BRE Environmental Assessment Method (BREEAM). Moreover, London’s largest commercial landlords, including British Land, Grosvenor, Hammerson, Hermes and Land Securities, have taken action through the formation of the Better Buildings Partnership, with the aim to cut carbon emissions and to improve the ‘sustainability’ of London’s commercial buildings.
Despite these initiatives, the financial implications of the transition to a more efficient building stock are not yet clear. This information becomes more important as the supply of commercial buildings certified to be ‘green’ increases, as demand for such buildings is affected by more private-sector attention to energy-efficient buildings and as the regulations surrounding the energy efficiency and carbon abatement potential of buildings are tightened. Importantly, there is a notable degree of uncertainty and scepticism surrounding the economics of green building in the UK.
Prior published literature on the financial implications of green certification mostly focuses on the US and results generally indicate a positive relationship between environmental certification and financial outcomes in the marketplace. Eichholtz et al. (2010) document significant and positive effects on market rents and selling prices following environmental certification of office buildings. Relative to a control sample of conventional office buildings, LEED or Energy Star labelled office buildings achieve rents that are about 2 per cent higher, effective rents that are about 6 per cent higher and premiums to selling prices as high as 16 per cent. Other studies confirm these findings (Fuerst and McAllister, 2011a; Miller et al., 2008) and, importantly, these results appear robust over the course of the financial crisis—the effect is not dented by the recent downturn in property markets (Eichholtz et al., 2013).
For investors, it is important to understand the value and risk implications of the increased focus on green building in the commercial real estate sector. In the UK, green buildings have expanded over the past decade, accounting for about 10 per cent of the current commercial stock. However, market performance analysis of green certified commercial real estate is scant within the UK. 1 This is surprising, as London represents one of the largest commercial real estate markets in the world. 2 Moreover, London is a dominant player in the global financial system, hosting a myriad of international financial and service-sector firms (Clark, 2002). Building off this existing infrastructure, London is capitalising on the nascent green economy, creating ‘complementary’ legal and financial instruments to support new markets—for example, carbon markets and energy efficiency policy reforms (Knox-Hayes, 2009).
This paper investigates the dynamics behind the financial performance of London’s environmentally certified commercial building stock within the context of a changing supply and demand framework, measured ex post by sales transactions and achieved rents over the 2000–09 period. Addressing the economic fundamentals driving the value of green (i.e. supply and demand), this paper makes two contributions to the nascent literature on commercial building energy efficiency. First, we investigate the role of green building supply on market dynamics by assessing the impact of growing competition of environmentally certified real estate on the prices of ‘certified’ and ‘non-certified’ office buildings. Secondly, we analyse in more detail the demand for environmentally certified real estate, by including rental contract features and identifying the buyers of commercial properties, exploring their impact on real estate rents and prices respectively.
To identify London’s stock of certified buildings, we utilise BRE’s database on green building certification—BREEAM. We match BREEAM-labelled buildings to a rental database over the 2005–10 period. We then construct a database using information from four data sources and complement these with manual collection of information on building quality. This results in a final sample of 1149 rental transactions, of which 64 rental transactions are in commercial properties certified by BREEAM. In addition, we match the BREEAM address files to sales transactions over the period 2000–09. Following the same data collection procedure, we obtain a sample of 2103 observations, including 68 BREEAM-certified transactions.
At the point of means, we document premiums for certified buildings of 19.7 per cent for rental transactions and 14.7 per cent for sales transactions, relative to non-certified buildings in the same locational cluster. A comparable analysis for Chicago, New York and Washington, DC, depicts a similar premium for transactions of certified buildings in the US. Importantly, we document that growth and concentration in the green building supply have a negative effect on the marginal rents and prices paid for green buildings as compared with non-certified buildings in the same neighbourhood, but a positive impact on the average level of rents and prices of all commercial buildings in that neighbourhood—‘green gentrification’. The diffusion of certified real estate over the past decade has contributed to the gentrification of London’s commercial districts. However, the growth in environmentally certified buildings has led these properties to become the standard rather than the exception, which has an impact on their pricing in the marketplace. Finally, investor type and contract features have a modifying impact on prices of certified buildings and it is therefore imperative for these factors to be included in future research on this topic.
The remainder of this paper is organised as follows. Section 2 introduces and discusses the UK market for green real estate. In section 3, we discuss BREEAM and financial data obtained for commercial buildings in London. In section 4, we outline the methodology for our analysis. In section 5, we present the results of the formal analysis. Section 6 provides a discussion and some conclusions.
2. The UK Market for Green Office Space
2.1 Environmental Certification for Commercial Buildings
Building certification facilitates the intermediation process between building developers, investors and tenants in the context of what constitutes ‘quality’ or ‘efficiency’ in a building. This intermediation process may reduce investment in ‘lemons’ (Akerlof, 1970). For ‘green’ real estate, rating agencies may reduce adverse selection by acting as accredited and recognised assessors of environmental information. Thus, building performance disclosure may lead to reduced investment in environmentally underperforming buildings.
Within the UK, there are two private intermediaries of environmental information on buildings, BREEAM and LEED. In 1990, the UK’s Building Research Establishment (BRE) began the independent certification of the environmental performance of buildings in the UK. The first commercial office space was certified in 1999. Under the 2008 scheme, a commercial office can receive BREEAM certification if it meets the minimum standards set by BRE in eight core dimensions: building management, health and wellbeing, energy efficiency, transport efficiency, water efficiency, material usage, pollution and land use ecology.
Competition for third-party environmental certification in the UK market is mainly with LEED, the Leadership in Energy and Environmental Design rating system designed by the US Green Building Council. The purpose of LEED is similar to that of BREEAM: increasing the energy efficiency and sustainability of the built environment through the certification of exemplary buildings. 3
2.2 Supply of Green Office Space
Green buildings are considered different from conventional buildings because they command a different set of technological and human capital requirements. Green building supply is most likely to be driven by construction costs, other certified buildings’ price signals, the prices and availability of raw materials and human capital to construct green buildings, advances in green technology and government policies mandating energy efficiency (see Kok, McGraw and Quigley, 2011). Thus, growth in the green building supply may have a dynamic impact on equilibrium prices over the 2000–09 period.
Figure 1 displays the geography of UK office buildings labelled by BREEAM by level of certification, which corresponds to a label ranging from “Pass” to “Outstanding”. The map displays the dispersion of green office buildings across the UK, with a significant cluster of buildings located in London (368 buildings, or 23 per cent of the BREEAM office population). Bristol, Manchester, Newcastle Upon Tyne and Glasgow are other cities with relatively high concentrations of green buildings (a total of 171 buildings, or 10 per cent of the BREEAM office population). Highly rated buildings are mainly in London, with the number of “Excellent” and “Very Good” rated buildings far surpassing other markets (181 buildings).

Geography of green buildings in the UK and London by BREEAM rating.
2.3 Demand for Green Office Space
Improving the bottom line through building energy efficiency is often reported as one of the direct economic benefits for real estate investors when considering the energy efficiency and sustainability of a portfolio. For example, Jones Lang LaSalle (2009) reports for 115 office properties in their portfolio for which the energy efficiency was improved, the average realised savings for 2007 and 2008 were £1.4 million and £1.9 million respectively. British Land (2010) reported a 12 per cent decrease in energy use in 2009 (some 11.1 GW of electricity), amounting to £700 000 in annual energy savings.
In addition, institutional investors may have different investment beliefs when introducing corporate social responsibility criteria into their real estate investment strategy. A recent sustainability benchmark, commissioned by 35 of the largest institutional investors around the globe, documents institutional investor engagement in the building sector’s sustainability. The property sector, by being mindful of management and implementation of energy efficiency and sustainability within their own portfolios, reduced carbon emissions by 1.8 per cent and achieved $1 billion in energy savings in 2010–11 period (Kok, Bauer and Eichholtz, 2011).
The most important factor determining demand for rental space is employment in the legal and financial service sectors (Wheaton et al., 1997). In the US, the financial service sector (i.e. legal services, national commercial banks, executive legislative and general office) began occupying LEED and Energy Star certified space over the 2004–09 period (Eichholtz et al., 2011). Data from London are indicating a similar trend, where financial services firms, advertising and insurance sectors are dominant users of green space. For example, CBRE reports that 58 per cent of tenants find energy efficiency ‘essential’ and 50 per cent find other green attributes ‘essential’ (CBRE, 2010).
Anecdotally, the move of tenants towards green real estate is due to enhanced reputation benefits, corporate social responsibility mandates and employee productivity (Nelson and Rakau, 2010). Shifting tenant preferences suggest that tenants are using the buildings they occupy to communicate their corporate vision to shareholders and employees. The literature on corporate social responsibility (CSR) has investigated this link between corporate social performance, reputation benefits and employer attractiveness (Turban and Greening, 1997; Margolis and Walsh, 2003), although claims are mostly based on case studies.
3. UK Property Market Data
The UK’s primary commercial real estate market is the London metropolitan market. London is currently the most active commercial real estate market in the world (Chegut et al., forthcoming). Any UK study will be biased towards London, leading to the following concerns: first, in hedonic models at the national level, the ‘London effect’ creates inconsistent estimates in pricing common building characteristics, such as age, storey, renovations and amenities, as these features are specific to London and its history. Secondly, a sample combining the commercial property markets of London, Manchester, Bristol and Leeds is geographically clustered in London, which is a concern when location is a principal factor in modelling rental and transaction prices. Thirdly, UK databases overwhelmingly report rental and transaction observations in London, as transaction and building characteristic knowledge is more abundant for the London area than for any other region in the country. Given these three concerns, we focus on the London metropolitan area in this paper.
To analyse the economic implications of environmentally certified commercial real estate in London, we match BREEAM address files to a combined dataset of rents and property transactions maintained by CoStar FOCUS 4 and Estates Gazette Interactive 5 (EGi) over the periods 2005–09 and 1999–2009 respectively. Over these periods, CoStar covered a sample of some 5028 commercial leasing transactions and EGi and CoStar covered 4500 sales transactions across London. However, CoStar data do not include basic building characteristics, such as age, storeys, amenities, third-party assessment of building quality, etc. To collect these missing hedonic features, we consulted three databases: Emporis, a global building design database, EGi and Real Capital Analytics. In addition, we hand-collected building features from building prospectuses and advertisements, and went on physical site visits in London. Approximately 2500 rental transactions were collected for London utilising this manual effort. For sales data, a similar data collection procedure was conducted. This extensive data collection procedure, coupled with removal of erroneous data and portfolio sales, resulted in a sample of 1149 lease transactions, including 64 BREEAM-certified leases, and a sales transaction sample of 2103 observations, including 68 BREEAM-certified transactions.
Our dataset contains information on a building’s environmental characteristics (i.e. the BREEAM-rating), quality characteristics, address, distance to local transport networks, transaction date, investor types and contract features. Ex ante, we have the following expectations concerning quality characteristics, contract features, market competition, investor types and location.
Quality characteristics: rental unit size will play a significant and positive role in price determination. In addition, standard hedonic features, like age, storeys, amenities and renovation are expected to have a significant and positive impact, where younger, taller and renovated buildings with amenities will have higher rental prices. Moreover, differences between the green and control sample may manifest from differences in building quality variables. In the UK, building quality is rated on a per floor basis. Thus, a building represents a collection of different building qualities. We expect that building quality will have a positive impact on prices and modifying impact on the value of certification.
Contract features: longer lease lengths signal longer durations in cash flows, which implies less fluctuation in tenants and more rental stability, conditional upon tenants’ credit quality. This suggests a positive impact on price. However, longer rent-free periods 6 can signal larger discounts in rental cash flows, thus reducing prices. Moreover, contract features potentially have a moderating effect on certification. Furthermore, prices may also be discounted when buildings are on the market for a longer period.
Market competition and gentrification: market competition may substantially influence rental prices in certified buildings. Literature on development suggests that competition plays a role in development decisions (see Grenadier, 2002; and Bulan et al., 2009, for the role of competition in influencing commercial real estate investments). We create a ‘certified building supply’ variable, which is a numerical measure of all BREEAM-certified buildings within a 500-metre radius at the time of renting or sale. The value of this variable is similar for the green building and all non-green buildings in a given cluster. Ex ante, as the number of certified buildings in a micro location increases, we anticipate moderating effects on the marginal rents and prices commanded by certified buildings. However, the literature on neighbourhood gentrification suggests that potential increases in social and middle-class environmental improvements can lead to positive new-build ‘gentrification’ for neighbourhoods or ‘super-gentrification’ (Butler and Lees, 2006). Thus, we suspect that increasing the number of renovated or new certified buildings in central London will add to the average locational value of a neighbourhood.
Investor types: theoretically, there should be no anticipated price difference for different investor types. However, principals and agents of financial capital may have different investment criteria and mandates. Principals, like private developers and investors, manage their own financial capital, whereas agents, such as real estate investment managers (for example, REITs), 7 institutional investors and municipal government investors manage financial capital on behalf of shareholders, trustees and communities. Thus, the type of investor may have an impact on prices.
Location: following standard methodology, we control for building location using post-codes and transport networks in London. London is broken down into London sub post-code units, the 1-3 letter prefix, which corresponds to its compass location. Transport stations (i.e. the UK’s national rail system, London tube stations and Docklands Light Rail) are geocoded using latitude and longitude, and station distances (within 500 m) to buildings are then calculated. To control for accessibility for drivers and cyclists, we use Ordnance Survey road networks to calculate metric unit distances to the buildings. The physical distances for tube stations, local roads and motorways have in the past had inconsistent impacts on commercial rents and prices (Debrezion et al., 2007), but may have an economically significant impact on prices for London.
Table 1 shows the dependent and independent variables used in the analysis, comparing the average characteristics of green buildings in the sample with buildings in the control sample. Certified buildings have higher achieved rents, on average, than control buildings, but the variability of rents is higher in green buildings. The size of leases in green buildings is larger, on average, than rental transactions in the control sample, by about 1100 square metres. More than half the certified sample is renovated, about double compared with the control sample. Amenities are available in 51 per cent of certified rentals and 68 per cent of control rentals. 8 Building quality variables suggest that over 75 per cent of the certified sample is new or renovated, which is comparable with the control sample. The distance to the nearest train stations within 500 metres from certified rentals is greater by 50 metres. It is interesting to note that green buildings are further from A roads and B roads on average, with comparable variability.
Comparison of certified buildings and control sample (standard deviations in parentheses)
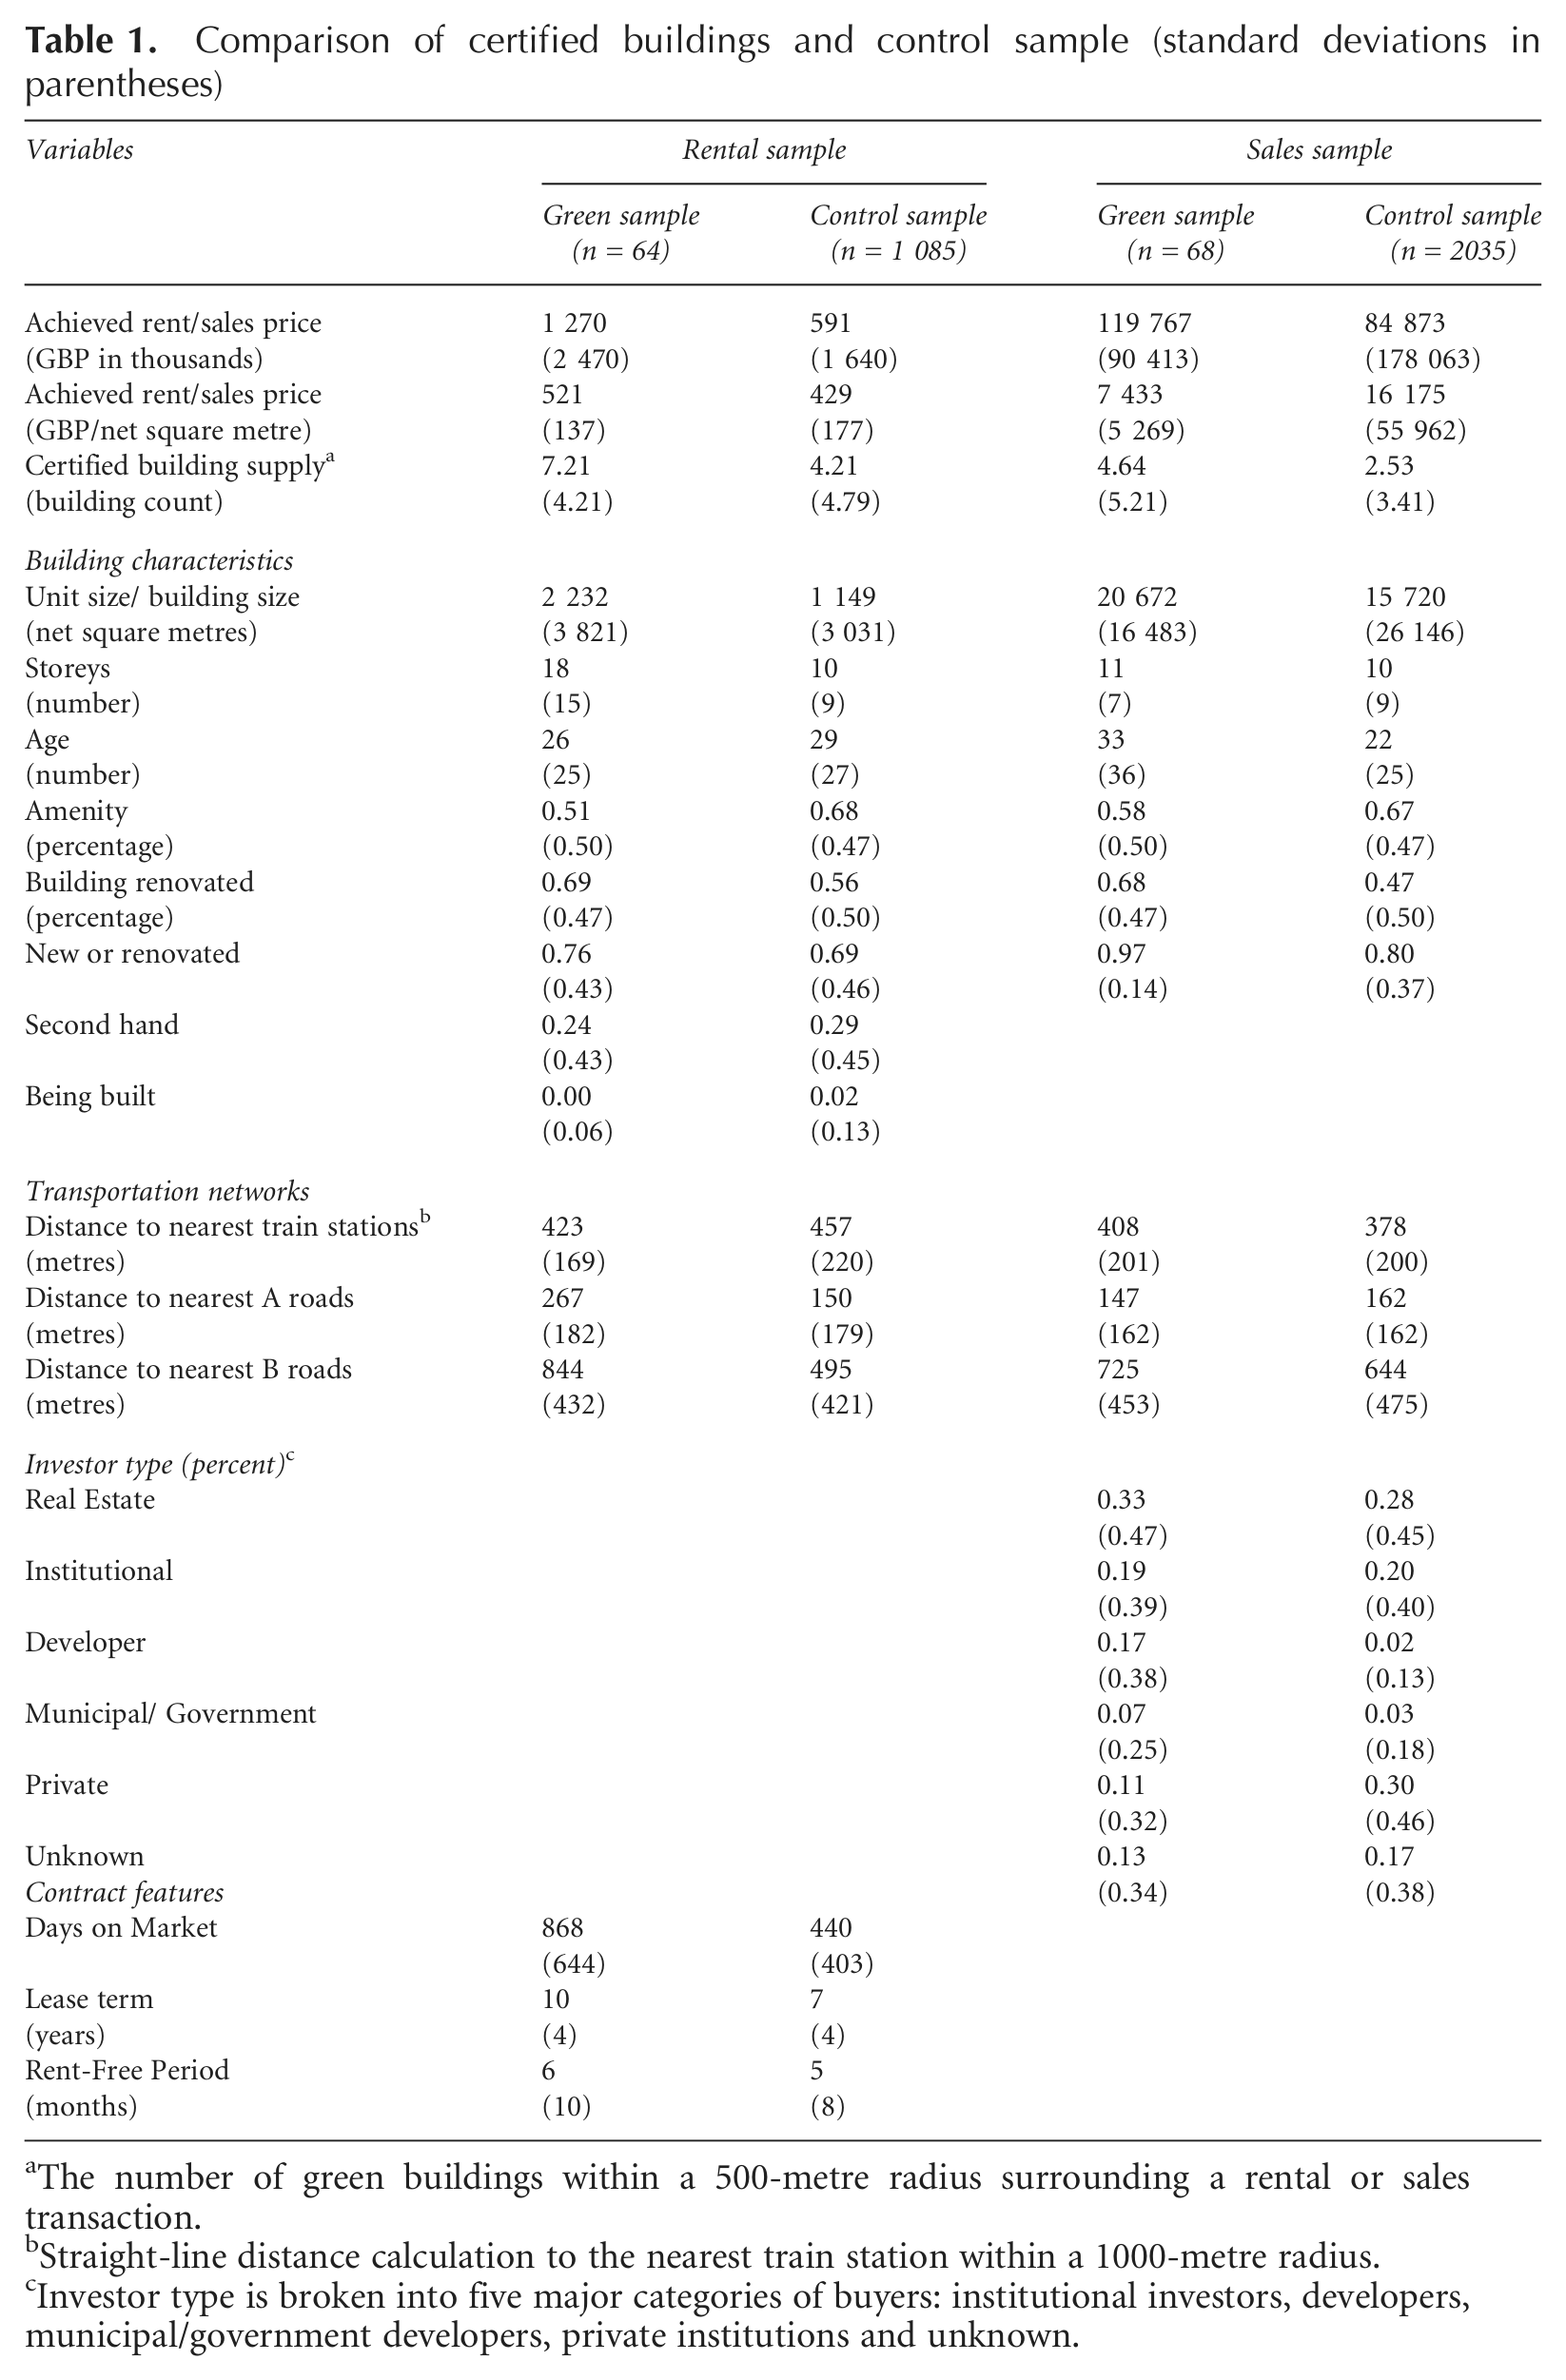
The number of green buildings within a 500-metre radius surrounding a rental or sales transaction.
Straight-line distance calculation to the nearest train station within a 1000-metre radius.
Investor type is broken into five major categories of buyers: institutional investors, developers, municipal/government developers, private institutions and unknown.
The average lease length in green properties is longer by almost three years and with variability comparable with that of the control sample, but the rent-free period is longer by about three months, with greater variation than control rentals. The average number of days that certified buildings are on the market is longer. The ‘certified building supply’ variable shows that, on average, certified properties have seven other certified buildings in their immediate area at the time of the rental transaction, whereas control rentals have, on average, four green buildings in their immediate neighbourhood.
In our sample, 52 per cent of certified buildings are owned by a real estate or institutional investor, as compared with 48 per cent of control buildings. Moreover, the municipal and government sector owns just 7 per cent of the buildings in the sample.
Non-parametric comparisons between the sample of certified transactions and the sample of non-certified transactions yield similar results. The variable approximating competition in the sales transaction market is noteworthy. For certified buildings, there are on average five green buildings in a given 500-square-metre radius at the time of transaction, while the control sample has only three such buildings, on average.
4. Method
We investigate the economic implications of environmental certification for London commercial office buildings through an ex post transaction-based hedonic model (Rosen, 1974). We use the sample of BREEAM-rated office buildings and a control sample of conventional office buildings to estimate a semi-log equation relating the office rents per net square metre (or the selling price per net square metre) to the hedonic characteristics of a building

where, the dependent variable is the logarithm of the rental price (selling price) per net square metre
We estimate equation (1) using OLS corrected for heteroscedasticity with clustered standard errors (White, 1980), but employ propensity score weighting techniques to minimise bias between the BREEAM-certified and control buildings. In our application, propensity score weighting aims to minimise the selection bias between certified and non-certified buildings by differentiating based on individual building characteristics. Conditional upon observable characteristics, we eliminate differences between ‘treated’ green buildings and ‘non-treated’ control buildings by estimating the propensity of receiving a BREEAM rating for all buildings in the sales and rental samples, using a logit model (Black and Smith, 2004). The propensity score specification includes all hedonic characteristics available for each sample and the resulting propensity score is subsequently applied as a weight in the regression of equation (1) (see also Eichholtz et al., 2013).
In the second part of our analysis, we document the impact of the supply of BREEAM-rated buildings on transactions prices. We investigate how local certified building competition acts as a moderator to rental and transaction prices in general, and how this may moderate BREEAM-certified rented and transacted properties in particular. Following Brambor et al. (2006), we examine the interaction effects between certification and the market competition for certified buildings

where, equation (2) introduces
To assess the impact of a larger existing supply of green buildings on the effect of certified prices, we calculate

where, equation (3) is the marginal effect of certified rents or prices conditional upon the existing green building supply. To support the robustness of the conditional marginal effect analysis, we introduce confidence interval bands for statistical significance and use kernel density estimators to show the density of the green building supply.
5. Results
5.1 Green Buildings and Rental Rates
Table 2 presents the regression results for the rental sample, relating the logarithm of rent per net square metre of commercial office space to a set of hedonic characteristics, neighbourhood controls and contract features. These specifications explain almost 60 per cent of the variation in the logarithm of rents per net square metre with an adjusted R2 ranging from 59 to 62 per cent.
Office rents for BREEAM-certified buildings (dependent variable: logarithm of rental price per net square metre; N = 1149)
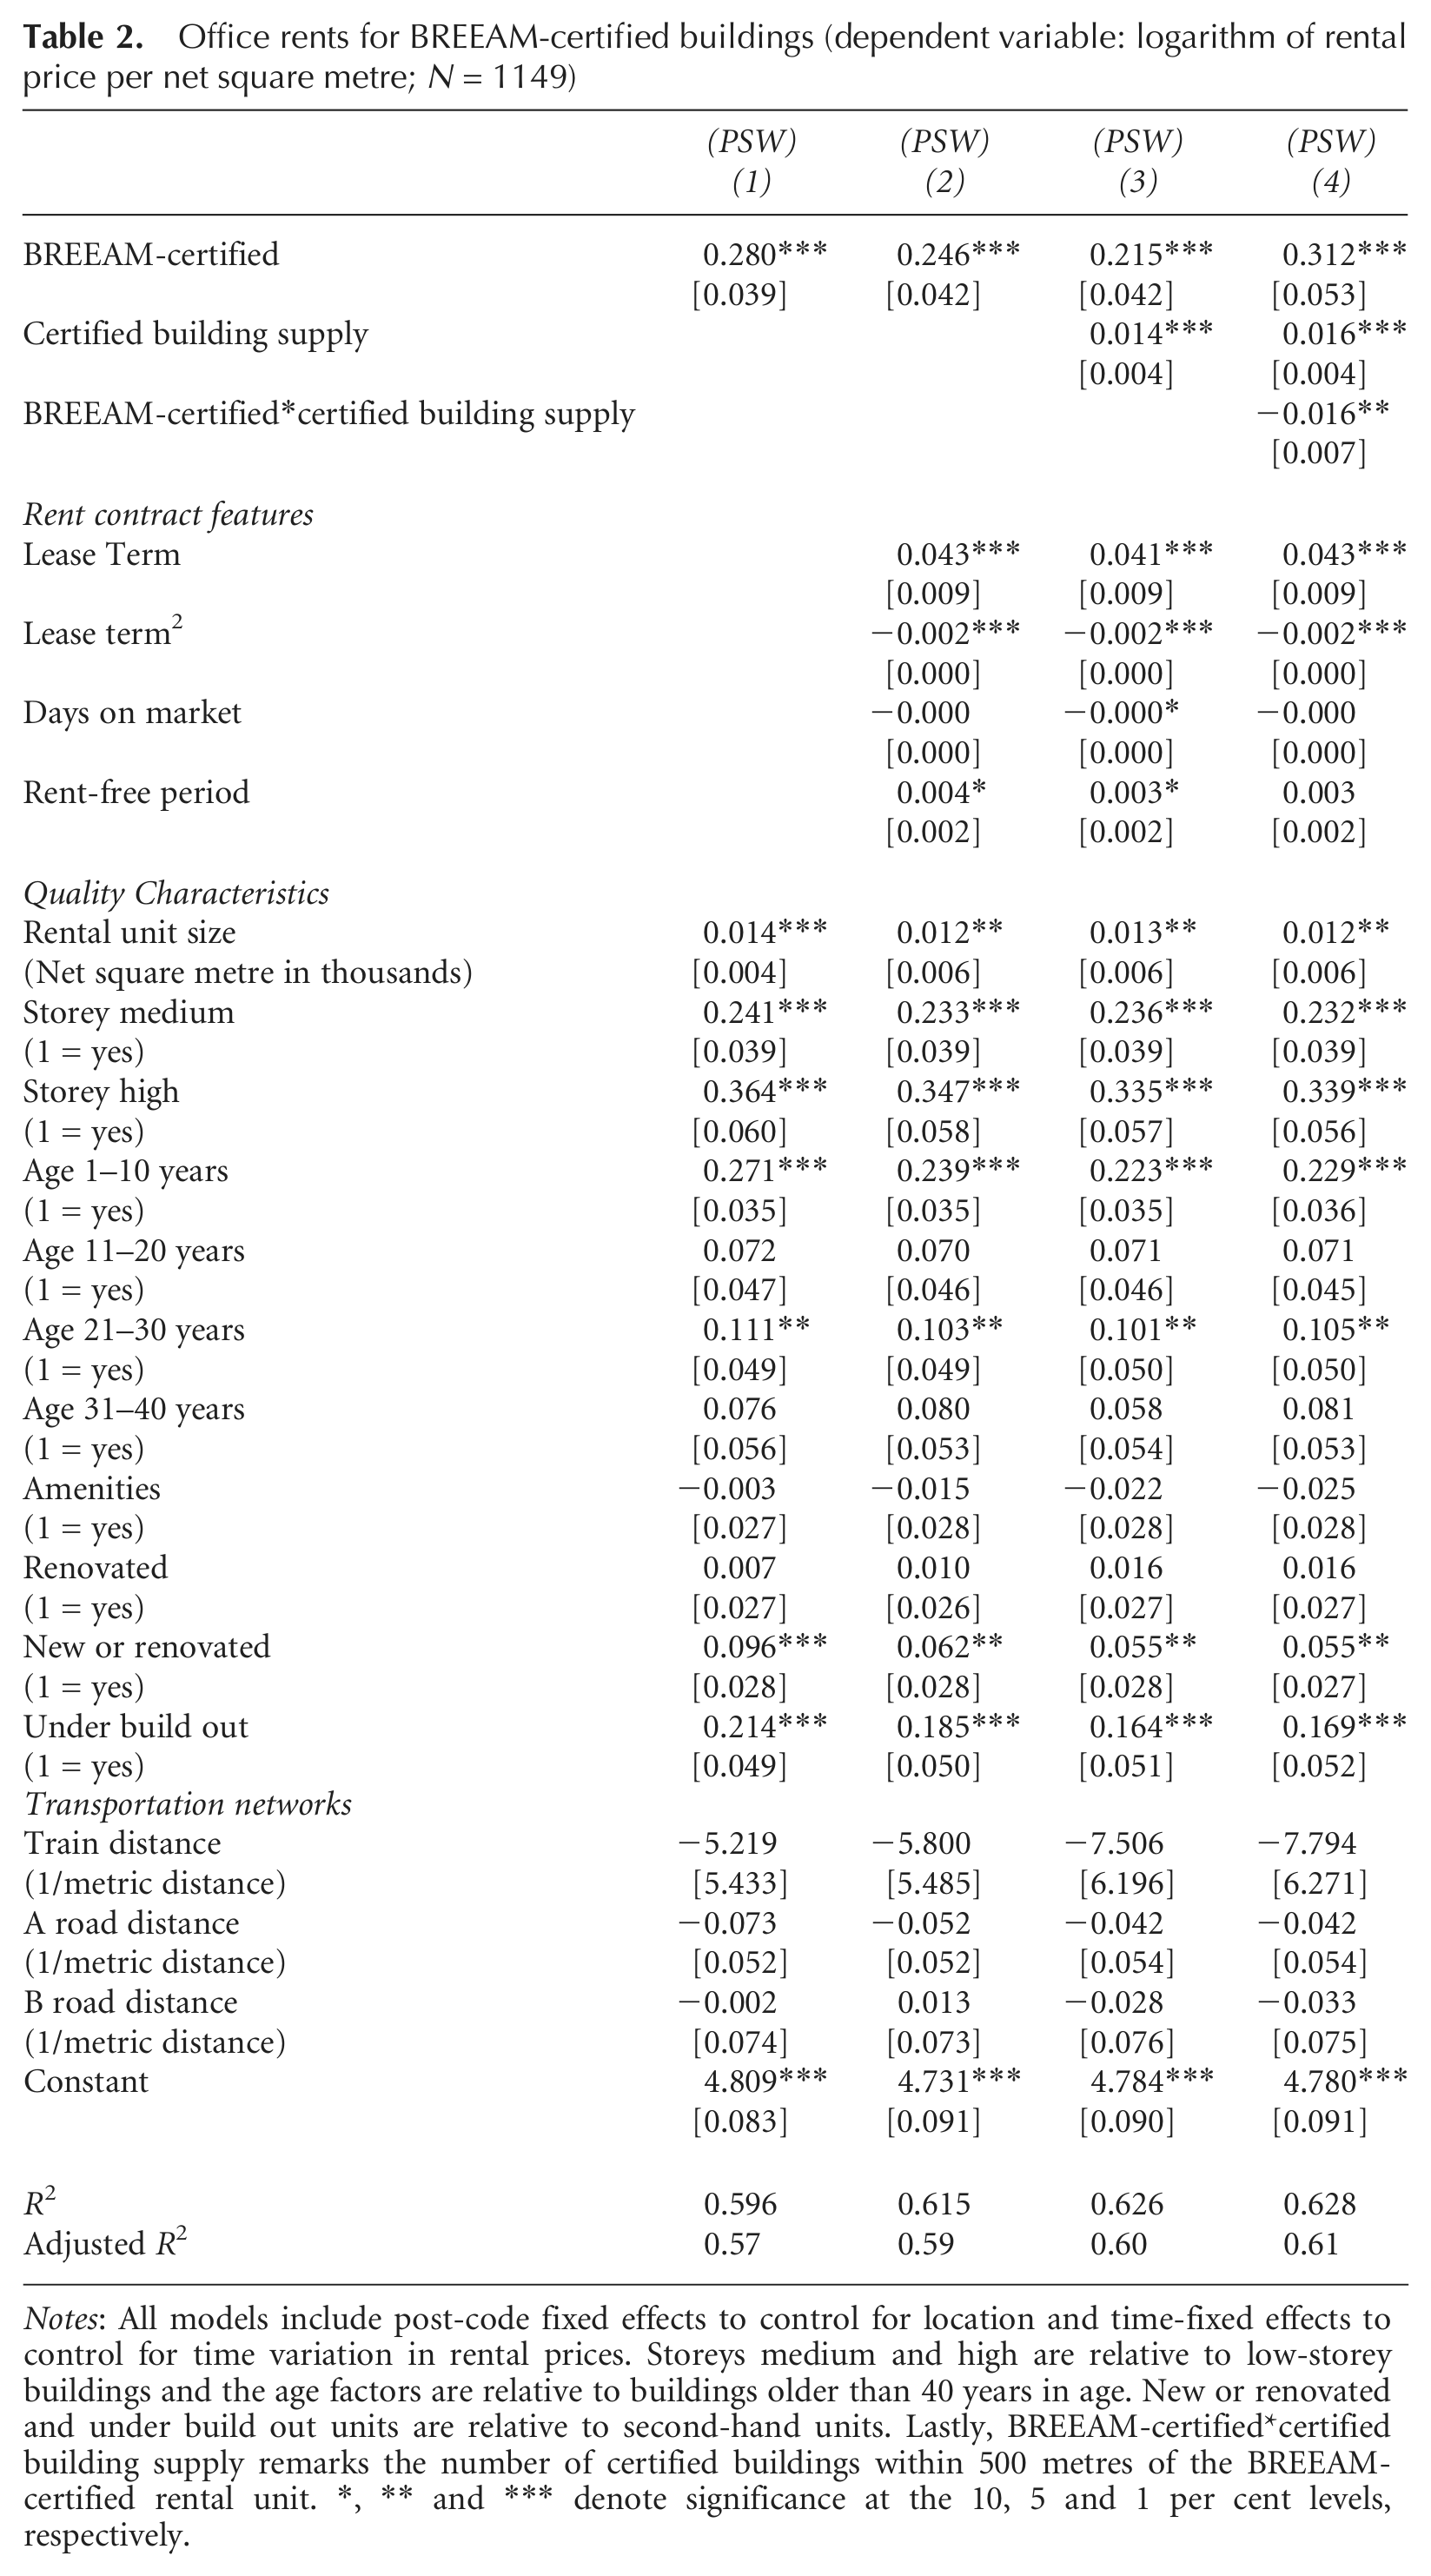
Notes: All models include post-code fixed effects to control for location and time-fixed effects to control for time variation in rental prices. Storeys medium and high are relative to low-storey buildings and the age factors are relative to buildings older than 40 years in age. New or renovated and under build out units are relative to second-hand units. Lastly, BREEAM-certified*certified building supply remarks the number of certified buildings within 500 metres of the BREEAM-certified rental unit. *, ** and *** denote significance at the 10, 5 and 1 per cent levels, respectively.
Column (1) reports the propensity-weighted results for the hedonic specification relating office rents to the hedonic characteristics—i.e. rental size, age, storeys, amenities, renovation, unit quality, transport networks, time-fixed effects and postcode fixed effects. The coefficient on rental size is positive and significant: larger spaces command higher rental rates per net square metre. Buildings greater than 10 storeys or 20 storeys transact for 24–36 per cent more than those less than 10 storeys, respectively. For buildings less than 10 years old, rents are 27 per cent higher relative to buildings more than 40 years old. The amenities dummy is negative, but insignificant. Regarding building quality, there is a 9.6 per cent premium for new or refurbished units compared with second-hand units.
Importantly, keeping constant the observable characteristics, the green certification dummy is positive and significant. BREEAM-certified properties command a 28 per cent premium over non-certified properties.
In column (2), we add control variables for rental contract features to the hedonic specification. The term structure of leases has an impact on rent levels: the rent per net square metre increases at a rate of 4.3 per cent per additional year of lease, but the term structure is non-linear. Thus, the maximum achieved rent is realised at lease duration of about 12 years and the marginal increase in rent becomes zero once lease lengths surpass 11.5 years. The number of days that a unit is on the market has no significant impact on achieved rents, whereas rent-free periods have a statistically significant and positive impact on rents. Rental contract features have a moderating effect on the certification coefficient, decreasing the green rental premium by almost four percentage points.
In column (3), the specification is reported with further controls for the local supply of certified buildings. The variables for ‘BREEAM-certified’ and ‘certified building supply’ are jointly significant at the 1 per cent level. The ‘certified building supply’ does not have a substantial impact on the hedonic parametres. However, as the number of observed certified buildings within the transacted building’s micro location increases, average rents per net square metre increase by 1.4 per cent in the neighbourhood, which provides some evidence on a ‘green gentrification’ effect.
In column (4), the specification is reported with an interaction term for ‘BREEAM-certified’ and ‘certified building supply’. Isolating the effect of green building competition in the specification shows that each additional green building in a cluster decreases the marginal effect of certification by some 1.6 per cent, ceteris paribus. At the average number of certified buildings (7.21), the marginal rent commanded by a green building, relative to non-green buildings in the same neighbourhood, is 19.7 per cent.
Figure 2 shows the results of the conditional marginal effects analysis. There are three axes: the left vertical axis depicts the beta coefficient of the conditional marginal effect; the horizontal axis is the ‘certified building supply’ (the number of BREEAM-certified buildings within 500 metres at the time of renting); and the right vertical axis represents the ‘certified building supply’s’ univariate kernel density estimate. The kernel density estimate is a non-parametric estimation of the probability density function.
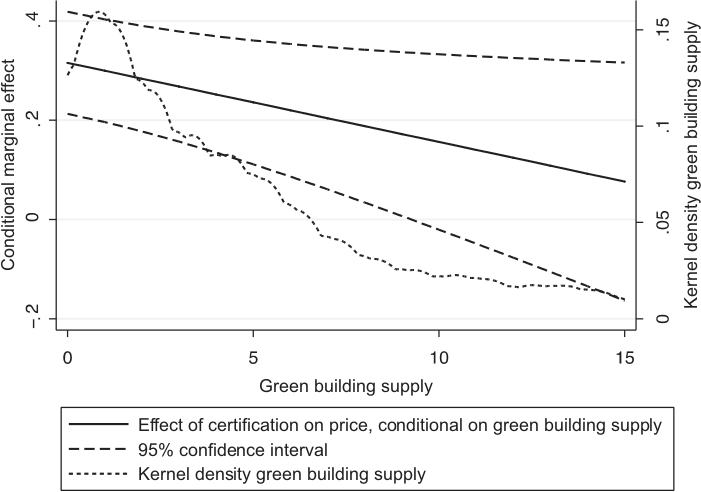
Marginal effects of certified building supply (number of green buildings within a 500-metre radius): rental sample (2005–09 Period).
In the figure, the dotted line depicts the kernel density of the certified building supply. From left to right, about 15 per cent of units have at least two certified buildings within 500 metres and less than 5 per cent of the sample has more than six certified buildings surrounding them. The solid line shows the change in rents per net square metre for certified units when the ‘certified building supply’ increases. Thus, when the number of certified buildings in a cluster increases, the green premium decreases by 1.6 per cent, on average. 9 From confidence interval bounds, the interaction term (BREEAM-certified*certified building supply) is statistically significant until approximately 9 buildings, where the premium is still positive, but substantially lower.
5.2 Green Buildings and Transaction Prices
Table 3 presents the results for the sales sample, relating the logarithm of sales price per net square metre of office buildings to a set of hedonic characteristics, investor types and neighbourhood controls. These specifications explain about 22 per cent of the variation in the sales price per net square metre.
Office sales for BREEAM-certified buildings (dependent variable: logarithm of sales price per net square metre; N = 2103)
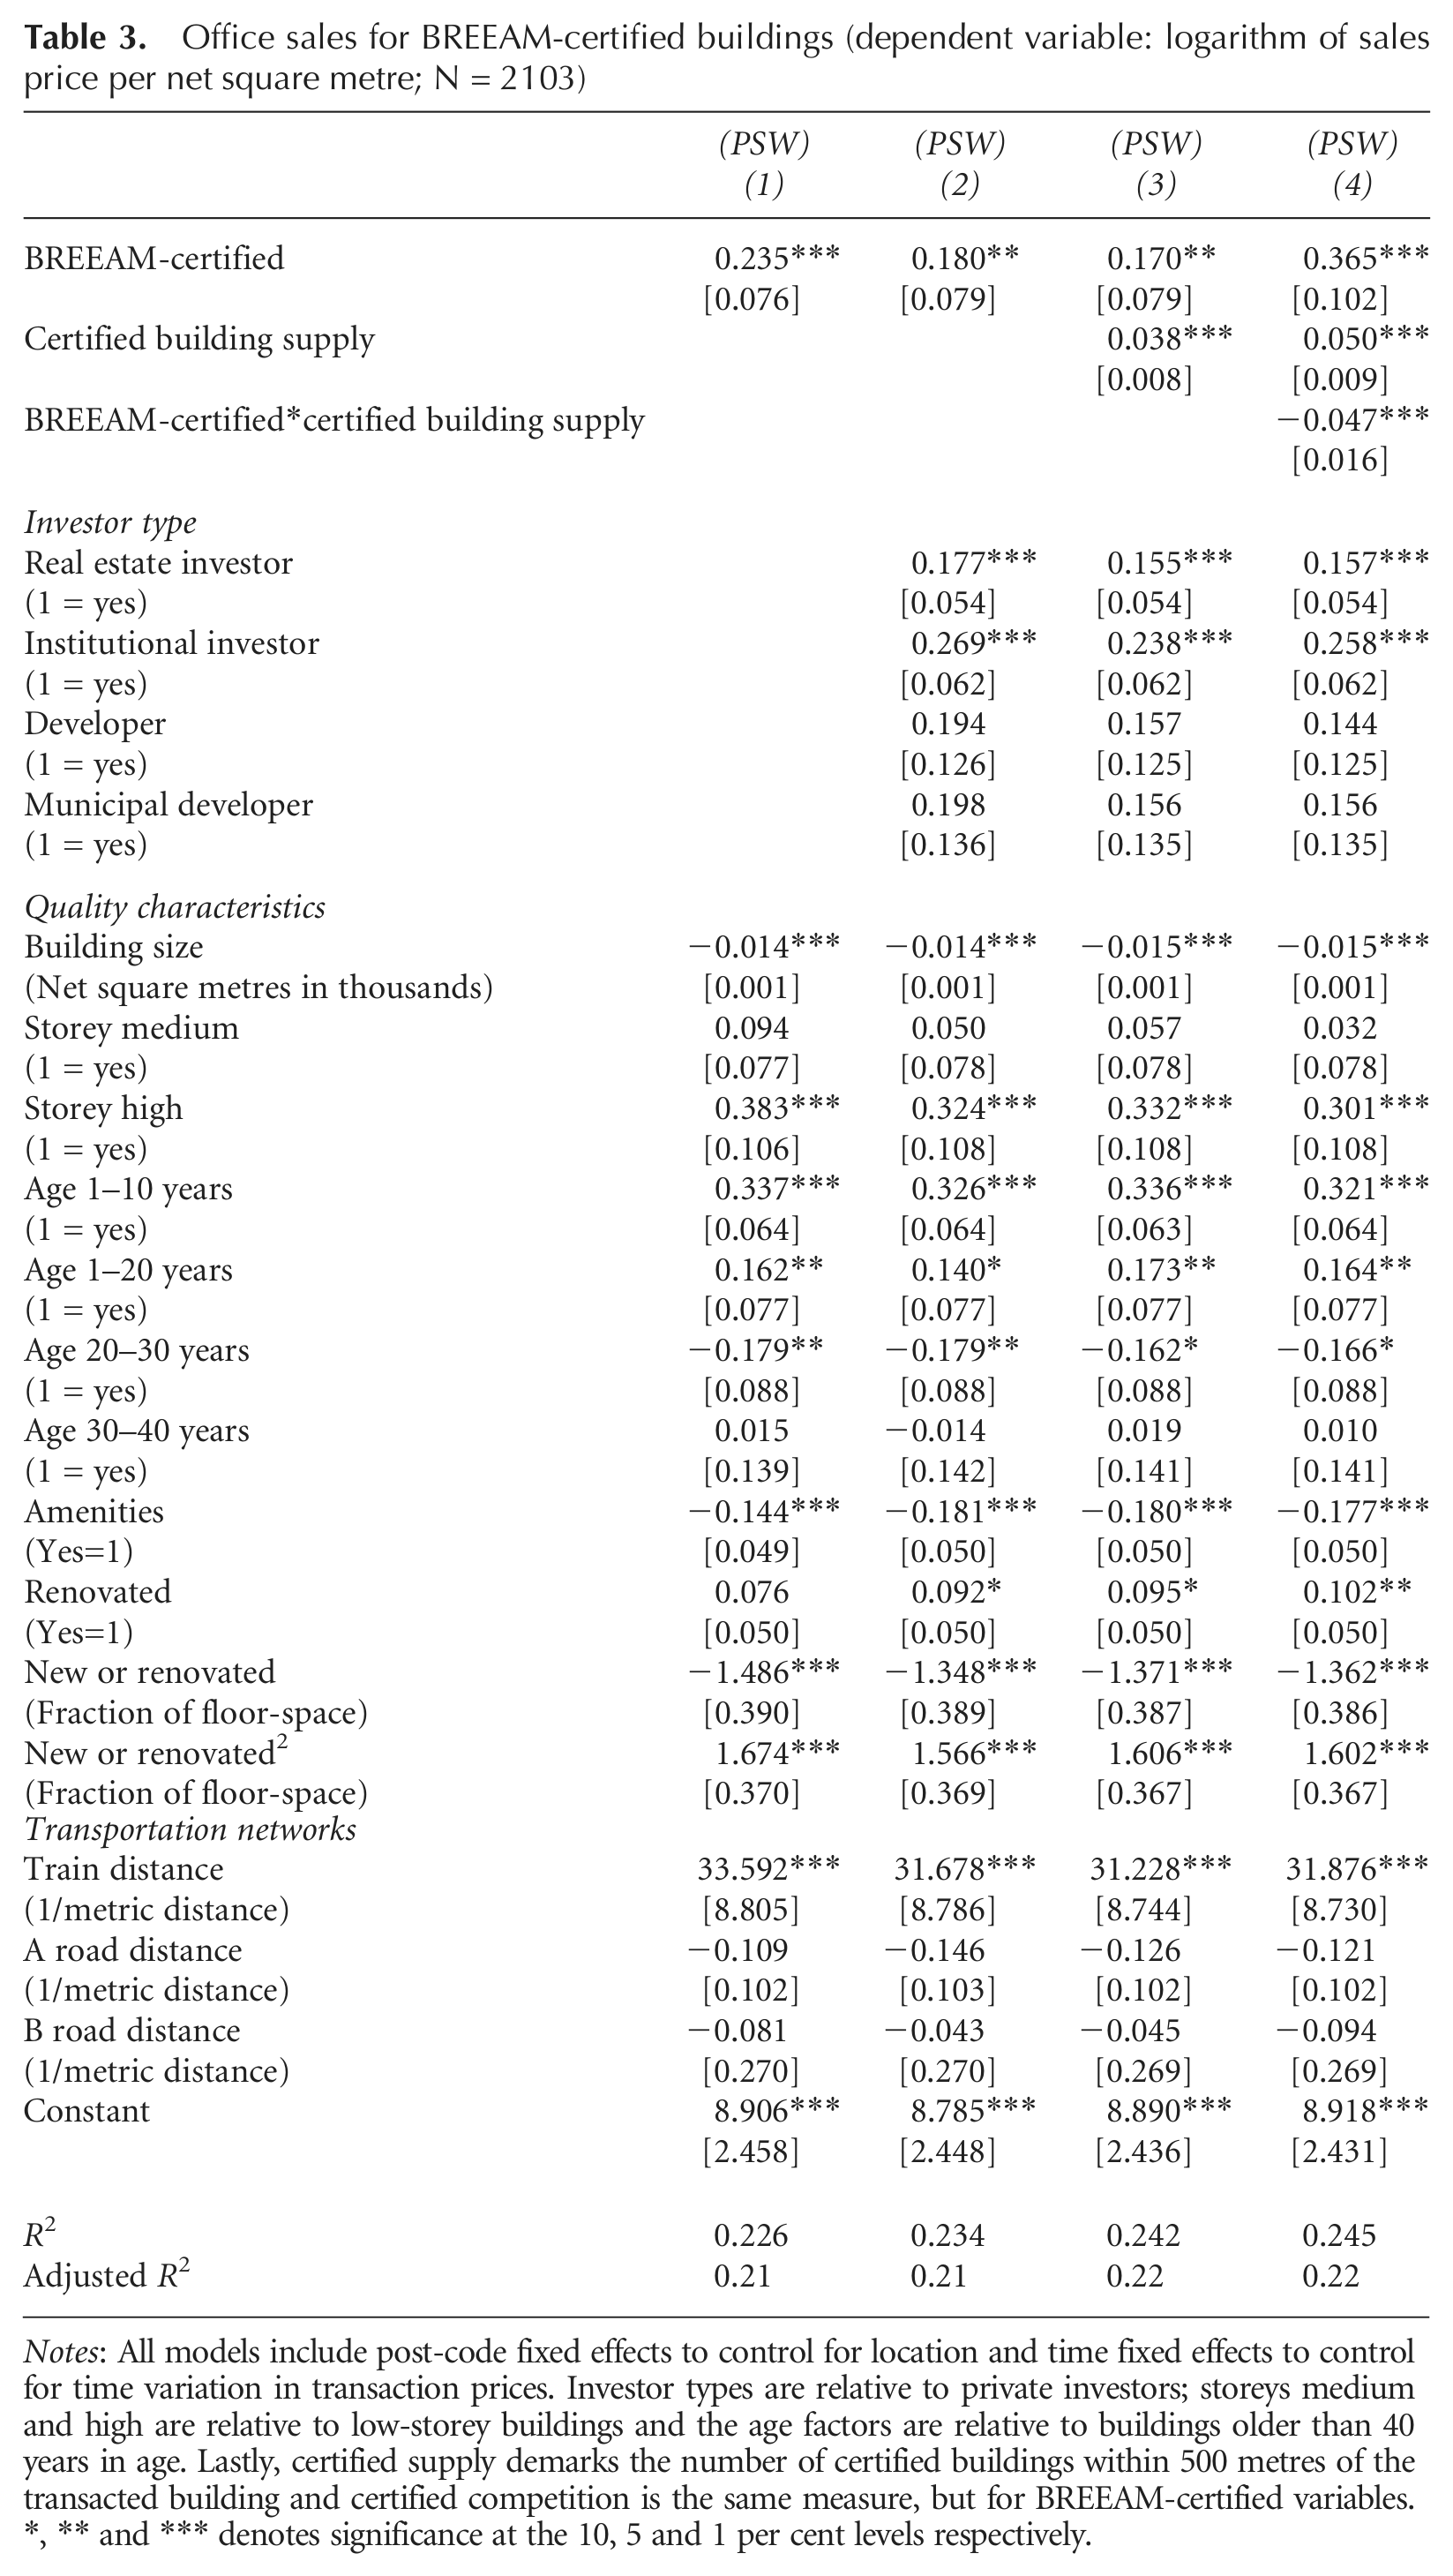
Notes: All models include post-code fixed effects to control for location and time fixed effects to control for time variation in transaction prices. Investor types are relative to private investors; storeys medium and high are relative to low-storey buildings and the age factors are relative to buildings older than 40 years in age. Lastly, certified supply demarks the number of certified buildings within 500 metres of the transacted building and certified competition is the same measure, but for BREEAM-certified variables. *, ** and *** denotes significance at the 10, 5 and 1 per cent levels respectively.
Column (1) reports the propensity-weighted hedonic specification relating sales prices to hedonic qualities—i.e. size, age, storeys, amenities, renovation, building quality, transport networks, post-code fixed effects and time-fixed effects.
Building size has a negative and significant impact on transaction price, with transaction prices decreasing by 1.4 per cent as building size increases by 1000 square metres. Relative to buildings more than 40 years old, buildings constructed after 2000 transact at a premium and buildings from the 1980s transact at a discount. The variable for new and renovated buildings (as a percentage of floor space) is significantly negative, suggesting that, as new and renovated floor space increases, there is a negative relationship with price, but other (unreported) specifications indicate that this is mostly due to second-hand space. Lastly, transport networks (i.e. the proximity of buildings to a station) have a positive impact on prices, but road networks, while modifying other parametres, are insignificant. In central London, public transport matters more than accessibility by car. Comparable results have been documented for the Dutch office market (Kok and Jennen, 2012).
Most importantly, the ‘BREEAM-certified’ coefficient is positive and significant, suggesting that BREEAM-certified buildings transacted at a 24 per cent premium during the sample period, after controlling for observable differences in building quality and location.
In column (2), investor types are added to the specification. Relative to private investors, real estate investors and institutional investors paid more for commercial real estate during the sample period. In addition, when adding investor types, the premium for certified real estate decreases to 18 per cent. Controlling for the identity of the buyer is an important moderating factor in determining the economic value of green buildings in the marketplace.
In column (3), the ‘certified building supply’ measure is added to the specification. Controlling for ‘certified building supply’ has a positive and significant impact on the average transaction price in the cluster, resulting in a 3.8 per cent increase in transaction price per net square metre. This reinforces the gentrification effect of green buildings previously documented for the rental results. Including ‘certified building supply’ has a moderating effect on the green premium, decreasing the coefficient by one percentage point. The ‘BREEAM certified’ and ‘certified building supply’ parametres are jointly significant at the 1 per cent level.
In column (4), the interaction term is added to the transaction price specification. The green gentrification effects remain, but the results show that the marginal effect of green building certification decreases when more green buildings come on the market at a given location. At the average number of certified buildings (4.64), the marginal effect of green building certification is 14.7 per cent, relative to non-green buildings in the same neighbourhood.
Figure 3 presents the results of the conditional marginal effects analysis. In the figure, the marginal effect of the sales price per net square metre and the ‘certified building supply’ are shown. In the figure, the dotted line depicts the kernel density of the ‘certified building supply’. From left to right, about 30 per cent of observations have at least two certified buildings within 500 metres and less than 5 per cent of the sample has more than six certified buildings surrounding them. The solid line shows the marginal effect of the sales price per net square metre, given that the building is certified, with the certified building supply. As certified buildings in a cluster increase, the green premium decreases, by 4.7 per cent on average. The certified green building supply result is statistically significant until approximately eight buildings, where the premium is still positive, but reduced substantially.
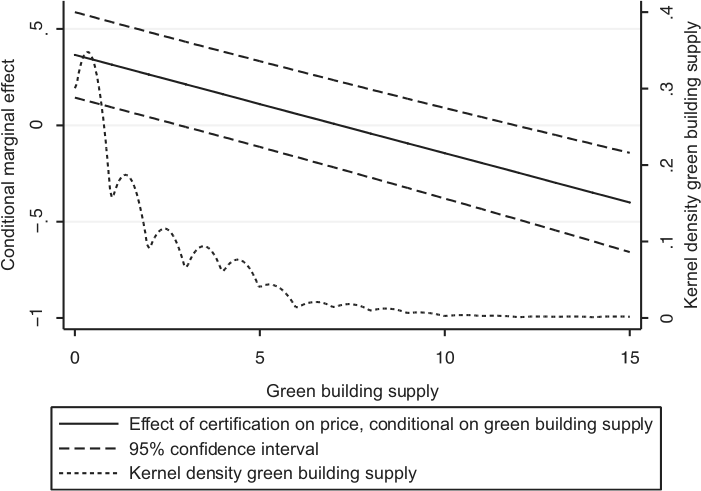
Marginal effects of certified building supply (number of green buildings within a 500-metre radius): transaction sample (2000–09 period).
5.3 Additional Analysis
The marginal effects documented for environmentally certified real estate in the UK are generally in line with the literature investigating the economic outcomes of LEED and Energy Star certification in US commercial markets. However, Eichholtz et al. (2010) specifically control for building quality using the Building Owners and Managers Association (BOMA) building class definitions and document significant reductions in the marginal effects of green building certification when including these quality controls. In the Tokyo residential real estate market, Yoshida and Sugiura (2011) control for residential building quality and show that this building quality variable accounts for a large part of the green premium. Their results find bias and inconsistency in the event of exclusion of such quality indicators.
In the dataset at hand, building quality measures, such as independently assessed building structural features and building management quality, are measured by building quality proxies other than the definitions of the US BOMA. In Europe and in the UK, the existing quality proxies are not independent, third-party measures and are not applied consistently across all databases and buildings.
Controls for building quality are critical to filter out quality differences in hedonic specifications, since it would not be surprising for BREEAM “Excellent” or “Very Good” rated buildings to be classified as “Institutional Grade” or “Class A” office space. Given the extensive attention to finishes, lighting and other measures in BREEAM “Very Good” and “Excellent” buildings, these ratings may in fact be proxies for building quality controls and synonyms for ‘institutional’ grade real estate.
To analyse further the effect of lacking quality characteristics on the magnitude of premiums documented in this paper, we test how certification premiums for US cities would be affected by the removal of building quality controls and compare our results with those for New York City, Chicago and Washington, DC, using data from Eichholtz et al. (2013). 10 Results of the propensity score weighted hedonic specification for LEED and Energy Star buildings are reported in the Appendix (Table A1). Summarising, when third-party building quality controls are excluded from the hedonic specification, the certified premiums for LEED and Energy Star are substantially larger. The results for these three main US cities indicate that, when we do not control for building quality, results are comparable with the London specifications. Thus, future studies that acquire a more standardised documentation of building quality measures may find substantially lower marginal effects for green office buildings in the London commercial property market.
6. Conclusion and Discussion
Intervention from governments and special interest-groups to achieve higher levels of energy efficiency for the property sector in general, and the UK in particular, has increased substantially over the past decade. New construction or retrofits by the UK government are required to be BREEAM-certified and should have both EPC and DEC labels. New building codes incorporate stricter energy efficiency mandates and, by 2018, all new construction must adhere to zero-carbon standards. Ultimately, this will have a substantial impact on the supply of green buildings and the competition within that market. The advent of the Carbon Reduction Commitment in 2012, in which capital market investors and tenants are responsible for buildings’ CO2 emissions, represents another nudge towards increased demand for energy efficient real estate, and can only increase the salience of sustainability for the commercial property sector.
This paper investigates the financial performance of London’s rapidly evolving environmentally certified commercial building stock, within the context of a dynamic supply and demand framework as measured by ex post sales transactions and achieved rents over the 2000–09 period. We document that, at the point of means, BREEAM certification in the London office market results in a premium of 19.7 per cent for rents and 14.7 per cent for sales transactions, relative to non-certified buildings in the same neighbourhood. Importantly, this marginal effect is conditional upon the lease conditions and the identity of the acquirer. We show that growth in green building supply has an economically significant impact on London’s commercial real estate prices in general and on certified real estate in particular. From 2000 to 2009, stand-alone green building rents and transaction prices were higher relative to non-green buildings in the same neighbourhood. However, non-green buildings that were a part of those neighbourhoods were able to capture some of the gentrification benefits, through higher average location rents and prices. Importantly, buildings increasingly feature green credentials, but late entrants do not realise the same rental and price premiums as early adopters, as the marginal effect of certification relative to non-green buildings in the neighbourhood decreases as the number of certified buildings increases.
Over the sample period, the supply of green buildings expanded by 1.8 per cent, resulting in some 1600 green office buildings in 2010. Within the UK, London had the highest growth in certified real estate where the supply expanded to 368 buildings as of 2010, with an average of seven (five) certified buildings for a given neighbourhood, at the time of a certified rental (sales) transaction. Within the context of London, where buildings transact with an increasing supply of green buildings surrounding them, it is thus important to take into consideration the diffusion of environmentally certified real estate. However, real estate supply in the UK is highly regulated, with British regulatory policies that limit development creating considerable supply-side restrictions in the commercial real estate market (Cheshire and Hilber, 2008). The geographical spread of green building in the UK confirms the theory of slow diffusion and, in the absence of market equilibrium, there may still be profitable investment opportunities for green buildings in local UK markets.
Of course, green premiums may reflect increased construction or renovation costs—i.e. demand-side responses to changes in supply. To date, there is limited systematic evidence reporting on the marginal construction costs of environmentally certified real estate in the UK and US commercial real estate sector. 11 Furthermore, the transaction costs associated with certification, consulting, design fees, contingencies and development are largely unavailable (Fisher and Bradshaw, 2011). Unfortunately, current transaction cost data are insufficient for meaningful statistical inferences. Thus, future research incorporating construction and redevelopment cost may provide a better understanding of the ROI related to investments in green building.
The results of this paper provide the first evidence on the economic outcomes from investments in energy efficiency and sustainability in the UK marketplace. There is currently a measurable premium for developers and investors that take their green buildings to market, but future outcomes are contingent upon new development, existing building regulations and the drive for energy efficiency by the UK government. Importantly, communities are gaining from the advance of green buildings in their surroundings on three fronts. First, green buildings in London are designed for reduced energy consumption, carbon emissions and waste. Secondly, green buildings have a positive price impact (i.e. gentrification) on their peers, which can increasingly improve neighbourhoods. Finally, as green buildings increasingly diffuse and cluster, more and more buildings will need to compete on energy efficiency and sustainability metrics, where premiums for green will become discounts for non-green, ‘brown’ buildings. In combination, these positive economic externalities from green buildings in the commercial property sector can help to mitigate the substantial negative externalities that buildings impose on the environment.
Footnotes
Appendix
The value of green certification in US cities (dependent variable: logarithm of sales price per square foot)
| (1) | (2) | (3) | (4) | |
|---|---|---|---|---|
| Full sample | Chicago | Washington | New York | |
| Green certification | 0.133*** | 0.324*** | 0.334*** | 0.245 |
| [0.0167] | [0.0591] | [0.0594] | [0.153] | |
| Quality characteristics | ||||
| Class A | 0.213*** | |||
| (1 = yes) | [0.0409] | |||
| Class B | −0.0377 | |||
| (1 = yes) | [0.0336] | |||
| Building size | −0.0487*** | −0.123*** | −0.170*** | 0.0155 |
| (log) | [0.00989] | [0.0415] | [0.0215] | [0.0647] |
| Age 0–5 years | −0.0242 | 0.110 | 0.0403 | −1.911 |
| (1 = yes) | [0.0445] | [0.122] | [0.0768] | [1.178] |
| Age 5–10 years | 0.353*** | 0.427*** | 0.655*** | −0.317 |
| (1 = yes) | [0.0344] | [0.0945] | [0.0827] | [0.222] |
| Age 10–20 years | 0.115*** | 0.0630 | 0.230*** | 0.555*** |
| (1 = yes) | [0.0330] | [0.110] | [0.0770] | [0.189] |
| Age 20–30 years | 0.0870*** | −0.275*** | 0.224*** | 0.308** |
| (1 = yes) | [0.0262] | [0.0866] | [0.0609] | [0.129] |
| Age 30–40 years | 0.0449 | −0.124* | 0.149** | 0.162 |
| (1 = yes) | [0.0290] | [0.0728] | [0.0644] | [0.162] |
| Renovated | 0.0154 | 0.0675 | 0.0231 | 0.405*** |
| (1 = yes) | [0.0191] | [0.0443] | [0.0364] | [0.123] |
| Storey medium | 0.167*** | 0.474*** | 0.345*** | −0.901*** |
| (1 = yes) | [0.0232] | [0.109] | [0.0441] | [0.215] |
| Storey high | 0.338*** | 1.170*** | 0 | −0.611*** |
| (1 = yes) | [0.0285] | [0.124] | [0] | [0.231] |
| Amenities | 0.0324* | −0.337*** | −0.146*** | 0.132 |
| (1 = yes) | [0.0189] | [0.0586] | [0.0389] | [0.103] |
| Transportation networks | ||||
| Public transport | −0.124*** | −0.471*** | −0.259*** | −0.198 |
| (1 = yes) | [0.0263] | [0.0733] | [0.0680] | [0.129] |
| Constant | 5.078*** | 5.332*** | 7.221*** | 6.251*** |
| [1.952] | [0.511] | [0.282] | [0.751] | |
| Year fixed effects | Yes | Yes | Yes | Yes |
| Observations | 5993 | 615 | 597 | 363 |
| Green | 686 | 34 | 22 | 16 |
| R 2 | 0.662 | 0.731 | 0.442 | 0.386 |
| Adjusted R2 | 0.616 | 0.705 | 0.404 | 0.327 |
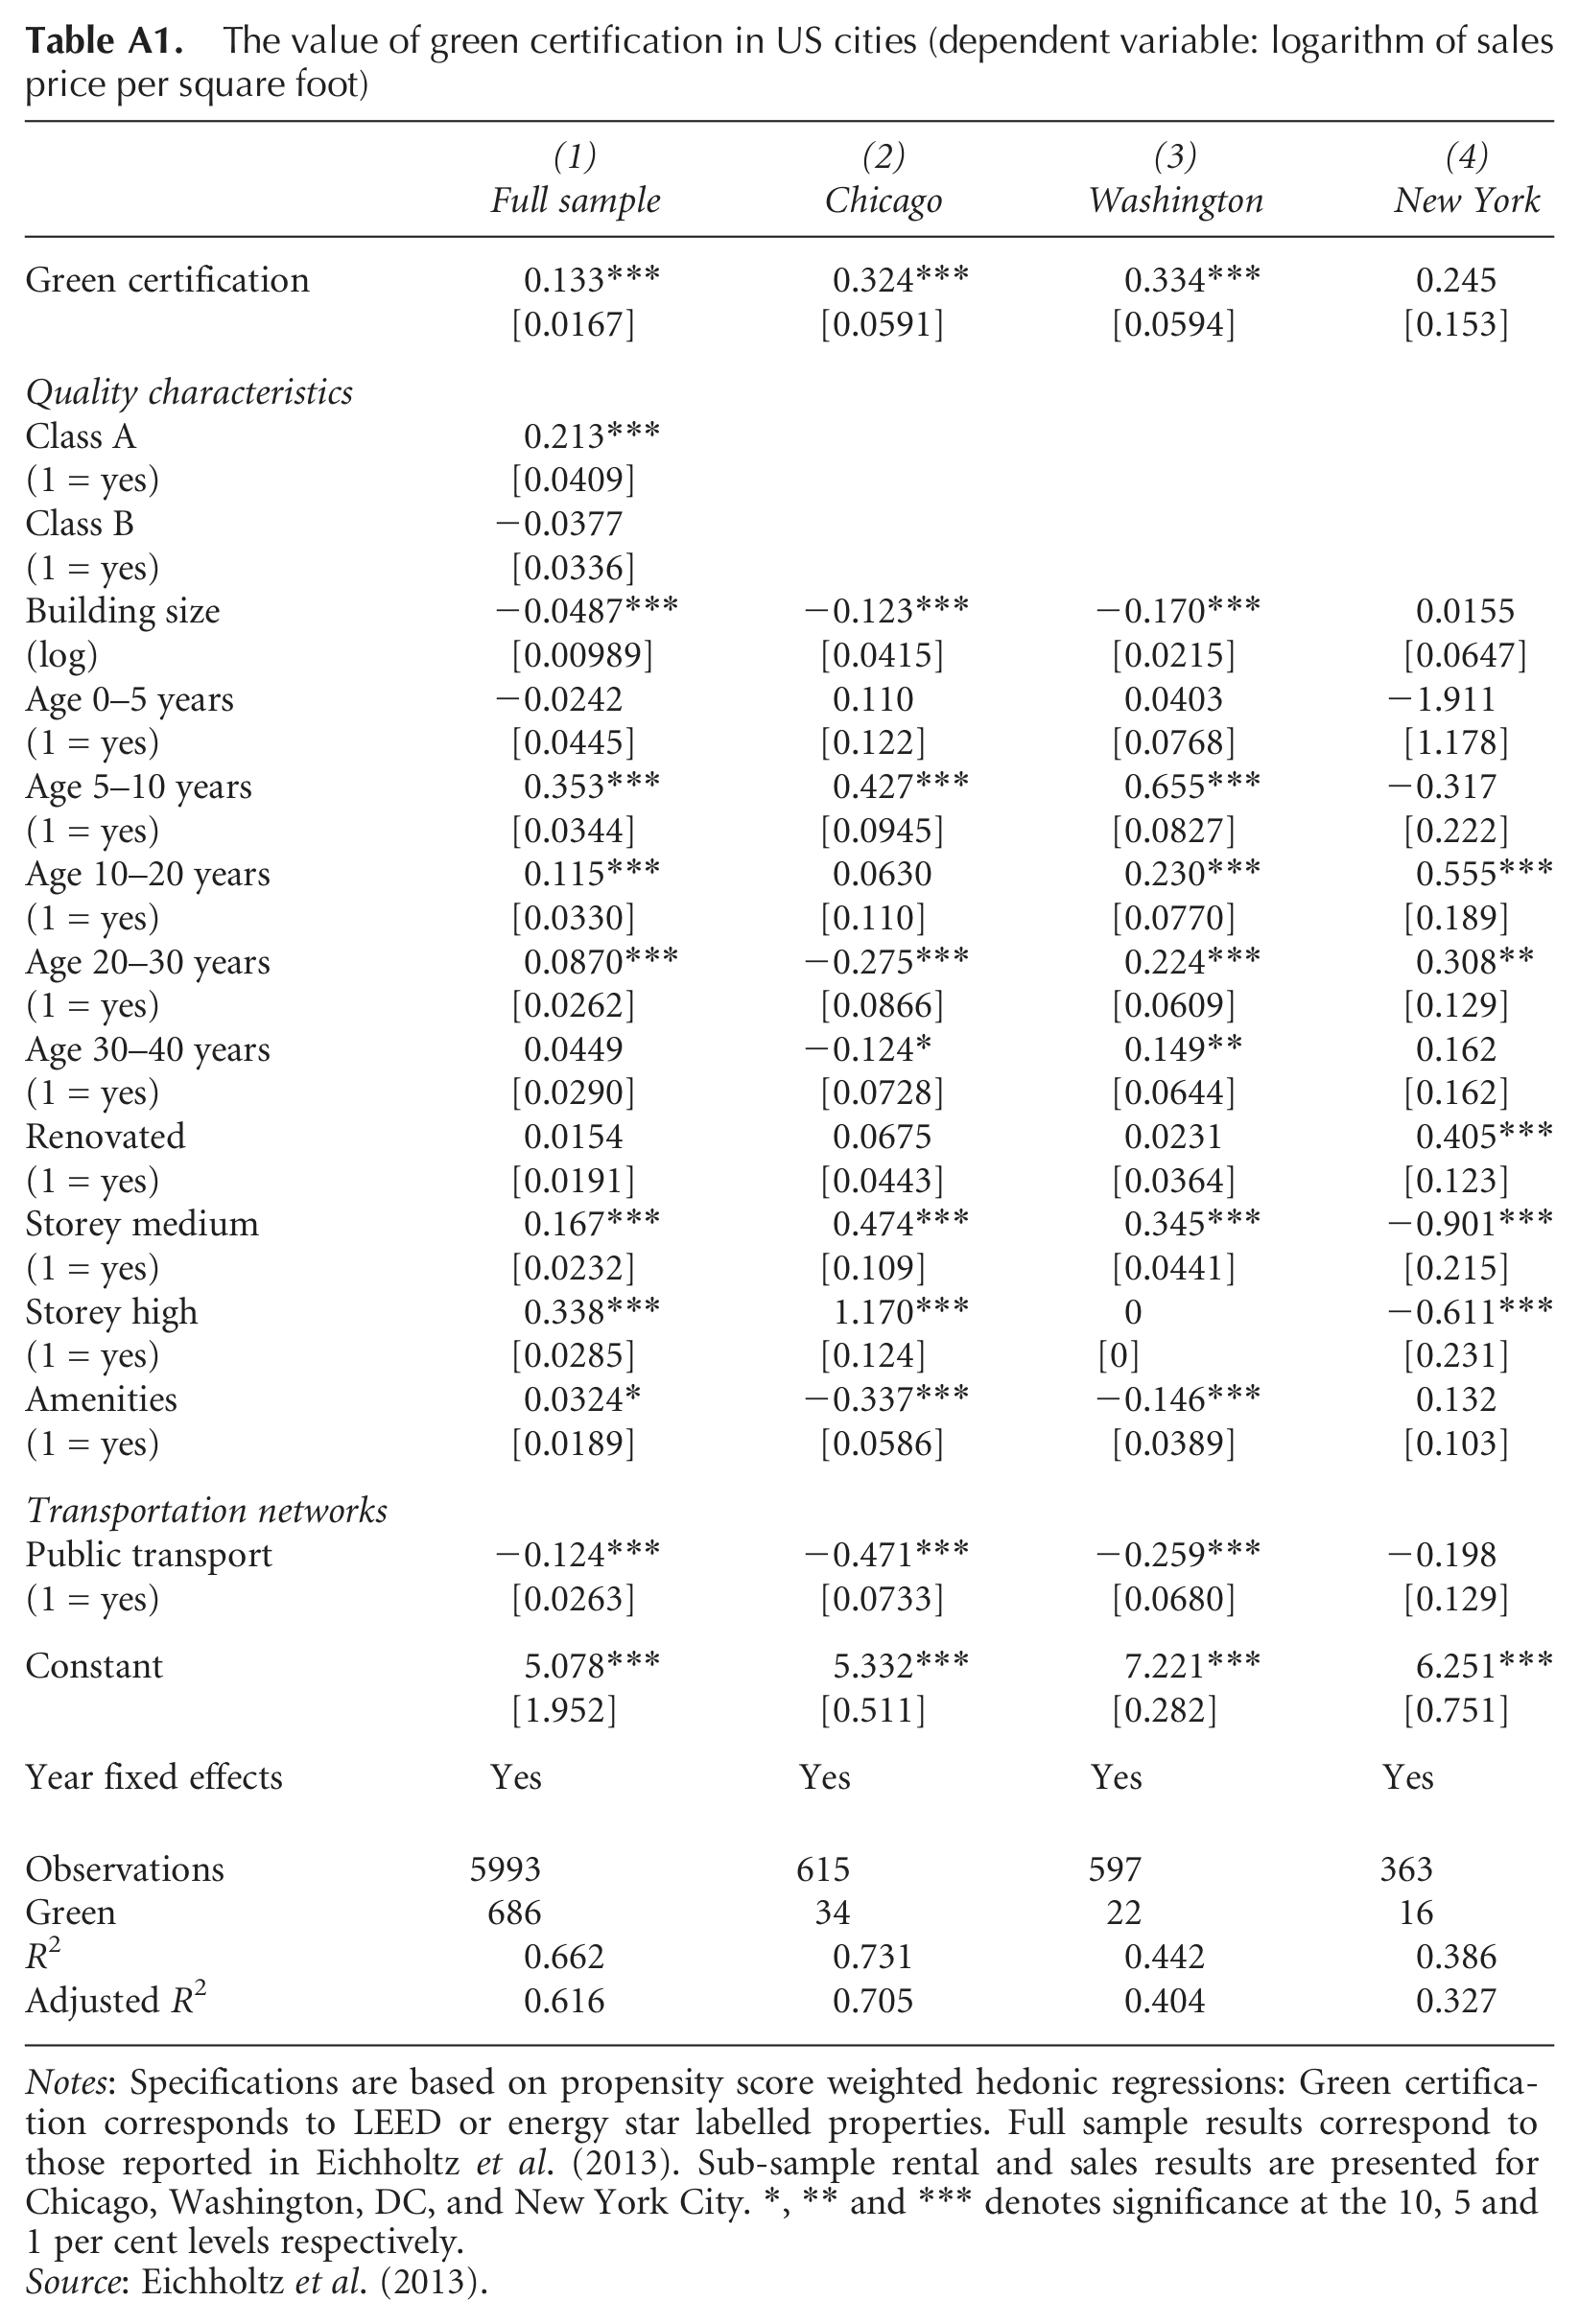
Notes: Specifications are based on propensity score weighted hedonic regressions: Green certification corresponds to LEED or energy star labelled properties. Full sample results correspond to those reported in Eichholtz et al. (2013). Sub-sample rental and sales results are presented for Chicago, Washington, DC, and New York City. *, ** and *** denotes significance at the 10, 5 and 1 per cent levels respectively.
Source: Eichholtz et al. (2013).
Acknowledgements
We would like to thank Thomas Saunders, Martin Townsend and Scott Steedman of BRE Global for their assistance in collecting and interpreting BREEAM data used in this analysis. In addition, we are grateful for the comments of three anonymous referees, Jaap Bos, John Quigley, Andy Naranjo and William Strange, participants at the 2012 ASSA Meetings and at seminars at the Centre for European Economic Research (ZEW) and the University of Groningen. Valentin Voigt and Ignas Gostautas also provided excellent research assistance.
Funding
Financial support for this research has been provided by the European Centre for Corporate Engagement (ECCE) and the Royal Institution of Chartered Surveyors (RICS). Nils Kok is supported by a VENI grant from the Dutch Science Foundation.