



Abstract
This paper analyses the rising importance of sustainable principles in property decisions and its impact on attractiveness for business districts in France. A behavioural survey of a large sample of corporate property managers and a multiple correspondence analysis highlight key factors indicating the influence of sustainable principles alongside more traditional determinants of territorial attractiveness. This approach enables the drawing up of a typology of companies according to the influence of sustainability issues, showing the rise in importance placed on sustainability in location decisions made by listed companies, companies that own their head offices and companies located in the main business districts of the Paris metropolitan area.
1. Introduction
This paper analyses the greater priority now being given to sustainable principles in property decisions and the resulting impact on firms’ location strategies. With the rise of global climate change concerns, the concept of the sustainable city (Nijkamp and Pepping, 1998; Whitehead, 2003; Kenworthy, 2006) and green buildings (Miller et al., 2008; Eichholtz et al., 2010a and 2010b) has attracted increasing attention. To reinforce its commitment to energy conservation and emission reductions, the European Union launched the European Performance of Buildings Directive (EPBD) setting stringent targets to achieve near-zero energy utilisation in buildings by 2021. In France, recent environmental regulations such as the Grenelle de l’Environnement pay particular attention to energy efficiency in property, land use and urban planning, influencing management practices and strategies.
Understanding firms’ location decisions implies paying attention to the literature on corporate property, among other things. It challenges some of the assumptions of the neo-classical location theory (Leishman and Watkins, 2004) by considering occupiers’ requirements (Gibson, 2003; Lizieri, 2003) and firm size and internal decision processes (Greenhalgh, 2008) when explaining location choices. Studies on corporate property decisions adopt the perspective of a firm managing its property to consider traditional location factors such as rental cost or accessibility (Clapp, 1980), as well as more global factors such as head office location and agglomeration effects (Davis and Henderson, 2008; Strauss-Khan and Vives, 2009) and, recently, sustainability issues (Dixon et al., 2009).
In this paper, we posit that sustainability, alongside other well-known factors such as rental cost, accessibility or agglomeration effects, can make business districts more attractive and influence firms’ location decisions. Two hypotheses are tested Hypothesis 1: Green buildings are attractive to corporate property occupiers and can thus influence their location decision Hypothesis 2: Sustainable urban attributes are also attractive to corporate property occupiers alongside other attributes when choosing their location
If these two hypotheses are confirmed, we will have evidence that the ability of business districts to provide both green buildings and sustainable urban attributes can improve their attractiveness.
We use a behavioural survey of a large sample of corporate property managers to investigate the impact of sustainability on management practices and location strategies. The results of the survey are interpreted using multiple correspondence analysis (MCA), which allows us to identify key factors reflecting the rising importance placed on sustainability for corporate property, and to draw up a typology of actors according to the influence of sustainability on their location strategies. This analysis is completed by non-parametric tests in order to sharpen interpretation of the results. The results of the paper confirm our two hypotheses, showing that green buildings and sustainable urban attributes can influence firms’ location decisions in addition to traditional determinants. They highlight the greater importance of sustainability in location strategies for listed companies, companies which own their head office and companies located in the major business districts of the Paris metropolitan area. This provides an interesting contribution to urban research and local policy, as attracting firms, and head offices in particular, is a major issue for business districts.
The paper is structured as follows. Section 2 reviews the relevant literature supporting the two hypotheses tested. The methodology of the behavioural survey and the MCA analysis are presented in section 3, while the results and the importance of sustainability in location strategies and business district attractiveness are presented in section 4. Section 5 contains our conclusions.
2. Background
This paper aims to demonstrate that promoting sustainable attributes is a way to make business districts more attractive. Two hypotheses are tested: that green buildings are attractive to corporate property occupiers and can thus influence firms’ location decisions; and that sustainable urban attributes are also attractive to corporate property occupiers when choosing their location. As business districts can offer green buildings and sustainable urban attributes, the combination of these two hypotheses confirms that sustainability is a new determinant of attractiveness for business districts. This section presents the research background underlying the two hypotheses.
2.1 Hypothesis 1: Green Buildings are Attractive to Corporate Property Occupiers And Can Thus Influence Their Location Decisions
This hypothesis is supported by the literature about ‘green buildings’. The rising emphasis on sustainability in corporate property strategies can first be interpreted as a response to a more stringent regulatory environment. In France, the NRE (New Economic Regulations) enacted in 2001, specifically article 116, make it compulsory for listed companies to disclose information on the social and environmental impact of their business in their annual report. The Grenelle de l’Environnement (two environmental laws voted in 2009 and 2010) defines a strategy for sustainable issues and a national commitment to achieve the objectives of the Kyoto Protocol. Property is specifically targeted through land use and urban planning, and regulations on energy efficiency.
However, the spread of sustainable principles has brought actors to consider the potential value created by buildings’ environmental performance in a context of corporate social responsibility (Pivo and Fisher, 2010). This trend has been broadly supported by the emergence of ratings systems such as the EPA’s (Environmental Protection Agency’s) EnergyStar programme and the LEED certificate awarded by the Green Building Council in the US, the BREEAM (BRE Environmental Assessment Method) label in the UK and the HPE (High Energy Performance) and HQE (High Environmental Quality) labels in France.
Adopting an investor point of view, a very recent and still-growing body of empirical research demonstrates that green buildings can achieve rental premiums, higher occupancy rates and thus higher asset values (Miller et al., 2008; Eichholtz et al., 2010a and 2010b; Wiley et al., 2010; Fuerst and McAllister, 2011). In addition, the ‘green value’ is estimated in terms of the risk and depreciation for investors protecting buildings against premature obsolescence (Sayce et al., 2004; Lorenz and Lützkendorf, 2008; McNamara, 2008). Consequently, improving the sustainable performance of buildings should lead to higher values for investors or landlords, with the increase generally exceeding the extra costs of going green (Bartlett and Howard, 2000; Miller et al., 2010). The UK survey conducted by Atisreal (2008) highlights the potential for lower risks and premium values for investors, whereas Myers et al. (2008) suggest a lower interest in sustainable properties in investors’ portfolios in New Zealand.
The value premium on green buildings is attributed to their attractiveness to occupiers, but surprisingly, fewer studies have looked at the situation from an occupier point of view. Green buildings are expected to attract occupiers due to lower operating expenses deriving from energy efficiency, better productivity and employee wellbeing, potential tax savings and other incentives, and their ‘socially responsible’ image (Heerwagen, 2000; Edwards, 2006; Paul and Taylor, 2008; Brown et al., 2010). The key question is the extent of the occupier’s ‘willingness to pay’ for these advantages (Fuerts and McAllister, 2011). The surveys of occupiers conducted by Jones Lang LaSalle (2008) and Cushman and Wakefield (2009) in London, and DTZ (2009) in Paris, confirm the rising importance placed on sustainability among other strategic factors in buildings’ attractiveness, and a willingness to pay a premium for green-certified buildings, ranging from 1–10 per cent.
While there is certainly an increasing demand for green buildings, as pointed out by Dixon et al. (2009) other traditional factors remain important in corporate property occupiers’ location decisions. These other factors include rental cost and overall flexibility (Gibson, 2003; Lizieri, 2003), the size and decision-making process of the firm (Greenhalgh, 2008) and, most importantly, location itself (Dixon et al., 2009). Location characteristics are fundamental in the firm’s decision-making process. This brings us to the paper’s second hypothesis which posits that sustainable urban attributes are attractive for occupiers alongside other traditional location attributes.
2.2 Hypothesis 2: Sustainable Urban Attributes Are Attractive to Corporate Property Occupiers Alongside Other Attributes when Choosing Their Location
Location characteristics are fundamental in understanding corporate location decisions. The attributes that have traditionally determined a location’s attractiveness are well-documented in the literature.
The traditional neo-classical model for urban rent and location assumes that firms determine their optimal location by reference to rental cost and employee commuting costs (Alperovitch and Katz, 1988). Even if many authors have underlined the unsatisfactory nature of this type of approach which tends to simplify assumptions (Leishman and Watkins, 2004; Greenhalgh, 2008), rental cost and accessibility are still strategic factors in a firm’s location decision (Clapp, 1980).
A second major determinant in such location decisions is agglomeration effects, which explain the formation of business districts by the advantage of the agglomeration of firms and services. Agglomeration effects are widely studied in well-known literature which emphasises externalities due to localised interactions, needs for face-to-face contacts and knowledge spillover (Glaeser et al., 1992; Porter, 1998; Storper and Venables, 2004) and externalities due to proximity to high-order services and highly qualified employees (Sassen, 2002; Coffey and Shearmur, 2002; Duranton and Puga, 2005; Guillain et al., 2006). Agglomeration effects are strategic factors in firms’ location decisions, especially the very selective choice of head office location (Davis and Henderson, 2008). The agglomeration of other head offices and business services has a strong impact on head office location, as do transport facilities such as international airport and recreational amenities which are attractive to a highly qualified workforce (Strauss-Khan and Vives, 2009).
In this article, we hypothesise that sustainable attributes can add to some of these traditional determinants in two ways: in providing recreational as well as environmental amenities, and in promoting centralities characterised by mixed land use and accessibility. Business districts promoting these two types of sustainable attribute are thus able to improve their attractiveness.
Sustainable attributes concern not only green buildings as mentioned in Hypothesis 1, but also urban attributes and planning. Incentives for business districts to provide sustainable urban attributes such as green spaces or modern facilities in addition to green buildings themselves may produce recreational and environmental amenities. Promotion of these amenities improves the district’s attractiveness to a highly qualified workforce, which is a strategic factor for corporate location decisions, especially regarding the head office location. The presence of modern amenities combined with highly valued services and metropolitan functions in a business district can attract a highly qualified workforce through a gentrification process (see Décamps, 2011, in the French context).
The second type of sustainable urban attribute concerns centrality and accessibility. An important body of research on the ‘sustainable city’ focuses on the interaction between centrality and accessibility, from the promotion of a ‘compact city’ (Newman and Kenworthy, 1998; Gordon and Richardson, 1997) to a ‘polycentric city’ (Giulliano and Small, 1991; Anas et al., 1998) where the population can live closer to their workplace and urban facilities are located in sub-centres linked by an efficient transport system (McMillen, 2001). Thus business districts can provide sustainable attributes by promoting mixed land use and accessibility, which are strategic factors in firms’ location decisions.
The ability of business districts to provide green buildings (Hypothesis 1) and sustainable attributes (Hypothesis 2) may be broadly supported by an urban project, or ‘mega project’ (Fainstein, 2009), depending on the district’s willingness to mix sustainability with traditional determinants of attractiveness. The combination of Hypothesis 1 and Hypothesis 2 suggests that sustainability can be an important factor in attracting corporate property users to business districts alongside the more traditional factors identified in the literature.
3. Methodology and Profile of Companies Surveyed
The aim of our study is to examine how sustainability is becoming imperative for corporate property decisions, particularly regarding office locations. Priority is given to sustainable attributes in corporate decision-making. This paper assumes that sustainability influences the attractiveness of business districts for corporate property strategies and location choices. Two hypotheses are tested concerning the attractiveness of green buildings and sustainable attributes for corporate property occupiers (see section 2). To test these hypotheses, we use a behavioural survey based on a questionnaire sent in October 2010 to a large sample of corporate property managers, focusing on the impact of sustainability on their strategies. The survey was conducted through the Agora des Directeurs Immobiliers (ADIMM) and the Association des Directeurs Immobiliers, which are participative networks of French corporate property managers. The data collected give an innovative view of the impact of sustainable principles on these actors’ behaviour. The results of the survey represent corporate property managers’ views on sustainability, such as adaptation to meet environmental regulations and its consequences for property strategies, or the influence of sustainable attributes on their location decision relatively to traditional urban factors (rental cost, accessibility, proximity between firms and services). Sustainability is also investigated through its social dimension, regarding workplace management practices such as space planning and its impact on employee well being.
The study covered 236 property managers of listed and unlisted companies for which real estate asset management is not the core business activity. The rate of response was 25.5 per cent, which represents 60 large companies in France. Sampling procedures were applied to ensure a sufficient number of observations and to eliminate duplicates. This gave a statistically significant final sample of 52 companies for which all the survey questions were completed. Table A1 (in Appendix 1) provides an overview of the companies surveyed: 52 per cent of them are listed on the stock exchange, 42 per cent belong to the industry sector and the remaining 58 per cent belong to the service sector (20 per cent in the sectors of finance, real estate and insurance). Almost 45 per cent of companies in our sample manage properties totalling over 500 000 square metres, including 13 per cent with over 4 million square metres. The amount of office space owned varies from none (the company is just a tenant) to 100 per cent, the average being 38 per cent and the median 30 per cent. The total surface area for the sample companies’ head offices is 1 396 100 square metres. The sample companies’ annual operating revenue varies from €5 million to €80 billion, with an average of €9 billion.
The survey questionnaire, comprising 45 questions, is divided into three parts. The first part seeks background information about the companies and their corporate property function, as well as the amount of office space owned. The questions listed here provided the following variables for our analysis (see Tables A2 and A3).
— Is your company listed on the stock exchange? (listed/notlisted).
— Sector (industry/service sector).
— Are you the owner or tenant of your head office? (owner/tenant).
— The amount of office space owned (own0–20%office/own20–60%offices/own 60–100%offices).
Finally, we defined a variable representing the head office location (see Table A1)
— Zone1: Paris and Western Business District.
— Zone 2: Ile-de-France excluding Paris and Western Business District.
— Zone 3: Other locations (outside Ile-de-France).
Data from the Immostat-IPD database 1 were used to distinguish between property sub-markets and to identify the main business districts in the Paris metropolitan area (Nappi-Choulet and Maury, 2009).
The second part of the survey concerns sustainable practices already effective in the company. The following variables are defined in this part (see Table A3)
— Does your head office have High environmental quality (HQE), LEEDS, BREEAM or other certification? (GreenHeadOffice/notGreenHeadOffice).
— Is space planning used in your company? Have you got a workplace manager? (WPmanager/notWPmanager).
— Do you measure the impact of space planning on employee wellbeing? (WellBeing/NotWellBeing).
— Do you measure the impact of space planning on employee performance? (Performance/notPerformance).
Table A2 (Appendix 1) provides some details of sustainable practices in the type of company surveyed. Almost one-third (31 per cent) of companies occupy high environmental quality (hqe certified) buildings (75 per cent of these are listed companies, 69 per cent belong to the service sector and 67 per cent have more than 10 000 employees). Only 12 per cent of the surveyed companies have a certified head office (67 per cent of these are listed companies, 83 per cent are tenants, 67 per cent belong to the service sector and 67 per cent have more than 10 000 employees). Lastly, 70 per cent of the companies have created a specific department for sustainable development.
The third and final part of the survey focuses on the valuation of green buildings and sustainable attributes. This part of the questionnaire is of fundamental interest for this research. It allows us to define the variables to test our two hypotheses. Hypothesis 1 (positing that green buildings are attractive to corporate property occupiers and can thus influence firms’ location decision) is tested using the following variables (see Table A3)
— Are green buildings a sufficient reason to move location? (GreenBuil ding_Settlement/GreenBuilding_notSet tlement).
— Are green buildings a determinant of territorial attractiveness? (GreenBuild ing_Attractive/GreenBuilding_notAttractive).
Hypothesis 2 (positing that sustainable urban attributes are also attractive to corporate property occupiers and can thus make business districts more attractive) is tested using the following variables (see Table A3).
— Could a SBD (sustainable business district) induce you to move location? (SBD_Settlement/SBD_notSettl ement).
— Does a SBD (sustainable business district) location justify a rent premium? (SBD_Rent + /SBD_notRent + ).
— Are SBDs (sustainable business districts) interesting to you? (SBD_ interesting/SBD_notInteresting).
We also use the following variables to compare the presence of green buildings with traditional factors influencing firms’ location decisions
— Is accessibility a determinant of your location decision? (Location_ Accessibility/Location_notAccessibility).
— Is rental cost a determinant of your location decision? (Location_ Cost/Location_notCost).
— Is proximity to other firms a determinant of your location decision? (Location_Firms/Location_notFirms).
— Is proximity to business services a determinant of your location decision? (Location_Services/Location_not Services).
— Is district profile a determinant of your location decision? (Location_ DistrictProfile/Location_notDistrictPro file).
— Are green buildings a determinant of your location decision? (Location_ GreenBuildings/Location_notGreenBui ldings).
Since the survey variables are qualitative in nature, a multiple correspondence analysis (MCA) was used to measure the importance placed by corporate property managers on key factors typically associated with more environmentally sensitive behaviour and indicating the rising importance of sustainability issues. This data analysis method allows us to draw up a typology of actors based on companies’ characteristics and the way they value sustainability. This inductive approach is a generalisation of correspondence analysis for categorical variables. It measures associations between several variables and factors from the survey (represented as nominal categorical data) and identifies stable patterns in the data. 2 A similar method was used by Nappi-Choulet (2006) to analyse the involvement of private investors and developers in French urban regeneration initiatives. The method is adapted in this paper to emphasise the increasing incorporation of sustainability issues into corporate property strategies. The purpose is to identify the relative importance of variables (represented as axes) and groupings of respondents (denoted by clusters in the analysis of the indicator matrix).
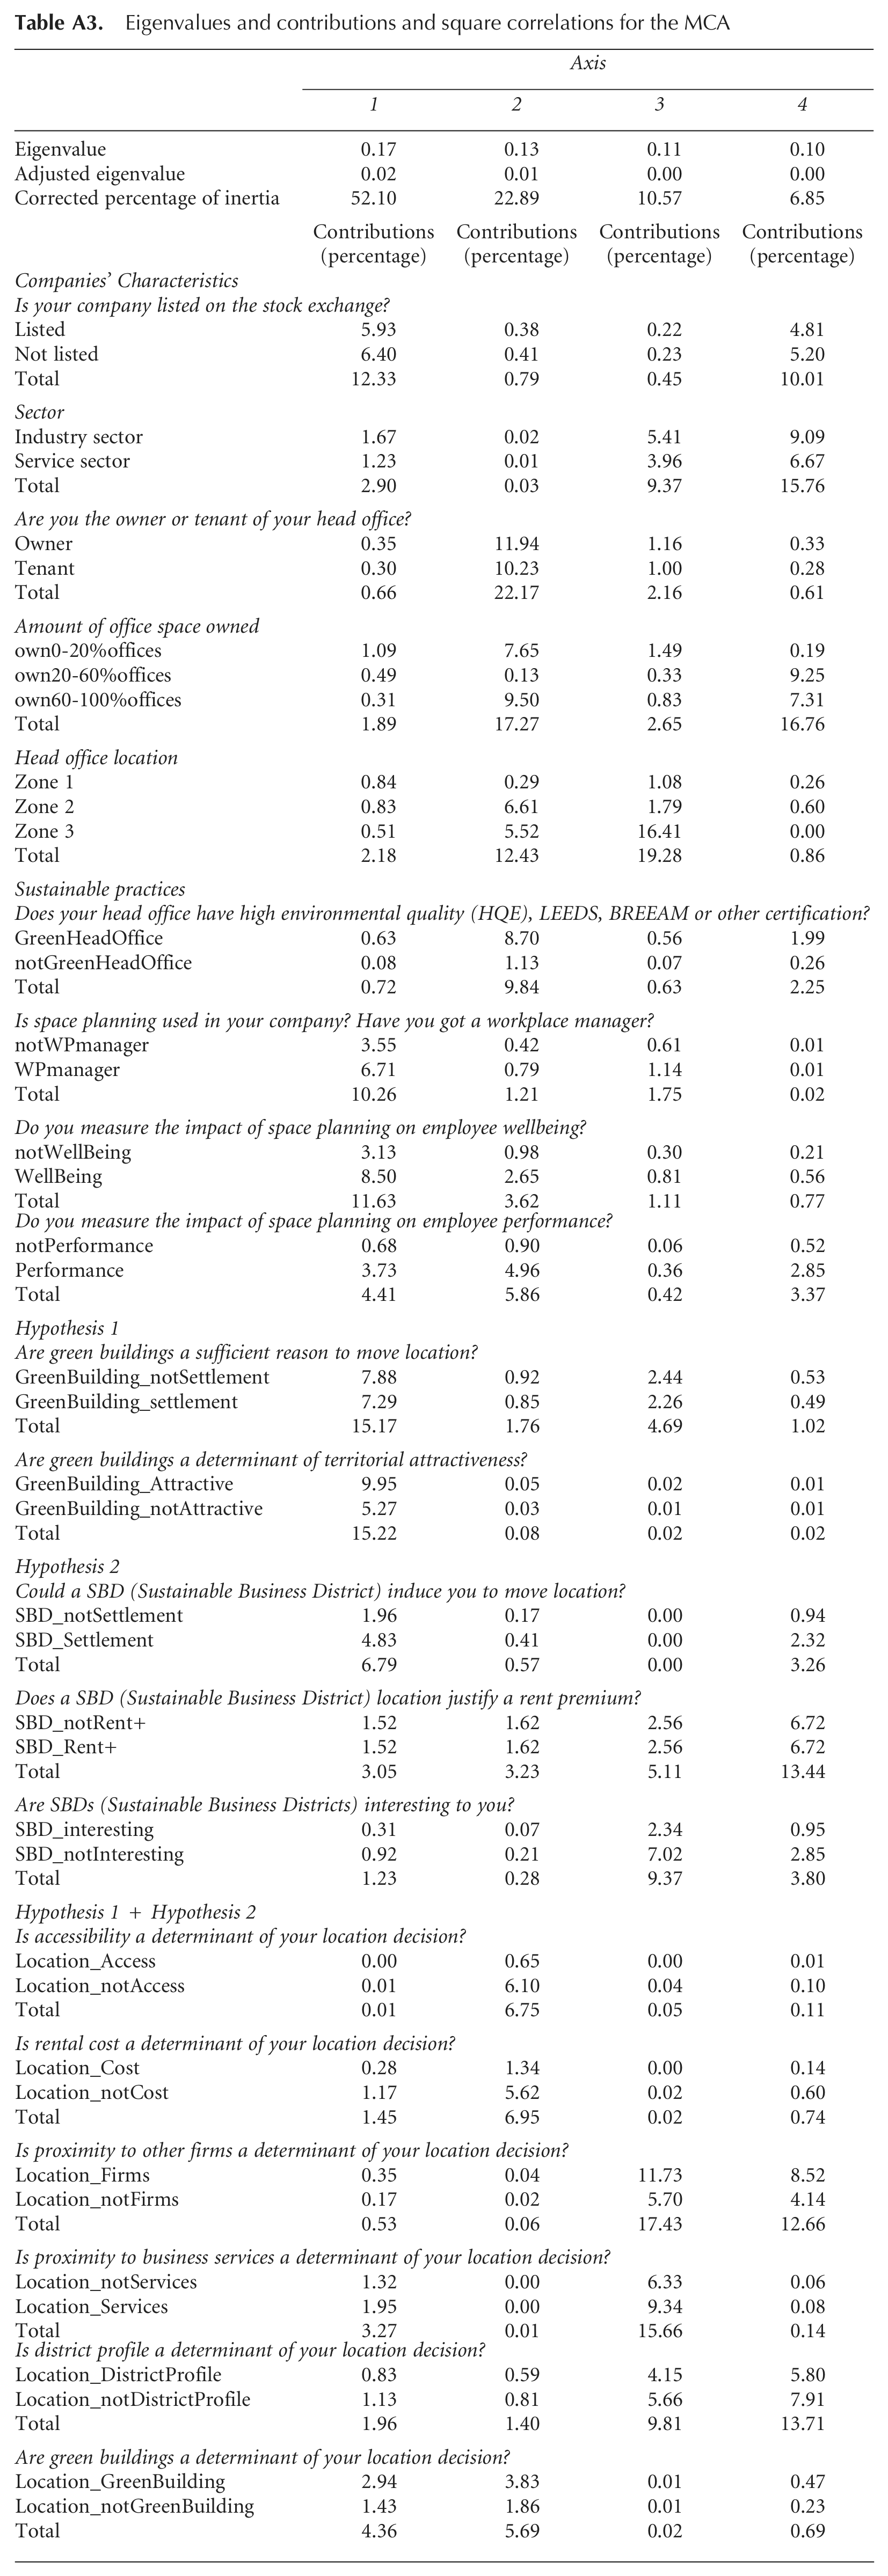
Eigenvalues are vitally important to interpret the general form of the cloud and indicate which axes matter. They are used to determine the amount of explained variance. The first four eigenvalues of the analysis are respectively 0.17, 0.13, 0.11 and 0.10 (Table A3). However, these proportions often provide a pessimistic indication of fit and are uninterpretable. We therefore use the inertia adjustment proposed by Benzécri (1979), which produces a better indication of which axes matter and should be used for the analysis. This adjustment does not affect the contributions, which are still calculated in relation to the original eigenvalues. The adjusted eigenvalues are respectively 0.02, 0.01, 0.00 and 0.00. The corrected percentages of inertia for the first four dimensions are respectively 52.10 per cent, 22.89 per cent, 10.57 per cent and 6.85 per cent (see Table A3 in Appendix 2). They give an accurate expression of the relative importance of the factors. As the cumulated inertia of these four factors is 92.4 per cent, we decided to keep only the first four axes for our analysis. The MCA was performed on 20 relevant variables as listed in Table A3 (Appendix 2). Given the qualitative nature of the variables and the small size of the survey sample, non-parametric tests were used to sharpen the interpretation of the MCA results: a chi-squared test (5 per cent significance test) was conducted between the main categorical variables emphasised by the MCA and the variables concerning sustainable development. Table 1 presents the results of these independent tests.
Chi-squared test for independence between categorical variables and sustainable development variables

Notes: **significant at the 5 per cent level; ***significant at the 1 per cent level.
4. Results and Discussion of the Empirical Findings
4.1 Towards a Typology of Property Managers Regarding Sustainability
To interpret an MCA, the absolute contributions and squared correlations are calculated for each axis (see methods by Greenacre, 1984). Table A3 (Appendix 2) presents the basic numerical results of the MCA analysis for the first four dimensions (i.e. factors). The contributions are coefficients of determination giving the explained variance for each variable by each axis or factor. Figures 1, 2 and 3 show the MCA maps created by combining the first four axes of inertia, representing a cloud of modalities.

MCA results, plan 1-2.

MCA results, plan 1-3.
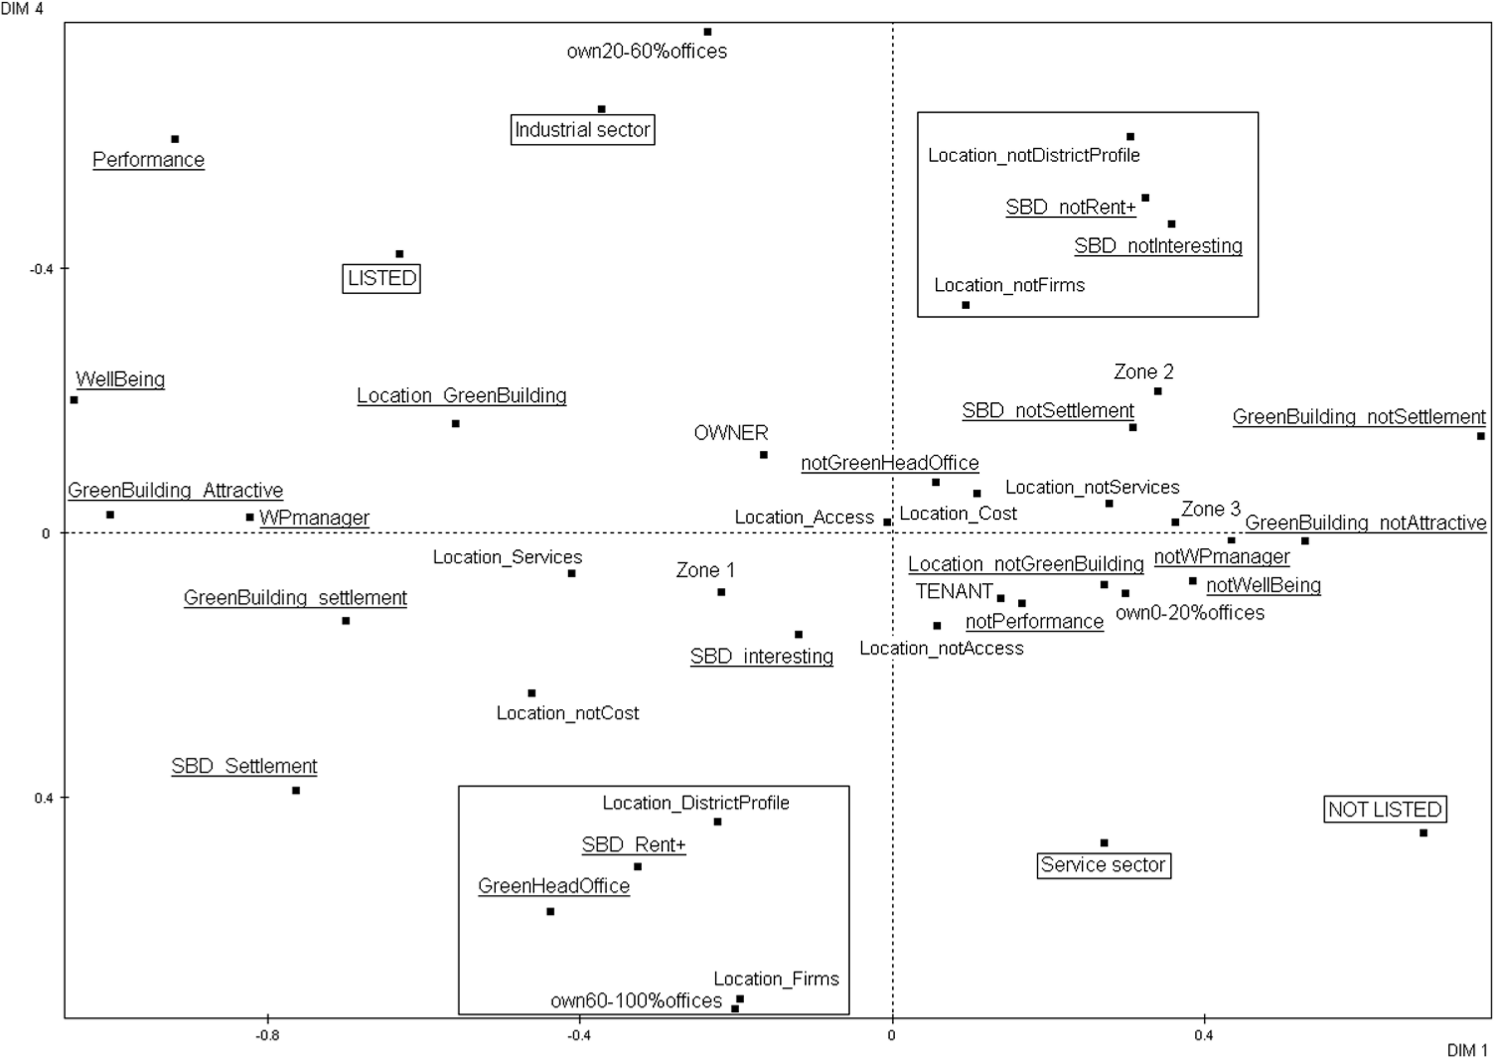
MCA results, plan 1-4.
The exercise consists of clustering and grouping modalities. This gives strong and interesting results. The first two-dimensional map (represented in Figure 1) alone explains 75 per cent (52.10+22.89 per cent) of the total inertia of the 20 active variables. We identify and interpret patterns in the data by representing the associations between different categories of variables and between the respondents graphically, as points mapped on a low-dimensional Euclidean space. To interpret the map, we examine the positions of the points in a given cloud, relative to an axis. If two such points are close on the map, they will have a similar profile. Graphically, the further a point is from the origin, the smaller its marginal weight and the bigger its contribution to inertia. Similarly, the smaller the distance between a point and an axis, the closer to 1 is its squared correlation on that axis. The variables with the highest weight and contribution are included for interpretation of the axis on the three different maps (Figures 1–3). The underlined variables describe environmental and sustainable issues.
In Figure 1, the cloud of modalities in plan 1-2 is homogeneous in form. No quadrant of this plan is empty and many modalities are positioned at the extremity of the axis, indicating that several of the survey questions have contributed to discriminate the sample population. This gives an interesting view of how the different actors value sustainable issues. Using Table A3 to identify the important points in the map, we see that the first factor groups together the following variables, in order of explained variance
— Are green buildings a sufficient reason to move location? (15.17 per cent) (GreenBuilding_Settlement/GreenBuild ing_notSettlement).
— Are green buildings a determinant of territorial attractiveness? (15.22 per cent) (GreenBuilding_Attractive/Green Building_notAttractive).
— Is your company listed on the stock exchange? (12.33 per cent) (listed/notlisted).
— Do you measure the impact of space planning on employee wellbeing? (11.63 per cent) (WellBeing/NotWellBeing).
These features represent almost 55 per cent of the variance explained by the first axis. In Figure 1, we observe from the left part of the first axis that listed companies are more strongly associated with consideration of green building certification when choosing a location or assessing territorial attractiveness. Listed companies are also strongly associated with a workplace management policy and an interest in employee wellbeing. Symmetrically opposite, on the right-hand part of the first axis, we see that Notlisted companies are associated with lower consideration for these sustainable principles.
The second axis mainly illustrates the following factors
— Are you the owner or tenant of your head office? (22.17 per cent).
— The amount of office space owned (17.27 per cent): (own0-20 per centoffice/own20-60 per centoffices/own60-100 per centoffices).
— Head office location (12.43 per cent): (Zone1/Zone2/Zone3).
This second axis separates companies which own their head office and more broadly their office space, and are located mainly in Zone 1 (Paris and Western Business District) or Zone 3 (outside Ile-de-France), from companies which rent their head office and own a small portion of the office space occupied, located mainly in Zone 2 (Ile-de-France excluding Paris and Western Business District). From Figure 1 we observe that the first group (owners) are close to the left-hand part of the first axis, indicating a strong consideration for sustainable principles, whereas the second group (tenants) are close to the right-hand part of the first axis, indicating a weak consideration for sustainable principles.
The third axis is explained mainly by the following factors (Figure 2)
— Head office location (19.28 per cent): (Zone1/Zone2/Zone3)
— Is proximity to other firms a determinant of your location decision? (17.43 per cent) (Location_Firms/Location_NotFirms).
— Is proximity to business services a determinant of your location decision? (15.66 per cent) (Location_ Services/Location_NotServices).
— Is district profile a determinant of your location decision? (9.81 per cent) (Location_DistrictProfile/Locat ion_NotDistrictProfile).
— Sector (9.37 per cent): (Industry/Service sector).
This axis groups companies from the industry sector which consider proximity to other firms, services and the district profile when choosing a location. On the opposite side of this third axis, companies from the service sector mainly located in Zone 2 are associated with low consideration for these factors.
Lastly, the fourth dimension groups variables such as
— The amount of office space owned (16.76 per cent).
— Does a SBD (sustainable business district) location justify a rent premium? (SBD_Rent + /SBD_notRent +) (13.44 per cent).
— Determinants of Location choice: proximity to other firms (12.66 per cent)/district profile (13.71 per cent).
From Figure 3 we observe that this dimension emphasises two main groups
— Companies which own a large amount of office space, including a green head office. These companies consider that a SBD location justifies a rent premium and are influenced by proximity between firms and the district profile when choosing their location.
— Companies not interested in SBDs (considering that such locations do not justify a rent premium), proximity between firms or district profile when choosing their location.
Through the use of MCA, interesting new testable hypotheses are developed regarding the linkages between types of companies, sustainability issues in corporate property decisions and business district form. The results of our study show that the validation of Hypothesis 1 and Hypothesis 2 is strongly associated with the following characteristics: being listed or unlisted on the stock exchange, owner or tenant of the head office, the amount of office space owned and the head office location.
These results are analysed in the following sub-sections. The use of non-parametric tests allows us to sharpen the interpretation of the importance of sustainability by the different groups of actors.
4.2 The Importance of Sustainability for Location Strategies and Business District Attractiveness
The MCA results allow us to identify the main characteristics of companies according to the importance they place on green buildings (Hypothesis 1) and sustainable urban attributes (Hypothesis 2). This brings out three main results.
The first important result is the association between listed companies and sustainable development concerns, as represented through the first axis of the MCA which explains 52 per cent of the variance. From Figure 1, we observe that listed companies value green buildings and the existence of a SBD (sustainable business district) as an indicator of territorial attractiveness. Listed companies are also associated with management practices such as space planning and the evaluation of its impact on employee wellbeing and performance. This result is confirmed by a non-parametric chi-squared test conducted to estimate the relationship between the Listed or Notlisted variable and the variables representing sustainability. Table 1 presents the variables which are statistically significant.
This strong impact of sustainability for listed companies can first be interpreted as relating to more stringent regulations. As mentioned earlier (see section 2), France’s NRE law of 2001 makes it compulsory for listed companies to report on the social and environmental impact of their business as an incentive for social responsibility. Nonetheless, this result demonstrates the rising importance placed on sustainability by listed companies, especially concerning location decisions.
The second key result of this study concerns ownership of the head office and, more broadly, of the office space occupied. Companies are differentiated according to their interest in ‘green’ buildings when choosing their location. Ownership of the head office seems to be the major distinguishing feature of companies along this axis, even though the amount of office space owned follows the same pattern. Throughout Figures 1, 2 and 3, we observe that the owner group is always associated with a strong concern for sustainability issues in their location choice, whereas the tenant group seems to be more sensitive to rental cost when choosing their location. This result is confirmed in Table 1 by conducting a chi-squared test on the Owner or tenant of the head office variable. We find a statistically significant relationship between this variable and the variable highlighting cost as the main determinant of the location decision. This group of actors is thus clearly differentiated by the determinant of their location choice: cost vs green buildings.
This result can be interpreted by reference to the concept of ‘green value’ mentioned in section 2 part of this paper which highlights that green buildings on average command higher rental premiums, higher occupancy rates and thus higher asset values. This is confirmed by our study revealing the owner group’s interest in green buildings when choosing their location, whereas the tenant group is more sensitive to cost. Green buildings may imply higher values for owners, but the rent premiums may imply extra cost for tenants. Our results show that, while owners have fully integrated the potential value of green buildings into their decision-making, tenants are still more sensitive to the extra cost, even when there is long-term potential for lower operating expenses. This result is consistent with corporate property literature: tenants tend to be more cost-centred organisations interested in sufficient flexibility to expand, contract and relocate; whereas owners considering long-term investments are more sensitive to potential value and risks.
The third main result of the MCA approach is the impact of head office location in explaining the consideration given to sustainability in the corporate decision. It is interesting to note that companies whose head office is located in Paris business districts are strongly sensitive to sustainability issues. Throughout Figures 1, 2 and 3, the variable Zone1: Paris and Western Business District is strongly associated with the left-hand part of the first axis representing a concern for sustainability. This is confirmed by the chi-squared test conducted between the Head Office Location variable and the variables representing sustainability (Table 1). This test shows that companies whose head office is located in Paris business districts are strongly sensitive to the existence of a SBD, in addition to factors that traditionally determine a business district location, such as proximity between firms and district profile. This result strongly supports our hypothesis that sustainability (alongside other factors) is a way to make business districts more attractive.
5. Conclusion
The objective of this paper is to demonstrate that sustainability can make business districts more attractive, influencing firms’ location decision along with other traditional factors such as rental cost, accessibility and agglomeration effects. Two main hypotheses were formulated: green buildings are attractive to corporate property occupiers and can thus influence their location decisions (Hypothesis 1); sustainable urban attributes are also attractive to corporate property occupiers alongside other attributes when choosing their location (Hypothesis 2). The ability to provide green buildings and sustainable urban attributes is thus a way to make business districts more attractive.
A behavioural survey of a large sample of corporate property managers in France was conducted to test these two hypotheses. The results of the survey provide an original dataset to represent the impact of sustainability on corporate property occupiers’ management practices and location decisions. Several of the survey questions are designed to estimate the importance of green buildings and sustainable urban attributes alongside more traditional factors in corporate location decisions. A MCA (multiple correspondence analysis) is used to analyse the results of the survey. This allows us to draw up a typology of actors according to the importance they place on sustainability issues in their decision-making process.
The results of the paper confirm both Hypothesis 1 and Hypothesis 2. Green buildings and sustainable attributes are particular determinants for corporate property decisions by listed companies, which are adapting their location decisions to more stringent regulations concerning sustainability. The results also indicate that companies which own a large amount of their office space, and more specifically companies which own their head office, are strongly sensitive to green buildings. This suggests that owners are more interested in green value than tenants, which are still more sensitive to rental cost when choosing their location. Finally, a very interesting contribution of this paper is the finding that companies whose head office is located in one of the main business districts of the Paris metropolitan area are strongly sensitive to green buildings and sustainable urban attributes when choosing their location. This confirms our hypothesis that the ability to provide sustainable attributes can make business districts more attractive alongside other factors, especially for the very selective choice of the head office location.
This paper presents exploratory research concerning the importance of sustainable attributes in corporate property decisions applied to the French context. Although further research would be required before the results can be generalised, it provides an innovative contribution to the study of corporate location decisions, paying attention to two bodies of research that are internationally documented, but frequently ignore each other: the literature on corporate property strategies; and factors explaining business districts’ attractiveness in the urban economics literature. This paper shows that sustainability can impact firms’ location decisions and the attractiveness of business districts in corporate property decisions.
Footnotes
Appendix1. Companies surveyed
Sustainable practices of companies surveyed (percentages)
| Are you owner or tenant of one or several HQE buildings? |
Does your head office have HQE, LEEDS, BREEAM or other certification? |
Is there a specific department for sustainable development? |
|||||||
|---|---|---|---|---|---|---|---|---|---|
| Yes | No | Total | Yes | No | Total | Yes | No | Total | |
| Stock exchange | |||||||||
| Listed | 44 | 56 | 100 | 15 | 85 | 100 | 85 | 15 | 100 |
| 75 | 42 | 52 | 67 | 50 | 52 | 64 | 25 | 52 | |
| Not listed | 16 | 84 | 100 | 8 | 92 | 100 | 52 | 48 | 100 |
| 25 | 58 | 48 | 33 | 50 | 48 | 36 | 75 | 48 | |
| Total | 31 | 69 | 100 | 12 | 88 | 100 | 69 | 31 | 100 |
| 100 | 100 | 100 | 100 | 100 | 100 | 100 | 100 | 100 | |
| Office space owned (square metres) | |||||||||
| <100 000 | 20 | 80 | 100 | 20 | 80 | 100 | 27 | 73 | 100 |
| 19 | 33 | 29 | 50 | 26 | 29 | 11 | 69 | 29 | |
| 100 000 to 500 000 | 29 | 71 | 100 | 7 | 93 | 100 | 71 | 29 | 100 |
| 25 | 28 | 27 | 17 | 28 | 27 | 28 | 25 | 27 | |
| 500 000 to 2 million | 47 | 53 | 100 | 13 | 87 | 100 | 93 | 7 | 100 |
| 44 | 22 | 29 | 33 | 28 | 29 | 39 | 6 | 29 | |
| > 2 million | 25 | 75 | 100 | 0 | 100 | 100 | 100 | 0 | 100 |
| 13 | 17 | 15 | 0 | 17 | 15 | 22 | 0 | 15 | |
| Total | 31 | 69 | 100 | 12 | 88 | 100 | 69 | 31 | 100 |
| 100 | 100 | 100 | 100 | 100 | 100 | 100 | 100 | 100 | |
| Head office | |||||||||
| Tenant | 32 | 68 | 100 | 18 | 82 | 100 | 68 | 32 | 100 |
| 56 | 53 | 54 | 83 | 50 | 54 | 53 | 56 | 54 | |
| Owner | 29 | 71 | 100 | 4 | 96 | 100 | 71 | 29 | 100 |
| 44 | 47 | 46 | 17 | 50 | 46 | 47 | 44 | 46 | |
| Total | 31 | 69 | 100 | 12 | 88 | 100 | 69 | 31 | 100 |
| 100 | 100 | 100 | 100 | 100 | 100 | 100 | 100 | 100 | |
| Sector | |||||||||
| Industry sector | 23 | 77 | 100 | 9 | 91 | 100 | 77 | 23 | 100 |
| 31 | 47 | 42 | 33 | 43 | 42 | 47 | 31 | 42 | |
| Service sector | 37 | 63 | 100 | 13 | 87 | 100 | 63 | 37 | 100 |
| 69 | 53 | 58 | 67 | 57 | 58 | 53 | 69 | 58 | |
| Total | 31 | 69 | 100 | 12 | 88 | 100 | 69 | 31 | 100 |
| 100 | 100 | 100 | 100 | 100 | 100 | 100 | 100 | 100 | |
| Operating revenue (million €) | |||||||||
| <500 | 17 | 83 | 100 | 6 | 94 | 100 | 44 | 56 | 100 |
| 19 | 42 | 35 | 17 | 37 | 35 | 22 | 63 | 35 | |
| 500 to 5000 | 33 | 67 | 100 | 11 | 89 | 100 | 72 | 28 | 100 |
| 38 | 33 | 35 | 33 | 35 | 35 | 36 | 31 | 35 | |
| >5,000 | 44 | 56 | 100 | 19 | 81 | 100 | 94 | 6 | 100 |
| 44 | 25 | 31 | 50 | 28 | 31 | 42 | 6 | 31 | |
| Total | 31 | 69 | 100 | 12 | 88 | 100 | 69 | 31 | 100 |
| 100 | 100 | 100 | 100 | 100 | 100 | 100 | 100 | 100 | |
| Employees | |||||||||
| <1000 | 8 | 92 | 100 | 0 | 100 | 100 | 42 | 58 | 100 |
| 7 | 32 | 24 | 0 | 28 | 24 | 15 | 47 | 24 | |
| 1000 to 10 000 | 25 | 75 | 100 | 13 | 88 | 100 | 50 | 50 | 100 |
| 27 | 35 | 33 | 33 | 33 | 33 | 24 | 53 | 33 | |
| >10 000 | 48 | 52 | 100 | 19 | 81 | 100 | 100 | 0 | 100 |
| 67 | 32 | 43 | 67 | 40 | 43 | 62 | 0 | 43 | |
| Total | 31 | 69 | 100 | 12 | 88 | 100 | 69 | 31 | 100 |
| 100 | 100 | 100 | 100 | 100 | 100 | 100 | 100 | 100 | |

Note: row percentages are shown in roman; column percentages in italics.
Appendix 2. The formation of the MCA Axis
Eigenvalues and contributions and square correlations for the MCA
| Axis |
||||
|---|---|---|---|---|
| 1 | 2 | 3 | 4 | |
| Eigenvalue | 0.17 | 0.13 | 0.11 | 0.10 |
| Adjusted eigenvalue | 0.02 | 0.01 | 0.00 | 0.00 |
| Corrected percentage of inertia | 52.10 | 22.89 | 10.57 | 6.85 |
| Contributions (percentage) | Contributions (percentage) | Contributions (percentage) | Contributions (percentage) | |
| Companies’ Characteristics | ||||
| Is your company listed on the stock exchange? | ||||
| Listed | 5.93 | 0.38 | 0.22 | 4.81 |
| Not listed | 6.40 | 0.41 | 0.23 | 5.20 |
| Total | 12.33 | 0.79 | 0.45 | 10.01 |
| Sector | ||||
| Industry sector | 1.67 | 0.02 | 5.41 | 9.09 |
| Service sector | 1.23 | 0.01 | 3.96 | 6.67 |
| Total | 2.90 | 0.03 | 9.37 | 15.76 |
| Are you the owner or tenant of your head office? | ||||
| Owner | 0.35 | 11.94 | 1.16 | 0.33 |
| Tenant | 0.30 | 10.23 | 1.00 | 0.28 |
| Total | 0.66 | 22.17 | 2.16 | 0.61 |
| Amount of office space owned | ||||
| own0-20%offices | 1.09 | 7.65 | 1.49 | 0.19 |
| own20-60%offices | 0.49 | 0.13 | 0.33 | 9.25 |
| own60-100%offices | 0.31 | 9.50 | 0.83 | 7.31 |
| Total | 1.89 | 17.27 | 2.65 | 16.76 |
| Head office location | ||||
| Zone 1 | 0.84 | 0.29 | 1.08 | 0.26 |
| Zone 2 | 0.83 | 6.61 | 1.79 | 0.60 |
| Zone 3 | 0.51 | 5.52 | 16.41 | 0.00 |
| Total | 2.18 | 12.43 | 19.28 | 0.86 |
| Sustainable practices | ||||
| Does your head office have high environmental quality (HQE), LEEDS, BREEAM or other certification? | ||||
| GreenHeadOffice | 0.63 | 8.70 | 0.56 | 1.99 |
| notGreenHeadOffice | 0.08 | 1.13 | 0.07 | 0.26 |
| Total | 0.72 | 9.84 | 0.63 | 2.25 |
| Is space planning used in your company? Have you got a workplace manager? | ||||
| notWPmanager | 3.55 | 0.42 | 0.61 | 0.01 |
| WPmanager | 6.71 | 0.79 | 1.14 | 0.01 |
| Total | 10.26 | 1.21 | 1.75 | 0.02 |
| Do you measure the impact of space planning on employee wellbeing? | ||||
| notWellBeing | 3.13 | 0.98 | 0.30 | 0.21 |
| WellBeing | 8.50 | 2.65 | 0.81 | 0.56 |
| Total | 11.63 | 3.62 | 1.11 | 0.77 |
| Do you measure the impact of space planning on employee performance? | ||||
| notPerformance | 0.68 | 0.90 | 0.06 | 0.52 |
| Performance | 3.73 | 4.96 | 0.36 | 2.85 |
| Total | 4.41 | 5.86 | 0.42 | 3.37 |
| Hypothesis 1 | ||||
| Are green buildings a sufficient reason to move location? | ||||
| GreenBuilding_notSettlement | 7.88 | 0.92 | 2.44 | 0.53 |
| GreenBuilding_settlement | 7.29 | 0.85 | 2.26 | 0.49 |
| Total | 15.17 | 1.76 | 4.69 | 1.02 |
| Are green buildings a determinant of territorial attractiveness? | ||||
| GreenBuilding_Attractive | 9.95 | 0.05 | 0.02 | 0.01 |
| GreenBuilding_notAttractive | 5.27 | 0.03 | 0.01 | 0.01 |
| Total | 15.22 | 0.08 | 0.02 | 0.02 |
| Hypothesis 2 | ||||
| Could a SBD (Sustainable Business District) induce you to move location? | ||||
| SBD_notSettlement | 1.96 | 0.17 | 0.00 | 0.94 |
| SBD_Settlement | 4.83 | 0.41 | 0.00 | 2.32 |
| Total | 6.79 | 0.57 | 0.00 | 3.26 |
| Does a SBD (Sustainable Business District) location justify a rent premium? | ||||
| SBD_notRent+ | 1.52 | 1.62 | 2.56 | 6.72 |
| SBD_Rent+ | 1.52 | 1.62 | 2.56 | 6.72 |
| Total | 3.05 | 3.23 | 5.11 | 13.44 |
| Are SBDs (Sustainable Business Districts) interesting to you? | ||||
| SBD_interesting | 0.31 | 0.07 | 2.34 | 0.95 |
| SBD_notInteresting | 0.92 | 0.21 | 7.02 | 2.85 |
| Total | 1.23 | 0.28 | 9.37 | 3.80 |
| Hypothesis 1 + Hypothesis 2 | ||||
| Is accessibility a determinant of your location decision? | ||||
| Location_Access | 0.00 | 0.65 | 0.00 | 0.01 |
| Location_notAccess | 0.01 | 6.10 | 0.04 | 0.10 |
| Total | 0.01 | 6.75 | 0.05 | 0.11 |
| Is rental cost a determinant of your location decision? | ||||
| Location_Cost | 0.28 | 1.34 | 0.00 | 0.14 |
| Location_notCost | 1.17 | 5.62 | 0.02 | 0.60 |
| Total | 1.45 | 6.95 | 0.02 | 0.74 |
| Is proximity to other firms a determinant of your location decision? | ||||
| Location_Firms | 0.35 | 0.04 | 11.73 | 8.52 |
| Location_notFirms | 0.17 | 0.02 | 5.70 | 4.14 |
| Total | 0.53 | 0.06 | 17.43 | 12.66 |
| Is proximity to business services a determinant of your location decision? | ||||
| Location_notServices | 1.32 | 0.00 | 6.33 | 0.06 |
| Location_Services | 1.95 | 0.00 | 9.34 | 0.08 |
| Total | 3.27 | 0.01 | 15.66 | 0.14 |
| Is district profile a determinant of your location decision? | ||||
| Location_DistrictProfile | 0.83 | 0.59 | 4.15 | 5.80 |
| Location_notDistrictProfile | 1.13 | 0.81 | 5.66 | 7.91 |
| Total | 1.96 | 1.40 | 9.81 | 13.71 |
| Are green buildings a determinant of your location decision? | ||||
| Location_GreenBuilding | 2.94 | 3.83 | 0.01 | 0.47 |
| Location_notGreenBuilding | 1.43 | 1.86 | 0.01 | 0.23 |
| Total | 4.36 | 5.69 | 0.02 | 0.69 |
Funding
This research received no specific grant from any funding agency in the public, commercial or not-for-profit sectors.