



Abstract
In economic literature, the quality of life (QoL) in a city is usually assessed through the standard revealed-preference approach, which defines a QoL index as the monetary value of urban amenities. This paper proposes an innovative methodology to measure urban QoL when equity concerns arise. The standard approach is extended by introducing preferences for even accessibility to amenities throughout the city into the QoL assessment. The QoL index is then reformulated to account for the unequal availability of amenities across neighbourhoods. The more unbalanced the distribution of amenities across neighbourhoods, the lower the assessment based on the new index. This methodology is applied to derive a QoL index for the city of Milan. The results show that the unequal distribution of amenities across neighbourhoods significantly affects the assessment of QoL for that city.
1. Introduction
The economic approach to measuring urban quality of life (QoL) is based on the work of Rosen (1979) and Roback (1982) who, rather than assessing overall well-being or happiness of households, measure QoL indirectly, in terms of the monetary value of local amenities. They define a QoL index as the monetary value of a set of amenities, where the amenities are location-specific characteristics with positive or negative effects on individual’s utility (Bartik and Smith, 1987; Blomquist, 2006).
This paper focuses on a single city and extends the previous methodology by providing a new measure to assess urban QoL by explicitly taking into account equity concerns. Our methodology relies on the hypothesis that a more equal distribution of resources in the city is beneficial to overall QoL. As we will see later, there are several arguments for equity in the city, some of them used as a starting-point for developing a branch of planning and economic literature. Regardless of the perspective adopted for studying the effect of equity on QoL, or more generally well-being, everyone agrees that the opposite of equity—i.e. inequality—is detrimental to quality of life. The concentration of poor or disadvantaged people in some areas of the city can generate negative externalities and fuel social discontent, eventually leading to slums, delinquency, drugs, and other symptoms of social and economic marginalisation (see Glaeser et al., 2008). In our framework, the priority for equity is captured by the mathematical properties of an explicit evaluation function. The specific form of the evaluation function can embed either citizens’ preferences for equity (where useful, investigated by suitable surveys) or the ethical judgment of a city planner. The main assumption is that an unequal availability of amenities within the city has a negative impact on the evaluation function; in the same way as income inequality generates a loss in social welfare according to Atkinson’s (1970) approach to inequality measurement. Under this assumption, a new QoL index is obtained by discounting the Roback (1982) index through a multiplicative correction term. The more unbalanced the distribution of amenities across neighbourhoods, the lower the correction term. More precisely, the correction term is obtained as the sum of unidimensional inequality indices, accounting for the dispersion of each amenity within the city, plus a residual term summarising any correlation among the distribution of amenities. This formulation can be used to disentangle the contribution of the dispersion of each amenity to the overall index from the joint effect of the amenities. The correction term depends on as many parameters as the number of amenities under examination. Each parameter registers the aversion to the unequal availability of the corresponding amenity within the city. The model is therefore sufficiently flexible to allow for a specific degree of aversion to the unequal availability of each amenity.
One point requires further explanation. Our analysis is based on two different components: the Roback (1982) spatial model and an evaluation function expressing the preferences for equity. In the former, the representative agent looks for the most convenient location given the distribution of amenities across neighbourhoods. The different amenities available at the equilibrium are capitalised in housing prices and the representative agent’s utility is equalised within the city. This outcome is logically independent of the fact that it might be possible to increase or re-allocate some amenities within the city, improving the well-being of the representative citizen. This effect is captured by the correction term depending on the evaluation function. For example, in the short run, agent location decisions depend on the current availability of green areas within the city, which also affects his well-being at the equilibrium. However, if new green areas are developed, especially in neighbourhoods where they are lacking, overall well-being in the city increases. These points of view are reconciled by first computing a Roback QoL index based on the citizens’ evaluation of amenities, then adjusted via the correction term sensitive to their unequal availability.
The suggested methodology is illustrated using data for the city of Milan over the period 2004–08 regarding the availability of education, green areas, recreational activities, commercial facilities, public transport and socio-demographic characteristics. By taking into account the uneven availability of amenities within the city, the Roback index is reduced by 28 per cent.
The methodology is shown in section 2. Section 3 presents the empirical application to Milan with a discussion of the data and variables and a descriptive analysis of the city neighbourhoods. The econometric specification of the hedonic function is also discussed and the results are illustrated in terms of amenity prices and QoL assessment. Section 4 concludes and suggests some potential extensions of our approach, paving the way for future research.
2. Theoretical Framework
This section first reviews the Roback (1982) index, then shows how to measure the availability of amenities within the city and, thirdly, shows how to obtain a new QoL index accounting for the unequal availability of amenities across neighbourhoods.
2.1 The Roback (1982) QoL Index
Let

The implicit price associating the implicit marginal price with mean quantity of the amenity provides an approximated value of the amenities because the prices of infra-marginal units are different from the marginal prices. Such an expenditure computation in (1) merely shows the order of magnitude of the expenditure in the average budget (Roback, 1982, p. 1274).
In what follows, the focus is on a single city, 1 computing a QoL index for the whole city that accounts for the uneven availability of amenities across its neighbourhoods. Focusing on a single city has three main consequences.
First, the implicit prices of amenities in (1) are derived solely from the hedonic housing price equation. Wages are ignored since they are assumed to be determined for the city’s labour market as a whole without variation within the city. Actually, several studies carried out on American cities show that wages may vary slightly within a city. According to Bartik and Eberts (2006), for example, the wages of identical workers decline about 1 per cent for each additional mile the job is located from the central business district (CBD). Even supposing that wages can vary within a city, it is not easy to measure such a phenomenon, since the neighbourhood where individuals live is not necessarily where they work. In addition, the lack of data on employment precludes a consideration of city-wide wage variations.
Secondly, only the prices of amenities that vary within the city can be identified. We ignore several variables usually considered in intercity analysis (for example, climate, altitude).
A third potential problem with intracity analysis relates to spatial sorting on unobservables (Gyourko et al., 1999). This occurs when high-quality housing units are located in the best city neighbourhoods and the factors determining the high quality of houses are unobservable. The value of QoL will be overestimated in the nice neighbourhoods. This point will be returned to in section 4.
The conventional approach is now extended to quantify the availability of amenities for city inhabitants living in different neighbourhoods.
2.2 Amenities and Their Availability
Let us consider a city exogenously partitioned into n neighbourhoods. Each neighbourhood

Suppose that an individual lives in a neighbourhood with few amenities or none at all. He can benefit from amenities located in the surrounding neighbourhoods. Therefore, the overall quantity of the amenities available is the sum of the amenities where the individual dwells, plus a term indicating their presence in the surroundings, whose accessibility is a function of the distance between the neighbourhood we are considering and its adjacent neighbourhoods (see Figure 1).

Distance between district centroids.
In formal terms, starting from

where,
Let

where, the vector of the average quantities
We call this index the QoL index adjusted for the available amenities. A procedure to correct this index accounting for inequality is now presented.
2.3 The Equity-adjusted QoL Index
The idea of ‘just city’ is enshrined in both planning and economic literature. The equity approach developed in planning literature requires that urban amenities and public services must be evenly available in a way such that everyone receives the same public benefit, regardless of socioeconomic status, willingness or ability to pay, or other criteria; residents receive either equal input or equal benefit (Talen, 1998, p. 24).
An alternative approach (needs-based), follows a ‘compensatory’ criterion that subordinates the distribution of facilities and services to the different needs of the population living in different neighbourhoods of the city. 3
In urban economics literature, aiming at evenly available amenities within the city is recommended by Berliant et al. (2006), who determine the optimum number and location of public facilities through a general equilibrium analysis. They prove the existence of an equilibrium characterised by a dispersed and homogeneous distribution of public facilities across locations. They also argue that an equal treatment identical-provision optimum may be justified by the equal protection clause of the US Constitution, federal law or by state constitutions. On the efficiency side, Benabou (1993) shows that stratification can create ghettos and can even bring about the complete collapse of the city’s productive capacity. Finally, from a social welfare perspective, the equal availability of local facilities mitigates well-being inequality (Aaberge et al., 2010) and promotes equality of opportunities in the sense of Roemer (1998) and van de Gaer (1993). Moving from these different equity concerns to an analysis of QoL, a measure of QoL is now derived. This measure is able to disentangle the different relevance, if any, given to the unequal availability of each amenity. For example, the unequal availability of shopping facilities can have a higher impact in lowering QoL than the identically unequal availability of cultural sites. Let

where,
It is well known (see Weymark, 2006) that, under inequality aversion, the value W(

In the same spirit as Atkinson (1970), the elements of the vector
Accounting for inequality, the index adjusted for the available amenities (3) is then modified as follows
Definition 1. For any
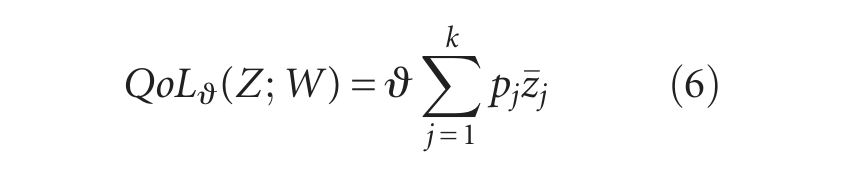
where,
Instead of assessing the value of
3. Empirical Application
In this section, we employ the previous model to assess QoL in Milan, the largest city in Italy after Rome. 6 In addition to being the biggest industrial city in Italy, it is also a historical city with a significant assortment of churches, buildings and monuments mainly inside the Mura Spagnole, the city walls that border the historical city centre. Despite all these positive aspects, other factors do not positively impact on quality of life. Some neighbourhoods have experienced a gradual process of urban decay and more and more Italian residents have abandoned these areas. Housing prices have decreased and these neighbourhoods have frequently attracted newcomers to Milan. The next section describes the information we have collected to capture these phenomena and, more generally, the main variables affecting the quality of life in the different neighbourhoods of Milan.
3.1 Data and Variables
As we showed in relation to the Roback (1982) QoL index in (1), overall QoL depends on the set of amenities considered when implementing the analysis. For the purpose of this study, several data sources are combined into a single dataset that contains detailed information on housing and city characteristics. Data on residential housing transactions were taken from the Osservatorio del Mercato Immobiliare (OMI) managed by a public agency (the Agenzia del Territorio). Transactions refer to 55 neighbourhoods identified by the OMI for a period of 5 years, from January 2004 to December 2008. 7 Each neighbourhood is internally homogeneous in terms of socioeconomic and urban characteristics, making it likely that prices of houses located within a neighbourhood move together. In addition to the housing market value, the dataset provides a detailed description of structural attributes, such as total floor space, age of the building in the year of sale, number of bathrooms, whether the housing unit needs to be renovated, whether the housing unit has independent heating, the floor above street level, presence of an elevator or a garage, and build quality.
Neighborhood-level data on amenities and socioeconomic conditions were taken from public authority records. They include information on six important aspects of quality of life: environmental characteristics, public transport, education, shopping facilities, recreational activities, and socioeconomic characteristics. Table A2 in the Appendix sets out a full list of variables used in our analysis with their sources. Of course, other variables that cannot be so readily observed may contribute to the quality of life as presented in this paper. In addition, depending on the revealed preferences of residents over a limited bundle of amenities, our QoL index could not properly account for the preferences of those residents who give priority to other (omitted) amenities. However, this paper aims to show the potential of our methodology, carrying out an empirical analysis which is as rigorous as possible.
The environmental dimension is proxied by the green areas relative to the area of the neighbourhood (Green); public transport is represented by the number of metro stations (Transport); shopping facilities (Shopping facilities) are proxied by the number of supermarkets, discount stores and malls per 10 000 inhabitants; the recreational dimension (Cultural) is proxied by the number of cinemas, theatres, museums, art galleries, academies of music and libraries per 10 000 inhabitants.
The socioeconomic dimension (Ethnic) is based on the ratio of Italian/foreign residents. More precisely, the Ethnic variable for the neighbourhood i is constructed as

where,
Education is proxied by the proximity to the nearest university (Proximity_University). Unfortunately, we do not have information on other variables for the quality of education, such as the percentage of pupils moving up to a higher class or parameters for classroom and/or building facilities. 9 We do have information on the degree of availability of different educational levels, such as the number of primary and secondary schools, both public and private, in the neighbourhood. We also have data on early years of education—i.e. the number of nursery schools and pre-schools. We tried alternative specifications including these variables but none of these turned out to be statistically significant. There are at least two reasons for this result. First, the number of schools available in the neighbourhood is a rough proxy of education services and is unable to capture the quality of education services. Secondly, the variability of some of these covariates is quite modest across neighbourhoods.
In addition to these amenities, the Euclidean proximity of each neighbourhood to the city centre is included, in order to handle the problem of the spatial sorting on unobservables described in section 2.1. Furthermore, the Euclidean proximity to the city centre enables verification of the hypothesis of a monocentric structure of the urban area modelled by Alonso (1965) and Muth (1969). The urban pattern of Milan is clearly identifiable by the old inner ring of inland waterways (Navigli) designed by Leonardo da Vinci. Outside the former, a second ring comprises the Mura Spagnole. The most important historical monuments (Duomo, Castello Sforzesco, Royal Palace, etc.) and historical buildings of residential use are located within the two rings, beyond which, as far as the confines of the municipal territory, large neighbourhoods spread out. 10
Descriptive statistics are set out in Table 1. Amenity statistics enshrine the availability of amenities in the bordering zones, calculated by using the distance function
Summary statistics for the variables
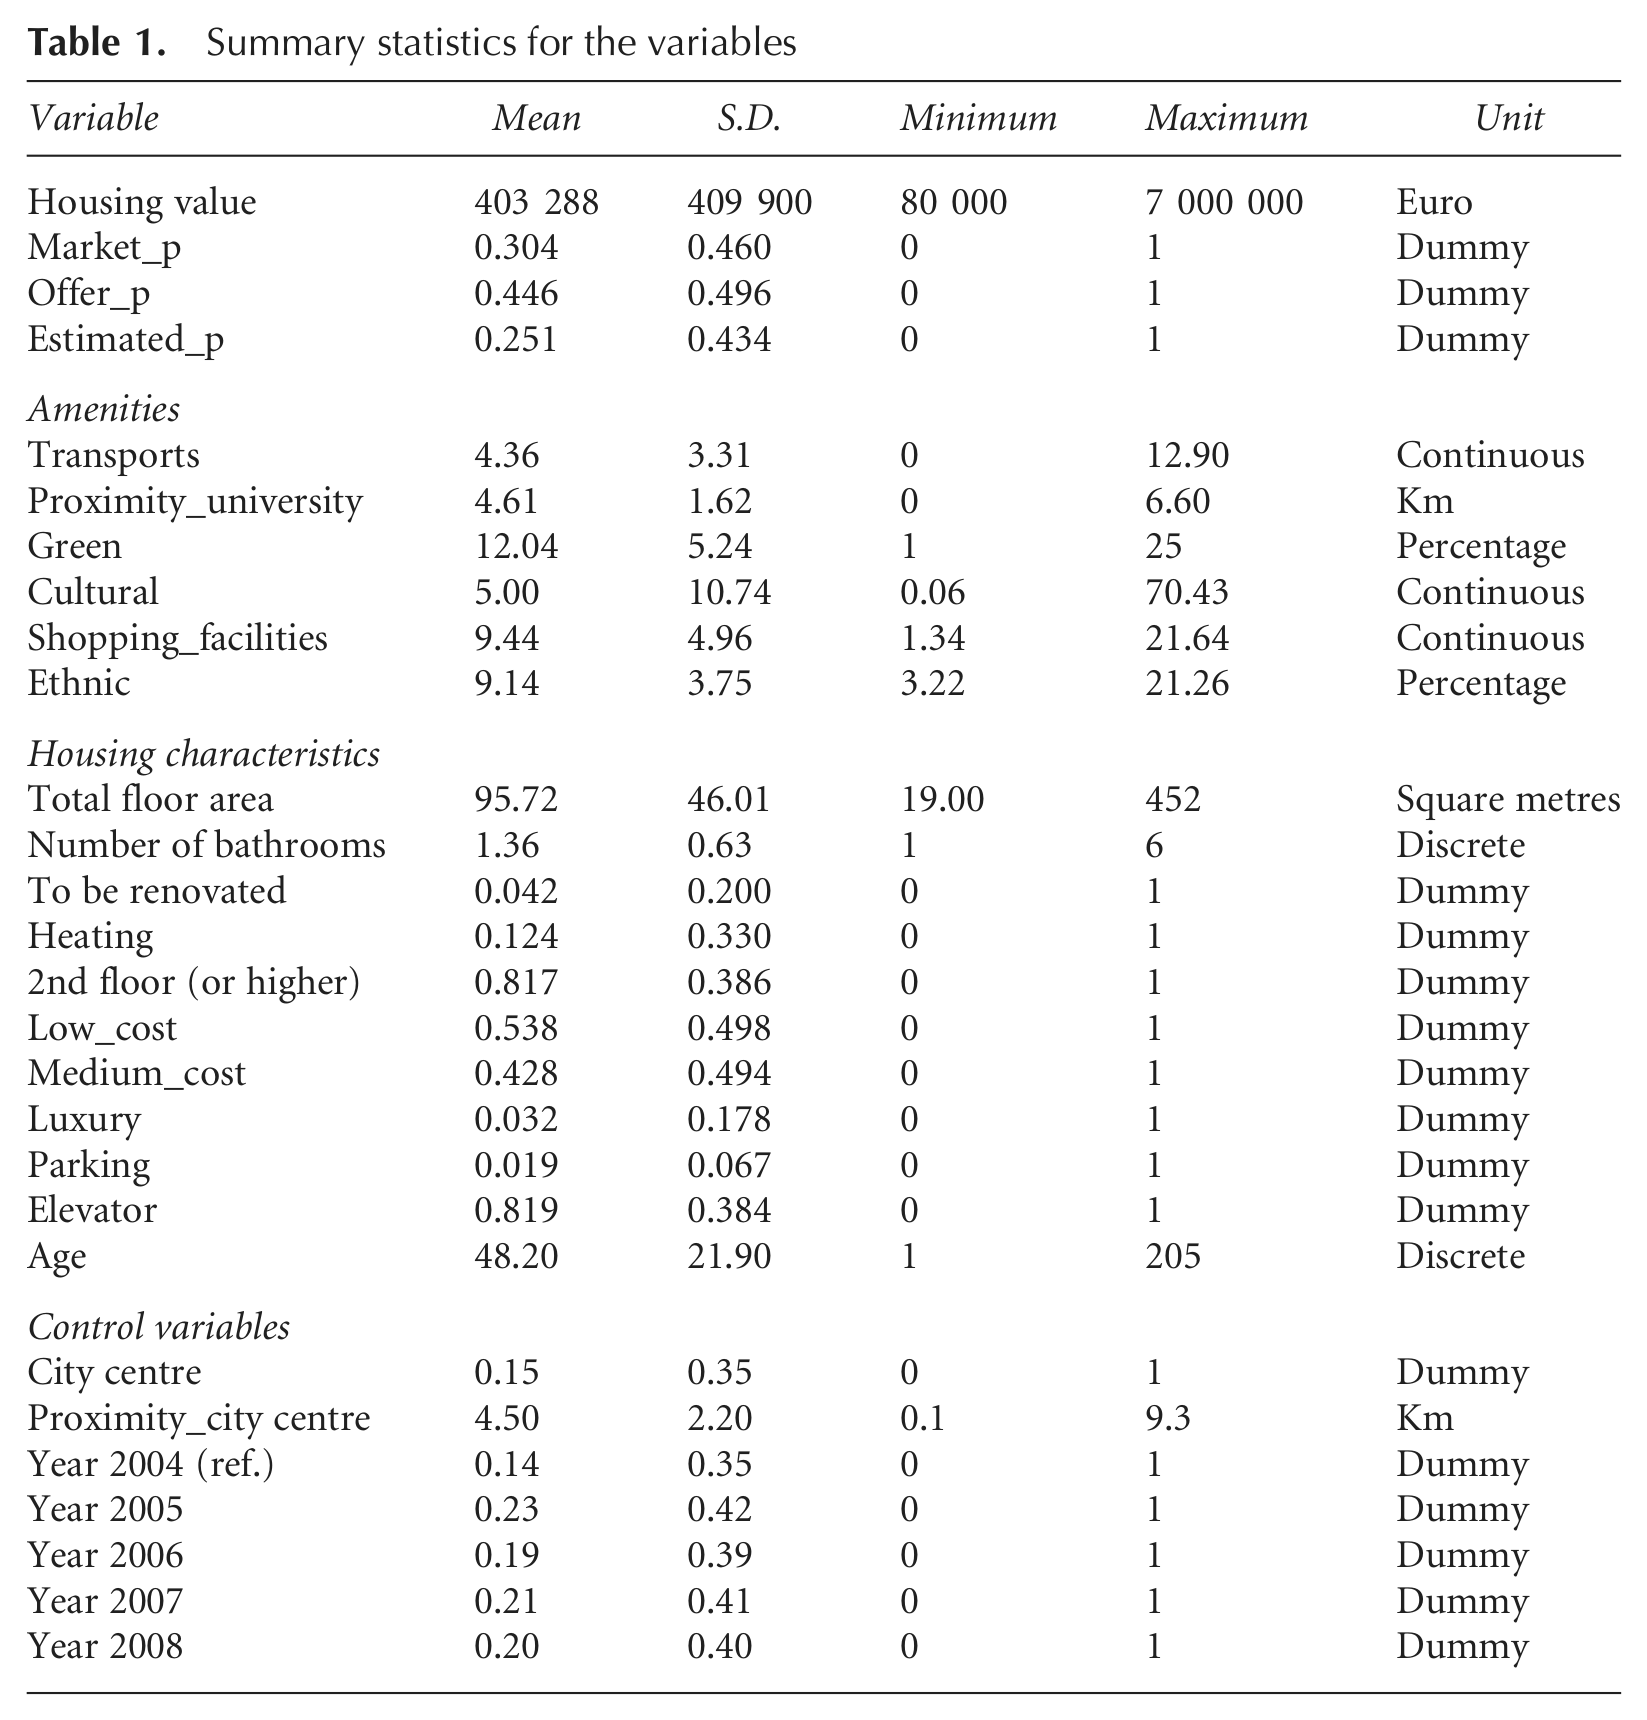
The average value of the 2592 properties sold over the 2004–08 period was €403 288. The average property had 95.72 square metres of total floor space and was 48 years old at the time of sale. Each neighbourhood had on average 12 per cent of greenery in the urban area, but with substantial differences—from 1 per cent in the Ronchetto Chiaravalle Ripamonti neighbourhood in the south-west to 25 per cent in the off-centre neighbourhood of Monza Precotto Gorla in the north. The number of metro stations also varies greatly: from 0 to 13 stations. Each neighbourhood had on average 9.44 shopping areas and five cultural sites per 10 000 inhabitants. Finally, the average ratio of foreign to Italian residents in the neighbourhood was 9 per cent, the minimum percentage being 3.22 and the maximum 21.26.
3.2 Estimated Implicit Prices
To obtain the full implicit prices of location-specific amenities given in (6), we estimate a reduced form of the housing price hedonic equation

where,
3.3 Results
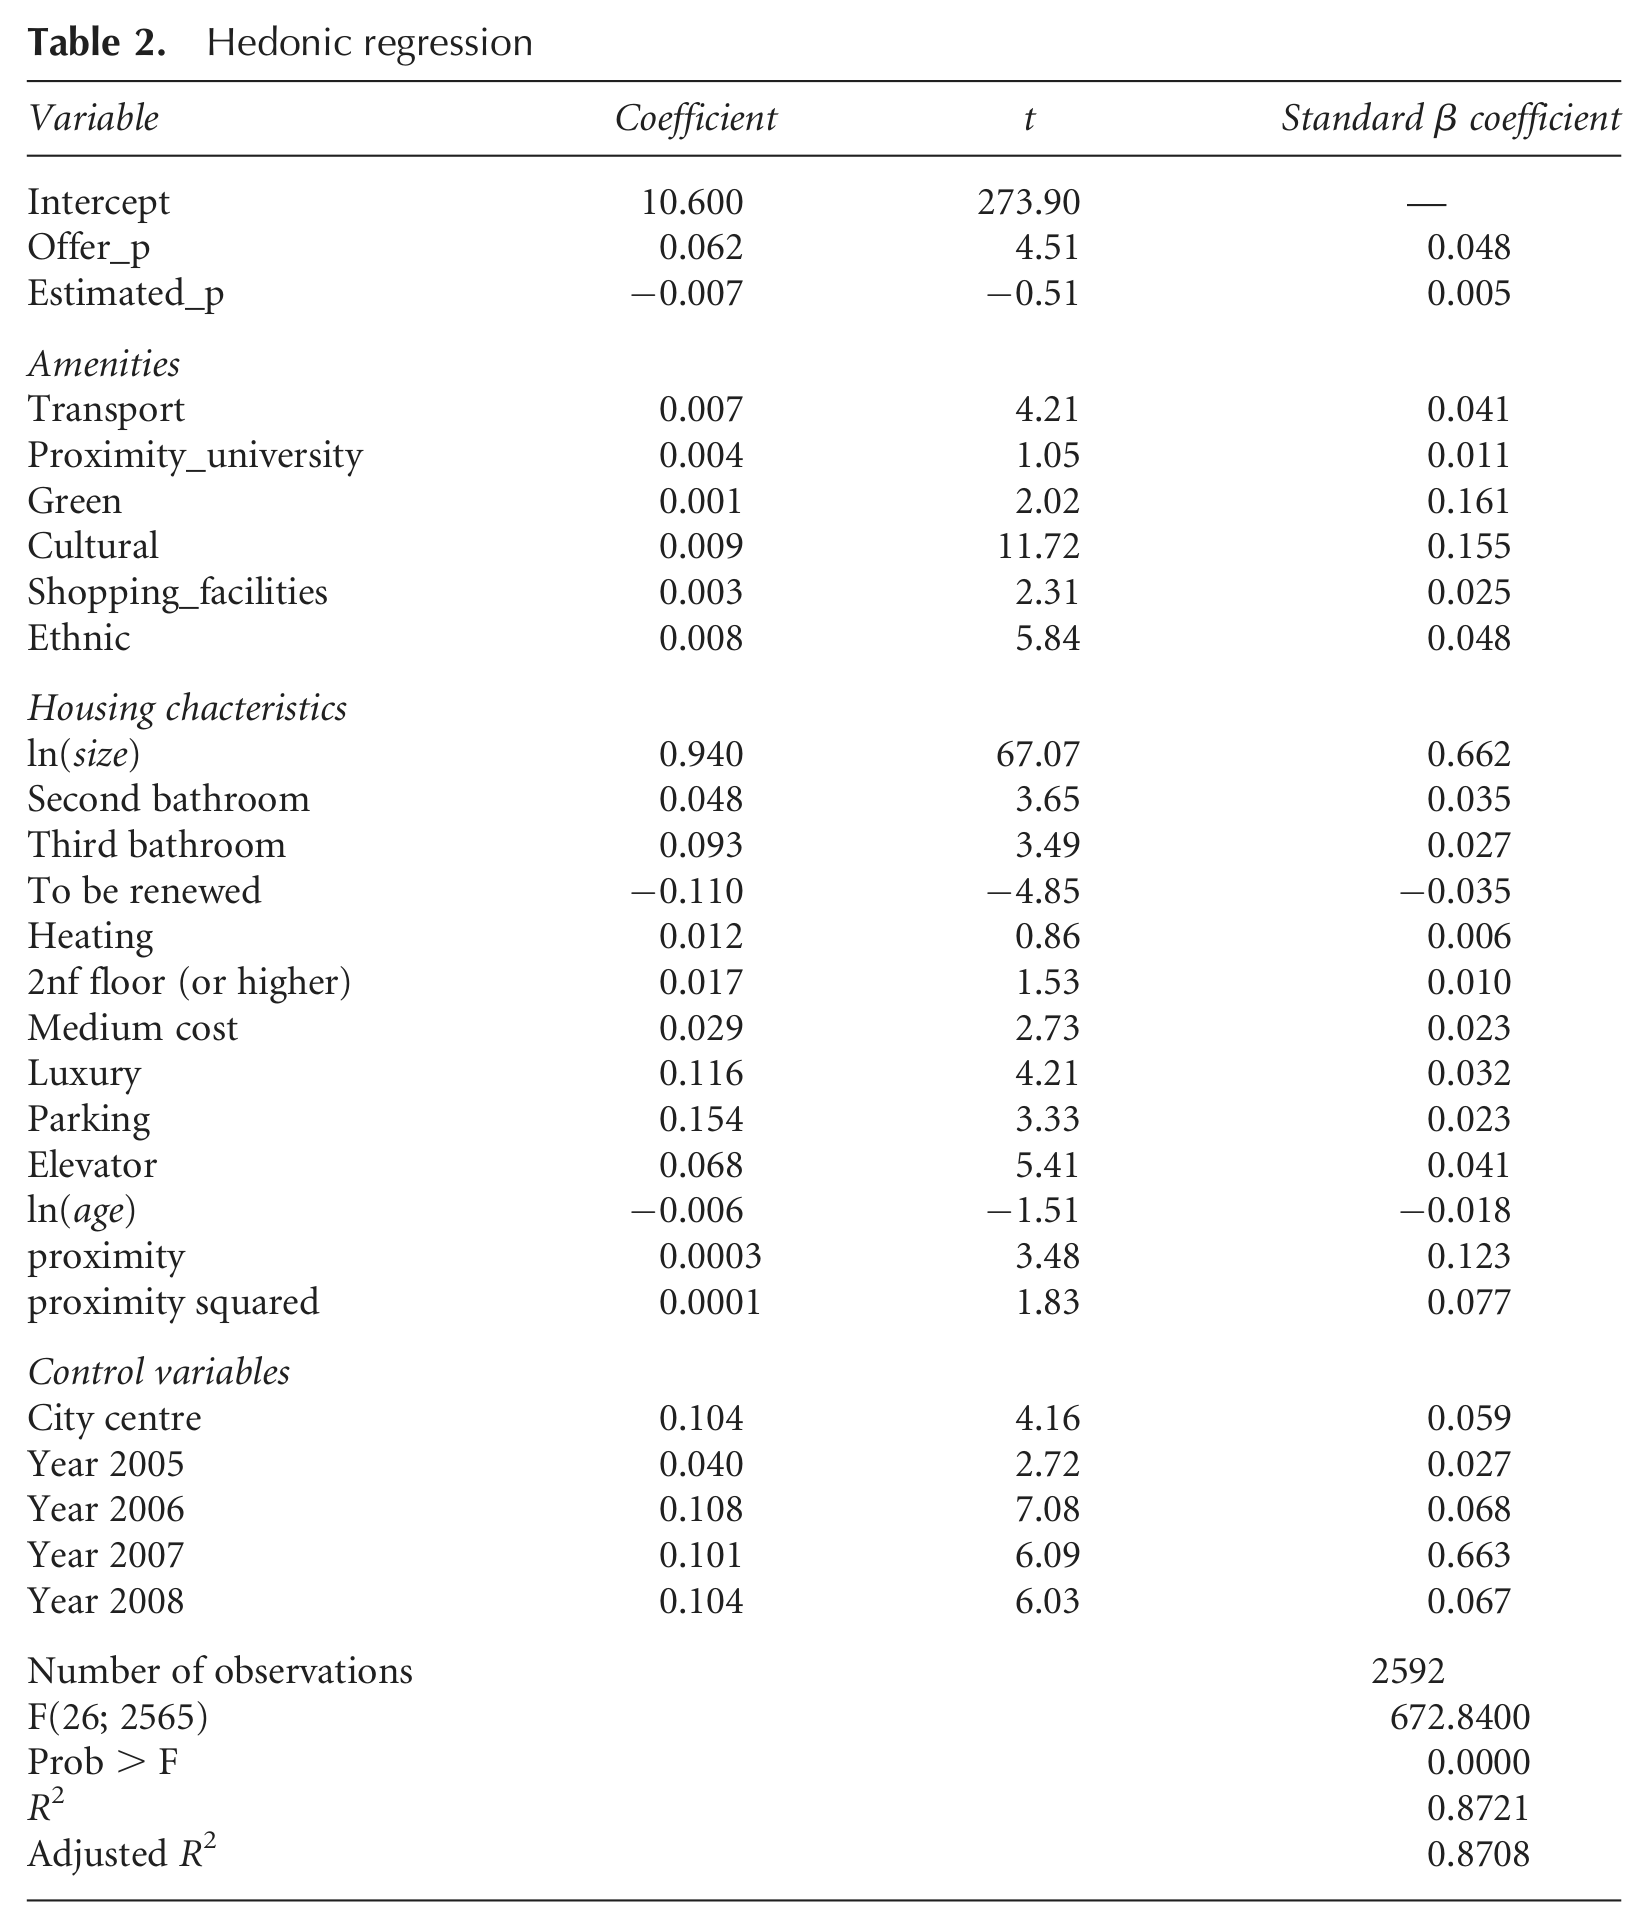
Table 2 presents the results obtained from estimating (7) by OLS. Robust standard errors are used with clustering at neighbourhood level in order to allow for within-neighborhood correlation. All in all, the housing variables used in the model account for about 87 per cent of the variance of the logarithm of price. The stability of the regression model was verified using pairwise Chow tests on adjacent sub-periods. The hypothesis of no structural change is not rejected with the exception of the sub-period 2006–07. Therefore our model appears to be sufficiently stable. The amenity coefficients are statistically significant; to quantify their relative importance in our specification, standardised beta coefficients are set out in column 3. 11 According to this criterion, the most important amenity is Green since an increase by one standard deviation in this variable implies an increase of 0.161 standard deviation in the value of the housing unit. One possible explanation of the statistical relevance of this variable is that it measures not only the size of the available green areas, but also the facilities which are often located within gardens and parks (playgrounds for children, bicycle lanes and sports centres). The next amenity in terms of importance is Cultural (0.156). In this case, the importance could be explained by the location of specific theatres and museums in ancient buildings where individuals appreciate aesthetic and artistic value. For example, the Museum of Ancient Art is in the Castello Sforzesco, probably the most famous building in Milan, together with the Duomo and La Scala Opera House. The other standardised beta coefficients are 0.048 for Ethnic, 0.042 for Transport, 0.025 for Shopping facilities and 0.011 for the proximity to the nearest university (Proximity_university).
Hedonic regression
Full implicit prices for each amenity are shown in Table 3, with Cultural, Ethnic and Transport showing the highest prices in absolute value. The hedonic price for an additional cultural site per 10 000 inhabitants in the areal unit is €2839; increasing the Italian/foreign ratio by one leads to an increase of €2500 in the value of the average housing unit and an additional metro station provides a benefit of €2470. We included distance from the nearest university and it turns out that reducing the distance by 1 km increases housing unit value by €1377. The estimated implicit price for an additional shopping facility per 10 000 inhabitants is €1051 and the hedonic price for public green areas is € 612 for one more percentage point.
Hedonic prices and QoL indexes

Column 2 in Table 3 sets out the values of ϵ, given by (A6), which corresponds to the contribution of each amenity to the determination of the overall QoL index adjusted by the availability of the amenities defined by equation (3). These values are represented in the pie chart in Figure 2 where it is evident that variables related to social dimension (Ethnic) and leisure (Cultural) play the most important role.

Contribution of amenities to the overall QoL index adjusted for the availability of amenities.
According to the model presented in section 3 and detailed in the Appendix, the weights
The last column in Table 3 shows the values of the equally distributed equivalent share
The last step backward defines the extent of the reduction of the QoL index adjusted for the amenity availability shown in (3). This value amounts to €71 473. The calculations carried out show that the overall correction term
3.4 Discussion
This result implies that the uneven availability of amenities within the city reduces the index adjusted for the availability of amenities (3) by 28 per cent. Increasing the level of amenities improves quality of life but their even availability also matters. Figure 3 shows the level of QoL by neighbourhood computed according to (3). 13 This map confirms the monocentric shape of Milan where QoL levels are much higher in the city centre and decrease as the distance from the centre increases. All neighbourhoods in the city centre have a QoL value near to or far exceeding €100 000, with the exception of neighbourhood 6—Castello, Melzi d’Eril, Sarpi with a value of €74 775. This lower value is due to the numerous settlement in the past 10 years of wholesalers trading in clothing and leather goods, essentially comprising a Chinese community. Moreover, in the district there is friction between residents and wholesalers because of the continuous loading and unloading of goods, causing traffic problems and endangering pedestrians. The lowest value (€30 096) is for neighbourhood 55—Quarto Oggiaro, Roserio, Amoretti—which sprang up in the 1950s to house workers from southern Italy. In the course of time, this neighbourhood developed a reputation for organised crime, dilapidated housing and a high percentage of illegal immigrants (of the 4000 apartments made available by public housing, 700 are occupied illegally).
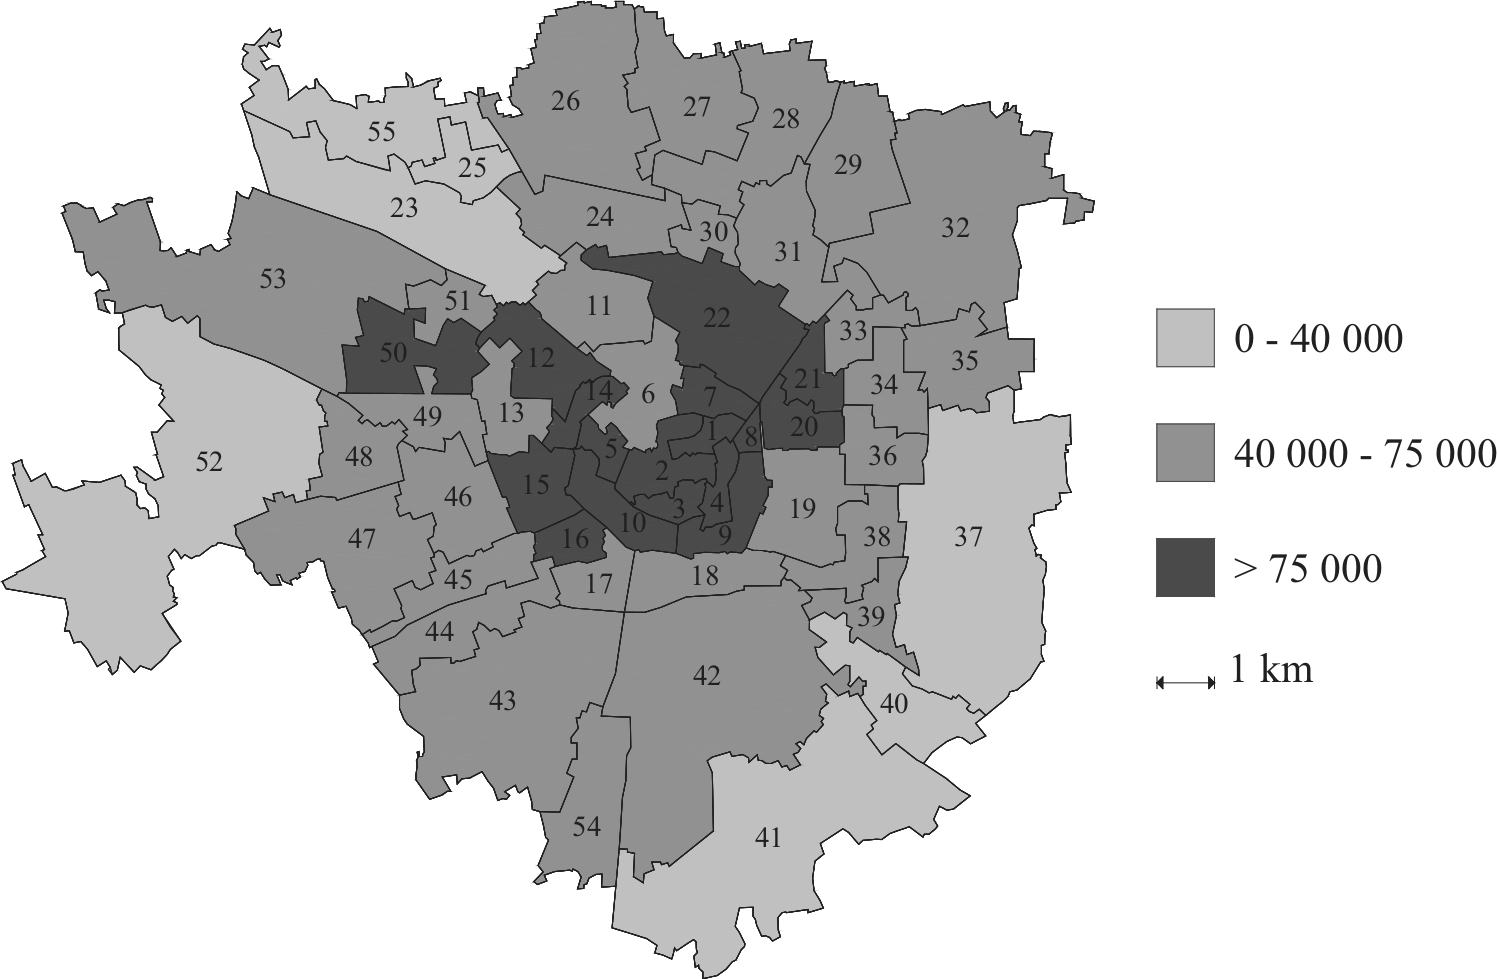
QoL across Milan neighbourhoods. Key: see Table A1 for key to names of neighbourhoods.
The relationship between the value of QoL and income across neighbourhoods is examined. The Pearson correlation coefficient is 0.846 implying that QoL is strongly positively related to income. This result is in line with the study of Brueckner et al. (1999) regarding the importance of amenities in driving the location choice of rich individuals towards the best-endowed neighbourhoods, rises rapidly with income.
We conclude this section with a concern about whether these empirical results would still be meaningful if the needs-based criterion of equity in the city, cited in section 2.3, was adopted. Suppose for instance that households comprising people of over 65 years of age are concentrated in a few city neighbourhoods. In this case, it would be reasonable to concentrate amenities such as healthcare services in these neighbourhoods. To investigate this point, we looked at the distribution of two kinds of households with specific traits able to shape their preferences (households with children and people over 65) in Milan. It turns out that these households are evenly distributed across city neighbourhoods (their Gini concentration index is respectively 0.056 and 0.068) so we can conclude that our results hold up against the preference heterogeneity induced by the demographic composition of households.
4. Concluding Remarks
This paper is an original attempt to bridge the gap between the urban economics and inequality measurement literature. Starting from the premise that these two fields of economics share a multidimensional view of QoL, we propose an innovative methodology to assess urban QoL when equity concerns arise. Without recommending any specific equity perspective, we show how preferences for equity can be introduced into QoL assessment through a simple list of parameters which generate a correction term for the Roback QoL index adjusted for amenity availability. Our empirical investigation for Milan indicates the quite significant impact of inequality on the QoL index for the whole city. To disentangle this result, we assessed QoL across neighbourhoods, showing significant differences. Milan has a monocentric shape like other major European cities both in terms of income and QoL values. These two variables are strongly positively related across Milan’s neighbourhoods. Better-endowed districts attract wealthier households. It follows that to decrease stratification in the city, improving efficiency and equalising opportunities and life-chances in the spirit of Massey and Denton (1996), policies favouring a more even availability of amenities should be promoted. In this perspective, our methodology has a wide range of applications, from simulating the effects of changes in the provision of public goods on QoL, to the analysis of poverty and stratification at the urban level. It can also be used to assess the effects of gentrification (Helms, 2003; Lees, 2008) or urban renovation policies (Barthélémy et al., 2007). Finally, our approach could be extended on the basis that certain groups might be better clustered for equity reasons (i.e. the elderly or families with children). In this case, the correction term applied to the QoL indicator should account for the degree of association between the distribution of these categories of people and the spatial provision of specific amenities. This constitutes a promising avenue for future research.
Footnotes
Appendix. Derivation of the Correction Term ϑ in the Equity-adjusted QoL Index
To derive the correction term
This specification has several advantages
The aggregation property for
These indices are interesting in themselves because they reflect the unequal availability of the different amenities across city districts.
15
Moreover, one can delve into the contribution of the distribution of each amenity to the correction term
Proposition 2: (Abul Naga and Geoffard, 2006) If
where,
Moving on now to the calibration problem, notice that equations (A2), (A3) and (A4) depend on the vector of parameters
where,
Assumption: The relative inequality aversion coefficient
Each parameter
All in all, the methodology can be summarised in the following steps
These two steps are sufficient to compute the QoL index adjusted for the availability of the amenities (4). To compute the equity-adjusted QoL index (5) the procedure also includes the following three steps
Acknowledgements
We gratefully acknowledge the Osservatorio del Mercato Immobiliare for data on housing transactions; the Statistics Bureau of the Municipality of Milan joint with the Department of Statistics of the University of Milano-Bicocca for data on income and demographic variables; Luca Stanca for data on public transportation. We would like to thank the editors for their time and valuable remarks. We thank also Rolf Aaberge, Francesco Andreoli, Michel Le Breton and Vito Peragine for useful discussions. The usual disclaimer applies.
Notes
Funding
Financial support by the Italian Ministry of University and Research and the Institute for Economic Research on Firms in Vicenza is gratefully acknowledged.