



Abstract
The Seoul metropolitan government (SMG) is considering the replacement of at-grade or elevated railways penetrating the city’s central area with underground subways. The railways once played a key role in forming main transit corridors in the early development stages of the city of Seoul. Now, however, they are a burden in the efforts of the SMG to enhance livability in the vicinity of urban railways. Over the past few decades, the at-grade elevated railways have led to economic deterioration by severing neighbourhoods and causing serious environmental problems such as noise, vibration and an unattractive landscape. The present study focused on laying the empirical groundwork for the SMG to replace at-grade or elevated railways with underground subways. An aggregate-level regression model, in a form similar to a hedonic price model, was developed to identify the net influence of the existence of at-grade or elevated railways on nearby land values. Potential variables that would account for the price of land along urban railways were chosen based on insights and empirical results from previous studies. Statistical tests have verified a significant difference in several variables according to whether a station area belongs to at-grade (or elevated) railways or underground subways. As a result of the regression model, it was confirmed that the land price of areas along at-grade or elevated railways are much less than those along underground railways, all else being equal.
Introduction
An emphasis on livability has recently led to the elimination of massive transport structures elevated in urban areas. Among many projects with respect to the demolition of elevated freeways, the Cheong Gye Cheon project was unique as a 5.6-km-long stretch of freeway penetrating the central business district (CBD) of Seoul that was demolished with no serious problems in structural stability. 1 The Seoul metropolitan government (SMG) announced that the objective of the demolition was to enhance the livability of neighbourhoods and to provide a rest space for citizens by rehabilitating a stream that once occupied the space where a viaduct had been built (Seoul Metropolitan Government, 2003). Another point was that the project included no substitution for the reduction in road capacity. The demolition even considerably reduced the number of lanes on the surface road, giving the space to the newly rehabilitated stream. To the best of our knowledge, most projects involving the tearing down of elevated freeways have transpired due to the structural instability that can stem from either seismic activity or natural deterioration, and have placed a high priority on preparing at-grade boulevards that can make up for the reduced capacity (Cervero et al., 2009; Sohn, 2008; Napolitan and Zegras, 2008; Rao, 2004). The Big Dig project in Boston, which had been a strong buttress for advocates of the Cheong Gye Cheon project, also focused on making substitute tunnels instead of tearing down an elevated highway (Tajima, 2003). Nonetheless, the results of the Cheong Gye Cheon project were successful and satisfied both the general public and the business interests in the area.
With motivation from the success of the Cheong Gye Cheon project, the SMG recently turned their eyes to replacing the at-grade or elevated railways with underground subways. The present study began with a concern that the replacement plan should not be implemented without knowing how advantageous or disadvantageous the project would be for the entire society. Of course, even though the replacement plan was intuitively seen as beneficial, since there was no capacity restraint, inexplicit positive expectations are not a sufficient rationale for the vast cost of the project. The social benefits of such a replacement have not been seriously delved into by an urban study in Korea. Real cases of demolishing at-grade or elevated railways have been rare and the benefits would be very hard to measure even if there were such a case. An interesting historical document was discovered during the period of preparing the present study (Whitney and Harkness, 1916), which revealed that in the early stages of the building of New York City there had been a similar debate as to whether an elevated railway should be reinforced with a third track or substituted by a new subway in parallel. The commission responsible for the decision concluded in favour of the reinforcement because of the huge cost involved for the other alternative. Much more recently, in Paris and again in New York City, two decommissioned railway lines were transformed into ecologically oriented green spaces (Foster, 2010). The restoration of these railway lines however, was easy to implement because there was no burden involved in the provision of an alternative subway.
Most of the candidate railway lines for the replacement plan in the Seoul metropolitan area have more than 100 years of history. The current subway network in the area was formed with the old at-grade railways left intact. The at-grade railways once played an important role in forming main transit corridors in the early stages of the development of Seoul, but now they have become a burden in the current efforts of the SMG to redevelop the vicinity of urban railways, following the principles of transit-oriented development (TOD) that new urbanists have advocated (Cervero and Kockelman, 1997). In the past few decades, the at-grade or elevated railways have led to economic deterioration by severing neighbourhoods and also have given rise to serious environmental problems such as noise, vibration and unattractive landscapes. In particular, at-grade railways have done more harm to nearby neighbourhoods than any other form of surface transport facilities. Neighbourhoods are severed and it is difficult to install crossings to connect segregated areas. Moreover, railway crossings have caused serious safety problems according to the statistics provided by the Korean Railway Corporation (KRC). During the past five years, approximately 110 accidents have been associated with railway crossings. This figure alone would be sufficient to justify the rationale for implementing the replacement plan.
As mentioned earlier, aside from such a vital reason, the social benefit associated with the replacement plan includes neighbourhood integration, an increase in livability and amenities, and the improvement of the landscape and the environment. However, all of this is not easily quantified into a monetary value. According to guidelines by the Korean government that are designed to assist in conducting feasibility studies for installing major transport facilities, the benefit from the replacement plan would be minimal unless the substituted subway entailed a remarkable speed enhancement (Korean Ministry of Strategy and Finance, 2009). Unfortunately, it would be difficult for the replacement plan to speed up the subway without the provision of much more space underground. The present study thus set up an indirect criterion to quantify the potential benefits based on a reliable dataset collected from the Seoul metropolitan area. The criterion then provided an empirical groundwork for the SMG to replace at-grade or elevated railways with underground subways. Unlike the case of the Cheong Gye Cheon project that was initiated with political innuendos, advantages in replacing at-grade or elevated railways with underground subways have been objectively clarified in the present study—prior to putting the plan into practice.
It was hypothesised that current land prices could encompass the effects of whether at-grade (or elevated) railways or an underground subway existed nearby and that the difference in land prices could be regarded as a benefit of the replacement plan. In order to filter out influences other than the existence of at-grade railways, potential variables that would be associated with land values were chosen based on the insights and empirical results from previous studies (Choi et al., 2012; Sohn and Shim, 2010; Kang and Cervero, 2009). A statistical test was conducted to show significant differences in the variables according to whether a station area belongs to at-grade (or elevated) railways or to underground subways. A regression model at the aggregate level, which took the similar form of a hedonic price model, was developed to identify the net influence that the existence of at-grade (or elevated) railways has on the value of nearby land.
In the next section, the choice of potential variables that might affect the average land value within catchment areas of urban railways and subways will be dealt with in detail. The third section will provide a conceptual framework representing the expected relationship between the potential variables and land price. The data collection process will then be accounted for in the fourth section followed by a presentation of the results from statistical tests for the difference in each chosen variable according to whether a station is in at-grade railways or underground subways in the fifth section. A regression model developed to derive the net effect of the existence of at-grade or elevated railways on the nearby land values will be introduced, and the results from the model will also be discussed in the sixth section. Finally, conclusions will be drawn.
Potential Variables Affecting Land Prices
Prior to introducing the potential variables affecting land prices, it should be noted that the land prices considered in the present study were averaged across every land parcel within a station area. Details of how to determine the dimensions of the catchment area (defined as a radius of 500 metres from a station) and the average land price for the area will be addressed later in the data collection section. The reason an aggregate value was adopted instead of a parcel-based price is two-fold. The objective of the present study was to provide the groundwork for replacing at-grade railways with underground subways, which could be directly applied to a further feasibility study. In this context, it was more convenient to identify the influence of the existence of at-grade railways on land prices at an aggregate level rather than at the individual-parcel level. Moreover, unlike land prices, data for other influential variables would be prohibitively difficult to collect on an individual-parcel basis.
A dummy variable (At_grade_dummy) representing whether a station belonged to an at-grade (or elevated) railway was the target of the present study—to identify a drop in land value due to the existence of nearby at-grade or elevated railways. In particular, the present study did not distinguish between elevated stations and at-grade stations. The distinction was neither statistically significant nor intuitively accountable for any model specification tested later in the modelling framework section. The term ‘at-grade’ will hereafter be referred to as encompassing the term ‘elevated’. The integration was also justified by the test result from an ANOVA. Thus, it was concluded, with a very small F-statistic (= 0.182), that land prices within the station areas of elevated railways did not significantly differ from those of at-grade railways.
The rest of the potential variables were taken into account for the purpose of extracting the net effect of the dummy variable from other effects. Potential variables that might affect land prices were chosen among variables adopted in the previous studies (Choi et al., 2012; Sohn and Shim, 2010; Kang and Cervero, 2009) and were categorised into three groups: built environments; external connectivity for both the Metro and highway networks; and, intermodal connections. The first group included variables that were conventionally hypothesised to affect land prices. Variables in the second and third groups were chosen to explain the impact of transport efficiency on land values.
Built Environment Variables
As mentioned earlier, the present study dealt with variables at the aggregate level and chose the area that lies within a 500 metre radius of a station as the spatial boundary for the aggregation. The area within this walking distance from a station will hereafter be referred to as the pedestrian catchment area (PCA). The population and employment within the PCA of each station were first chosen as variables that were associated with the average land price. The net floor areas of buildings within walking distance were then chosen as a complementary variable. Floor area was categorised into four types: residential, office, commercial and other use. In addition to the basic built environment variables, the impact of a specific activity generator was taken into account. There are 35 universities in the Seoul metropolitan area that have a railway or subway station within or close to them. A dummy variable (Univ_dummy) to accommodate the impact of universities was employed under the hypothesis that such stations are related to the economic vigour that might raise nearby land values.
Neither was it clear that the passenger ridership (Boardings) in a station was associated with land prices within a station’s PCA. Simply put, to verify the relationship between them, the average weekday ridership at each railway and subway station was chosen as a potential variable. Many researchers have dealt with variables associated with a land use mix, connectivity of walk paths, street network density, etc., from which transit demand was derived (Forsyth et al., 2009; Bhat and Guo, 2007; Kim et al., 2007; Khattak and Rodriguez, 2005). In the present study, walkability and land use diversity were assumed to be associated with land values. The walkability indicator was calculated based on the methodology suggested by Schlossberg and Brown (2004). Among the six indicators they proposed, only three were employed due to the availability of data—i.e. the quantity of impedance paths (Impedance_road), the density of pedestrian-friendly intersections (Ped_friendly_nodes) and the density of dead ends (Dead_ends), respectively. In order to obtain the first indicator, an assumption was made that pedestrian use is interrupted by heavily automobile-dominated streets (such as, major arterials and freeways). The total length of such impeding streets was recorded for each station’s PCA. In calculating the second indicator, the number of intersections within each station’s PCA that are crossed by only pedestrian-friendly streets was counted. A pedestrian-friendly street was defined as a street with a sidewalk on each side, having less than two car lanes in both directions, and with no signal control. Dead-end streets exist when a pedestrian-friendly street reaches a major arterial and does not extend further. The number of dead-end streets was also counted for each station’s PCA. The second indicator was hypothesised to affect land prices positively, while the other two indicators were assumed to have negative influences on land prices.
The land use mix diversity (Land_use_mix) was quantified by a formula suggested by Bhat and Guo (2007). They introduced equation (1) as a land use composition measure to compute a land use diversity indicator (LI) . This indicator was expected to have a positive impact on land prices
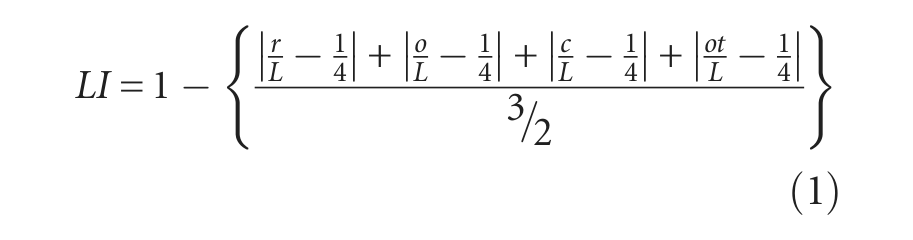
In equation (1),
A building’s age is known to affect the building price directly in terms of the results from the previous studies dealing with the hedonic price model for the housing market (Cervero et al., 2009; Kang and Cervero, 2009). However, it is interesting to identify the relationship between a mean land price representing an area and the mean age of buildings within the area. The present study computed an average value of each building’s age within a station’s PCA. Anyway, the variable was expected to be negatively associated with land value.
There are two city centres in the Seoul metropolitan area: the historical CBD is located in the city’s geographical centre; and the growing Gangnam district is in the south-east (Sohn and Kim, 2010). Two dummy variables were created to investigate the effect of whether a station would fall in one of these two city centres (CBD_dummy and GN_dummy). A variable (Net_pop_density) was included to identify the influence of net population density on land price, which was synthesised for each station’s PCA by dividing population by total residential floor area. This variable could be a surrogate variable for indicating the socioeconomic status in a station’s PCA. Wealthy people tend to consume more housing and thus the variable can substitute for the average income level. The variable was expected to identify the relationship between land value and the socioeconomic status of residents.
External Connectivity Variables
The efficient connection of transport is a very influential factor in determining land prices within the PCA of stations. To consider network efficiency, three types of centrality indices were calculated for each station. Aside from the closeness concept, which is very similar to the accessibility concept that has been widely adopted in the field of urban studies (Giuliano et al., 2012; Chi, 2012; Matsuo, 2011), the concepts of betweenness and straightness are a novel idea of the present study. For brevity, rigorous formulas to compute the indices have been omitted, details of which are shown in Sohn and Kim (2010). A brief description of the three centrality indices follows.
The present study took into account centrality indices based on both railway (including subway) and highway networks. Both centrality variables were expected to show which mode’s network efficiency has a greater impact on land prices between private cars and mass transit. Closeness centrality (Closeness_RW or Closeness_HW) was defined as the extent to which a station is close to all other stations along the shortest paths on highway or railway networks (Wasserman and Faust, 1994). Closeness centrality can be thought of as the equivalent of accessibility in an urban study because both terms commonly refer to the ease of reaching a certain point. Those who are in a place that is highly accessible (or has high closeness centrality) can reach many other locations quickly. A centrality index that is based only on distance extends to a more general form of accessibility by adding an opportunity term and by substituting generalised travel cost for distance (Hansen, 1959; Koenig, 1980). Betweenness centrality (Betweenness_RW or Betweenness_HW) is based on the idea that a station is central if it lies on the shortest paths that connect many pairs of stations. The station that is traversed by the greatest number of the shortest paths has the highest betweenness. Betweenness centrality is traditionally used in graph theory (Anthonisse, 1971; Freeman, 1979). The conventional algorithm for betweenness centrality is known to impose a large computational burden and a faster algorithm has recently been proposed to tackle the problem (Brandes, 2001). Straightness centrality (Straightness_RW or Straightness_HW) stems from the concept that the efficiency in travel between two stations is equal to the ratio of the direct distance and the shortest network distance (Latora and Marchiori, 2001). Another variable was introduced to account for accessibility to city centres. The average distance from a station to each of the two city centres (Dist_to_centres) was calculated based on the railway network and was set as a new variable under the assumption that quick access to city centres could raise the value of land.
Intermodal Connection Variables
In order to consider the efficiency of intermodal connections on land value, five variables were chosen. It is well known that livability cannot be advanced if people are suffering from frequent, inconvenient transfers when commuting by public transport. To identify the effect of the inconvenience on land prices, a variable was generated by averaging the number of transfers across an itinerary from one station to all other stations (Num_transfers).
The number of bus lines stopping at Metro stations was counted. Each bus line fell into a trunk or feeder group. Both the number of feeder lines (Feeder_bus) and the number of trunk lines (Trunk_bus) were hypothesised to be positively connected to land value, by raising the convenience level of mass transit. To accommodate the difference in land value between normal and transfer stations, a dummy variable indicating whether or not a station (Transfer_dummy) was a transfer station was adopted in the present study. In addition, the number of railway and subway lines passing at transfer stations (Num_passing_lines) was also introduced as a potential variable. These two variables were expected to play a role in catching additional contributions to land value, since the extra ridership in transfer stations could bring about economic vigour in the vicinity of stations.
Conceptual Framework
For elucidation, a conceptual framework was established that would summarise the relationship between potential variables and land prices. Within this conceptual framework, we provided several sub-divisions of the three variable groups listed earlier. Built environment variables were categorised into three sub-groups: the conventional demographic and land use variables, pedestrian-related variables and the target variable of whether a station belongs to at-grade (or elevated) railways or underground subways. For the external connectivity variables, the connectivity on railway networks was segregated from that on highway networks. The last group of variables was divided into two sub-groups representing interconnectivity across different railway lines and transfers between other public transport modes. The expected sign of the potential variables was also indicated in the conceptual framework. The dotted line in Figure 1 indicates the negative impact that the corresponding variable would have on land prices.
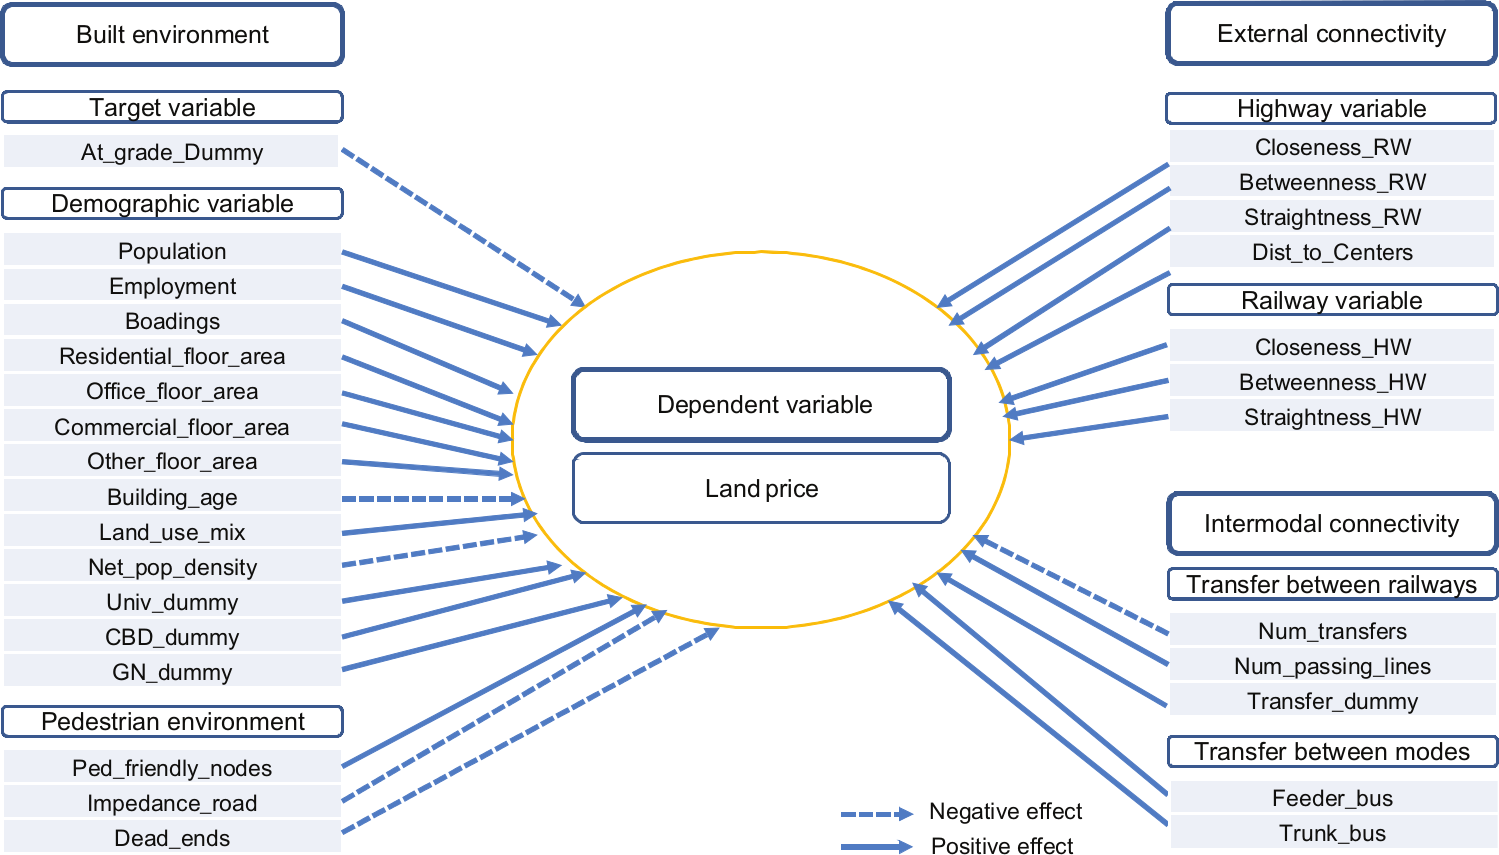
Conceptual framework.
Data Collection
Prior to accounting for how to collect data, it was crucial to determine the dimension of PCA, within which data were collected and averaged. A considerable number of studies have been conducted to evaluate the acceptable walking distance for transit riders (Canepa, 2007; Murray et al., 1998; O’Sullivan and Morrall, 1996). Results have ranged from 400 to 800 metres, in either straight line or actual distances. The walking distance of railway or subway riders in the Seoul metropolitan area was also investigated and a straight line distance of 500 metres in radius has been accepted as a standard for transport studies in Korea (Seoul Metropolitan Government, 2008).
The data used in the present study were collected from various sources. The land prices were extracted from the principal database maintained publicly by Korea’s central government. 2 The database provided the land prices per square metre for each parcel. To compute the average price of land per square metre within a station’s PCA, we summed all the products of the parcel areas multiplied by their unit prices, then divided that number by the total area of parcels. To justify the use of the average land price for a PCA, the distribution of land prices within and between station areas was investigated. First, the distribution of land price for parcels within each station’s PCA was investigated. Figure 2 shows examples of the two types of station under study: at-grade and underground stations. The locations of both types are shown in Figure 3. The within-distribution of land prices for the two typical stations is also shown in Figure 2. As shown for the chosen two stations, most stations had no apparent relationship between a parcel’s land price and the distance from the parcel to the closest railway line or subway station. Of course, this result was derived without controlling for the effect of the other properties on each parcel. However, since the present study was conducted at the aggregate level, the individual characteristics of each parcel were not taken into account, and also the data for them were unavailable. Secondly, the standard deviation of land prices between station areas was tantamount to 2 982 000 won. On the other hand, each standard deviation within the two chosen stations was much less than that between station areas. Overall, 210 out of 245 stations had a smaller within-standard-deviation than between-standard-deviation. These two facts provided a rationale for the use of the average land price as a representative value for a station’s PCA.

Typical at-grade and underground stations in the Seoul metropolitan area: left: Hoikee station (at-grade); right: Sooyu station (underground).
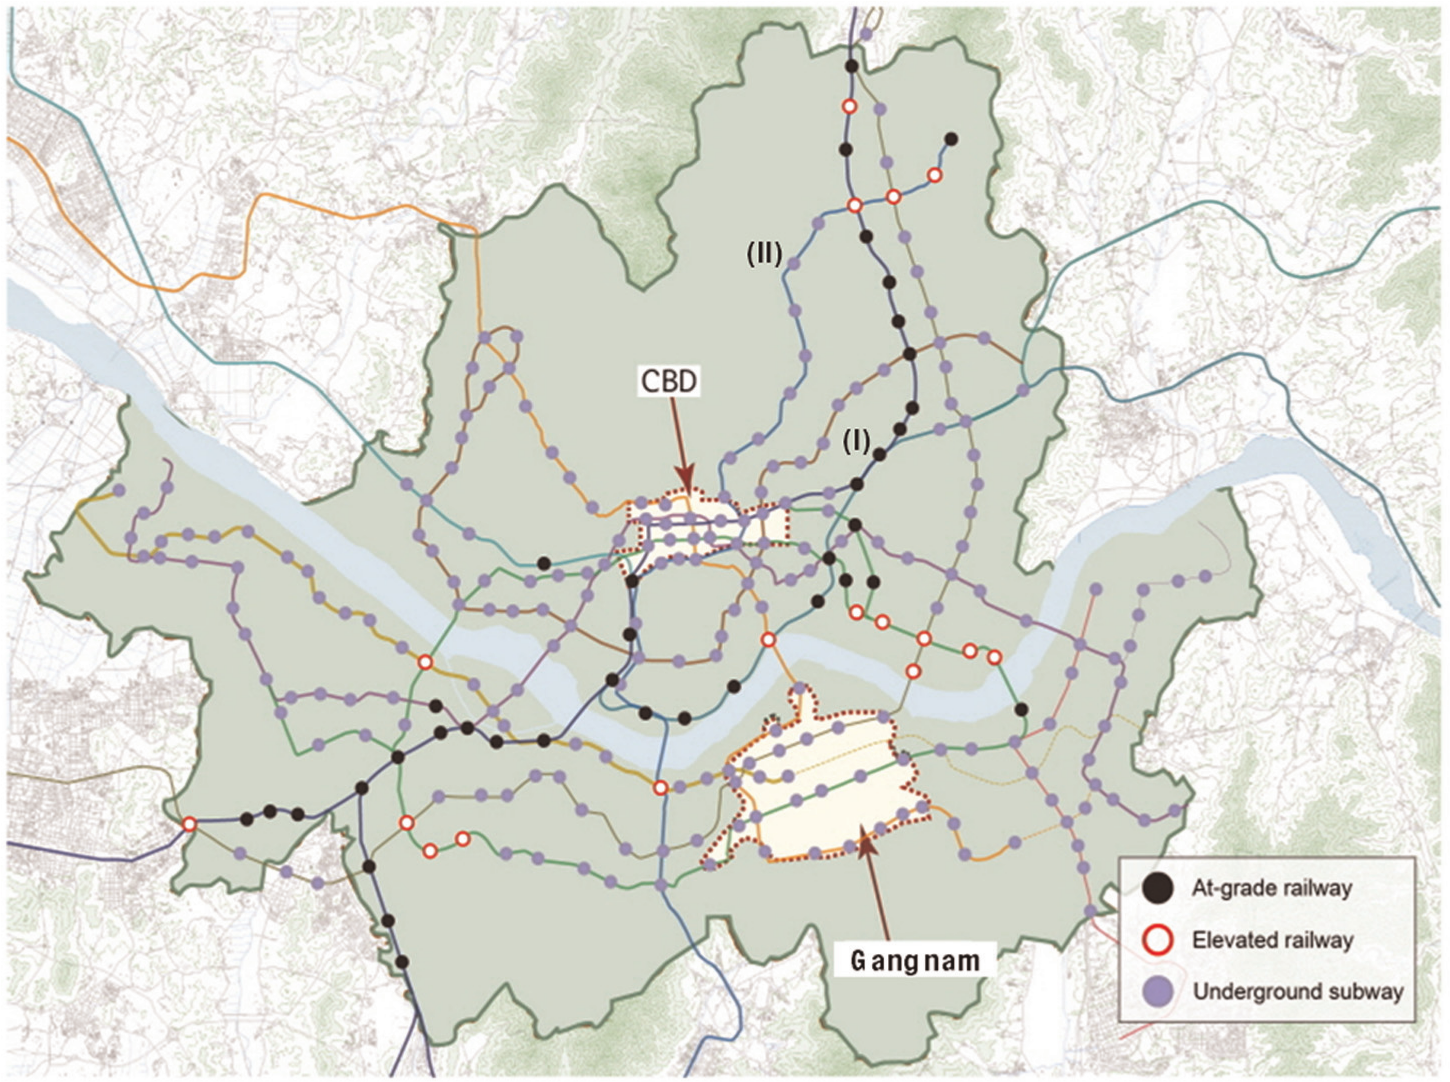
Location of railway and subway stations within the Seoul metropolitan area.
Data for building age and built environment were obtained from the database of the Seoul Development Institute (SDI). The floor area of buildings in a station’s PCA was created using GIS technology based on the raw data from the SDI database. 3 The population and employment within a station’s PCA were approximated, because the spatial unit of an administrative district was not consistent with that of the station’s PCA. A simple rule of data fusion was employed under the assumption that population and employment are uniformly distributed within each urbanised block in an administrative district. The walkability-related data were also retrieved from the SDI database. Data regarding the variables related to intermodal connectivity were obtained from the bus information system (BIS) of the Seoul metropolitan area. 4 Data for the daily ridership of railways and subways were obtained from a commercial agency that is committed to collecting transit fares by the Seoul metropolitan government. 5
There are 270 stations in the area (where each transfer station that has multiple platforms is counted as a single station). However, because of data availability, we omitted 25 stations and thus the total number of stations was 245. Among them, 33 stations were included in at-grade railways and 21 stations were on elevated railways (see Figure 3). The rest of the stations were all located underground.
Preliminary Comparison of Variables
Prior to modelling the difference in land prices according to whether a station was located at-grade or underground, a simple statistical test was conducted for each variable. A conventional t-test showed a clear distinction in several variables according to the location of stations, which are shown in Table 1. It was clear that the existence of at-grade railways contributed to a decrease in land value, as influences of other factors were not yet controlled for at this stage. Employment power in stations of underground subways was stronger than in those of at-grade stations. The floor area of office buildings was larger in the vicinity of underground subways, which matched the results in the employment power. The fact that stations were more likely to reside underground in the two city centres, the CBD and Gangnam, was consistent with general expectations. Floor areas other than the three conventional land uses (i.e. residential, office and commercial land uses) prevailed in the vicinity of underground stations. This reflected that land use in the vicinity of underground subways can be more diverse than that found near at-grade railways. Moreover, it can be guessed from the variable of pedestrian-friendly nodes that walkability around an underground station is more advantageous. This also implied the possibility that at-grade railways physically severing neighbourhoods could impede a pedestrian’s walking environment, but, at the same time, this notion seems to contradict what is shown in Figure 2 through the differences between typical at-grade and underground stations.
Statistical test results

Notes: *, **: statistically significant at the 0.05 and 0.0001 levels respectively.
Regarding the variables of transport efficiency, four variables were found to have statistical significance. The highway closeness of underground stations was higher than that of at-grade stations, which reflects that areas with higher accessibility were likely to be in the vicinity of underground subways. It was not easy to interpret the result that feeder bus services are more concentrated around stations of at-grade railways, which, however, was partly consistent with the previously mentioned result that pedestrian walking conditions around at-grade railways were poorer than those around underground subways, so people preferred riding a feeder bus to walking to stations. At-grade railways contained an increased number of interchange stations wherein a passenger could transfer or choose multiple service lines. This result could not be regarded as an accidental outcome, because at-grade railways were older than underground subways and newly planned subways tended to connect as many existing railways as possible. This result provided an undesirable sign for the replacement plan, since putting the railways underground could compete with the existing subways for limited underground space.
Modelling Framework
The objective of the present study was to identify the net effect of the existence of at-grade railways on nearby land prices on an empirical basis, the result of which could be utilised to compute the potential benefit of replacing them with underground subways when later conducting a rigorous feasibility study. A conventional regression analysis was adopted to extract the net effect, with the influence of other potential variables accommodated, which took a form similar to that of the hedonic price model. The hedonic pricing method was used to estimate the value of environmental amenities that affect the prices of marketed goods. The method is based on the assumption that people value the characteristics of a good, or the services it provides, rather than the good itself. The hedonic pricing approach, when adopted in housing or in land markets, may be used to evaluate the economic benefits or costs associated with both environmental quality and amenities. The former includes air pollution, water pollution or noise, and the latter encompasses aesthetic views or proximity to recreational sites. The approach has recently been employed to identify the price of an individual housing unit or a land parcel (Duncan, 2011; Debrezion et al., 2011; Ryan, 2005). However, it should be noted that, unlike the hedonic price model, the land prices in the present study were dealt with at the macro level of a station’s PCA.
Four model structures were tested to find the best model to accomplish the objective of the present study. First, a linear regression model was adopted simply to identify the net effect of the replacement on land prices. Secondly, a double logarithmic model was set up, so that each estimated coefficient could represent the elasticity of land prices with respect to each variable. Thirdly, a semi-logarithmic model was established that is widely used in the property value literature. Last, a Box–Cox transformation was applied for each feasible independent variable and then a regression model was specified. In particular, each parameter (
Linear model:

Double logarithmic model:

Semi-logarithmic model:

Box–Cox transformation:

Table 2 shows the overall performance of the four model specifications. Of course, the same procedure for leading to the final model specification was applied to each model, the details of which will be addressed later in this section based only on the linear model. The linear model was relatively advantageous for three performance measures: the overall statistical significance (F-value), the goodness-of-fit (R 2) and the remaining number of significant variables. As expected, the Box–Cox transformation model did not outperform the linear model, the performance of which was positioned between the linear and semi-logarithmic models. Thus, only the linear model will be considered in what follows to address the impact of independent variables on land prices. As expected, the separated treatment of elevated railways from at-grade railways did not work for all three models.
Model performance for the three chosen models

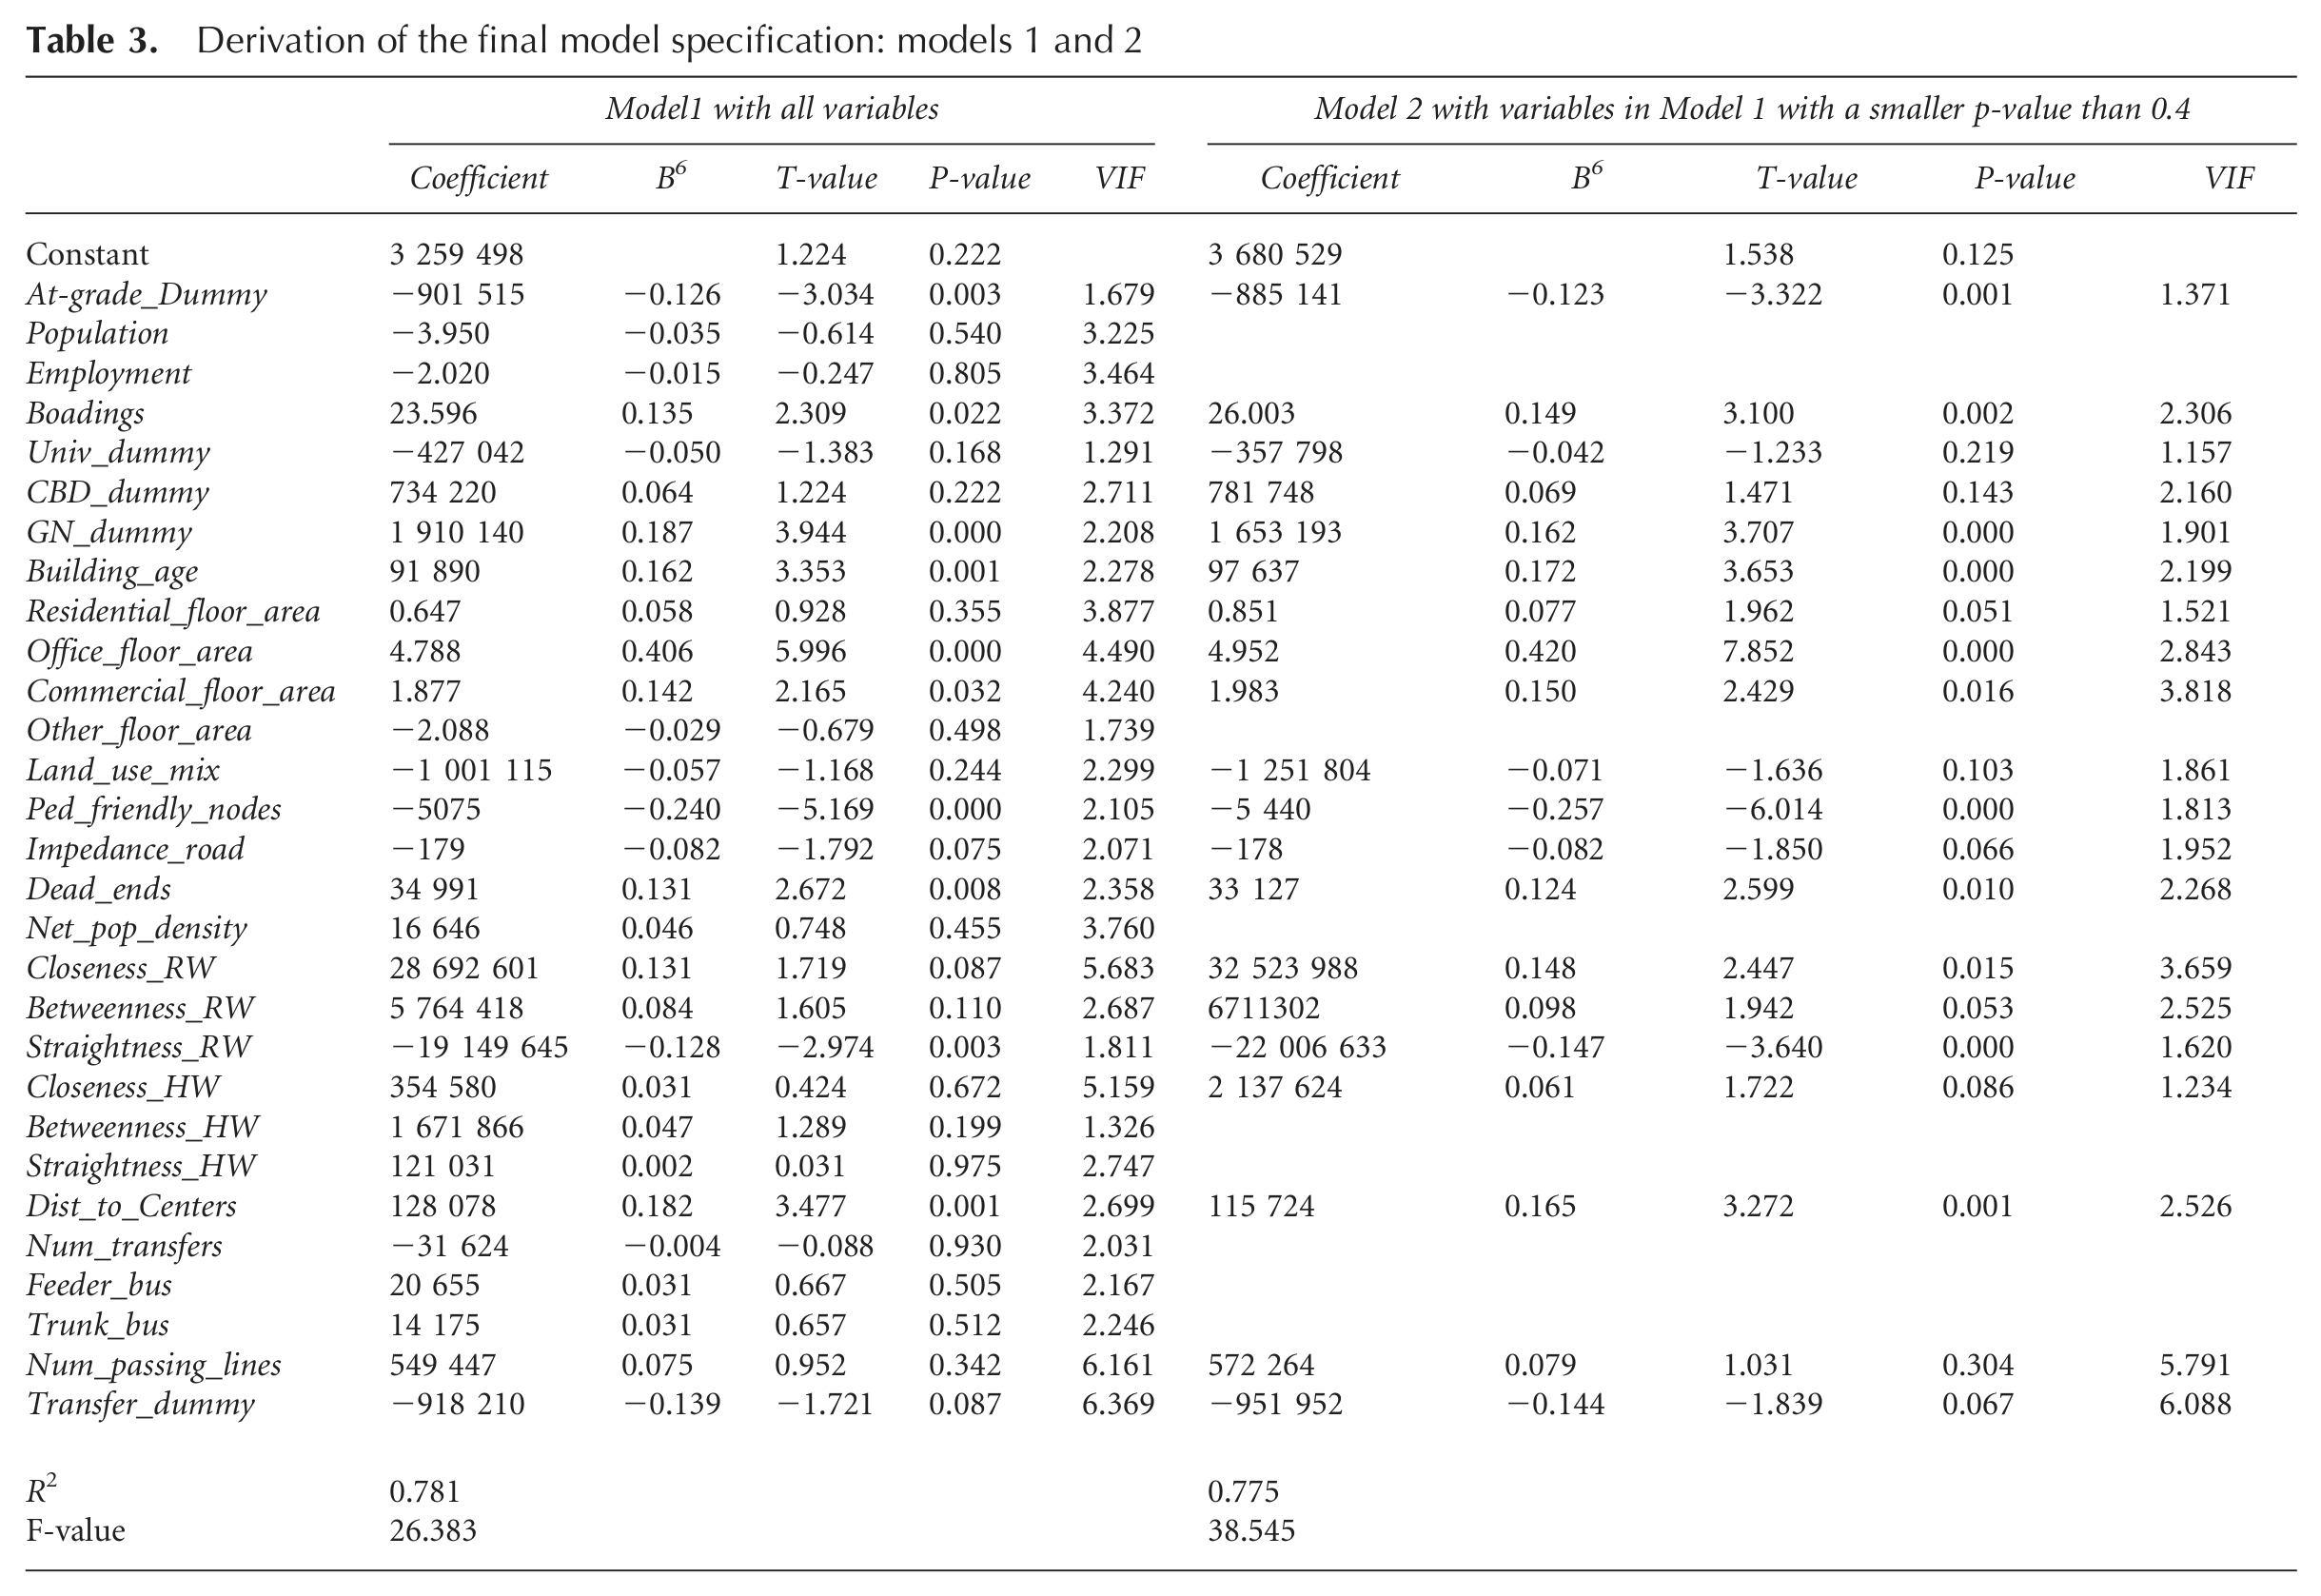
Tables 3 and 4 show the procedure for deriving the final model specification (model 4) after testing a series of linear regression analyses. The procedure was verified to be useful in selecting variables associated with the dependent variable through the success of previous studies that used the same procedure (Choi et al., 2012; Sohn and Shim, 2010). The variables in the final model specification were intuitively accountable, statistically significant and free from multicollinearity. Starting with the initial model (model 1) with a full set of variables, the variables for the second model (model 2) were drawn from by selecting those with a p-value of less than 40 per cent (see Table 3). For the third model (model 3, Table 4), we selected only variables from the second model that had p-values of less than 5 per cent and variance inflation factors (VIFs) of less than 3.5. Regarding multicollinearity, a cut-off value of 3.5 was relatively conservative since many textbooks propose 10 as the rule of thumb as a criterion for concern about multicollinearity among independent variables (Hair et al., 1987; Kline, 2005). After testing as many plausible specifications as possible by adding or deleting variables from the third model according to the insights, a final specification with the maximum F-value was chosen (model 4, Table 4). Of course, the p-value and the VIF of each coefficient in the final specification were all confirmed at the previously mentioned acceptable level (i.e. 5 per cent and 3.5 respectively).
Derivation of the final model specification: models 1 and 2
Derivation of the final model specification: models 3 and 4
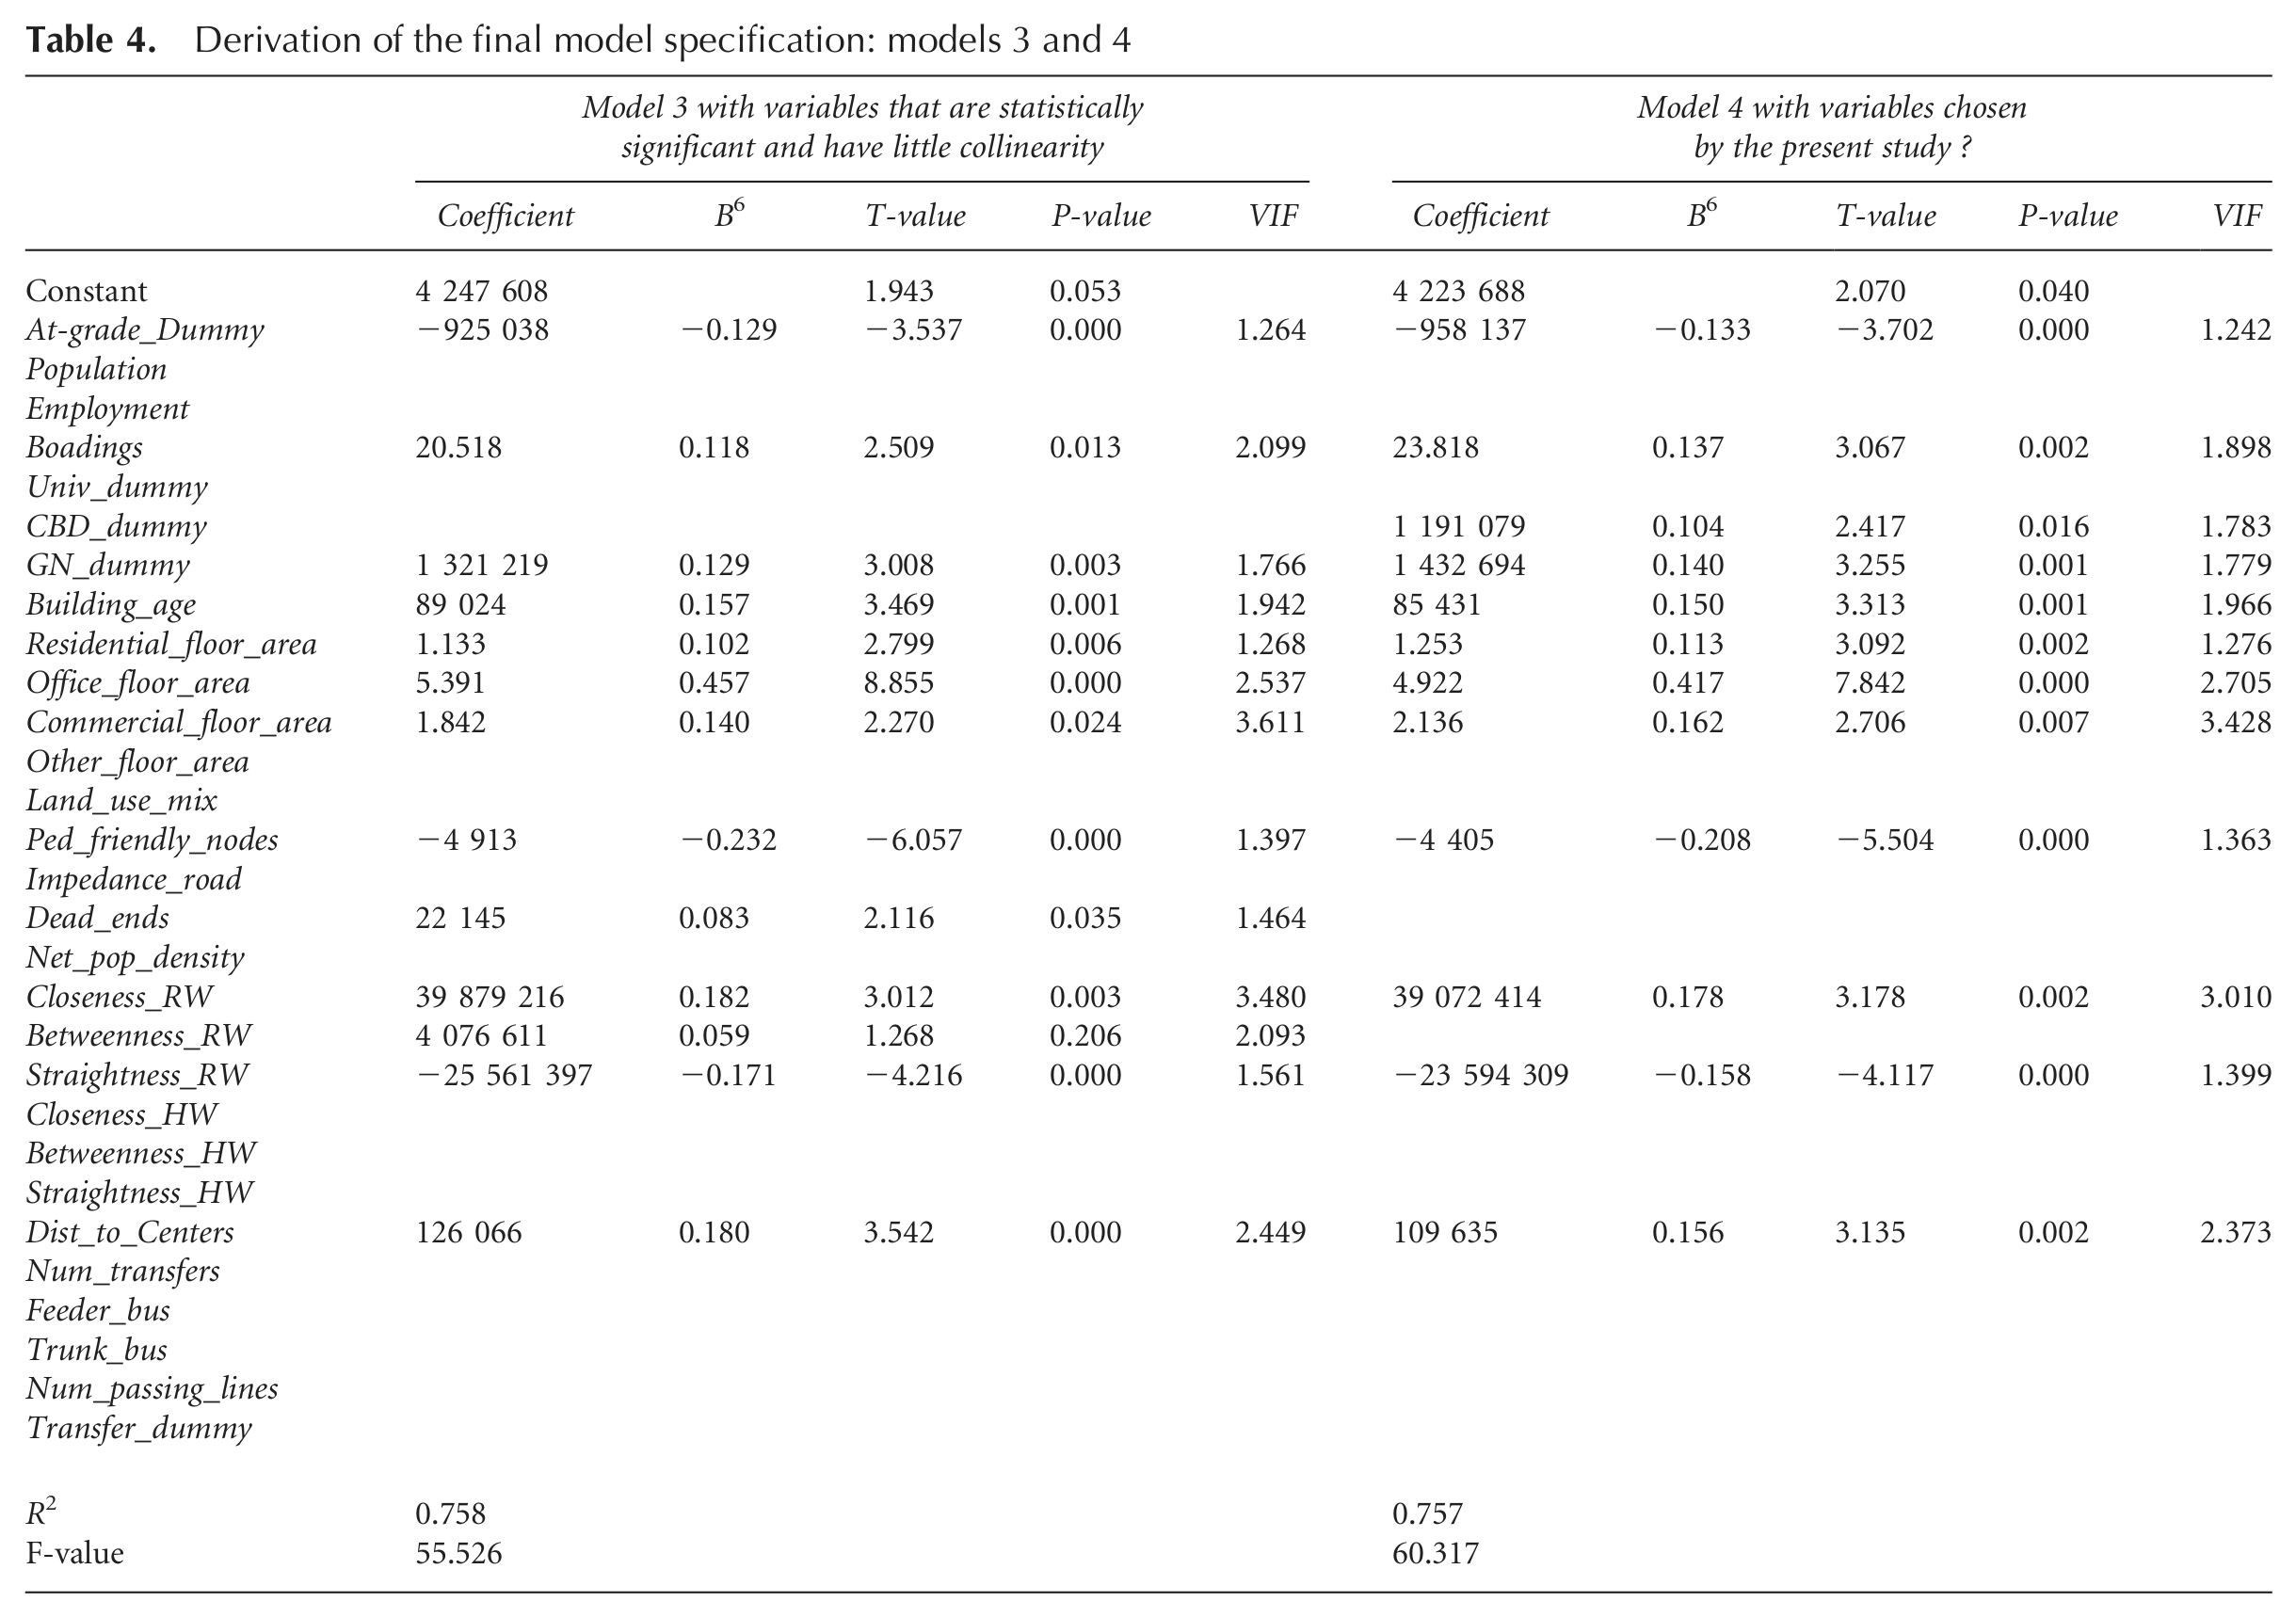
Thirteen variables, which included a constant, were used in model 4, each of which was statistically significant and free from multicollinearity. While transitioning from model 3 to the final model specification, the railway betweenness centrality (Betweenness_RW) was dropped on account of its statistical insignificance in model 3. The number of dead ends (Dead_ends) was also excluded since it yielded a counter-intuitive estimation result. A dummy variable (CBD_dummy) was added to model 4 to accommodate the well-known fact that land value increases in city centres, particularly in the CBD. Of course, adding the variable was determined in a direction that enhanced the overall F-value, after testing a number of plausible model specifications starting from model 3. The overall significance (F-value) of the final regression model (model 4) was superior to that of any other model (models 1–3). The final model specification, with 245 degrees of freedom, indicated an R 2 value of 0.757, and an F-statistic value of 60.317, which was significant at the 0.000 level.
Prior to describing the impact of the target variable (At_grade_Dummy) of the present study, the effect of other variables on land value must be addressed comprehensively. Regarding built environments, land value was found to be positively associated with residential, office and commercial floor areas. This reflects the prior expectation that, for any land use, the higher the land value the more utilised the land is. According to the estimated standardised coefficients, 6 office floor area was the most influential when accounting for land price. Variables of population and employment were not included in the final model specification since they were strongly correlated with the floor area variables. Consistent with general expectations, the land values within the boundaries of CBD and Gangnam were found to be higher than those outside them by 1191 and 1432 thousand won per square metre respectively. 7 The railway or subway ridership was positively linked to land price, but the causal effect between them could not be verified only by using a regression analysis. Unlike the previous expectation, the number of pedestrian-friendly nodes within a station’s PCA was found to be negatively associated with land price, which accounted for the fact that dense and narrow roads lowered the land value. The impact of building ages was also contrary to the prior expectation. The average age of buildings within a station’s PCA was negatively related to land value. Obviously, city centres where land prices are high included many old buildings since they were urbanised long before other areas.
The influences of variables with respect to transport efficiency on land values were self-explanatory. The closeness centrality of railway networks (Closeness_RW) was positively associated with the land price. That is, areas which can be easily accessed via railways or subways recorded high values for land price. This agreed with the results from the variables representing how easily an area is connected to city centres (Dist_to_centres). However, what the estimated coefficient of the straightness on railway network implies could be vague to those who are considering the replacement of at-grade railways with underground subways. Many transport experts in Korea have criticised the indirectness of subway lines in the Seoul metropolitan area (Seoul Metropolitan Government, 2008). In terms of a preliminary statistical test, the straightness centrality of stations underground was higher than that of stations at-grade at the marginal level of significance (= 11.8 per cent). A reason that subway lines zigzag is that, initially, the goal of the plan for installing subway lines was to maximise the coverage rather than minimise travel utilities. However, the alignment of at-grade railways is streamlined via shortcuts, since they were constructed long before the areas along them were urbanised. Nevertheless, even though the negativity of the straightness could be partly accounted for by the previous argument, its correlation with the dummy variable indicating the location of a station (At_grade_dummy) was not large enough to strongly support the argument. Another possibility is that stations located in a geographical centre in Seoul naturally tend to have a disadvantage in straightness on account of the specific topology of railway networks in Seoul. A further plausible interpretation must be established for these results.
The objective of the present study was accomplished by the estimated coefficient of the dummy variable representing whether a station is at-grade or underground (At_grade_dummy). The difference in average land prices according to the existence of at-grade railways was found to be tantamount to 958 000 won per square metre within a station’s PCA, which is equivalent to the value of the estimated coefficient for the dummy variable. Without controlling for other effects, the difference in average land prices in Table 1 between stations at-grade and underground was 1 669 000 won. After accommodating for other effects in the framework of regression analysis, the difference was reduced considerably—by 711 000 won. The resultant value not only provided a rationale for putting at-grade railways underground, but also could be utilised to quantify the potential benefit when conducting a more rigorous feasibility study in the future. The Seoul metropolitan government is trying to find a way to evaluate qualitative benefits such as improvements in amenities and landscape, a decrease in noise and vibration, and an advantage in overcoming the effect of separated neighbourhoods, without which the replacement project would not pass through the formal stage of feasibility evaluation. Thus far in Korea, there has been no criterion to evaluate a project that has only intangible benefits and entails no enhancement in observable utilities. Even formal guidelines that are issued by the Korean government to help with conducting a feasibility study include no methodologies to quantify such intangible benefits (Korean Ministry of Strategy and Finance, 2009). The present study contributes to establishing an evaluation for transport-related projects using only intangible benefits.
Conclusions
A rationale for replacing at-grade railways with underground subways in the Seoul metropolitan area has been presented on an empirical basis. Aside from land prices, the statistical test verified the significant differences in several variables establishing whether a station area belongs to at-grade railways or underground subways:—i.e. the employment level, the station locations, office and other-use floor areas, the number of pedestrian-friendly nodes, highway closeness and station intermodal characteristics such as the number of feeder bus lines and the number of transferable railway or subway lines. In order to derive the net influence of the existence of at-grade railways on nearby land values, a regression model that took a form similar to the conventional hedonic price model was developed. As a result of the regression model, it was confirmed that the land prices of areas along at-grade railways are much less than those along underground railways, all else being equal. The difference in land value was tantamount to 958 000 won per square metre US$798), which can be utilised to quantify the benefit of the replacement in a comprehensive manner. As a by-product of the regression analysis, other factors affecting land value were identified. Regarding built environments, the land price was found to be positively associated with residential, office and commercial floor areas. The land value within the boundary of the CBD and Gangnam was found to be higher than that outside them by 1 191 000 and 1 432 000 won per square metre respectively. Areas of dense and narrow road networks and low usage of railways had lower land prices. The accessibility-related variables for a railway network were also positively associated with land price, as expected. The age of buildings was negatively associated with land values reflecting the fact that city centres, where land prices are high, include many old buildings since these areas were urbanised much earlier than other areas. However, interpretation of the results from railway straightness was somewhat obscure; this will be addressed through the adoption of a micro analysis of individual buildings and land parcels in further studies.
Footnotes
Funding
This research was supported by the Chung-Ang University Research Scholarship Grants in 2012.