




Abstract
Chicago uses tax increment financing (TIF) to promote economic development to a greater extent than any other large American city. This paper conducts a comprehensive assessment of the effectiveness of Chicago’s TIF programme in creating economic opportunities and catalysing real estate investments at the neighbourhood scale. This paper uses a unique panel dataset at the block-group level to analyse the impact of TIF designation and investments on employment change, business creation and building permit activity. After controlling for potential selection bias in TIF assignment, this paper shows that TIF ultimately fails the ‘but-for’ test and shows no evidence of increasing tangible economic development benefits for local residents. Implications for policy are considered.
1. Introduction
In the wake of the Great Recession, local governments in the US face severe fiscal stress and, in many cases, must make significant cuts to basic services such as schools, public safety and infrastructure repair. Alongside declining revenue, cities also face a renewed challenge to create employment opportunities for residents in the face of persistently high unemployment. In this context, economic development policies which use local tax revenue to promote job creation are coming under intense scrutiny. 1 One of the oldest and most widely used tools that cities use to promote urban redevelopment and job creation is tax increment financing (TIF). Although its legal form and usage vary across the 49 states that have enabling legislation, TIF is essentially an incentive tool that aims to increase private investment in defined ‘blighted’ areas. In its most basic form, a local government designates an area as a TIF district that is targeted for redevelopment within a city or county. At the time of designation, property taxes from that district that normally flow to existing public budgets are frozen for a specified period (typically more than 20 years). Any new tax increment associated with increased property values pays for economic redevelopment projects or incentives only within the designated TIF district.
In some sense, TIF can be thought of as paying for economic development activities on a fiscal credit card, in that the up-front costs of redevelopment activities—such as infrastructure improvements, area beautification or direct subsidies to private firms—are paid for with future tax revenue that does not yet exist. Critics of development policies like TIF claim that such policies divert potential tax revenue for localised redevelopment projects and thus reduce funds for public education and general city services. However, TIF advocates claim that funded redevelopment activities create jobs and ultimately generate more tax revenue for all taxing jurisdictions in the future.
To evaluate the effectiveness of TIF and similar economic development practices, one needs to ask if future development would have occurred without the up-front intervention. While this ‘but-for’ test is necessary to evaluate if TIF is an effective redevelopment tool, and thus a wise use of public funds, it is an elusive question for planners and policy researchers to address accurately. 2 This paper attempts to provide a comprehensive evaluation of TIF usage in Chicago—which has used TIF extensively since the mid 1980s—that answers the ‘but-for’ question. Specifically, this paper measures the impact of TIF designation and the subsequent TIF-funded investments on employment growth and private real estate development at the local level. Unlike previous TIF studies, this paper uses time-series data at the block-group level. It also uses the timing of TIF designation in a difference-in-differences (DD) research design that compares outcomes in treated portions of the city with non-treated areas. Despite its extensive use throughout the City of Chicago, this paper finds no evidence that the TIF programme resulted in any significant new job creation. While some individual TIFs may have positive impacts, Chicago’s use of TIF has not resulted in positive net employment benefits for city residents. This paper, by measuring building permit activity, finds no support for the claim that TIF designation acts as a catalyst for private investment—beyond what would have occurred otherwise—in the physical structure of local neighbourhoods.
The remainder of this paper is organised as follows. Section 2 reviews the empirical literature on the impact of TIF and presents the specific research questions of this paper. Section 3 provides a narrative background on the emergence of TIF as a popular local economic development tool in the US and summarises the unique evolution of TIF usage in Chicago. Section 4 lays out the methodology and data sources used to measure TIF impacts on employment and building permit activity. Section 5 presents the main results and discusses the robustness of the findings. The conclusion summarises the implications of this research for policy-makers in Chicago and beyond.
2. Literature Review
During the 1980s, many large central cities in the US faced a dual crisis: rapid job loss coupled with declining state and federal funds to promote urban redevelopment projects. The retrenchment of the federal role in urban redevelopment is well documented (Fainstein and Fainstein, 1989; Mollenkopf, 1983) and is epitomised by the death of the Urban Development Action Grant (UDAG) programme in 1988 (Reed, 1989). Faced with the responsibility to attract new businesses amid on-going deindustrialisation and suburbanisation, many cities pursued alternative strategies intended to provide additional resources for economic development, but which would not rely on federal or state funds. The search for self-financed alternative economic development strategies resulted in a policy shift that favoured market-based solutions that attempted to attract investment from increasingly mobile business. Under this policy approach, cities must present a ‘business-friendly’ posture in redevelopment efforts, often prioritising the needs of businesses above those of low-income residents and the general public (Brenner and Theodore, 2002; Logan and Molotch, 1987; Peterson, 1981; Rubin, 1988; Savitch and Kantor, 2002; Stone, 1993). Cities that face deeper economic challenges are more likely to engage in business attraction policies that offer direct subsidies to private developers or corporations, such as TIF (Felix and Hines, 2011; Warner and Zheng, 2011).
Tax increment financing is arguably one of the most common tools in the economic developer’s toolbox; 49 states have enacted TIF legislation since its initial use in California in 1952. TIF also epitomises the current ‘entrepreneurial’ paradigm in economic development as it involves a high degree of risk-taking on the part of the public sector (see Harvey, 1989). In the typical TIF development scenario, the public sector borrows money in the form of a bond to write down the cost of up-front redevelopment with the hope that increased property taxes collected in the future will fully cover the public investment. As Weber (2010) argues, the TIF relationship forces cities to make significant efforts to assure private bond holders that returns will materialise; this is a stance which further binds the city to a pro-growth strategy. As the case of Chicago indicates, once a city starts down the road of easy TIF spending, like the proverbial teenager with his first credit card, it is difficult to stop spending.
Because TIF is one of the most popular—and controversial—economic development tools at the disposal of local governments, it has received significant attention in the academic literature of economics, public policy, planning and geography. Some theoretical studies have linked TIF—in a general sense—to the broader shift towards neoliberal policy-making (see Weber, 2002) or identified it as an indicator of the competitive nature of local government policy-making (Briffault, 2010). However, this paper focuses only on quantitative research that analyses the impact of TIF on economic development outcomes.
The empirical TIF literature in the US focuses mainly on its impact on real estate values either within district boundaries or at the aggregate, city level and reveals mixed, but largely negative, results. For example, Dye and Merriman (2000) use data from municipalities within the Chicago metropolitan area to examine whether TIF adoption impacts overall growth in equalised assessed value (EAV). They found that TIF adoption had a negative impact on municipality growth, even after controlling for a variety of municipal characteristics—community type, community location and fiscal structure. They attribute this finding to higher growth within TIF districts at the expense of non-TIF portions of the city. In a similar study that focused only on TIFs in the City of Chicago, Weber et al. (2007) analysed appreciation rates of single-family homes that sold more than one time from 1993 to 1999. This study found mixed results that indicated that proximity to an industrial TIF district negatively affected prices, but proximity to TIF districts with both commercial and residential parcels increased appreciation rates. A critical aspect of their study is the use, as an additional control, of information on TIF-funded activity. Thus, while the ‘treatment effect’ of most TIF studies is the designation itself (i.e. whether a parcel falls inside or outside a TIF district), their paper included data on actual spending within the TIF. This is an aspect that is retained in the empirical work proposed in section 4.
Most papers that analyse TIF impact do not explicitly address the problem of endogeneity with regard to TIF designation. Specifically, since most TIF legislation requires that districts be created in portions of the city that have experienced ‘blight’, it is possible that TIFs are only created in less desirable areas that one would not expect to grow at the same rate as non-blighted sections. Smith (2009) addresses the issue of selection bias with respect to TIF designation. He examines the impact of TIF on the change in individual commercial property values and predicts TIF assignment with a propensity score approach that controls for neighbourhood characteristics, such as poverty, unemployment and housing values. This issue is potentially critical in attempting to answer the ‘but-for’ question, in that comparisons between TIF districts and comparable non-TIF parts of the city are necessary. Smith’s results show that the rate of change in real estate prices accelerates after TIF designation, even after controlling for the propensity of non-TIF areas to receive designation.
Finally, one of the few papers to examine directly the impact of TIF on job creation is Byrne (2010), which focuses on the effect of TIF adoption on municipal employment growth in Illinois. Specifically, Byrne uses a panel dataset consisting of employment and TIF adoption dates at the municipal level and uses a fixed-effect estimate approach to assess the impact of TIF adoption. Overall, the findings suggest that TIF adoption, in general, does not lead to higher employment. However, Byrne does not adequately control for the issue of selection bias in that cities that use TIF are potentially those that have experienced slower growth rates relative to rapidly growing suburban areas. While Byrne uses a first-differenced fixed effects model that he claims eliminates the issue of selection bias, it is still possible that slower growth municipalities adopt a TIF after a recent period of slow growth. Lastly, as Byrne points out in discussing the detailed findings by industry, it is unclear whether we should even expect to find a municipal-level impact of TIF because its stated purpose is to increase economic development within a narrowly conscribed geographical area.
There is also a recent and growing international literature on TIF usage. While TIF has only recently been adopted outside the US and is in use in a limited number of countries (for example, Scotland and other portions of the UK, Canada), there are several papers which examine TIF from the perspective of the policy transfer literature. For, example Squires and Lord (2012) use stakeholder interviews to understand under what conditions TIF could be used effectively in the UK. Adair et al. (2003) review the US policy literature on TIF in light of various options for local finance in the UK and the European Union. Given its limited and varied use outside the US, there are no directly applicable empirical analyses outside the US on the impact of TIF on local job creation.
This paper advances the empirical literature in several aspects. First, the analysis is conducted at a highly refined geographical scale to test whether TIF designation creates jobs at the same level at which it funnels investments. Secondly, this paper addresses the issue of selection bias by accounting for the likelihood of each block group to receive a TIF. Lastly, this paper is comprehensive in that it tests both of the leading hypotheses of TIF advocates: that TIFs create jobs and catalyse private-sector development.
3. The Evolution of TIF Usage in Chicago
Before turning to the empirical analysis, it is important to provide background on how TIF is used in Chicago and to motivate the hypotheses being tested here—namely, that, beyond a simple financing mechanism, TIF is largely intended to spur economic development. In 2011, the City of Chicago held $985 million in unallocated TIF funds across all of its 160 districts. 3 However, the City of Chicago and the Chicago Public Schools (CPS) district face large budget deficits exacerbated by the Great Recession and the concomitant real estate collapse. These massive deficits have resulted in reduced spending on fundamental services and justified the sale of public assets such as the Chicago Skyway and Midway Airport to private investors (Ahmed-Ullah, 2012). This glaring juxtaposition of City deficits and TIF surpluses is one reason why TIF has come under city-wide scrutiny for the first time in nearly three decades of use. 4 However, to evaluate the TIF programme fully, it is critical to understand how the use of TIF evolved in Chicago in order to specify the mechanisms through which TIF may affect economic development outcomes.
By the late 2000s, TIF was widely known as ‘the only game in town’ to fund a wide variety of economic and community development initiatives, ranging from direct subsidies for corporate relocations to neighbourhood retail revitalisation, infrastructure improvements and targeted workforce development programmes. Yet, as Chicago’s history with TIF indicates, the programme grew from a rarely used tool targeted to ‘blighted’ portions of the city to the City’s most flexible and broadly used policy. Chicago’s first TIF was the Central Loop TIF, designated in 1983 and intended to redevelop commercial areas in the core downtown area, which was threatened by retail competition from suburban areas. Between 1983 and 1995, Chicago designated 29 more districts, 41 per cent of which were in primary industrial areas such as the Stockyards Industrial Corridor.
After 1995, TIF usage accelerated significantly, extending into ‘conservation areas’ that did not have to meet as many ‘blight’ criteria. This made it easier for the City to justify the use of TIF in a much wider set of neighbourhoods and for a broader set of economic and community development goals. Figure 1 presents a map of all TIF districts designated in the City of Chicago by type in 2008. During the late 1990s, the City used TIF funds to attract high-tech firms, such as the failed MarchFirst headquarters, and high-profile corporate headquarters relocations, such as Boeing and MillerCoors.
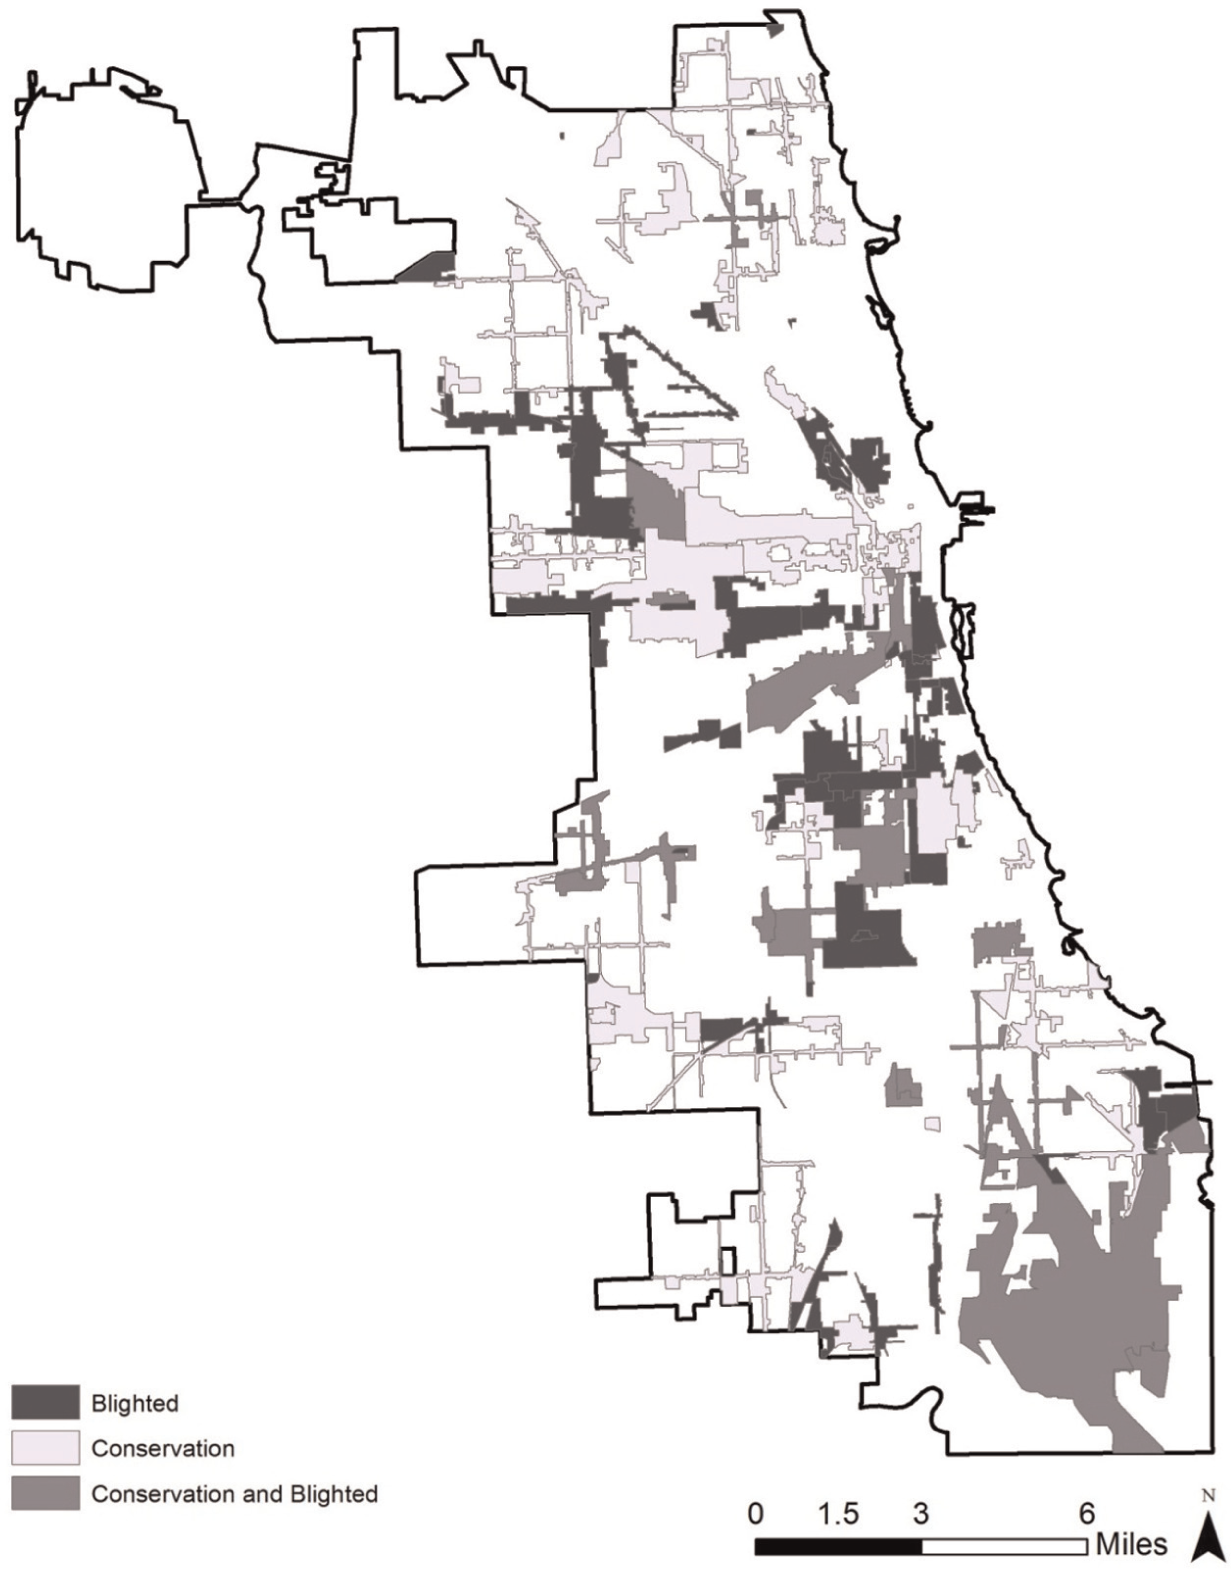
TIF Districts in Chicago by type, 2008.
However, as TIFs spread throughout the city and as an increasing share of tax revenue was sequestered in TIFs, the City began spending TIF revenue on a variety of public capital improvements such as libraries, schools and parks. Perhaps in response to criticism from community activists or individual aldermen that too much TIF revenue was flowing to private developers and to attract mobile corporations, the City also began to use TIF funds to promote affordable housing and workforce development and created a TIF small business improvement programme. 5 An alternative explanation for the ‘sprawl’ of TIF-funded projects away from traditional infrastructure and economic development uses could be the sheer amount of tax revenues collected as Chicago experienced a real estate boom in the late 2000s. By 2007, the city was collecting over $500 million each year in TIF increment. 6
Given the history of Chicago’s reliance on TIF districts as a development incentive tool, it is critical to understand how TIF might be expected to create the type of economic development benefits that are the subject of this paper—namely, jobs, business growth and private real estate development.
Information on how the City actually spent TIF revenue has only recently become available to the public. As a result, a typology of recent TIF spending may not reflect the spectrum of uses in previous decades. Nevertheless, a categorisation of all TIF-funded obligations in 2011 indicates that a significant share of resources flows into traditional economic development projects which have an explicit goal of job creation. As Figure 2 indicates, 42 per cent of TIF revenue was spent on what this paper terms ‘traditional economic development’ activities. This category includes all redevelopment agreements (RDAs) in which the City engages with a private developer. RDAs themselves cover a variety of projects, but they typically involve a subsidy to a developer of a retail, mixed-use or industrial project. These projects are either explicitly or implicitly justified on the basis of job creation and new business attraction. This category also includes debt service on previous bond issues and land assembly and site development costs on private land.

A typology of TIF expenditures in Chicago, 2011.
The infrastructure category includes all TIF-funded support for streetscaping, lighting, sewer improvements and any other infrastructure improvement that is external to a private property. A basic justification for improving infrastructure is to improve the economic conditions of neighbourhoods, making it easier to conduct business. For example, improvements to alleys and widening streets improve the efficiency of truck transport and thus improve the competitiveness of local businesses, particularly manufacturers. As a result, we can logically hypothesise that TIF-funded infrastructure improvements may have an impact on job creation and business establishment growth.
Even the TIF dollars which flow to capital improvements of public facilities (38 per cent) such as schools, parks and transit facilities can be expected to generate measureable impacts on neighbourhood economies. Such improvements may signal to private investors that the City is taking an interest in broader redevelopment of a given neighbourhood. In addition, schools, parks and other public facilities are community assets that stabilise neighbourhood real estate markets. This signalling effect may create incentives for private landowners to renovate their properties as the neighbourhood is seen as more stable or more physically attractive. Thus, while this portion of TIF-funded investment—which is itself a more recent phenomenon—may not be expected to generate direct employment growth, there is reason to believe that it may be catalytic in inducing increased real estate investment, which would be captured by measuring building permit activity.
Overall, a central claim of TIF advocates is that TIF is a critical economic development tool that ultimately creates jobs for Chicago’s residents and expands business activity. As this limited typology indicates, the vast majority of TIF funds are still spent on activities which have a logical connection to economic development. Thus, this paper will first test the job creation and business growth claims. Specifically, the paper asks: does TIF designation and/or subsequent investment increase the number of jobs or the number of business establishments within TIF districts relative to non-TIF areas? However, as the use of TIF has evolved to a wider geographical set of neighbourhoods and for a broader set of public purposes (i.e. community development activities), TIF advocates have put forward an additional claim: TIF catalyses the private real estate developers to invest in previously undesirable areas. Therefore, this paper also examines the impact of TIF on building permit activity.
4. Methodology
This section describes the overall research design employed to estimate the impact of TIF on jobs and real estate investment. It also describes in detail the GIS selection techniques and other database construction steps employed to build the panel database that forms the basis of the empirical work.
4.1 Research Design
This paper uses an interrupted time-series research design to generate difference-in-differences (DD) estimates that compare changes in the outcome variables in a set of treated areas relative to a control group. In this framework, we define ‘treatment’ in two ways. First, we examine the impact of TIF designation, using information on the date each district was officially established by the City. This is the approach taken by Smith (2009) and most of the extant empirical literature on TIFs. However, because a large amount of TIF funds in Chicago remains unspent, there is some concern that simply measuring the impact of designation per se may mask the actual treatment. For this reason, this paper provides a parallel analysis that measures the impact of actual TIF-funded investments on subsequent outcomes. The data on TIF investments that were compiled by the Neighborhood Capital Budget Group, and are now maintained by the UIC Center for Urban Economic Development, are less readily available and we are forced to make several simplifying assumptions about the nature of such investments to construct a consistent measure. All outcomes are measured and treatment is assigned at the level of 1990 US census block groups. Block groups are used as the unit of analysis since they comprise the smallest areal units for which socioeconomic control variables can be observed. Block groups are a standard measurement level for the decennial US census and typically have populations between 500 and 1500 persons. They are also fine enough that we can overlay the TIF district geography without mistakenly including too large an area for analysis. The dependent variables of interest derive from the two research questions. First, we measure changes in employment after designation and/or investment across five industry and establishment-type categories. In addition to the overall employment effect, we examine the impact of TIF on employment and the number of establishments in the retail, services, and manufacturing sectors and in establishments that are branches of multi-establishment firms. The latter category was broken out to test if TIF had a disproportional effect on non-local firms (i.e. formula retail chains), which are often the target of neighbourhood-based redevelopment efforts in Chicago. 7 Secondly, the number and value of building permits issued in treated block groups are measured to test if TIFs catalyse additional private market redevelopment. Equation (1) summarises the basic modelling approach to measure the impact of TIF designation

This model regresses the natural log of the outcome
However, because the timing of TIF designation and the timing of actual TIF-assisted investment can vary, we also estimate an additional equation (2) that uses TIF-funded investments, rather than designation, as the treatment variable

In this case,
To test for lagged effects of TIF treatment on each of the outcome variables already described, equations (1) and (2) are also estimated with three leads and lags of the treatment variable. Equation (3) provides the general form of these models, the results of which are used to generate the time-path plots presented in Figure 3 and discussed in section 5.


Time path of TIF impacts on employment, establishments and building permits. Above: Impact on natural log of total employment, three years pre/post TIF designation. Below: Impact on natural log of total establishments, three years pre/post TIF designation.
As a final robustness check, the treatment sample of TIFed block groups was split into TIFs that were designated in ‘blighted’ versus ‘conservation’ areas to see if TIF-funded economic development projects had a differential impact by the pre-existing level of neighbourhood distress.
4.2 Addressing Selection Bias
A critical factor in accurately assessing whether observed TIF impacts would not have occurred ‘but-for’ the TIF designation is to ensure that comparisons are made against a reasonable control group. In Chicago, as Gibson (2003) shows, TIF designation is non-random and “positively related to neighbourhood distress”. To address the issue of the endogeneity of TIF designation (and by extension TIF investment), we use a propensity score weighting procedure (see Rosenbaum and Rubin, 1983) that predicts TIF treatment at the block-group level based on a variety of pre-treatment observable characteristics. In addition to using census-based measures of demographics and neighbourhood distress (such as poverty, vacancy rates and housing values), we use factors that, in the case of Chicago, may have an influence on TIF designation to predict treatment assignment. First, we include several land use indicators (from 1990), including the per cent of land in each block group that was zoned for commercial or industrial use, because TIF districts are mainly targeted towards non-residential areas. Secondly, given the evolution of TIF in Chicago from the initial Central Loop TIF, we include a measure for the distance of each block-group centroid to the central business district. However, the goal of the propensity score analysis is not to predict the exact timing of TIF designation, but to control for factors that lead to TIF assignment during the entire period (1990–2008). Specifically, the predictors are also factors that may be correlated with either employment growth or building activity. 9
4.3 Database Construction
This paper uses the 1990 census block group as the unit of analysis because it is the smallest geographical unit at which socioeconomic variables that predict TIF designation are gathered. The 1990 geography was chosen to assess neighbourhood characteristics before designation since only 11 of 160 districts were designated before 1990. To build our panel dataset, we used the spatial boundaries of each TIF district from the City of Chicago’s GIS portal 10 to associate each block group with a specific district. Since TIF boundaries are unique, in some cases stretching along a given commercial street or overlaying entire industrial or residential areas, we identified a threshold criterion to determine which block groups to consider ‘treated’. If a simple spatial join (i.e. overlaying two polygons) was used that selected any block group that intersected or touched a TIF district, the treatment group would include many areas that only have a very small portion of their areas in a TIF, perhaps overstating the degree of treatment. Also, in several instances, block groups were intersected by multiple TIFs. To address this issue, TIF boundaries were overlaid with the census block centroids and the criterion that at least 50 per cent of a block group’s block-based population must be within a given district was applied. In such cases, the block group in question was considered ‘TIFed’ (i.e. assigned to the treatment group) and associated with a unique TIF id number. Information on the date of designation was also included on the GIS shapefiles. In cases where multiple TIFs overlapped a single block group, assignment was given to the TIF that contained the highest share of the block-group population. For block groups that were covered by more than one TIF, in which no single TIF covered more than 50 per cent of the block group’s overall population and in which the majority of a block group’s population was covered by either TIF, then we assigned the block group to the TIF with the highest (minority) share (i.e. the plurality). At the end of the study period (2008), 1026 block groups (42.2 per cent) were associated with a TIF based on this treatment method, while 1403 (57.8 per cent) were in the ‘control’ group.
The next critical step in developing the panel dataset was to construct the time series on the three main sets of dependent variables. Data on employment and establishment counts by industry came from the National Establishment Time-series (NETS) database. The NETS is a longitudinal dataset produced by Walls and Associates and based on 19 annual snapshots of the Dun and Bradstreet Inc. (D&B) business listing and credit rating service. Additional discussion of the NETS is available in the Appendix.
Address-level building permits records are available from 1994 through 2006 from on on-line data clearinghouse maintained by the Chicago Metropolitan Agency for Planning (CMAP). They created this dataset from annual extracts of building permit records from the City of Chicago Department of Buildings. This database included information on the date, type and stated value of construction put in place. These data cover both new construction and remodelling permits. Once geocoded, each record was associated with a unique block group and summary figures were generated for each block-group/year.
Finally, to provide a richer treatment indicator than TIF designation alone, we used data collected by the Neighborhood Capital Budget Group and updated and maintained by the Center for Urban Economic Development (UIC-CUED) that contained information about TIF-funded public expenditures in each TIF. The timeframe for this dataset covers all TIFs declared before 2006. It was gathered primarily from redevelopment agreements published in the City Council’s Journal of Proceedings or from documents prepared by TIF consultants and obtained by NCBG through a Freedom of Information Act request. This dataset is used to construct the TIF investment variable. Specifically, the variable
Table 1 provides summary statistics for employment change over the study period and various neighbourhood and land use characteristics for the treatment and control block groups. The difference in mean values is given with and without weighting by the propensity scores. Not surprisingly, block groups that received TIF designation (at any time throughout the 1990–2008 period) had higher unemployment, poverty and vacancy rates and had a higher proportion of African Americans in 1990. While the TIF block groups showed higher rates of growth in both the overall 1990–2008 and the earlier 1990–1998 periods, this difference was insignificant after propensity scores weighting. While this weighting procedure did not reduce the differences between the treatment and control groups on all observable characteristics, the fact that pre-treatment employment trends are smoothed is a good indicator that the weighting procedure effectively addresses the issue of selection bias.
Block group characteristics by TIF status, 1990

1990 land use data were obtained from the Chicago Metropolitan Area Plan (CMAP) (formerly the Northeastern Illinois Planning Commission (NIPC).
Author’s calculation from ESRI census block group shapefile; distance is in decimal degrees relative to the centroid of the block group that includes corner of State and Madison streets.
National Establishment Time Series (NETS); weighted difference refers to the difference of means after weighting based on the propensity score of treatment assignment.
Notes: All variables were constructed from the 1990 Census of Population and Housing STF3 unless otherwise noted.
5. Results
Overall, this analysis finds no support for either of the main hypotheses tested: that the use of TIF in Chicago generates economic development opportunities for local residents that would not have otherwise occurred or that TIF catalyses private actors to invest in distressed neighbourhoods.
5.1 Impact of TIF Designation
Table 2 contains the results of the difference-in-differences analysis summarised in equation (1). Estimates of the impact of TIF are presented for both the unweighted (column 1) and propensity-score-weighted (column 2) specifications. The results are also sorted into three panels according to the major set of dependent variables considered. The upper panel contains the estimates on employment across the five categories considered and the middle panel summarises the impacts on the number of business establishments in the same categories. The lower panel contains the impacts on building permit activity. Overall, the estimated impact of TIF designation on total employment is very close to zero (-0.001 unweighted and -0.003 weighted) with relatively small standard errors. To put this finding in context, while the estimates are very close to zero and insignificant, the statistical power of the model implies a level of precision great enough to rule out anything larger than a 2.7 per cent increase in employment within TIF block groups at the 90 per cent level. At this most basic level, the TIF programme in Chicago is shown to be an ineffective tool in creating jobs. In the retail and manufacturing sectors, the employment effects are slightly negative and, in the case of retail using the propensity score method (−0.054), significant at the 10 per cent level. Thus, in the sectors which are most closely associated with stated goals of TIF projects, there is no discernible positive impact on job creation. The minor negative finding in retail may indicate that TIFs are speeding up the transition from smaller locally owned stores to larger retail chains (which operate more efficiently)—as suggested by the positive coefficient on branch establishments; however, this finding should not be viewed as strong causal evidence that TIF actually reduces local employment. The results for establishment counts are similar to those for employment, with all estimates centred near zero and insignificant. This indicates that, on average, there is little evidence that TIF has successfully supported entrepreneurship or new business development in an effective way.
The impact of TIF designation and investment levels on the natural log of employment, establishments and building permit activity in Chicago, 1990–2008
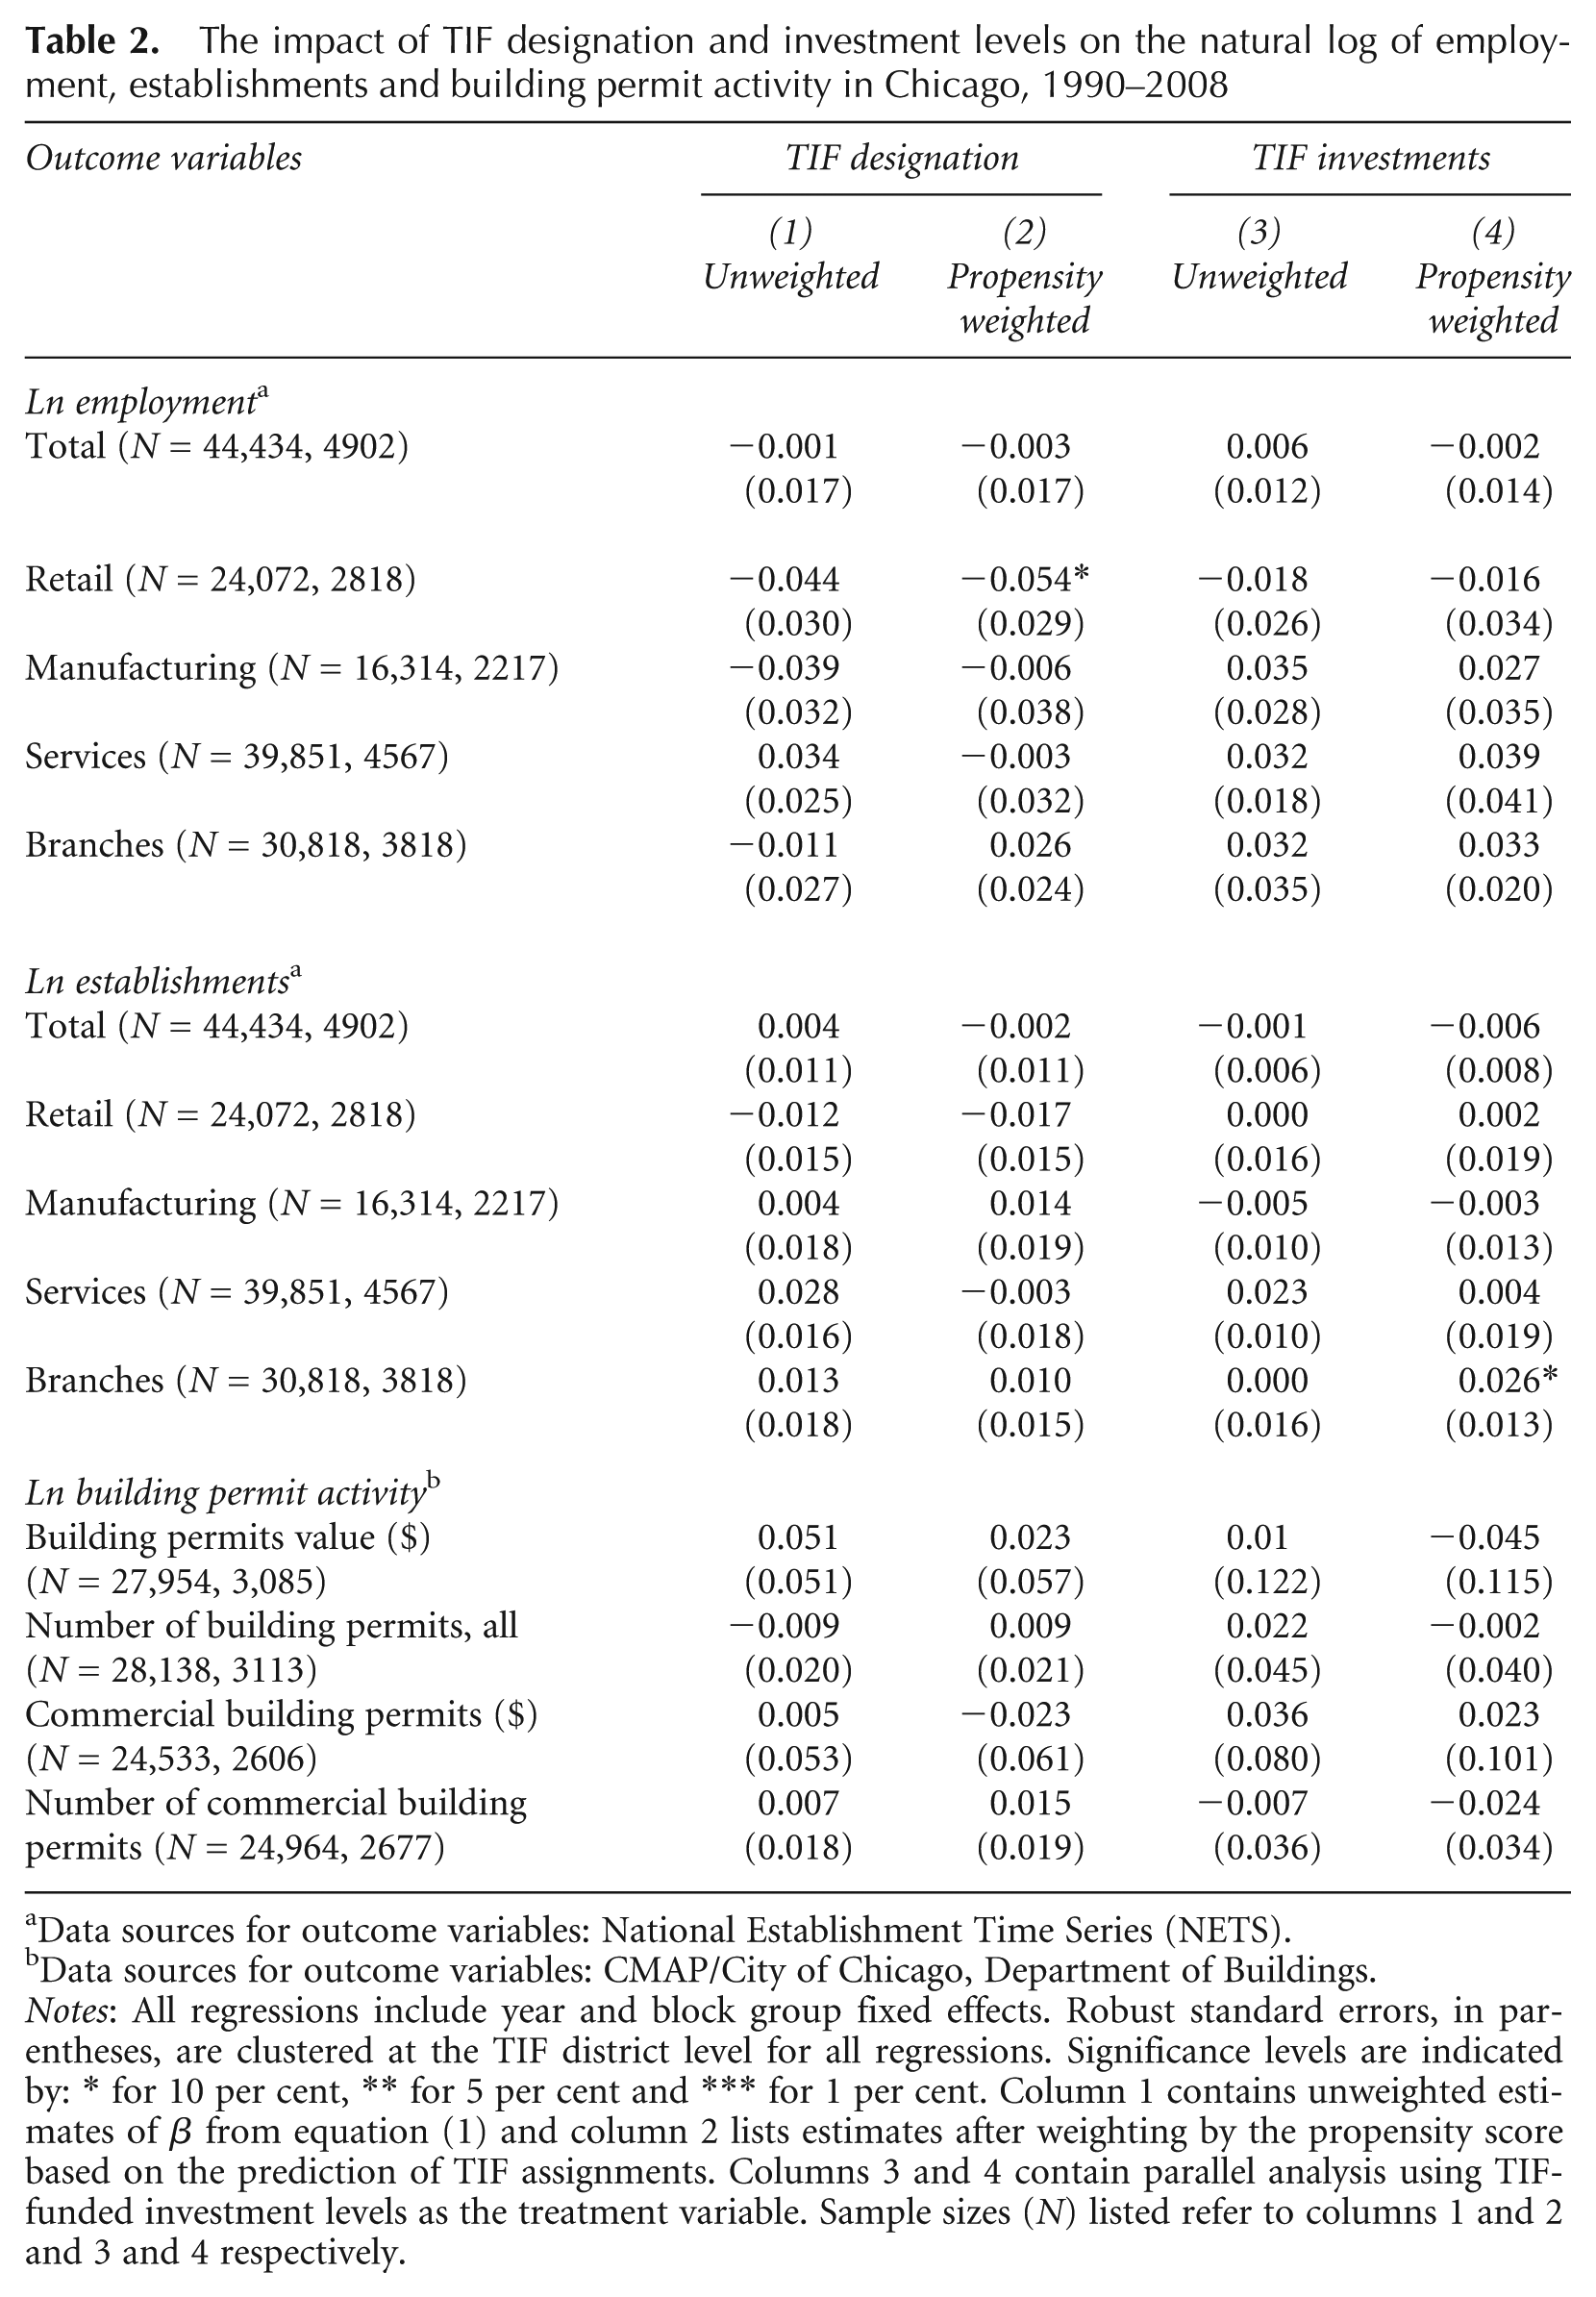
Data sources for outcome variables: National Establishment Time Series (NETS).
Data sources for outcome variables: CMAP/City of Chicago, Department of Buildings.
Notes: All regressions include year and block group fixed effects. Robust standard errors, in parentheses, are clustered at the TIF district level for all regressions. Significance levels are indicated by: * for 10 per cent, ** for 5 per cent and *** for 1 per cent. Column 1 contains unweighted estimates of β from equation (1) and column 2 lists estimates after weighting by the propensity score based on the prediction of TIF assignments. Columns 3 and 4 contain parallel analysis using TIF-funded investment levels as the treatment variable. Sample sizes (N) listed refer to columns 1 and 2 and 3 and 4 respectively.
The argument that TIF designation per se sends a signal to the private real estate market and acts as a catalyst for redevelopment activity is also soundly rejected. As the last panel in Table 2 indicates, none of these DD estimates is significant. Although the point estimate for the value of all building permits (including residential and institutional) is slightly positive (approximately 5 per cent), it is not significant and, when controlling for the propensity scores, the effect is essentially zero. Interestingly, commercial building permit activity—which is the category that is most likely to be effected by TIF—is very close to zero and insignificant.
5.2 The Impact of TIF Investments
The preceding results simply measured the impact of TIF district designation on economic development outcomes in treated block groups. Because the timing to actual TIF-funded investments varies from the date of designation, it is plausible that one should not expect to find any positive outcome by examining designation alone. However, as the findings in columns 3 and 4 in Table 2 indicate, there is no evidence that TIF generated positive outcomes when we examine the timing of actual TIF-funded spending within the districts. To recall, the independent variable of interest here is the cumulative sum of publicly allocated TIF funds in each year in each TIF district. Thus, for a given TIF district designated in, say 1999, the
To clarify these findings, this analysis does not indicate that no building activity or job creation occurred in TIFed block groups, or resulted from TIF projects. Rather, the level of these activities was no faster than similar areas of the city which did not receive TIF assistance. It is in this aspect of the research design that we are able to conclude that the development seen in and around Chicago’s TIF districts was likely to have occurred without the TIF subsidy. In other words, on the whole, Chicago’s TIF programme fails the ‘but-for’ test.
5.3 Robustness Checks
To ensure that the analysis conducted here is valid, two robustness checks were performed. First, to rule out the possibility that there is an actual positive impact of TIF projects which may simply not be observed until a few years after the project was completed, the analysis was repeated using a distributed lag structure on the two key independent variables (TIF designation), as presented in equation (3). This ‘time-path’ analysis presented in Figure 3 below also checks for the possibility of anticipatory effects whereby employment increases just before the treatment itself.
If there were a causal impact of TIF designation, we would expect the time paths in Figure 3 to rise sharply at t-0 (the year of treatment) and remain significantly above zero for all subsequent years. If there were a lagged impact of TIF on employment then this increase would appear after t-0. However, as the first panel (A) indicates, the pattern of TIF impact is relatively flat and insignificant (i.e. dashed 90 per cent confidence interval includes the zero line). The pattern for total business establishments is almost completely flat, with no marked increase or decrease before or after the time of treatment designation. However, there is no demonstrated positive impact that is associated with the timing of TIF designation. By examining the dynamic time paths of estimates, we can test for and ultimately rule out the possibility that TIF designation leads to positive yet lagged economic development outcomes on neighbourhood economies.
The second robustness check performed is a simple sample division of the treatment group to test for any differential impact by the original purpose of the TIF district. As discussed in section 2, Chicago uses one of two primary legal justifications for designating a TIF district. Specifically, the collection of properties that comprise a TIF must be considered ‘blighted’ and meet a given set of criteria (for example, lower property values, physical disrepair). Alternatively, the City also has the power to designate a TIF in ‘conservation’ areas which do not currently exhibit blight but are either located near blighted areas or are otherwise at risk of becoming blighted. To the extent that TIF-funded job creation prospects or neighbourhood real estate potential is superior in ‘conservation’ areas—as they face fewer neighbourhood problems—we may expect TIF impacts to be higher for conservation areas. On the other hand, it could be that impacts are greater in ‘blighted’ areas that are coming from a lower level of economic development to begin with and thus even small net impacts with be amplified relative to similar blighted areas of the City. Table 3 contains the TIF impact estimates for the natural log (ln) of total employment, establishments and building permit activity for both ‘conversation’ and ‘blighted’ TIF districts. Looking at these high-level outcome variables indicates that there is no evidence of a strong positive impact of TIF designation. The point estimates are all very close to zero and insignificant. As a result, we cannot conclude that grouping all TIF treatments—regardless of their intended purpose—masks an underlying positive effect.
The impact of TIF designation by TIF designation type, 1990–2008

Data sources for outcome variables: National Establishment Time Series (NETS).
Data sources for outcome variables: CMAP/City of Chicago, Department of Buildings.
Notes: All regressions include year and block group fixed effects. Robust standard errors, in parentheses, are clustered at the TIF district level for all regressions. Significance levels are indicated by: * for 10 per cent, ** for 5 per cent and *** for 1 per cent. N for total employment and establishments are 35,598 and 23,308 for conservation and blighted TIFs respectively. N for building permits impacts are 22,706 and 14,691 respectively. All estimates are weighted by the propensity score based on the prediction of TIF assignments. TIFs classified as both blighted and conservation were coded as blighted.
6. Conclusion and Policy Implications
This paper effectively answers the ‘but-for’ question at the level of the City of Chicago’s overall use of TIF. Overall, TIF failed to produce the promise of jobs, business development or real estate activity at the neighbourhood level beyond what would have occurred without TIF. This finding is made by comparing fundamental economic development outcomes in block groups that received TIF designation with those that did not, controlling for the initial underlying characteristics of these neighbourhoods. Furthermore, when we measure the impact of actual TIF-funded investments, we still find no evidence that TIF effectively obtained desired economic development outcomes.
While the findings of this paper are clear and decisive, it is important to comment here on their exact extent and external validity, and to discuss the limitations of this analysis. First, the findings do not indicate that overall employment growth in the City of Chicago was negative or flat during this period. Nor does this research design enable us to claim that any given TIF-funded project did not end up creating jobs. Rather, we conclude that, on-average, across the whole city, TIF was unsuccessful in jumpstarting economic development activity—relative to what would have been likely to have occurred otherwise. Secondly, these results are limited to the universe of observations from which treatment was specified (i.e. the City of Chicago). Thus, these findings should not be interpreted as a broad indictment of the use of TIF in any context. Lastly, while this paper uses the most detailed information available and includes a test of not only TIF designation, but also aggregate investment levels on economic development outcomes, we still lack data at the ‘project level’ which would allow one to separate out TIF investments in non-economic-development-related activities. While there is a good argument to be made that these investments themselves may increase local development activity, due to the City of Chicago’s past reluctance to make TIF expenditure data public, a full accounting of TIF-funded projects is not possible at this time. Ultimately, however, this analysis and the story of TIF in Chicago more generally, should serve as a cautionary tale to jurisdictions throughout the US and throughout the world.
The findings of this paper imply that the fiscal strain placed on the City of Chicago’s general fund and the public schools is exacerbated by the sequestration of revenue in TIF accounts. Given that the job creation record of TIFs is negligible at best, as shown in this paper, policy-makers in the City should strongly reconsider adopting new TIF districts and should even consider additional legislation that attempts to recoup some TIF funds for general public-sector activities. In practice, a limited amount of TIF funds have been used to support the construction of school buildings and other authorised capital improvements. However, since TIF by nature localises fiscal capacity, this may generate structural inequality across the city.
For policy-makers outside the City of Chicago, there are applicable lessons to be taken from this paper. First, it is best to tie TIF designation to actual redevelopment proposals with a private-sector partner up-front. This is a requirement by state statute in North Carolina, where TIF has been used only sparingly. Secondly, each TIF proposal should be coupled with careful cost–benefit analysis that projects and clearly articulates the job creation outcomes of the redevelopment proposal. Thirdly, while it was not an explicit aspect of this paper’s empirical analysis, it is critical that public agencies considering TIF make all transactions as transparent as possible so that the public can clearly understand where their sequestered tax dollars flow and hold public officials accountable for their decisions.
These findings also support the position put forward by some urban theorists that, as cities seek new ways to become ‘entrepreneurial’ (Harvey, 1989), they essentially cede power to private capital, which may or may not be located within the city limits. In the case of TIF, as Weber (2010) elucidates, as more and more tax revenue is sequestered, the standing of developers and footloose capital is strengthened as resources are shifted to accommodate their interests, while the provision of public goods such as basic education and shared infrastructure are rationed in the name of ‘fiscal crisis’. Essentially, Chicago’s extensive use of TIF can be interpreted as the siphoning off of public revenue for largely private-sector purposes. Although, TIF proponents argue that the public receives enhanced economic opportunity in the bargain, the findings of this paper show that the bargain is in fact no bargain at all.
Footnotes
Appendix. Description of the National Establishment Time-series (NETS) Database
Because it is based on information from D&B—which has a strong economic incentive to reach every business—the NETS is a near census of business establishments in the US. The NETS contains detailed information on employment, sales, primary industry and birth and death year at the establishment level. While some observers are concerned with the measurement of employment levels at establishments, employment figures at an aggregate level are consistent with trends observed in publically available sources, such as the Quarterly Census of Employment and Wages (QCEW) and the County Business Patterns (CBP) (see Neumark et al., 2005). Each record also contains detailed geographical information for each establishment’s current or final location and a detailed inventory of all establishment moves. To generate accurate block-group-level counts of employment and the number of existing establishments in each year, each record in Cook County, Illinois, was geocoded based on its listed latitude and longitude and associated with a unique block group for each year that the establishment operated in that location. A subset of NETS records that moved one or more times during the 1990–2008 period were also geocoded based on their origin latitude and longitude information on the move table of the NETS. The process of geocoding these movers was repeated up to six times to identify uniquely the place/year combination of each record. Through this process, for example, the employment count calculated for a given block group in 1998 only includes establishments that were located there and operating in 1998, even if some businesses subsequently moved.
Acknowledgements
The author would like to thank Rachel Weber and Daniel Hartley for sharing critical data sources and helpful comments, and three anonymous referees at Urban Studies. Thanks to Bill Rohe and Meenu Tewari for opportunities to present this research in the Department of City and Regional Planning. Thanks also to participants in the World Planning Schools Congress (July 2011) in Perth, Australia. Thanks to Jason Kajer and Patrick Nerz for providing valuable research assistance and to Ashley Tindall for editorial assistance.
Funding
This research received no specific grant from any funding agency in the public, commercial or not-for-profit sectors.