
Abstract
The success of compact development depends in part on accurately gauging its public demand and understanding residents’ preferences towards it. Drawing upon a stated-preference survey in the Wasatch Front region in Utah, this paper estimates preferences for compact, walkable and transit-friendly neighbourhoods through the application of a discrete choice experiment. Results derived from a latent class analysis reveal significant heterogeneity in residential location preferences. Overall, strong preferences for compact development are more likely to occur among families with fewer school-age children, low-income and renter-occupied households, and those who appreciate social heterogeneity and have less desire for privacy. These tastes are also associated with personal preferences for walking and biking and supportive opinions toward environmental protection and urban growth boundary policies. By comparing respondents’ preferences to their actual residential and travel choices in two contrasting subregions, we further address the complex relationships between environment, preferences, residential locations and travel.
Keywords
Introduction
The notion of compact development and other alternative development practices such as new urbanism, smart growth and transit-oriented development are emotionally and intellectually appealing to both policy-makers and urbanists (Downs, 2005; Ewing et al., 2008). The concept of compact development is complex and multidimensional (Downs, 2005; Lewis and Baldassare, 2010). In the recently published book Growing Cooler, Ewing et al. (2008) argued that compact development implies ‘higher average “blended” densities’ and ‘features a mix of land use, development of strong population and employment centres, interconnection of streets, and design of structures and spaces at a human scale’ (p. 1). Despite the known benefits of compact development such as increased transit use, more intensive social interactions and healthy outcomes (Brown and Werner, 2009; Ewing and Cervero, 2010; Farber and Li, 2013), planners and policy-makers must accurately gauge its public demand if long-term transportation and land-use planning efforts are to be successful. Specifically, local governments in the state of Utah have recently considered new initiatives to promote compact development and increase the use of public transit (Wasatch Front Regional Council, 2010). These policies will have a profound impact on future development trends and therefore the options available to residential movers. From a demand-side perspective, this study seeks to identify residents’ potential segments and willingness to live in compact, walkable and transit-friendly neighbourhoods in the automobile-dependent state of Utah. In addition, as the US housing market has experienced the highest decade-long growth in renter households over the past six decades (JCHS, 2013), modelling distinctive residential preferences of renters and owners provides a timely basis to carefully design compact development and housing policies.
Residential preferences are heterogeneous in nature. Extensive literature has revealed that preferences toward compact development are sensitive to socioeconomic characteristics such as educational attainment and income (Lewis and Baldassare, 2010). These tastes are also contingent upon household tenure (rent or own) (e.g. Cao, 2008) and important events in a life cycle, particularly childbirth (Chen and Lin, 2011). Besides socio-demographics, recent studies have shown that ‘subjective’ (or soft) factors, such as attitudes and environmental awareness, greatly influence residential location decisions (Olaru et al., 2011; Rid and Profeta, 2011; Yang and O’Neill, 2013). Through the application of discrete choice experiments (DCE), researchers have also employed rigorous modelling techniques, particularly mixed logit models and latent class analysis (LCA), to estimate preference heterogeneity in residential choice behaviour (e.g. Hoshino, 2011; Walker and Li, 2007). For instance, Olaru et al. (2011) employed LCA to explore residential preferences toward transit-oriented development in a new rail corridor in Western Australia. Also using LCA and DCE, Rid and Profeta (2011) address the potential market demand for sustainable housing development in Germany. However, in the literature on residential preferences or public demand for compact and transit-oriented developments in the USA (e.g. Cao, 2008; Handy et al., 2008; Lewis and Baldassare, 2010; Yang and O’Neill, 2013), rarely has preference heterogeneity in residential location choice behaviour been systematically examined, particularly through the application of DCE and LCA. In addition, few studies have been done to investigate the impact of latent preference heterogeneity on actual residential locations while taking into consideration built environment characteristics.
Drawing upon a recent stated-preference (SP) survey of 1053 respondents in the Wasatch Front, the largest metropolitan region in Utah, our approach in this paper is to apply a DCE in conjunction with latent class approaches to estimate the public demand for compact development. The DCE captures the multidimensional nature of a compact development and controls for the costs of different alternatives. The inclusion of renters and home owners in our sample allows for quantifying their distinctive residential preferences. Furthermore, a latent class analysis of the SP data is then used to identify the characteristics of distinct segments among respondents and account for preference heterogeneity. In our case, the segmentation and preference structures are sensitive to both socio-demographic characteristics and attitudes. Partitioning the sample into subregions characterised by distinctive development densities and transit systems makes it possible to assess the impact of the built environment on residential preferences. In addition, spatial analysis and the ex-post profiling of different segments shed further light on the issue of residential self-selection, referring to the process in which residents may simultaneously select the residential locations and travel modes that fit their preferences.
Literature review
The literature review relevant to this research is split between the methodological approaches to modelling residential preferences, and the work concerned with the explanatory factors of residential location preferences and the issue of residential self-selection.
Modelling residential preferences
Trade-off-styled questions have been commonly employed to measure residents’ preferences for different neighbourhood types. The 2011 American community survey showed that 56% of respondents preferred compact development and smart growth to sprawl when two competing neighbourhoods were presented (Belden Russonello and Stewart Research and Communications, 2011). However, survey questions asked in previous stated-preference surveys are mostly focused on specific trade-offs between selected attributes of compact development. In this setting, respondents were not presented with a full set of alternatives. Also, although price or affordability is one of the most important factors in determining residential locations, this factor is mostly absent in the previous studies using stated-preference questionnaires (Cao, 2008; Handy et al., 2008; Levine and Frank, 2007). To overcome this limitation, the DCE method can be used to quantify individual reactions to a set of combinations of attributes pertaining to a compact development and estimate people’s willingness to pay for hypothetical alternatives that may not be available in the current market (Morrow-Jones et al., 2004).
In the analysis of SP data from DCE, the binomial or multinomial logit model is commonly used under the assumption that individual preferences are homogeneous. Nevertheless, consumer preferences are heterogeneous in nature, which means that average-based data analysis may mask the heterogeneity of residential preferences. Researchers have employed more flexible discrete choice models such as the mixed logit (Hoshino, 2011) and latent class models (Olaru et al., 2011; Rid and Profeta, 2011; Walker and Li, 2007) to estimate preference heterogeneity. Latent class approaches, assuming a finite mixture of preference heterogeneity, have attracted greater attention in recent studies.
Developed by Lazarsfeld and Henry (1968), LCA is a fundamental tool for identifying heterogeneous subgroups of consumers (market segments) and thus accounting for preference heterogeneity. Specifically, in comparison with the mixed logit model, widely used to account for preference heterogeneity, LCA is a semi-parameter approach that provides a relatively simple and plausible approach to explore preference heterogeneity. Also, it is not constrained by a predefined specification of the distribution of individual preferences (Greene and Hensher, 2003; Shen, 2009). In this setting, class membership is probabilistic, and can be jointly affected by both respondents’ choices and their individual-level characteristics (Olaru et al., 2011; Walker and Li, 2007). Unlike the ‘two-stage’ approach employed by Hoshino (2011) in the setting of the mixed logit model, LCA provides a ‘one-step’ approach, which is able to directly incorporate respondents’ characteristics such as demographics in the model specification to account for the ‘sources’ of preference heterogeneity.
Factors affecting residential location preferences
The extensive empirical literature on residential location preferences has identified two broad categories of explanatory factors including socio-demographics and, more recently, attitudes.
On the one hand, residential choices and preferences are closely associated with individuals’ demographic characteristics. Important events in a life cycle, especially the birth of a child, tend to have a strong impact on these preferences (Chen and Lin, 2011; Smith and Olaru, 2013). Furthermore, socioeconomic wellbeing has proved to be influential in preferences for different land use and neighbourhood patterns. For instance, highly educated individuals have a higher likelihood of favouring compact development (Lewis and Baldassare, 2010). Specifically, household tenure plays an important role in residential choices; renters tend to be more sensitive to accessibility attributes, while home owners are more concerned about their new residence (Bina et al., 2006; Cao, 2008).
On the other hand, recent studies have documented that attitudes or other subjective factors are also influential in shaping residential preferences and resulting location choices (Lewis and Baldassare, 2010; Olaru et al., 2011; Schwanen and Mokhtarian, 2007). By separately adding socio-demographic and attitudinal variables regarding neighbourhood environments in the segmentation functions, Olaru et al. (2011) provide evidence that attitudes could better explain the latent residential preference heterogeneity than the socio-demographic factors do. Based on recent interviews conducted in Eugene, Oregon, Yang and O’Neill (2013) point to the fact that a set of attitudes, such as awareness of environmental and social consequences pertaining to different land-use patterns and perceptions of environmental qualities of compact neighbourhoods, collectively contribute to people’s willingness to live in a compact and mixed-used environment.
In this study, we apply LCA to identify residents’ potential segments and heterogeneous preferences for compact, walkable and transit-friendly neighbourhoods. Specifically, in addition to basic socio-demographic parameters, attitudes toward a wide range of issues, including environment protection and urban growth boundaries (UGB) policies, social and natural environments in neighbourhoods, and personal travel mode preferences, were estimated to achieve a more comprehensive understanding of residential preference structures.
Residential self-selection, built environment and travel
A more accurate assessment of residential preferences further allows for a nuanced understanding of the relationship between built environment and travel behaviour (Chen and Lin, 2011; Zegras et al., 2012). The existing studies have shown that residential locations and travel behaviour are strongly interwoven (Bhat and Guo, 2007; van Wee, 2009), and that mixed land use, higher densities and accessibility to public transit tend to contribute to reduced automobile dependence (Ewing and Cervero, 2010). However, a fundamental criticism of this argument is that individual preferences may also have a strong impact on travel and location decisions. Therefore, individuals may self-select into residential locations based on their desired lifestyle preferences and travel needs, obscuring the ability to independently know the impact of land use on travel. This is known as the self-selection problem in the travel behaviour literature (Ewing and Cervero, 2010; Mokhtarian and Cao, 2008).
Some recent studies have applied advanced modelling approaches, such as structural equation models (SEM), in order to tackle the endogenous effect of residential preferences or self-selection on travel behaviour (Cao, 2010; Cao et al., 2007; Zegras et al., 2012). In this research, although our objective is not to quantify the effect of self-selection, by comparing preferences with actual residential locations and travel patterns in the two distinctive subregions (Salt Lake County versus the rest of the urbanised region), we do provide information about the complex relationships between environment, preferences, residential locations and travel behaviour.
Model formulation
As presented in Figure 1, the model structure recognises that individuals aim to maximise the utility of their location choices.

Structure of the discrete choice model with latent variables.
For each respondent i, the utility function of an alternative j is a function of the housing and neighbourhood variables

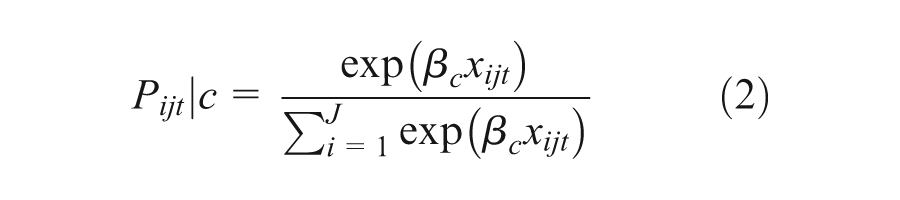
Because the binomial or multinomial logit model assumes the same preference structure across individuals, it may result in biased estimates and incorrect predictions if heterogeneous preferences exist. In a latent class or finite mixture of the logit model, it is assumed that individuals belong to different latent classes (Figure 1). The latent class model calibrates class-specific sets of parameters and the likelihood of the respondents belonging to a class is a probabilistic function. The probability that the respondent i chooses alternative j from a choice-set J at choice situation t conditional on belonging to class c is:
Keep in mind that the class membership of an individual is unknown, but a prior probability can be estimated using observable household characteristics or latent constructs formed by a set of attitudinal and socio-demographic variables (Figure 1). The probability that respondent i belongs to class c is also a general logit choice function of the form:
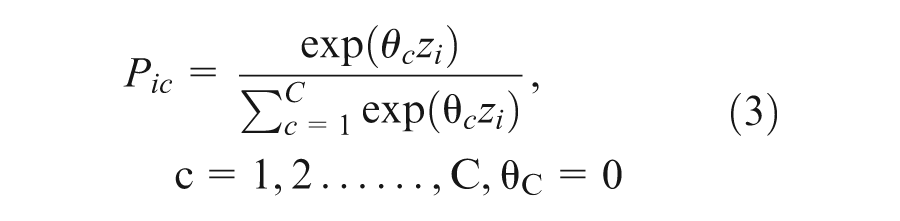
where
Survey design and data collection
Analysis of SP data is based on respondents’ choices between hypothetical residential profiles. The first step in the experimental design is to develop residential profiles that the respondent is asked to choose between. Table 1 lists the attributes used to create choice scenarios. All attributes except for price are formed on ordinal scales. Price levels are expressed as percentage differences from current rent or home price. The pivoted percentage can guarantee comparability between responses, even if it introduces a potential bias because of different absolute-level variations. The alternative would be the presentation of absolute-level variations. However, as Marcucci et al. (2011) suggest, neither of the two methods has an a priori advantage. The pivoted percentage option is preferred in our case because the respondents include both renters and owners.
Attributes and levels used in discrete choice experiments.
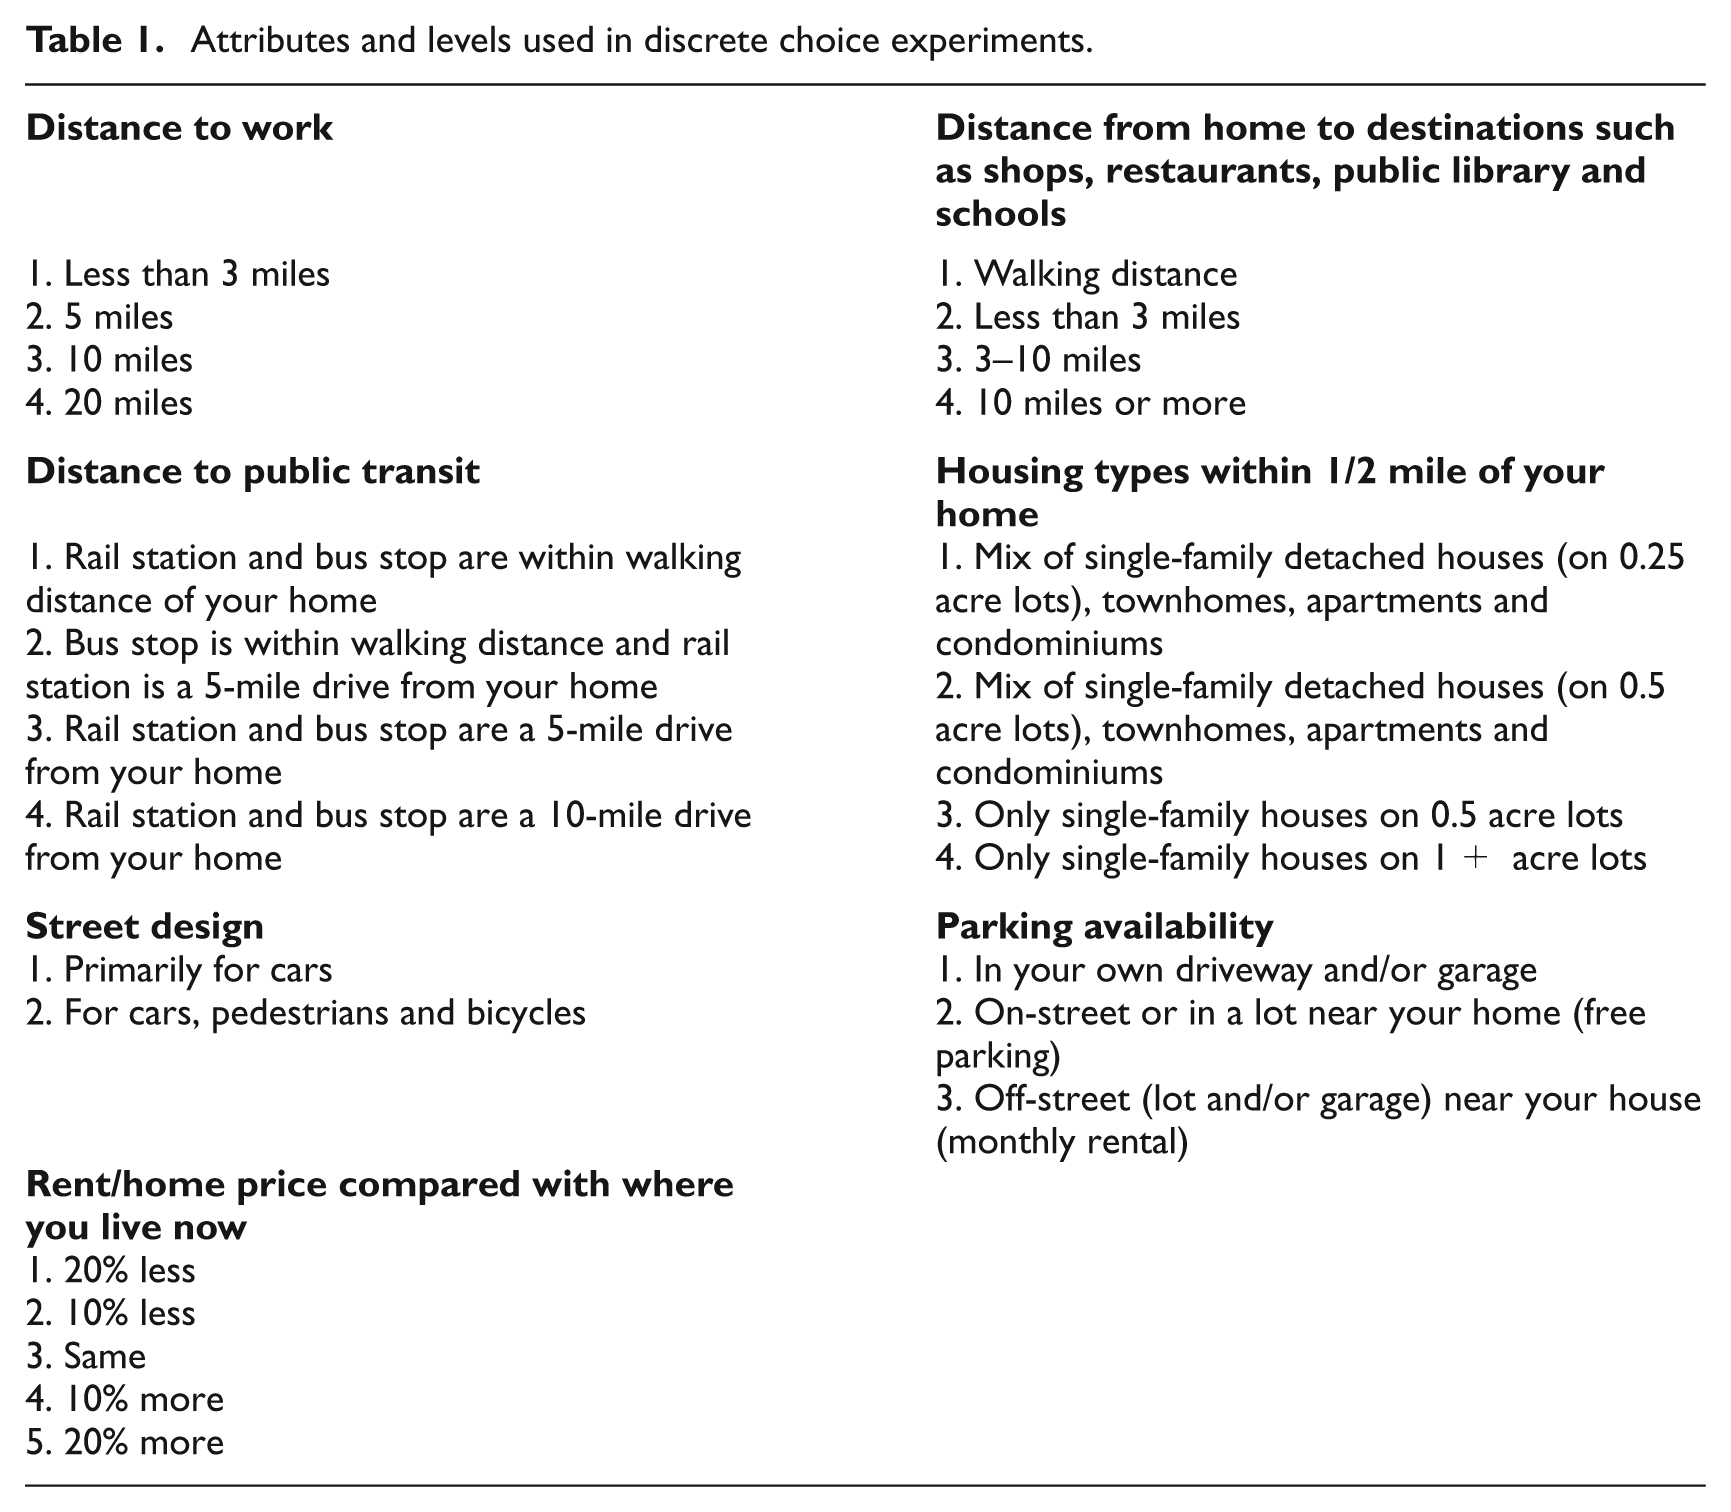
The extensive literature on the measurement of opinions toward compact development guided the choice of experimental criteria to include (Downs, 2005; Ewing et al., 2008; Lewis and Baldassare, 2010). Three indicators were included to capture accessibility attributes, including distance to work, proximity to important destinations (shops, restaurants, public library and schools), and distance to public transit facilities. In addition, we employed another three attributes to distinguish housing types, street design and parking availability. The survey mainly focuses on the trade-offs between lot size, price and accessibility, while not considering other drawbacks of compact development such as crowdedness, noise and congestion. A statistical experimental design was used to control the selection of alternatives provided to respondents. The choice sets mainly follow a fractural and orthogonal factorial design, but some post hoc manipulation of the choice sets removed nonsensical combinations of attributes, as is common in the literature (Hoshino, 2011; Rid and Profeta, 2011). Consequently, 200 choice sets, each consisting of two unlabelled alternatives with seven attributes, were presented to respondents in the survey (Figure A1 in the Appendix). Each respondent in this study randomly received ten choice sets to limit respondent burden and reduce the risk of unreliability of answers. A ‘do not know’ or opt-out option was not included, which would result in the overestimation of specific alternatives. However, including an opt-out option is not problem-free. For example, it may distort the incentives for ‘true’ preference revelation and the decision to opt-out is often a reaction to poor choice-set quality (Kontoleon and Yabe, 2003: 4).
The data were collected as part of the Utah Household Travel Survey administered by the Utah Department of Transportation, and several other transportation and planning agencies. We have refined the study area to four counties: Salt Lake County, Utah County, Davis County and Weber County (Figure 2). Combined, these counties account for over 95% of the population in the Wastach Front region.
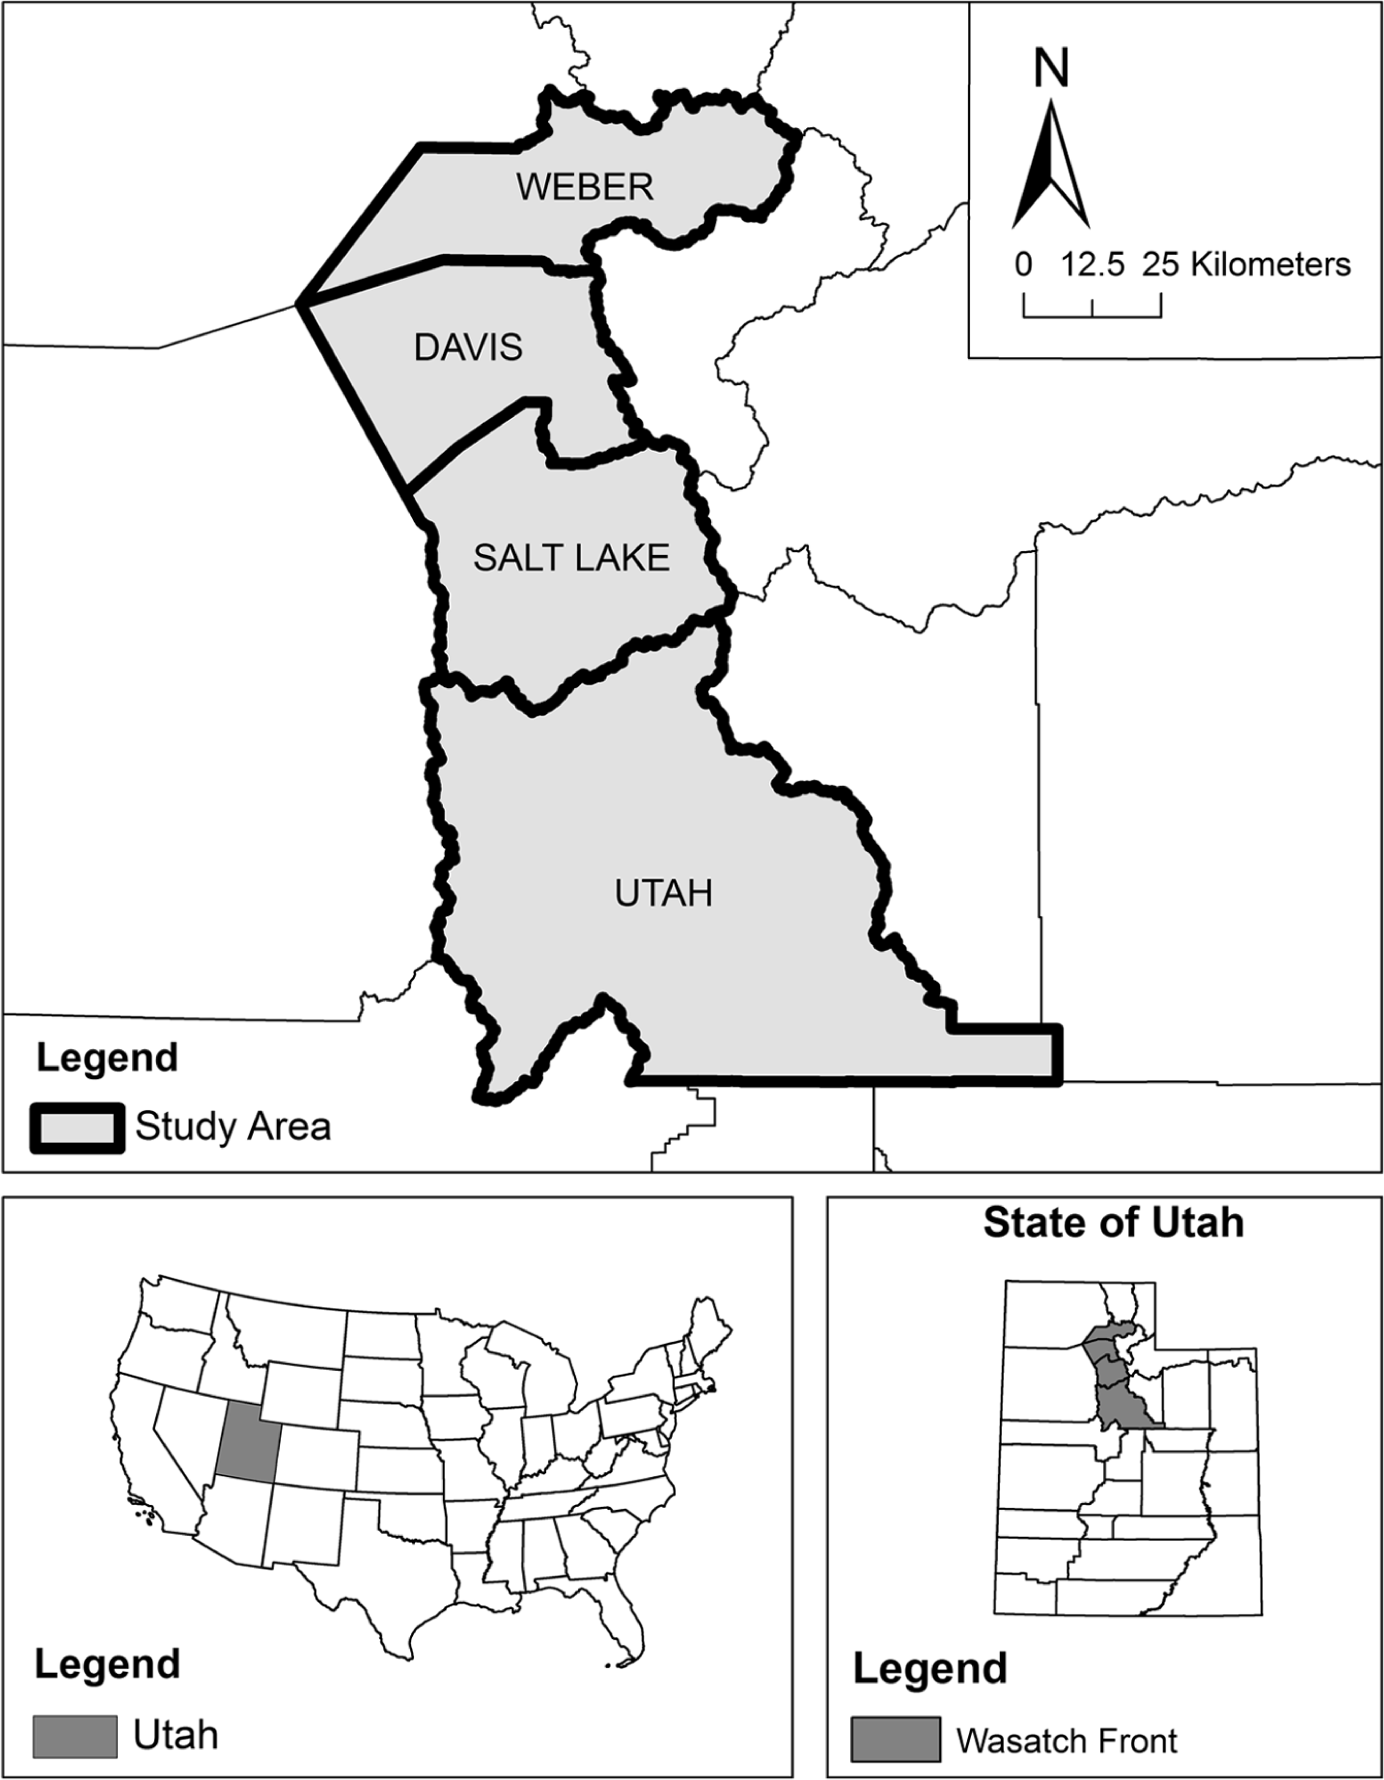
Location of the Wasatch Front region, Utah.
Data collection commenced in May 2012. A subsample of 1053 individuals completed the online residential choice survey, with a response rate of 65%. This response rate is good for an internet survey of 60 screens, since the response rate for a survey administrated to the general public is typically 10–40% (Sommer and Sommer, 1997; see also Cao, 2008, 2010). Unfortunately, the average response time was not retrieved by the internet survey and cannot therefore be used to assess respondents’ burden. In addition to the stated-preference component, the survey included questions about attitudes and household characteristics, such as number of children, income and education (Figure 1). The residential preference survey can also be linked back to the household responses to the Utah Household Travel Survey, which primarily consists of a one-day household travel diary.
In order to test whether attitudes toward a number of issues are affecting respondents’ location preferences, we constructed a set of attitudinal factors based on 16 questions about housing and neighbourhood characteristics (a five-point Likert scale) and six questions concerning travel mode preferences and people’s opinions toward UGB and environmental protection policies (a seven-point Likert scale). Factor scores were entered into the latent class models as covariates in the segmentation function. So in our segmentation models, both important socio-demographic parameters and attitudinal data were treated as covariates (Figure 1).
We estimate models for two distinctive subregions: Salt Lake County and the rest of the Wasatch Front region. By dividing the sample, we gain a better understanding of the influence of the built environment on residential preferences. In addition, an ex-post profiling of the latent classes was used to assess and compare the preferred and actual residential and travel choices. The actual residential locations were based on the coordinates of each respondent’s home locations. Network distances to bus stops and train stations were calculated in a GIS environment using the transportation network data in Utah. Other variables concerning residential locations and travel include location characteristics (e.g. self-reported distance to urban facilities and jobs), auto ownership, frequency of riding transit and mode choices of typical commute trips (by car, transit, walking or bicycling).
Results
Descriptive statistics
In Table 2, we present some descriptive statistics regarding the profile of the Wasatch Front region. Clearly, the population and employment density in Salt Lake County is much higher than that of the other three counties (Utah, Weber and Davis). At the household level, families living in Salt Lake County tend to have fewer children, while the housing price in Salt Lake County is higher than the other three counties. With regard to travel patterns, both census data (2010 American Community Survey 5 years estimates) and our survey indicate that more than 80% of commute trips in the region are done by automobile. Salt Lake County exhibits slightly higher public transport and walk/cycle proportion of trips and moderately higher frequency of riding public transit compared with the rest of the region (Table 2). This is likely due to Salt Lake County’s quality of cycling and pedestrian facilities and its relatively extensive public transit services, including commuter rail, light rail and buses. Notably, college-educated respondents are over-represented in our survey, probably because well-educated people are more willing to respond to the internet survey (see section ‘Survey design and data collection’). This may result in overestimation of the demand for compact development because the subgroup tends to be more supportive of compact development (Lewis and Baldassare, 2010).
Profile of the Wasatch Front and socio-demographic characteristics of respondents.
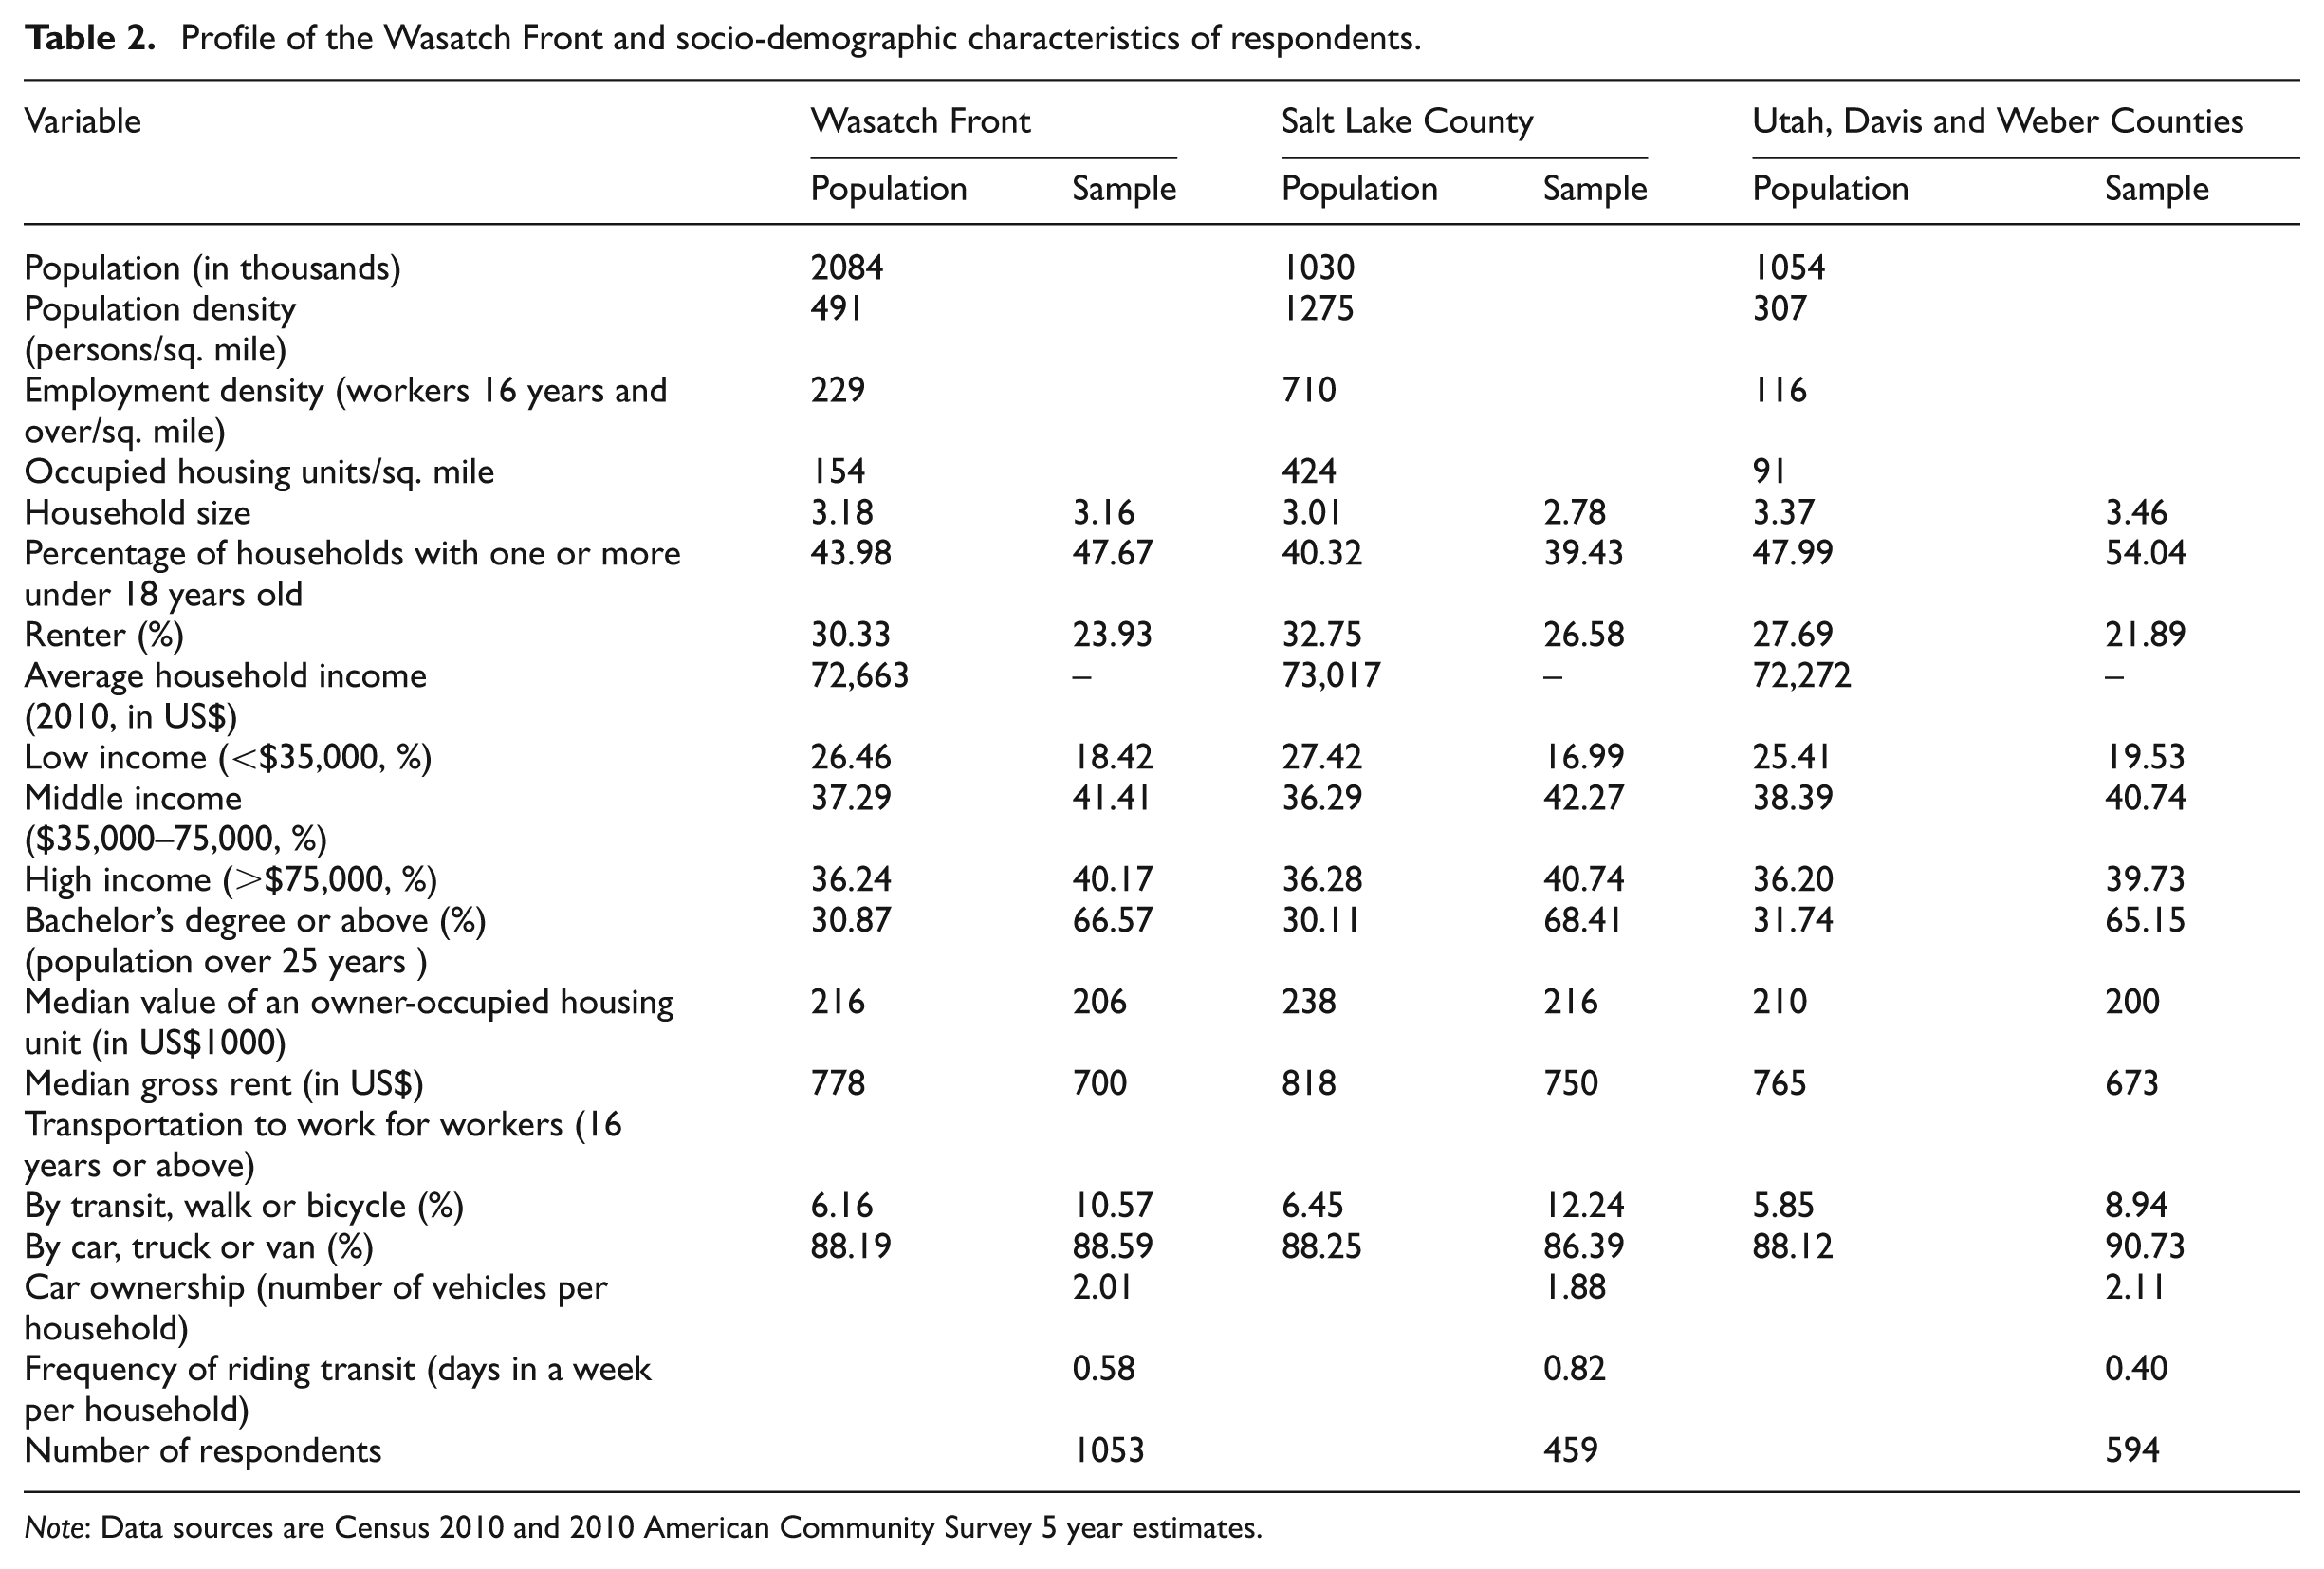
Note: Data sources are Census 2010 and 2010 American Community Survey 5 year estimates.
The attitudinal questions regarding general opinions toward UGB and environmental protection policies, personal travel mode preferences, and importance ratings of 16 neighbourhood attributes were factor analysed (Table 3). Goodness-of-fit statistics, such as the RMSEA of 0.088 and 0.054, show a moderate-to-good fit of our factor analysis results. The factor scores are consistent with the demographic characteristics and distinctive built environments in the two subregions. In general, proximity to job locations is seen as the most important factor, while social heterogeneity and access to goods and services are less important. The factor scores, which compare the two subregions using the two-sample t-test, reveal significant differences in most latent variable scores. The more suburban subregion exhibits lower scores on access to goods and services and support for environmental protection and UGB policies. Participants in the areas of Salt Lake County showed a slightly keener interest in walking, biking and riding transit and were less desirous of larger and newer houses.
Attitudinal factors loadings and scores for respondents in different subregions.
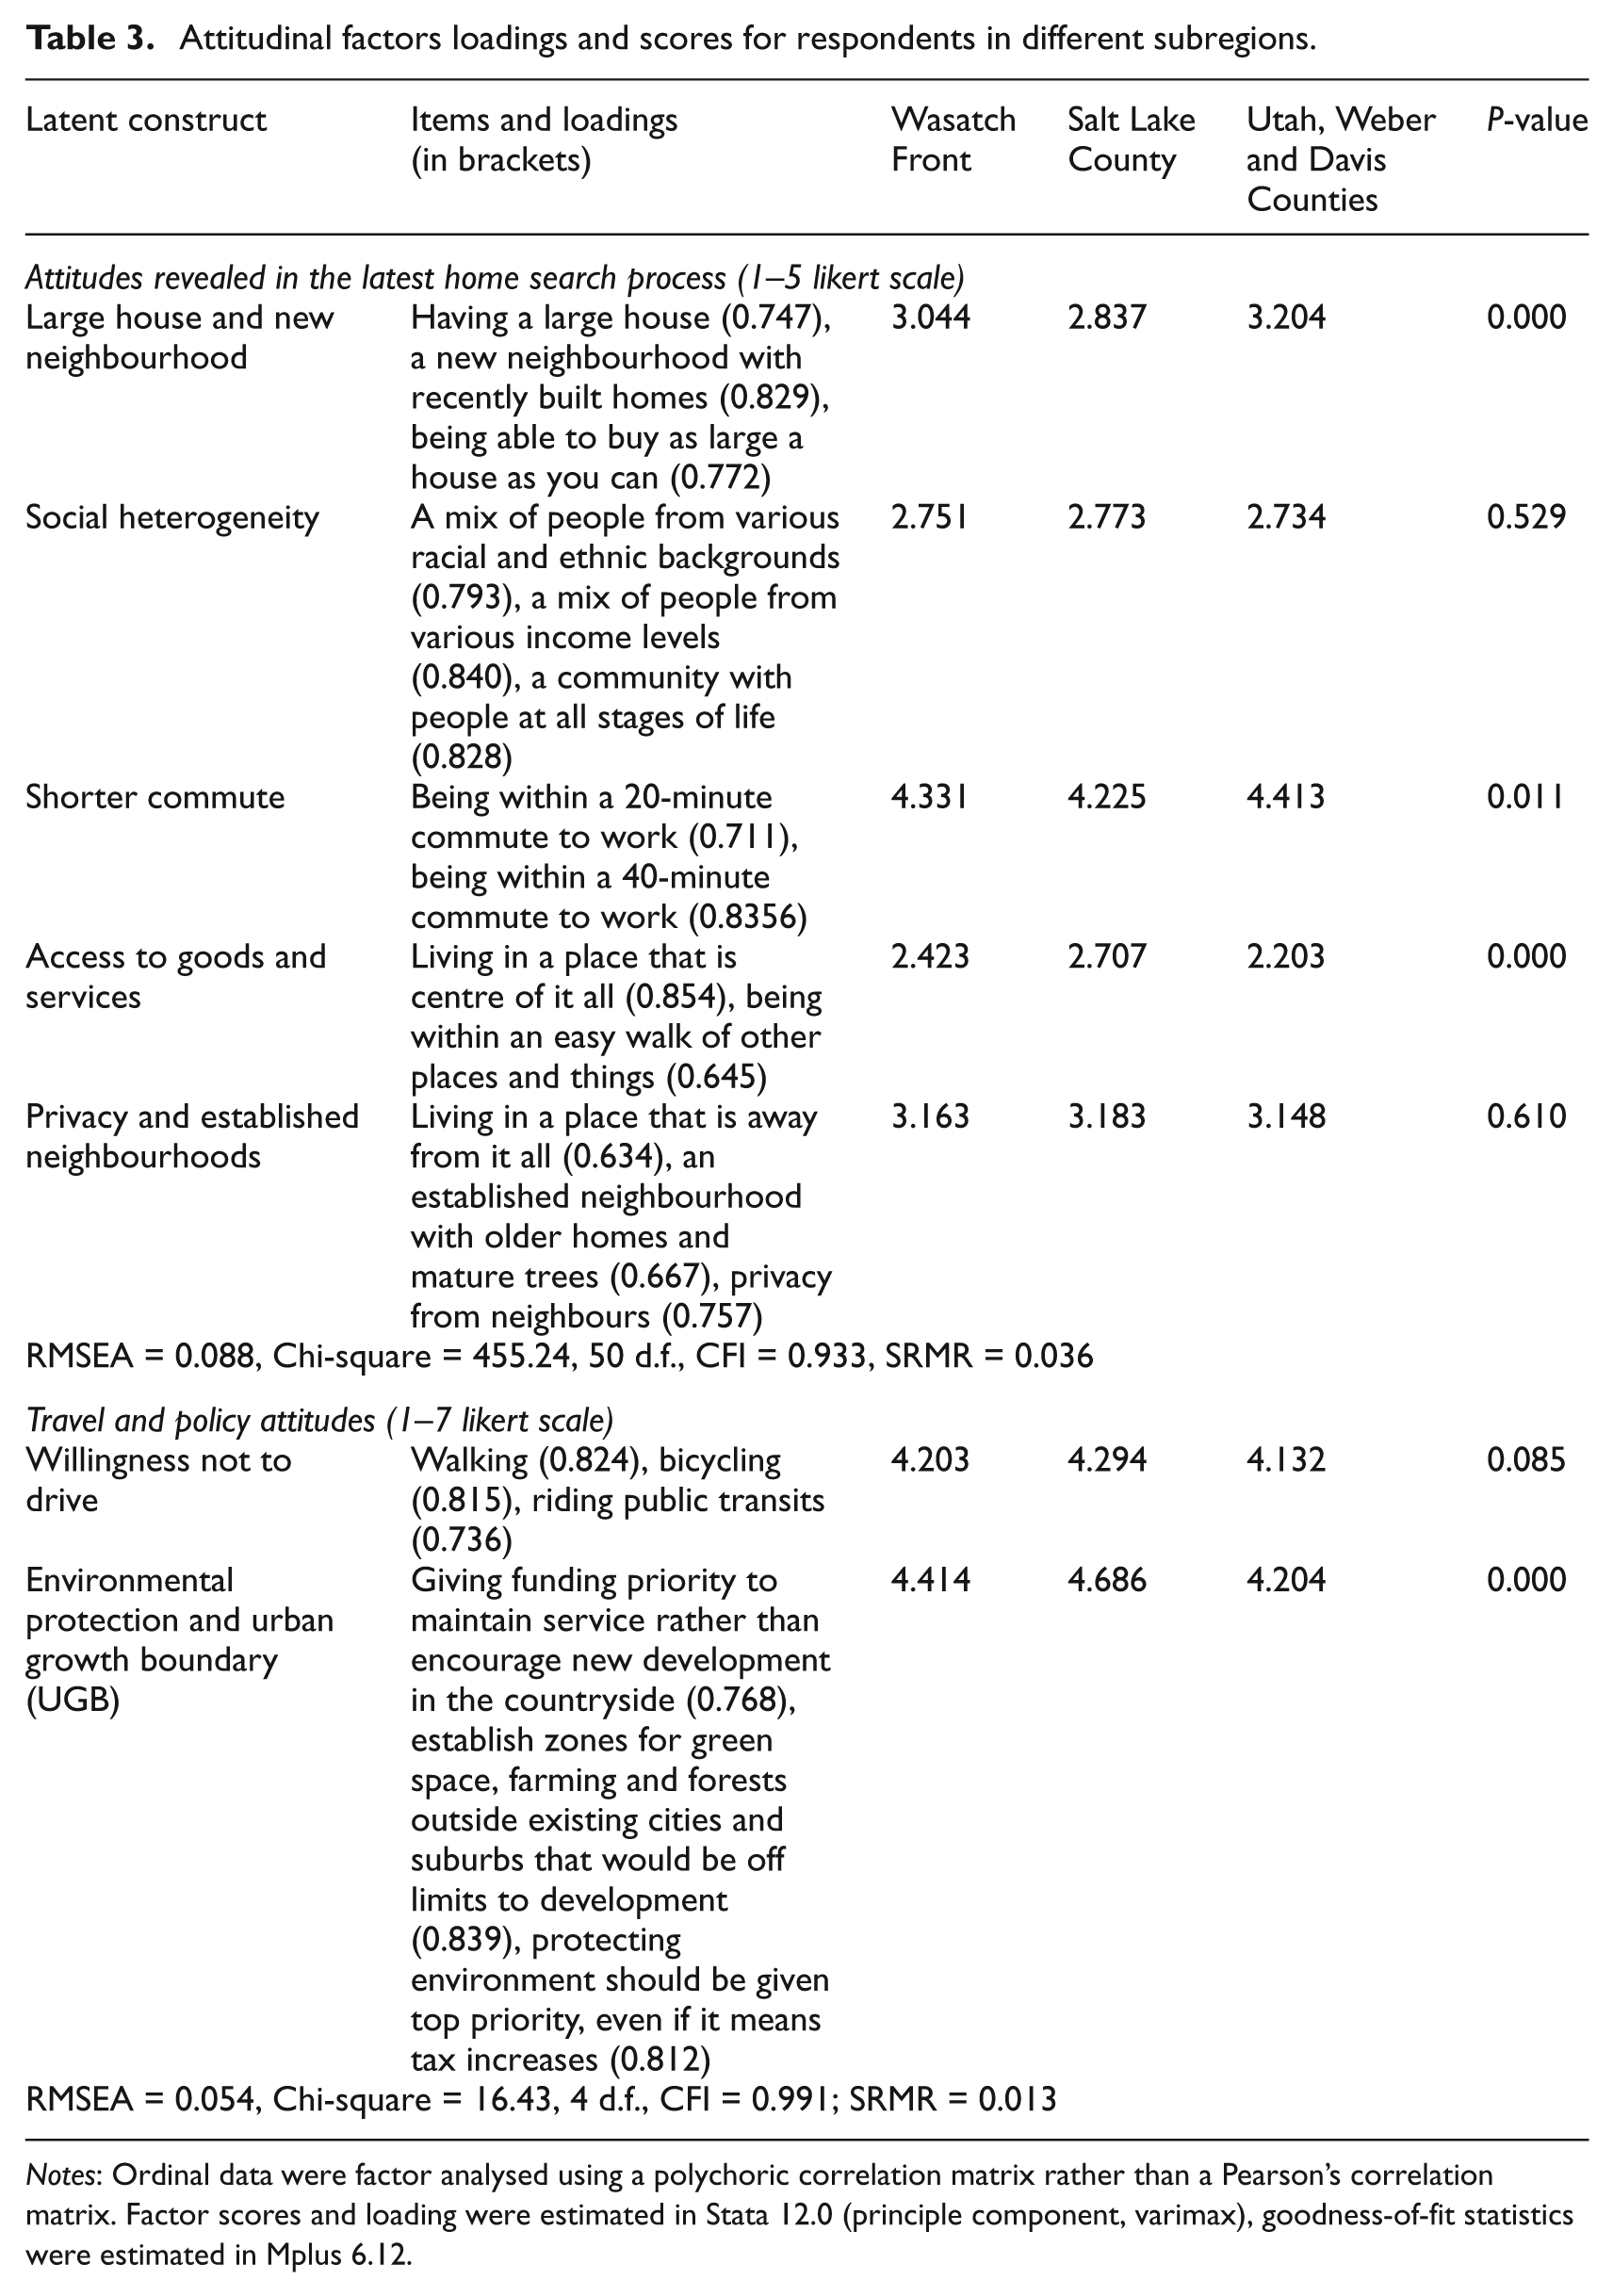
Notes: Ordinal data were factor analysed using a polychoric correlation matrix rather than a Pearson’s correlation matrix. Factor scores and loading were estimated in Stata 12.0 (principle component, varimax), goodness-of-fit statistics were estimated in Mplus 6.12.
Results of binomial logit and latent class models
Results for the binomial logit model (BNL) and the LCA model are reported in Table 4. The results of the BNL models can be interpreted as baseline findings before incorporating preference heterogeneities into the specification. Since the factor levels of each variable are coded using dummy variables, coefficients are directly comparable and a positive coefficient value indicates that the attribute level, in comparison with the reference, has a positive impact on the utility, while negative coefficients suggest negative effects (Rid and Profeta, 2011: 31–32). For example, a neighbourhood alternative is more likely to be selected as price decreases and lot size increases.
Estimation results of the binomial logit models (BNL) and the two-class LCA model.

Notes: The discrete choice models were estimated using NLogit 4.0; the determination of the number of classes was based on fit measures of normalised AIC and BIC (Greene, 2007; Rid and Profeta, 2011; Walker and Li, 2007). The two-class solution had a lower value of BIC in models at both region and subregion levels, and therefore was selected for the rest of the analysis.
As shown in Table 4, the coefficients have the expected positive or negative signs, and most are highly significant. The estimated coefficients for living in neighbourhoods closer to work and other destinations are approximately two times higher than the coefficients for living close to public transit. Although these variables are all related to access and convenience, it suggests a relatively minor role of public transit accessibility in people’s residential choices. The coefficients for housing types also indicate that people generally consider single-family housing to be more important than living close to public transit. Moreover, parking availability and street design in the neighbourhood have a strong impact on people’s residential location choices. Individuals strongly prefer housing with dedicated parking, but at the same time, they also favour pedestrian-friendly street designs. Notably, the model indicates a trade-off between price and all attributes related to a compact development given the negative coefficient of the price variable. This is consistent with microeconomic theory, indicating that affordability is a key factor in determining the total utility of residential alternatives.
The results of the subregion models confirm the presence of regional differences in, and therefore environmental influence on, residential location preferences. Respondents in Salt Lake County are more sensitive to accessibility attributes and less sensitive to housing types and parking. They are also more supportive of pedestrian-friendly designs while being less constrained by the cost of different alternatives.
In the rightmost column of Table 4, we present results from the LCA models. Normalised BIC (Bayesian Information Criterion) statistics identify superiority of the two-class LCA model over multiple-class LCA’s as well as BNL specifications (Rid and Profeta, 2011; Walker and Li, 2007).
Taking a closer look at the differences between classes, we see that class 2 respondents are more sensitive to accessibility, and lean toward transit and pedestrian-friendly environments. At the same time, this class is less sensitive to housing types and parking availability. The coefficients for single-family housing are negative, indicating that respondents in this group prefer mixed-housing types with smaller lot sizes in their neighbourhoods. In particular, class 2 accounts for 43.3% of the respondents. This finding highlights that in such an automobile-dependent environment, the latent demand for compact and transit-oriented development should be recognised.
We further incorporate those socio-demographic and attitudinal covariates that influence the class membership probabilities (Table 5). Results are shown for three models consisting of (a) a LCA model focusing on basic socio-demographic factors, (b) two LCA models with both socio-demographic variables and attitudes toward social and natural environments in neighbourhoods, and (c) personal travel mode preferences and opinions toward UGB and environmental protection policies. To conserve space, we only report results of socio-demographic and attitudinal covariates that influence the class membership probabilities. The coefficients are interpreted as effects on membership in class 1 (Table 5).
Estimation results of SES and attitudinal factors as segment covariates in the two-class LCA models.
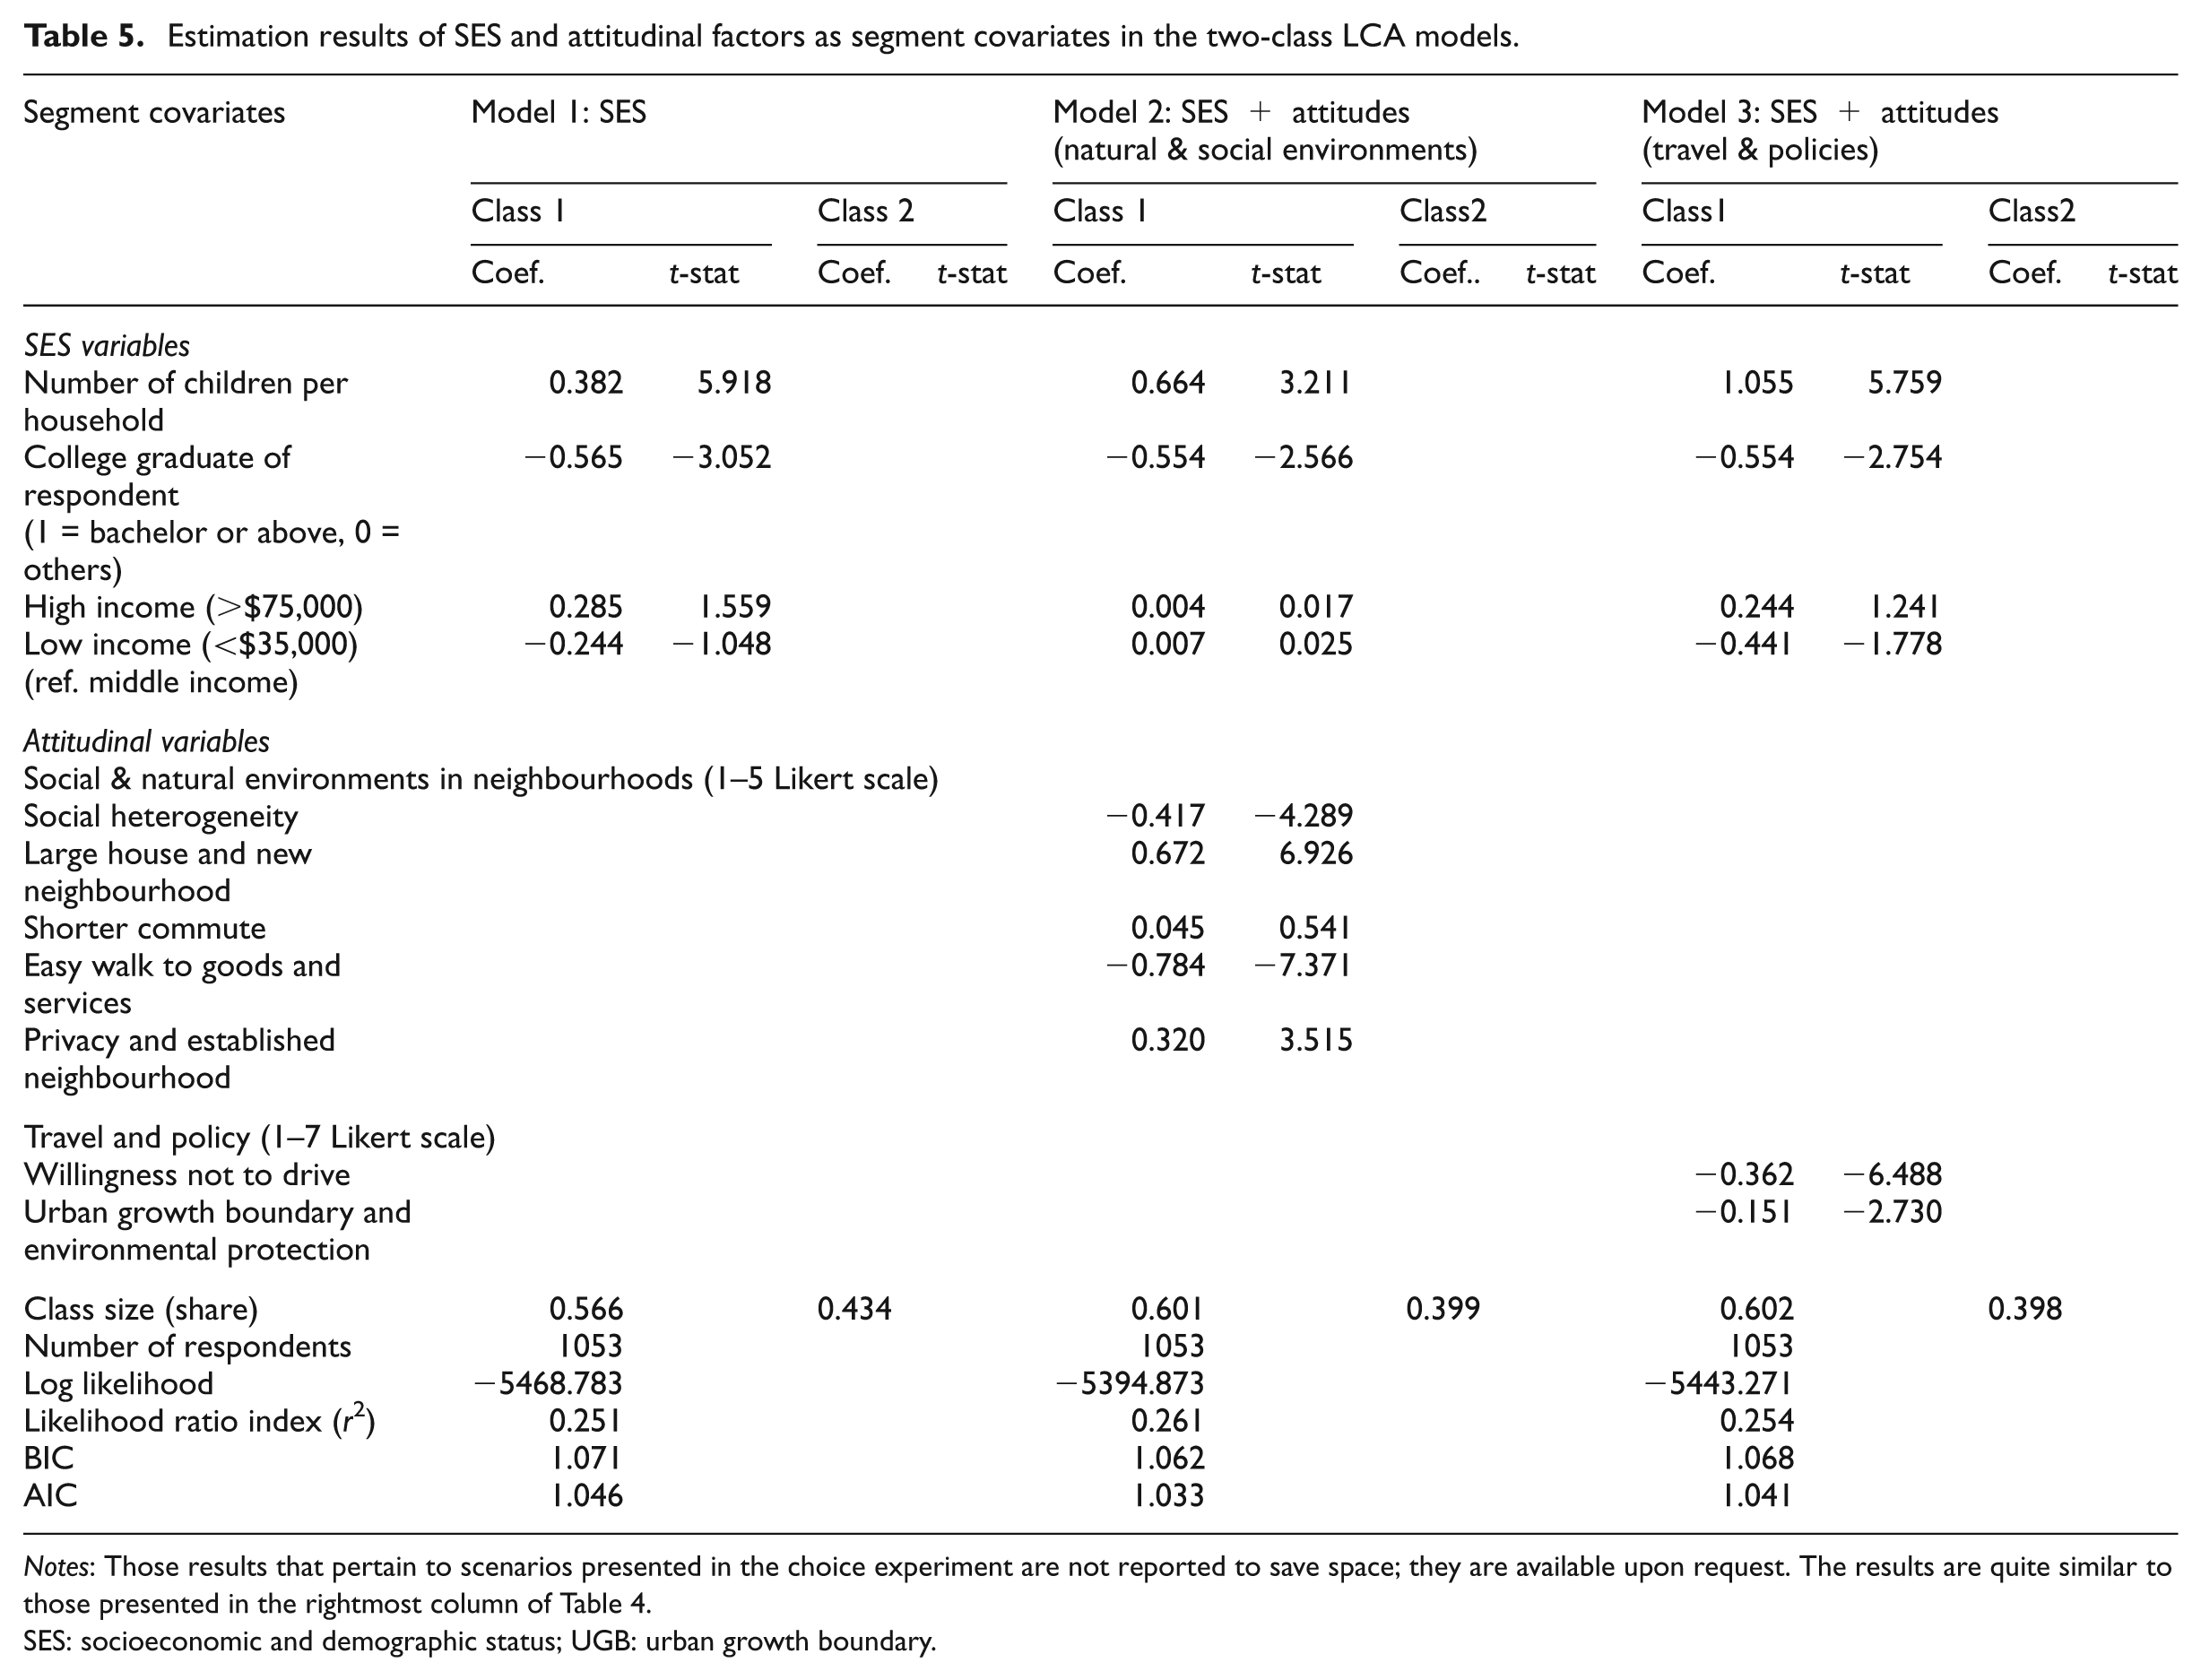
Notes: Those results that pertain to scenarios presented in the choice experiment are not reported to save space; they are available upon request. The results are quite similar to those presented in the rightmost column of Table 4.
SES: socioeconomic and demographic status; UGB: urban growth boundary.
We observe that household socio-demographic characteristics and attitudes are simultaneously associated with preference heterogeneity. Households in class 1 are characterised by families with more children younger than 18 years of age. Class 2 contains more degree holders but at the same time more low-income respondents. Furthermore, attitudinal factors proved to be significant determinants of residential preference heterogeneity while controlling for basic socio-demographic variables (Table 5). Specifically, households who are less desirous of privacy and those who appreciate social heterogeneity in their neighbourhoods are more likely to select compact, walkable and transit-oriented neighbourhoods. Interestingly, attitudes toward commute time are not a strong determinant of class membership but travel mode attitudes are. People who prefer walking, biking and taking transit and respondents with supportive opinions toward UGB and environment protection policies tend to lean toward compact development. Nevertheless, in comparison with policy attitudes, personal travel mode preferences, given the values of coefficients, have a much stronger impact on these tastes. Therefore, concerns about the association between public acceptance of compact development as a policy issue and housing choices toward living in this type of neighbourhood are warranted (Yang and O’Neill, 2013).
Willingness to pay and heterogeneous preferences of renters and owners
A benefit of DCE is the possibility of estimating respondents’ willingness to pay (WTP) for different housing and neighbourhood attributes. In the context of latent class analysis, WTP estimates are individual specific (Greene, 2007) and were computed using the following equation:

Table 6 presents the results of WTP estimates based on the coefficient estimates of the two-class LCA models and median prices are reported. These numbers can be interpreted as the trade-offs between each factor level and the reference group, and they are also comparable across different attributes.
Willingness to pay (median price, defined by the two-class LCA model).
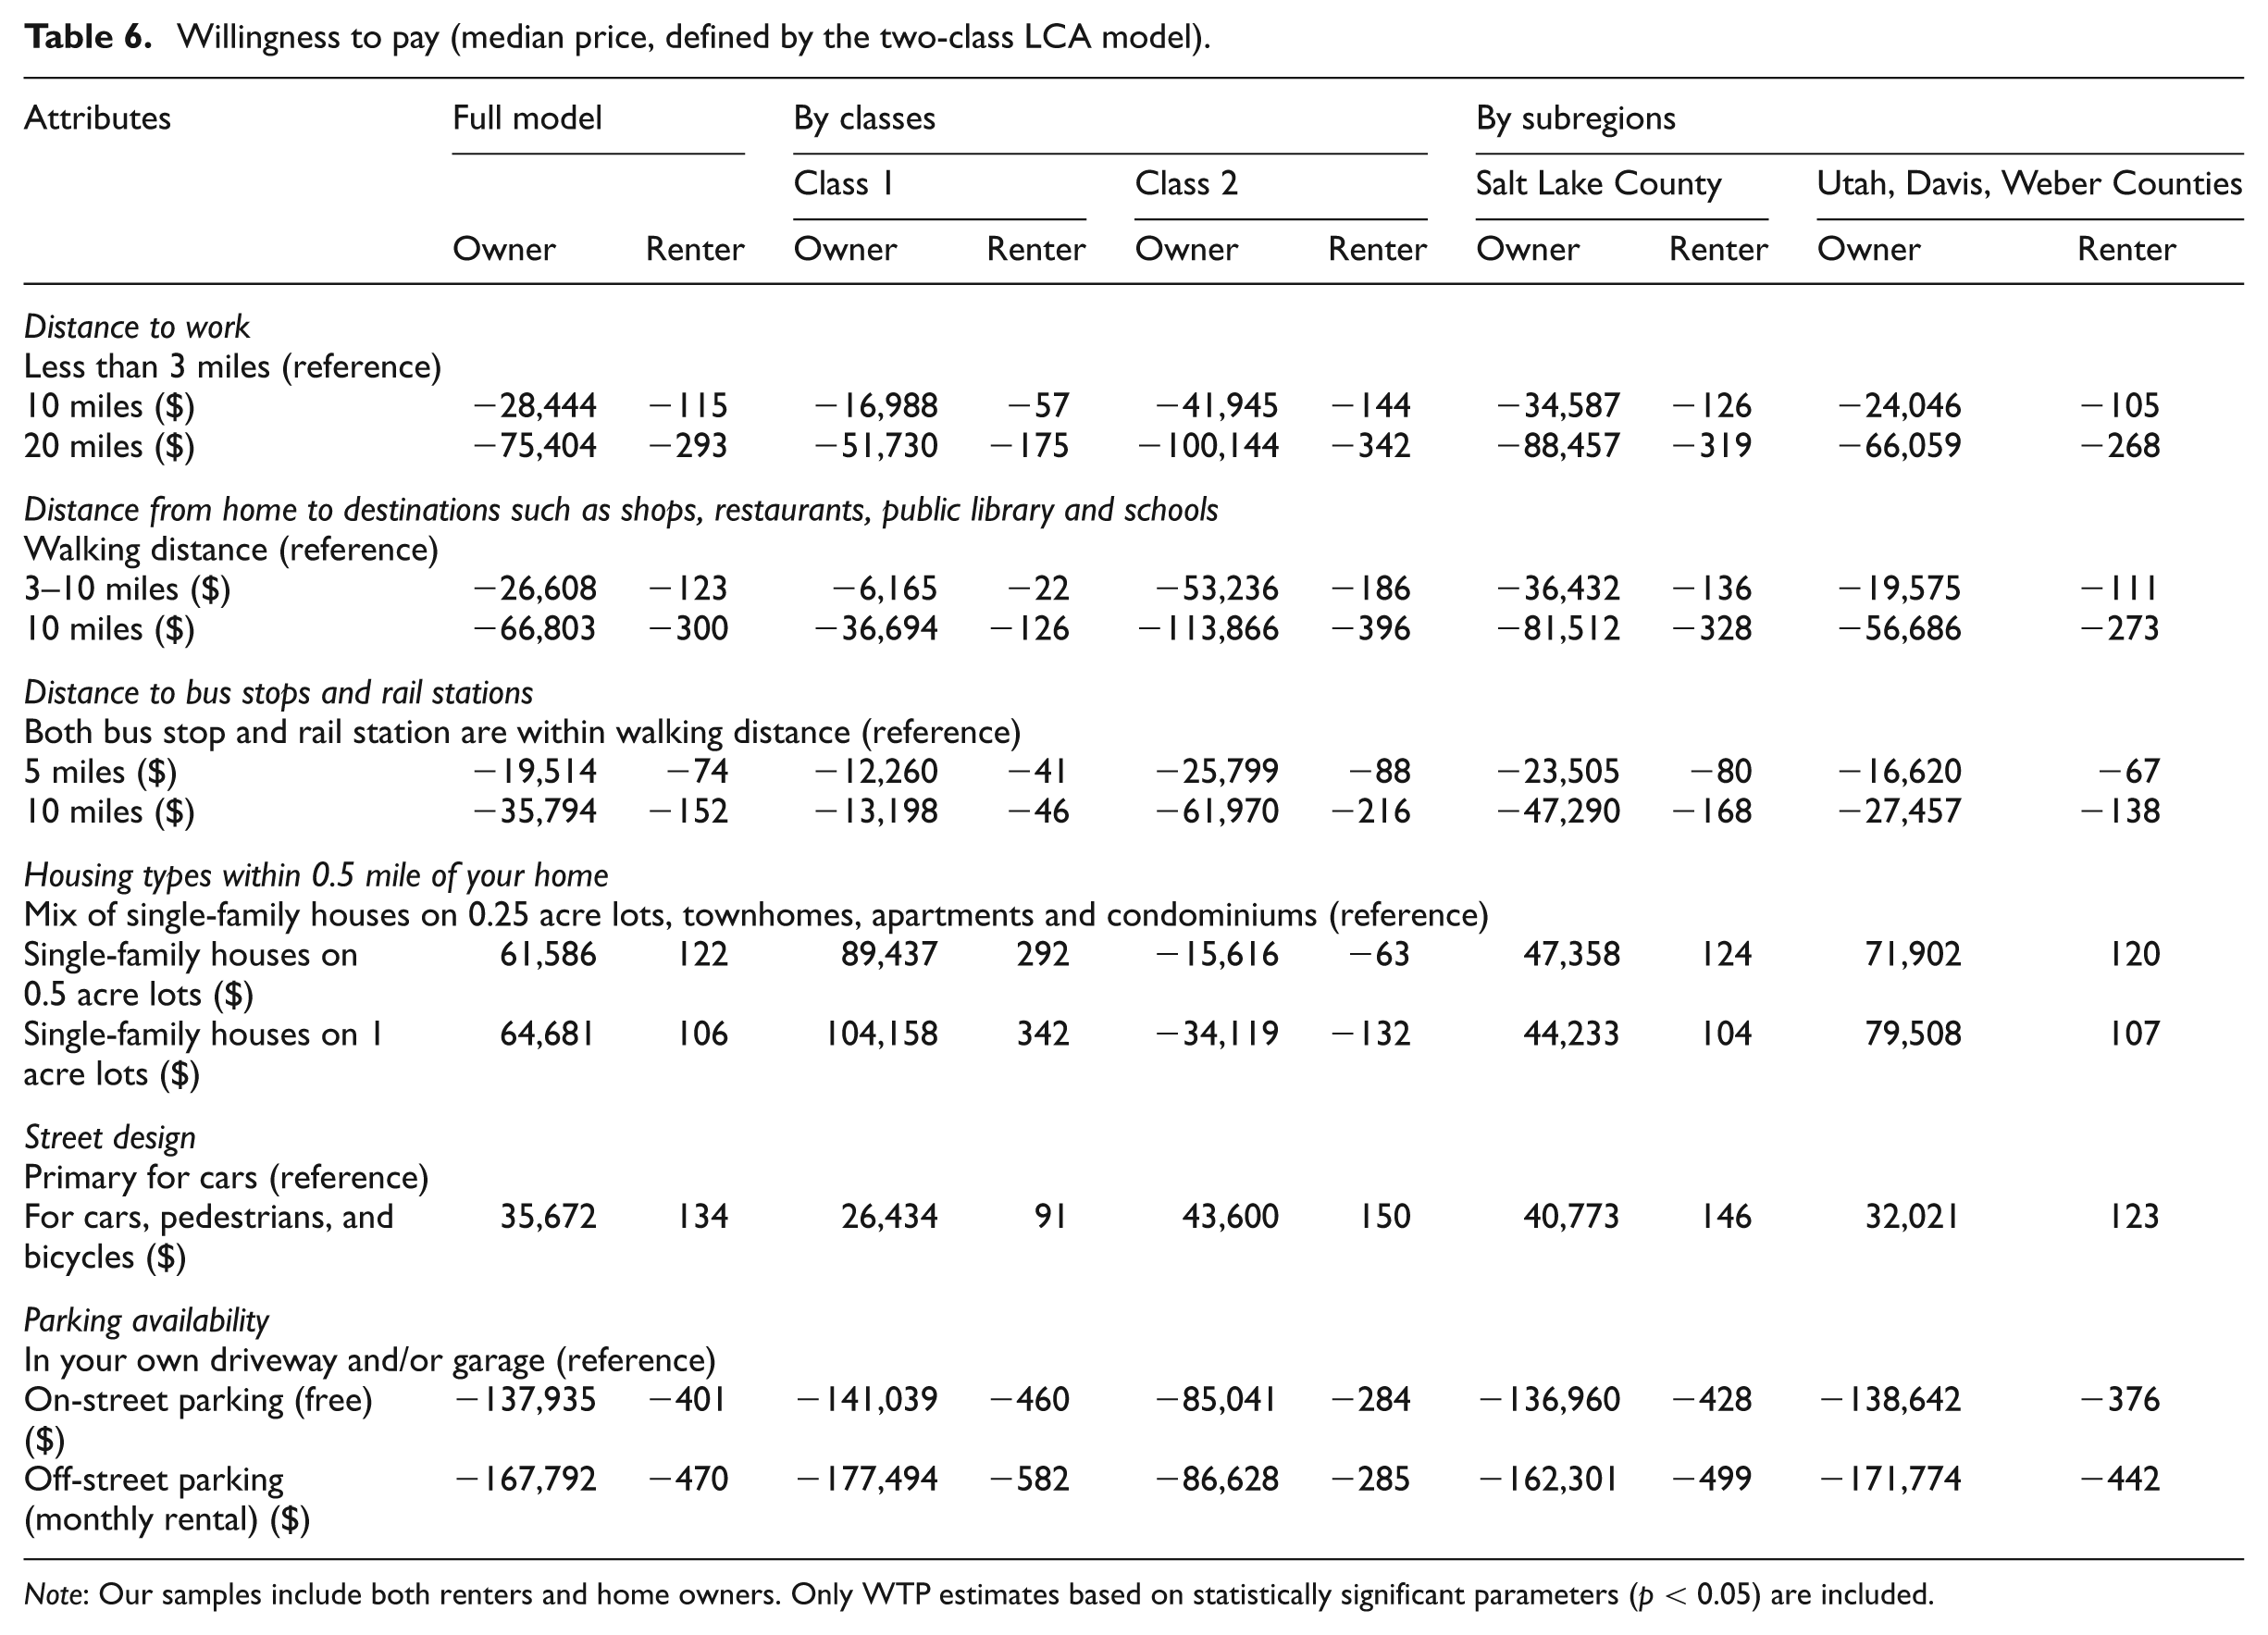
Note: Our samples include both renters and home owners. Only WTP estimates based on statistically significant parameters (p < 0.05) are included.
As shown in Table 6, in comparison with home owners, renters are more willing to trade space for access to public transit, jobs and urban facilities, as well as pedestrian-friendly street designs. For example, the model of total samples shows that renters are willing to pay $134 for living in a pedestrian-friendly environment, while they are only willing to add $106 to their current monthly rent to live in neighbourhoods dominated by larger-size single-family detached houses. By contrast, home owners’ WTPs for pedestrian-friendly designs are only about half of their WTPs for moving from mixed-housing type neighbourhoods to neighbourhoods where housing type is mainly single-family housing. This finding reiterates the heterogeneous preferences for different aspects of compact development in different subgroups of the population. In addition, substantial differences mark the heterogeneous valuations of development characteristics across latent classes and subregions.
Residential locations and profile of the classes
Using kernel density estimates (KDE), we further visualised the distinctive spatial patterns of residential locations of the two classes derived from the LCA models. As shown in Figure 3, class 2 exhibits a higher intensity of concentration in space, with one large-size hotspot in downtown Salt Lake City. Other hotspots include those residential areas close to downtown Provo and, to a lesser extent, the new residential district close to Daybreak, a new suburban transit-oriented development (TOD) in Salt Lake County. By contrast, the spatial distribution of class 1 is characterised by a pattern of spatial dispersion, and their locations are less sensitive to commuter rail, light rail and bus routes. These results provide visual evidence that self-selection matters; residents favouring compact, walkable and transit-friendly neighbourhoods are more clustered in locations that supply such qualities.
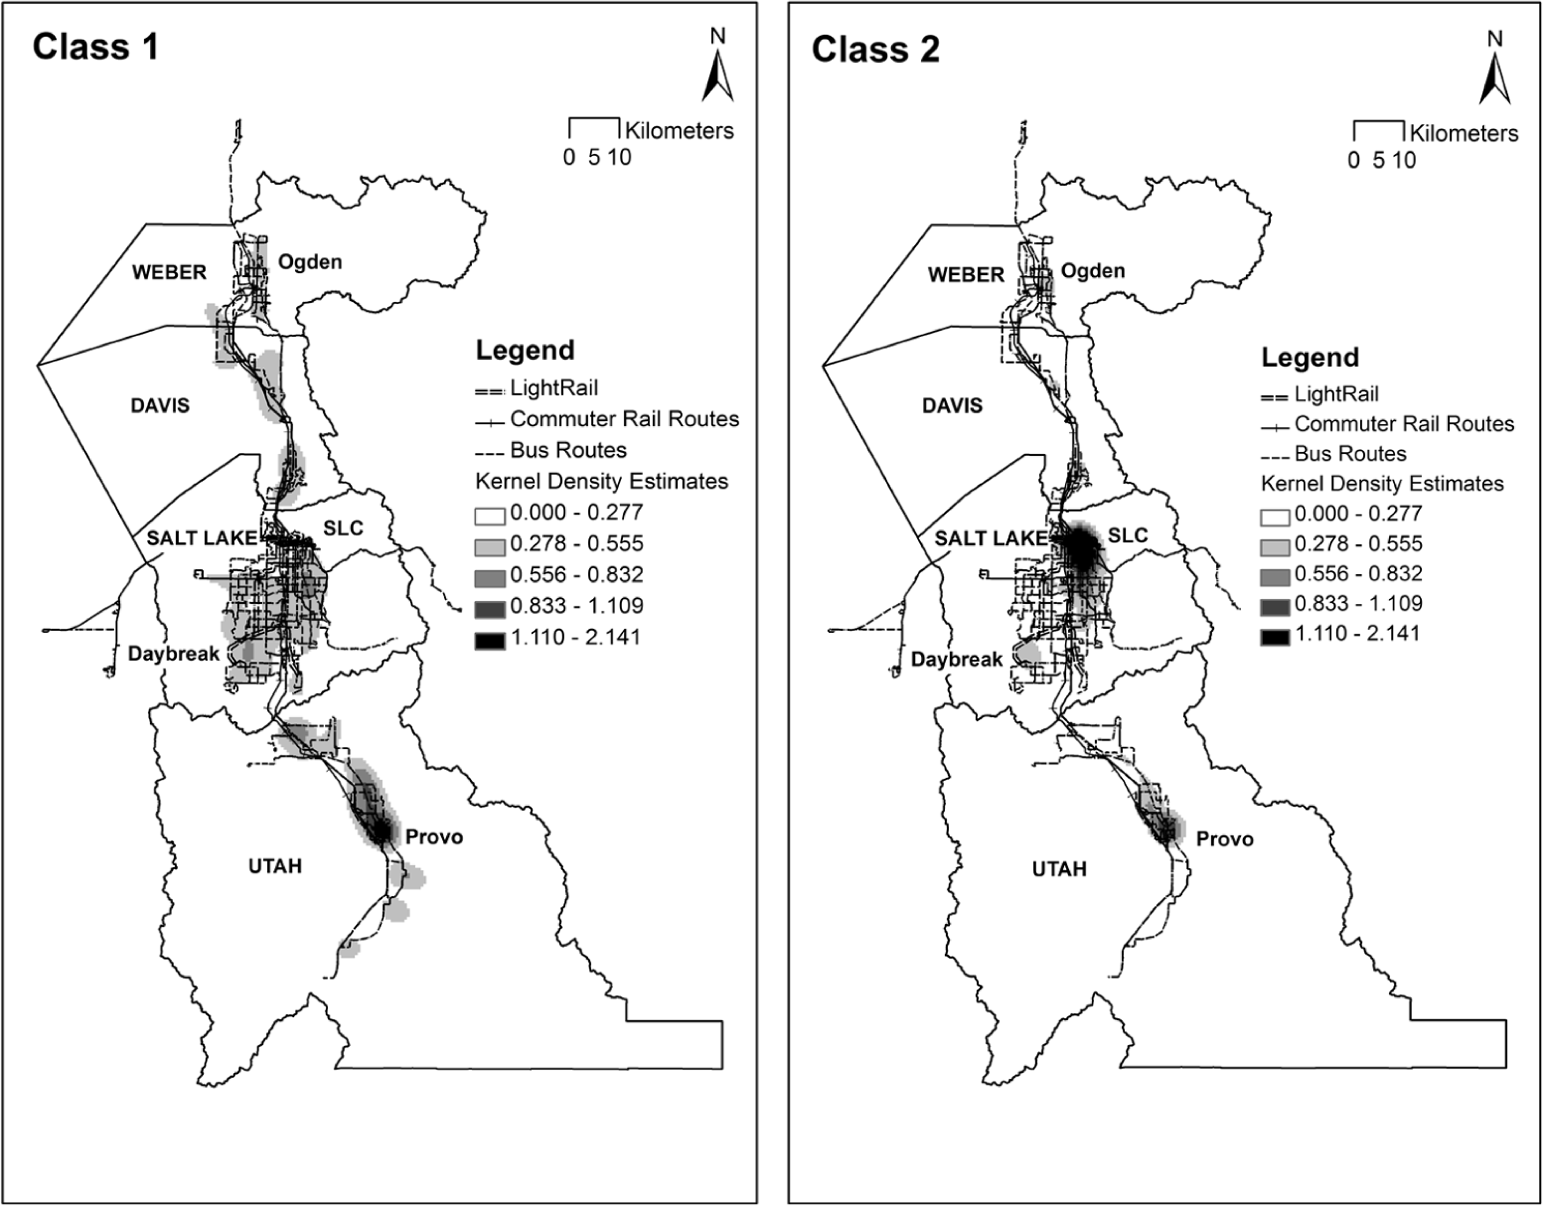
Weighted kernel density estimates of the locations of the classes.
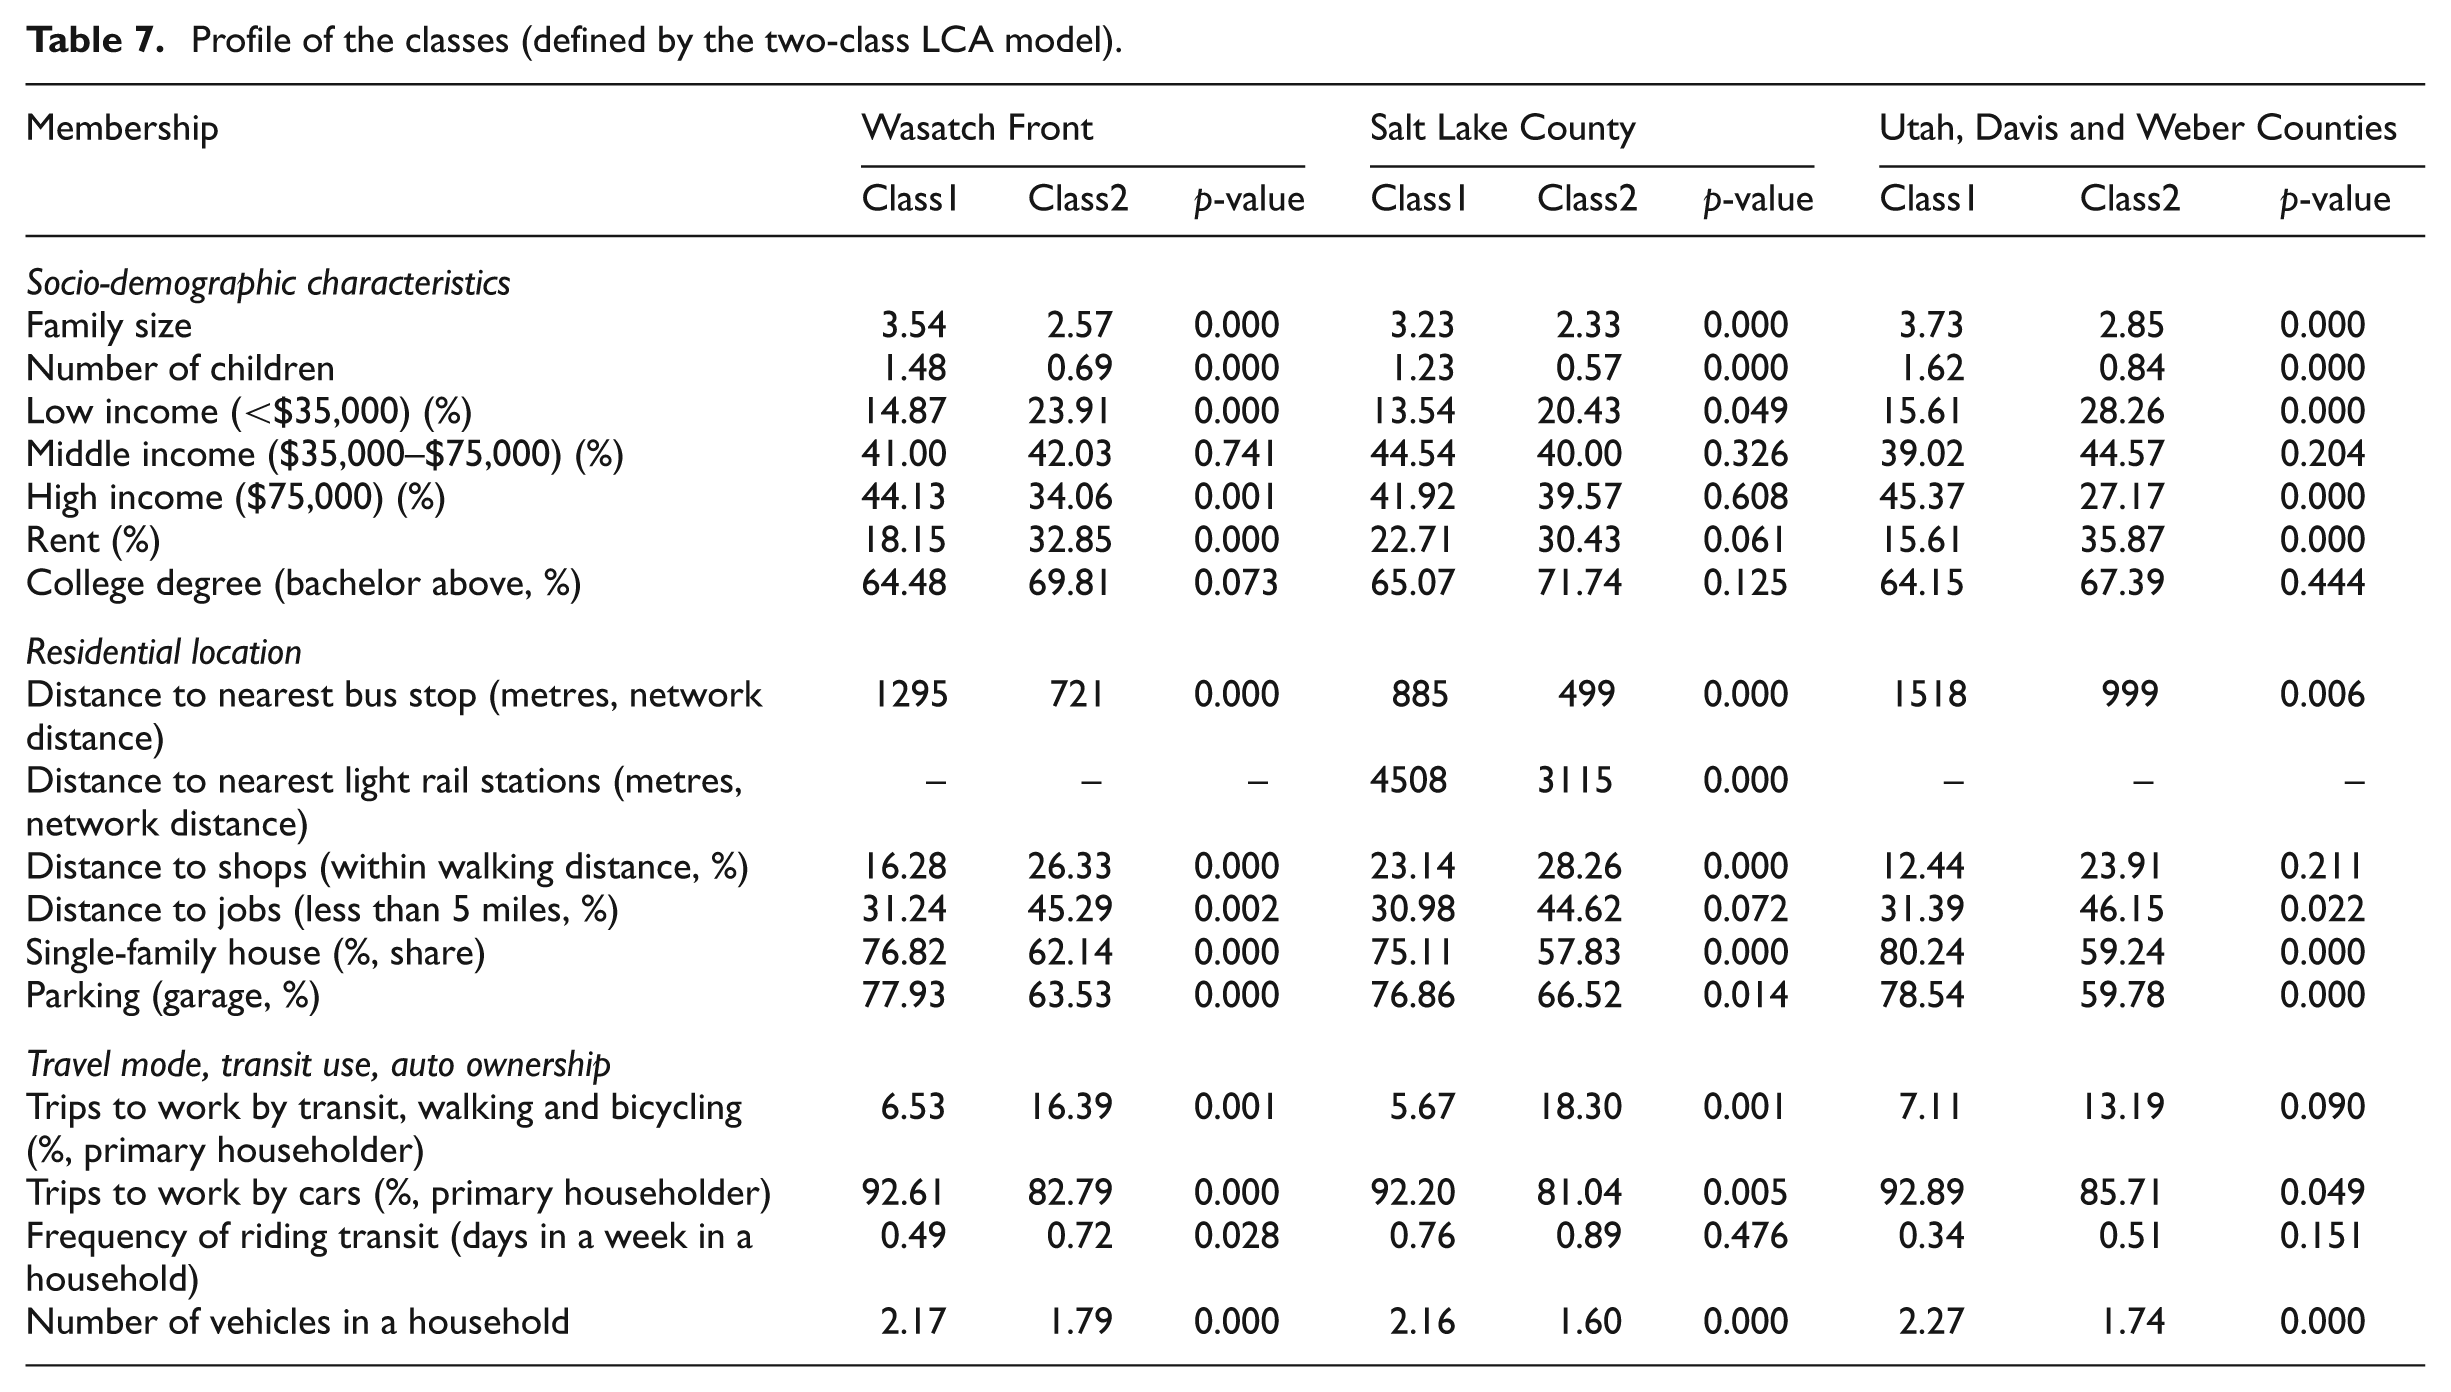
Table 7 contains a description of the classified respondents. As expected, class 2 contains more low-income respondents and renters, and respondents in this class are more likely to be from smaller-size families without children. With respect to actual residential locations, 76.8% of the respondents in class 1 are living in single-family houses, while the number in class 2 is only 62.1%. Class 2 respondents are located closer to public transit, commercial districts and jobs. The two classes also exhibit diverse travel patterns. Class 1 consistently has higher auto ownership and lower frequency of using public transit, and they are less willing to give up auto-oriented travel choices (Table 7). When analysing the characteristics of the two classes by subregions, the two classes still report significantly different behaviour patterns and confirms that the effect of self-selection on behaviour requires more attention. However, even though the self-selection effect is real, we also find that the impact of built environment on residential location choices and travel behaviour must not be underestimated (Levine et al., 2005). For instance, the distance to a bus stop in Salt Lake County for Class 2 proponents of compact and transit-oriented living is only half of that in the other three counties, while the frequency of using transit in a week is nearly twice that of the rest of the region. Therefore, it is possible that Class 2 respondents outside of Salt Lake County simply have no choice but to adopt auto-oriented residential choices and travel patterns, despite their latent preferences for public transit and compact development.
Profile of the classes (defined by the two-class LCA model).
Conclusions
This study has applied a discrete choice experiment in conjunction with a latent class analysis to explore residential preferences for compact development along the Wasatch Front in the state of Utah. LCA models accommodating preference heterogeneity in residential choice behaviour investigate the potential demand for compact development. The results suggest that in such an automobile-dependent environment, approximately 40% of the respondents strongly prefer compact, walkable and transit-friendly neighbourhoods, and these tastes vary across different subgroups in the population.
Incorporating socio-demographic characteristics and attitudes in the segmentation function also provides an alternative and ‘one-step’ approach to investigating the ‘sources’ of these heterogeneous preferences. In general, the parameter estimates of socio-demographic variables are consistent with the literature on compact development in the USA (Bina et al., 2006; Cao, 2008; Ewing et al., 2008; Lewis and Baldassare, 2010), and the preferences for conventional suburban neighbourhoods with relatively low accessibility mainly occur among bigger families with school-aged children, high-income households and homeowners. In addition, latent constructs add weight to the value of accounting for attitudinal factors in modelling residential preference. We find that residential preferences for compact and transit-oriented developments are strongly associated with personal preferences for walking and biking, and, to a lesser extent, supportive opinions toward environment protection and urban growth boundary policies. These tastes are also positively associated with attitudes toward social heterogeneity in neighbourhoods, while they are negatively correlated with desire for privacy (Table 5). Therefore, considering different types of attitudes enriches our understanding of the complexity of residential preferences for compact development.
Comparing preferences with actual travel behaviour and residential locations in different subregions yields deeper insights about the complex relationships between the built environment, preference heterogeneity, and actual residential and travel choices. First, given that the two classes demonstrate divergent travel behaviour and location patterns, there is strong evidence to suggest that preferences play a role in simultaneously selecting neighbourhood type and travel modes. Thus, concerns in the travel behaviour literature over self-selection are warranted. Second, it should be noted that the cross-sectional analysis in this study can hardly verify the causal relationship between the built environment and behaviour, which requires a more strictly designed longitudinal approach (e.g. Brown and Werner, 2009; Cao et al., 2009). Nevertheless, we observe that the self-selection effect and impact of environmental factors are essentially confounding (Ewing and Cervero, 2010). Specifically, for Class 2 residents outside Salt Lake County, where compact development is more undersupplied, actual residential and travel choices have been strongly constrained by the automobile-dependent environment in spite of hidden preferences for transit-oriented living.
Furthermore, since Class 2 proponents of compact development are more likely from low-income and renter-occupied households, they are also more sensitive to price and have higher residential mobility rates (Lee and Waddell, 2010). Such findings are of particular relevance for transport and urban planning in the USA, where the share of renter-occupied households has kept increasing in recent years. It is suggested that transit-oriented and compact developments should be designed to accommodate lower-income residents through reduced prices or mixing rentals with for-sale units. In addition, since Utah has the biggest families and highest birth rates in the country (Salt Lake Tribune, 2013), particularly relevant for policy-making in this context is the finding that Class 1 proponents of low-accessibility and single-family-house neighbourhoods are more likely from households with more children. In other words, promoting compact development in Utah can be more challenging than the rest of the USA, even though stated support is strong in general.
Lastly, this study points to a number of interesting topics for future research. First, LCA models with segment covariates have limited ability to tackle the endogenous nature of specific links between socio-demographic status, attitudes and residential location preferences. For example, although attitudes can be shown to correlate with residential location preferences, since preferences themselves are endogenously determined, the LCA model cannot test for causality; there may be intervening factors that are at play. Structural equation models would be a better method to further gauge these endogenous linkages between socio-demographics, attitudes and residential preferences. Second, translating preferences into one’s actual residential locations and travel behaviour is highly conditioned upon environmental factors (Coogan et al., 2012; De Vos et al., 2012; Levine and Frank, 2007). Our preliminary results indicate that more detailed longitudinal research on the path from preference to behaviour while considering intervening environmental factors is promising.
Footnotes
Appendix
Acknowledgements
The authors would like to acknowledge the valuable comments from the anonymous reviewers and the Wasatch Front Regional Council for their assistance with data delivery.
Funding
Haifeng (Felix), LIAO would like to acknowledge partial support from the National Cancer Institute at the National Institutes of Health under grant number CA157509. Steven Farber would like to acknowledge partial support from the National Science Foundation (NSF) under grant no. BCS-1339462 and the National Institute for Transportation and Communities (NITC) under grant no. DTRT12-G-UTC15-540.