



Abstract
Current research depicts suburbs as becoming more heterogeneous in terms of socio-economic status. Providing a novel analysis, this paper engages with that research by operationalising suburban ways of living (homeownership, single-family dwelling occupancy and automobile use) and relating them to the geography of income across 26 Canadian metropolitan areas. We find that suburban ways of living exist in new areas and remain associated with higher incomes even as older suburbs, as places, have become more diverse. In the largest cities the relationship between income and suburban ways of living is weaker due to the growth of condominiums in downtowns that allow higher income earners to live urban lifestyles. Homeownership is overwhelmingly more important than other variables in explaining the geography of income across 26 metropolitan areas.
Introduction
Economic and social restructuring and changes in governance since WWII have generated renewed interest in the intra-metropolitan geography of income. Previous studies have made headway in demonstrating the spread of higher income earners into the inner cities and lower income earners into the suburbs both in the US and Canada (e.g. Hackworth, 2007; Ley and Lynch, 2012; Madden, 2003). In these studies suburbs are generally defined as specific places. In this paper, we focus on a complementary concept: suburban ways of living, or suburbanisms, which are often understood to be a qualitative experience of place. We define these following Walks’ (2013) re-theorisation of Henri Lefebvre’s understanding of urbanism, whereby Walks defines suburbanisms along several dimensions that can exist in both urban and suburban places. Suburbanisation is by extension understood as the process of spreading suburban ways of living to new geographic areas. Recent research emphasises the plurality of neighbourhoods overlooked in place-based definitions of suburbs and explains the utility of examining suburbanisms as ways of living (Mace, 2013; Murphy, 2007; Walks, 2013) – however, there are as of yet no explicit quantitative studies of the ways suburban ways of living intersect with other dimensions of the intra-metropolitan social geography.
This paper is therefore primarily an empirical analysis of how suburban ways of living relate to the intra-metropolitan geography of income. We use single-family dwelling occupancy, homeownership and automobile commuting as indicators of suburban ways of living, to create neighbourhood types based on the ‘degree’ of suburbanism. We then use a linear regression analysis to test how these neighbourhood types relate to household and individual income as separate dependent variables. We use beta coefficients to test the strength of the relationship between income and our neighbourhood types. In this study, we follow Wyly’s (2009) call to use numbers as indicators or measures of the broad and multifaceted relationships between socio-economic change and social geographies (see also Carter, 2009). Our research is informed by and expands the critical urban research that considers the changing social geography of cities (Hiebert, 2012; Simmons and Bourne, 2013; Walks, 2011).
While we use the Canadian urban system as our case study, uniquely comparing 26 metropolitan areas, the contributions of the paper also have relevance beyond the Canadian case. First, the paper defines and operationalises suburban ways of living for quantitative analysis and can comment on the utility of this approach. Second, in comparing 26 metropolitan areas, the paper provides insight on how the geographies of income relate to suburban ways of living across an entire national metropolitan system. Third, our method provides a novel approach to studying metropolitan change in that it focuses on ways of living versus place as the unit of analysis, which can inform future studies regardless of national context.
We first review in more detail what we already know about the changing geography of income and the Canadian metropolitan system, and provide a definition of suburban ways of living. We then turn to an explanation of the income measures used in the analysis. The findings consider the degree of suburbanisation across the metropolitan system and the links between suburbanisms and income. While previous research shows that suburbs as places are in some cases experiencing decline (Madden, 2003), this paper illustrates that suburban ways of living are still associated with higher incomes in part because these ways of living are not exclusive to suburbs as places. Another important finding is that homeownership is most evidently associated with higher income areas, as compared to other aspects of suburbanism – not unexpected given that homeownership requires higher earnings than renting. However, our analysis provides a tangible geographic link between homeownership and income across an entire urban system. From this analysis we can infer that policies that promote homeownership would almost necessarily lead to the displacement of low-income earners.
Evolving intra-metropolitan geographies of income
The empirical analysis in this paper focuses on the Canadian metropolitan system, uniquely comparing 26 census metropolitan areas (CMAs). The CMAs span coast-to-coast and differ in size from over 5.5 million (Toronto) to about 150,000 (Saguenay) (see Figure 1). The largest CMAs – Toronto, Montreal, Vancouver, Calgary, Ottawa and Edmonton – are where most growth is occurring, this growth driven in large part by immigration in Toronto, Montreal and Vancouver (Hiebert, 2012). These metropolitan areas have seen de-industrialisation of their inner cities beginning in the 1960s and 1970s, and growth of residential and recreational spaces in what is sometimes called the ‘post-industrial’ city (Bailey et al., 2012; Ley, 1996). However, it should be noted that manufacturing remains an important component of some of these CMAs such as Montreal and Toronto, and that Vancouver never had a large industrial sector to start (Shearmur et al., 2007). The list of CMAs considered also includes mid-sized cities (Quebec, Winnipeg, Hamilton, London, Kitchener, St. Catharines – Niagara, Halifax, Victoria). Many of these are provincial capitals (Quebec, Winnipeg, Halifax, Victoria) while others are clusters of particular economic sectors, such as high-tech in Kitchener. Hamilton, St. Catharines – Niagara, and to some extent London as well, were once manufacturing strongholds but experienced decline associated with de-industrialisation. The 26 CMAs also include several regional and smaller centres (Windsor, Oshawa, Saskatoon, Regina, Sherbrooke, St. John’s, Barrie, Kelowna, Abbotsford, Greater Sudbury, Kingston and Saguenay). Windsor and Oshawa are heavily dependent on the auto-industry and their labour force has been impacted by the offshoring of manufacturing. Barrie and Abbotsford are regional centres but they are connected by commuter flows to larger CMAs, Toronto and Vancouver respectively. Elsewhere, we have made detailed maps of the social geography of most of these CMAs publicly available (Moos and Kramer, 2012).
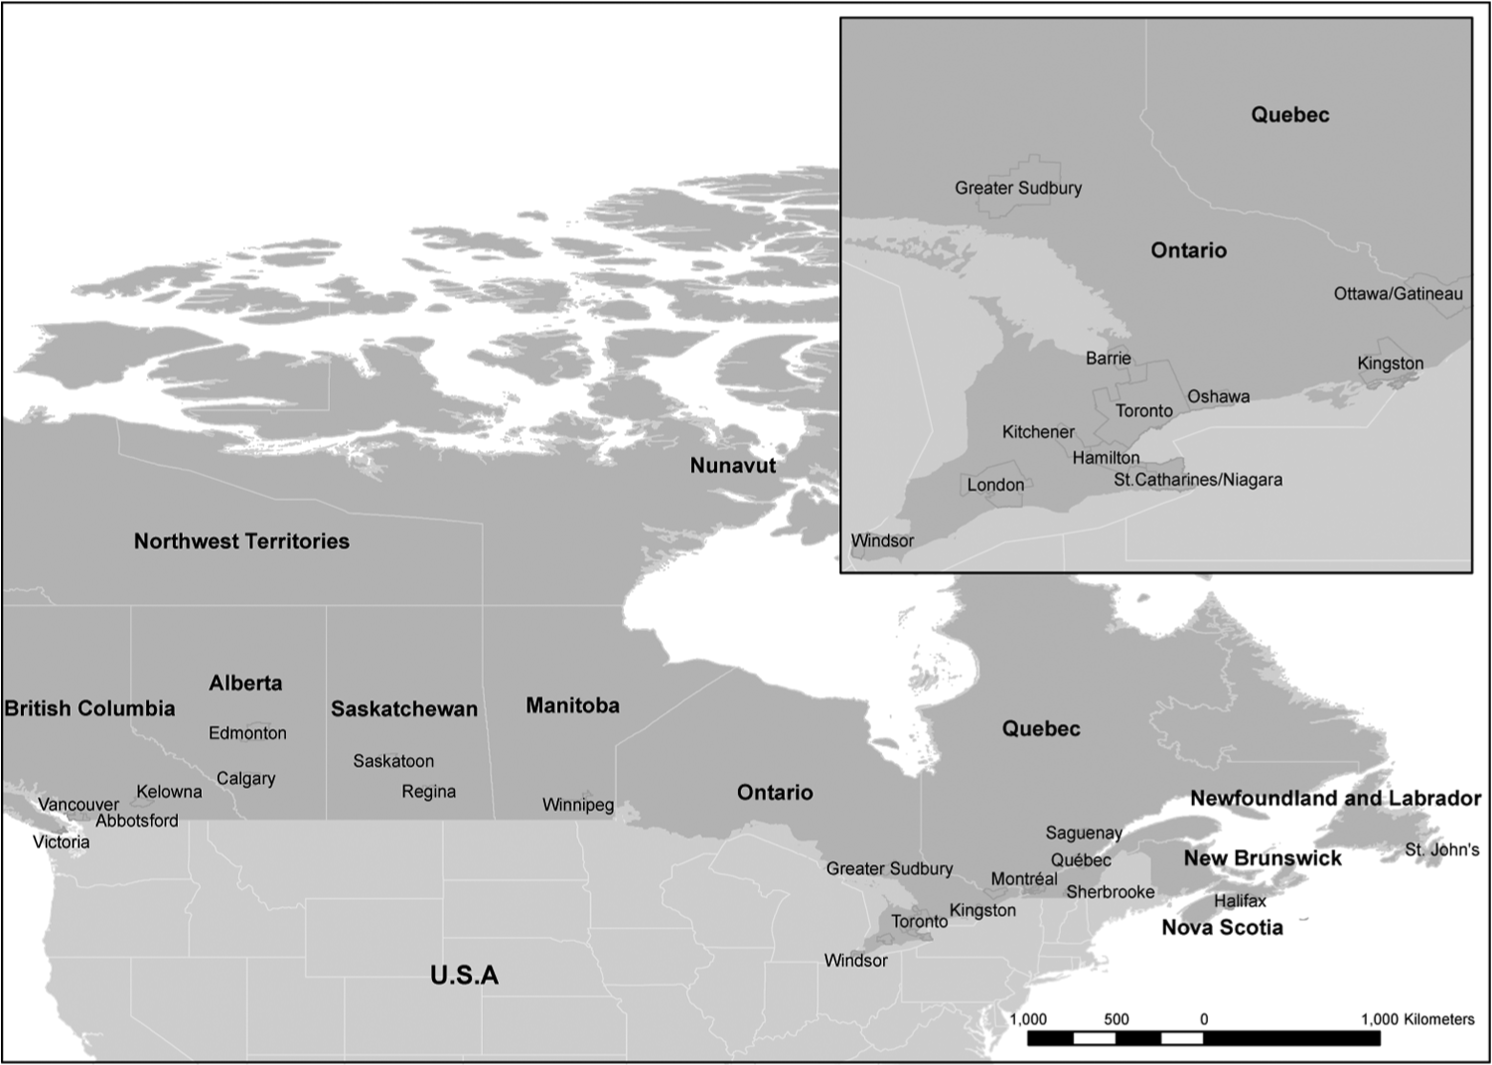
Canada's 26 largest Census Metropolitan Areas.
The geography of income has been investigated in previous studies in a Canadian context (Ley and Lynch, 2012; Walks, 2011), and also in the US (e.g. Hackworth, 2007; Madden, 2003). These studies are asking primarily how the geography of income has changed in metropolitan areas as a result of economic restructuring and demographic transitions occurring in the years following WWII. Some prior studies focus explicitly on gentrification (Ley, 1996; Meligrana and Skaburskis, 2005) while others deal with inequality and income structures more generally (e.g. Frenette et al., 2007). Most studies in both the US and Canadian literature consider only the largest metropolitan areas, although earlier work by Davies and Murdie (1991) considered all Canadian CMAs (see also Meligrana and Skaburskis, 2005), and more recent work by Hackworth (2007) studied several of the largest metropolitan areas in the US.
During industrialisation, suburbs in the US and Canada were viewed as home to the middle and upper classes. The geography of income during this time indeed had a clear urban–suburban dichotomy. The poor, working classes and new immigrants were downtown. Those who could afford it left for the suburbs (Harris, 2004). While there are examples of working-class suburbs (Gans, 1967; Nicolaides, 2006), the notion of suburbs being characterised by higher incomes than the inner city persisted in the years following WWII but things were beginning to change.
Some have argued that de-industrialisation, which saw the decline of manufacturing activities in North American cities beginning in the 1960s and 1970s, and an associated cultural turn (where the inner city became increasingly seen as a desirable place to live) paved the way for changes in this urban social geography. Gentrification resulted, according to one perspective, from renewed interest in central city living and the growth of a quaternary service sector (Lees et al., 2008; Ley, 1996). A second perspective sees gentrification as an outcome of the workings of capitalist property structures, whereby central city land rents were below their investment potential (Smith, 1996). Re-investment displaced low-income earners to outlying areas; although in some cases the changes have been described as ‘replacement’ of populations rather than ‘displacement’ (Hamnett, 2003; see also Skaburskis and Moos, 2008).
Suburbs have become more diverse in form and social composition (Grant and Filion, 2010; Harris and Larkham, 1999), for instance diversity of incomes and also greater ethnic diversity, particularly in Toronto and Vancouver where immigrants are locating in suburbs (Hiebert, 2012). Some of these are wealthy migrants that form ethnic enclaves in the suburbs, especially in Vancouver and Toronto and to a lesser extent in Montreal (Hiebert, 2012; Ley, 2010). A substantial body of research has also linked, in some cases implicitly, the growth of poverty, and ‘stressed’ tenant households, in the inner suburbs (also called old suburbs, built in the years following the WWII) to the gentrification of the central city in the US and Canada (Bunting et al., 2004: 373; Cooke and Marchant, 2006; Lees et al., 2008; Ley and Lynch, 2012; Ley and Smith, 2000; Madden 2003; Vicino, 2008; Walks, 2001; Walks and Maaranen, 2008). By contrast, the inner cities of large US and Canadian metropolitan areas have also seen dramatic increases in the number of condominium apartments, a process Walks (2014) calls ‘condofication’. This trend brings higher earners downtown as opportunities for homeownership increase in the inner city (Kern, 2010).
These changes have for some time raised new questions about the evolving geography of income, for instance whether we are seeing a complete reversal of the income structure where inner cities are suddenly wealthier than the suburbs (e.g. Bourne, 1993). Research on the contemporary social geography of metropolitan North America has found a persistence of the traditional pattern of income gradients increasing with distance from the historic central city (Murdie and Teixeira, 2006). However, gentrification and the dispersal of poverty have also made the geography of income ‘much more complex and variable’ (Bourne, 1993: 1293). The changes are driven in part by growing income inequalities arising from the polarisation of the occupational structure, which contribute to growing divisions of urban space by social status (Gottschalk and Smeeding, 1997; Hulchanski, 2010; Osberg, 2012; United Way, 2004; Walks, 2011).
Defining suburban ways of life
The purpose of this paper is to contribute to the literature on the intra-metropolitan geographies of income by investigating how the geography of income in metropolitan Canada relates to suburban ways of living. Our research raises the question of how to define a suburb (Bourne, 1996; Forsyth 2012; Harris, 2010; Turcotte, 2008). There is a history of analysing the geography of income by comparing suburban to urban areas (e.g. Walks, 2001). Researchers have used a number of variables such as period of development, density and distance from the historic central business district to delineate suburbs as a distinct category (see Gordon and Janzen, 2013). However, some researchers consider the term ‘suburb’ to be obsolete or simply inadequate due to its inability to capture the diversity of neighbourhoods contained within suburbs. Forsyth (2012), in a recent review of the literature, identifies several ‘dimensions’ that have been mobilised to define suburbs on the basis of location (Turcotte, 2008), built form (Forsyth et al., 2007), transportation infrastructure (Flint, 2006), activity (Duany et al., 2000) and social, cultural, and political features (Beauregard, 2006; Hayden, 2003; Teaford, 2008). Our research is novel, and complementary, in that instead of comparing income between categories that denote specific places as urban or suburban, we focus on ways of living that might constitute forms of ‘suburbanism’.
This perspective derives from Fava’s (1956) concept of ‘suburbanism as a way of life’ (see also Gans, 1995[1968]; Wirth, 1938), and broadly refers to the ways people experience place (Kotkin, 2005; Shields, 2012). Suburban ways of living are treated primarily as qualitative concepts in this literature. We thus largely draw on conceptual understandings of what would constitute an urban versus suburban way of living to build our quantitative indicators of suburban ways of living – as opposed to using more traditional quantitative measures (such as density, period of development or distance from the historic centre) to delineate suburbs as specific places. Walks (2013) has theorised the concept of ‘suburbanism as a way of life’ through an engagement with Henri Lefebvre’s work on urbanism and everyday life (Lefebvre, 2003[1970]). Walks creatively considers suburbanisms as a series of dimensions which enable him to characterise both urban and suburban places as having non-mutually exclusive suburban characteristics in terms of the ways residents live their daily lives; for instance, the commonalities between suburbs and downtown condominiums in terms of homeownership and social homogeneity, which have led some observers to refer to downtown condominium apartments as ‘vertical suburbs’ (McGinn, 2013).
As discussed above, there is a growing literature that examines ‘suburban ways of living’ from a theoretical, conceptual and qualitative vantage point. Here, we offer a novel quantitative analysis. In forthcoming work we build on this analysis to operationalise suburban ways of living as ‘social status’, ‘domesticity’, and ‘built-form/tenure/commute-mode’. The last dimension is the one we examine in this paper. It is composed of three different characteristics: (a) residence in a single detached house; (b) homeownership as type of housing tenure; and (c) private automobile use as mode of commute. There are several other previous categorisations, and methods, that distinguish between urban and suburban areas (Apparicio et al., 2007; Hess et al., 2001). We use these three dimensions because they derive directly from the conceptual literature – they are the most common and well-described characteristics of North American suburban ways of living (Beauregard, 2006; Harris, 2004; Harvey, 1989[1985]; Hayden, 2003; Jackson, 1985; Teaford, 2008). But it should be said that suburban ways of living would have to be operationalised differently in other international contexts.
We create eight types of neighbourhoods characterised by combinations of the three different variables measuring the ‘built-form/tenure/commute-mode’ dimension of suburban ways of living using the Statistics Canada 2006 Census. We use data at the dissemination area (DA) level, defined by Statistics Canada (2007) to capture between 400 and 700 people typically. The use of DAs allows for more detailed geographies than the more often used census tracts that cover larger areas. We calculate a ratio of DA to CMA averages for each of the three ‘built form/tenure/commute’ variables to create our categories. When the percentage of single detached homes, or homeownership or commuting by car exceeds the CMA average, it is used as an indicator of the prevalence of suburban ways of living in that area. Our neighbourhood categories are as follows:
None of the three variables greater than the CMA.
Commute by car greater than the CMA.
Homeownership greater than the CMA.
Single-family housing greater than the CMA.
Single-family housing and commute by car greater than the CMA.
Homeownership and commute by car greater than the CMA.
Homeownership and single-family housing greater than the CMA.
All three variables greater than the CMA.
Category 1 is the most urban, while category 8 is the most suburban. Throughout the paper, we refer to these categories as our eight ‘neighbourhood types’. This approach still requires us to create mutually exclusive categories but it facilitates interpretation and allows us to analyse all combinations of higher/lower than CMA average values of the three ‘built form/tenure/commute’ variables. Rural areas outside of the CMAs, the latter defined by Statistics Canada based on commuter flows to an urban centre, are not considered here but the ways rural areas fit into the conceptualisation of suburban versus urban ways of living certainly warrant consideration in future research. 1
Income measures
We analyse the geography of income using 2005 before-tax average household and individual incomes, which are reported in the Statistics Canada 2006 Census at the DA scale. As we aggregate DAs to create ‘neighbourhood types’, we are restricted by the data to using averages instead of medians. We use household and individual income since low household income may not always correspond with low individual income due to variations in the number of earners per household (Ley, 1999). Given that the effect of the tax transfer system on income inequality provides a distorted sense of existing differences in the labour market, we use before-tax income, as opposed to after-tax income, as a more useful measure of relative economic standing in the labour market (Brzozowski et al., 2010; Frenette et al., 2007). Moreover, before-tax income reflects earners’ vulnerability to changes in the state’s re-distributional functions (Atkinson et al., 2002; Heisz, 2007; Jenkins and Van Kerm, 2009), which have been weakened over the past three decades under neo-liberalism (Blythe, 2013; Peck and Tickell, 2002).
We use ordinary least squares (OLS) regression models 2 with average income as the dependent variable and our neighbourhood types as a categorical independent variable. 3 Neighbourhood type 1, the most urban category, is the ‘reference level’ (Hardy, 1993). The use of regression analysis is key as it helps us analyse the relative importance (using standardised beta coefficients) of different neighbourhood types in explaining the geography of income. Regression analysis is commonly used in critical urban scholarship as a means to test broad relationships, while holding other variables constant (Wyly, 2009). Comparing the beta coefficients among the different neighbourhood types will reveal which of the urban versus suburban neighbourhoods are most associated with income.
Findings
The ‘suburban’ population
The analysis of suburban ways of living allows us to see the share of the population living suburban lifestyles based on what are, of course, only limited indicators. We find that most of the population in Canadian metropolitan areas resides in the two neighbourhoods on the opposite ends of our spectrum of suburban ways of living (Table 1). Depending on the metropolitan area, between 32% and 55% of the population lives in neighbourhood type 8, our most suburban neighbourhood type. Between 13% and 33% of the population lives in neighbourhood type 1, the most urban. The relatively high share of the population in both the most urban and the most suburban neighbourhoods helps explain a growing polarisation in political discourse as clear demarcations have been noted between urban and suburban voters (Walks, 2005). The combined high share of the population in neighbourhoods 2 through 8 also provide a strong indication of the predominantly suburban-like nature of Canada’s metropolitan system as measured by our three indicators of suburbanisms (see also Gordon and Janzen, 2013). Our method allows us to measure multiple forms of suburban ways of living, alleviating (although not eliminating) the pitfalls of depicting suburbs erroneously as internally homogeneous.
Population by distance from the metropolitan centre and area type, 2006 (column percentages).

Highlighted: Two largest values, by column.
Category 1: None of the three variables greater than the CMA. Category 2: Commute by car greater than the CMA. Category 3: Homeownership greater than the CMA. Category 4: Single-family housing greater than the CMA. Category 5: Single-family housing and commute by car greater than the CMA. Category 6: Homeownership and commute by car greater than the CMA. Category 7: Homeownership and single-family housing greater than the CMA. Category 8: All three variables greater than the CMA.
Source: Calculated using Statistics Canada, 2007 (2006 Census).
Visual inspection of maps for the built-form/tenure/commute dimension shows that suburban ways of living are not restricted to the peripheral locations that are often defined as suburban places (see Moos and Kramer (2012) for maps of the dimensions of suburban ways of living). Instead, all of the eight neighbourhood types can be found to varying extents throughout the entire metropolitan landscape. For example, above-average rates of home-ownership or above-average reliance on a private automobile are found near the central business district as well as in outlying areas. Suburban ways of living are found near central areas in part due to gentrification that has increased the share of homeowners in the central business districts of most of Canada’s metropolitan areas (Meligrana and Skaburskis, 2005). But this is most pronounced in the largest metropolitan areas, particularly Toronto and Vancouver due to the large increase of condominium apartments (Walks, 2014).
Homeownership as a suburban way of living
Homeownership has come to define urban space and social-spatial relations in much of the developed world but particularly in the US, Canada, UK and Australia where homeownership rates are highest. Homeownership has traditionally been associated with single-family homes but this began to change as central cities experienced revitalisation, and as condominium ownership became more common (Ley, 1996). We calculated that the rate of homeownership grew considerably between 1981 and 2006, from 56.1% to 65.2% for the 26 CMAs as a whole. This growth occurred throughout the metropolitan landscape, although it was more pronounced in areas less than 20 kilometres from the CMA’s historical centres than beyond (analysis not shown for brevity). This faster rate of growth in and around metropolitan central areas is at least in part a reflection of intensifying processes of gentrification and condofication during this 25-year period (Kern, 2010; Ley, 1996; Walks and Maaranen, 2008). Nevertheless, the central cities (broadly defined as situated within a five kilometre radius from the centre) and their immediate surroundings (areas between five and ten kilometres from the centre) continued to have the lowest rates of ownership by 2006 (46.1% and 60.3%, respectively). These figures point to the important role that homeownership, as an aspect of suburban ways of living, has played in the structuring of the social geography of metropolitan Canada both in central and outlying locations.
Suburban ways of living, such as homeownership, do tend to occur less frequently in and around the historic central business districts of all 26 metropolitan areas. The relative distribution of metropolitan populations by neighbourhood type and distance from the historical metropolitan centre confirms this observation (Table 1). The results show that the geography of our built-form/tenure/commute dimension of suburbanism continues to reflect the traditional binary idea of the suburb as the socio-spatial ‘other’ of the central city (Fava, 1956; Gans, 1995[1968]; Harris and Larkham, 1999), but clearly not exclusively. This suggests that defining suburbs as specific places distant from the central business district is not altogether inconsistent with the suburban ways of living approach. This is especially true since the dominant findings clearly distinguish category 1 from category 8 neighbourhoods. But as discussed below new nuances are revealed by grouping DAs into more than only two categories (urban/suburban). We should also note that we are limited in revealing suburban diversity by the small number of aggregate variables used as opposed to what could be achieved with more qualitative assessments of suburban ways of living.
It should be noted that category 1 neighbourhoods, the most urban, are much more likely to be found near the central business district, whereas category 8 neighbourhoods, the most suburban, are more spread out across the metropolitan landscapes. Interestingly too, category 3, homeownership, has a distribution of population that is more even than for other categories, and the highest share is found in the first five kilometres from the central business district. Since category 3 refers to DAs with above average proportions of homeownership but not single-family dwellings, the category appears to be capturing the condominium housing stock. Homeownership is not an exclusive indicator of suburbs if the latter are defined as spatial opposites of the inner city.
Suburbanisms and the geography of income
Our neighbourhood types characterised by suburban ways of living show evident differences in individual and household incomes (Figure 2). The share of high-income earners is higher in the neighbourhood category capturing our more suburban categories while the share of lower income earners is higher in the urban neighbourhood category. In terms of the regression analysis, all models are statistically significant (p < 0.001), providing evidence that, within the largest 26 CMAs, suburban ways of living as operationalised using the built-form/tenure/commute variables are related to the geographies of household and individual incomes (Table 2). 4 The beta coefficients are largest for our category 8 neighbourhoods, the most suburban, across an entire national urban system. The beta coefficients indicate that the combination of having above CMA average shares of single-family homes, homeownership rates and car commuting is relatively more important in explaining the geography of household income than each of the built-form/tenure/commute variables are on their own.

Distribution of individual and household pre-tax income bracket and by suburbanism category.
Regression: Log of average household and individual income by area type (standardised robust coefficients).

Category 1: None of the three variables greater than CMA mean.
Highlighted: Three largest absolute values, by row, *p < 0.01, **p < 0.001.
Category 1: None of the three variables greater than the CMA. Category 2: Commute by car greater than the CMA. Category 3: Homeownership greater than the CMA. Category 4: Single-family housing greater than the CMA. Category 5: Single-family housing and commute by car greater than the CMA. Category 6: Homeownership and commute by car greater than the CMA. Category 7: Homeownership and single-family housing greater than the CMA. Category 8: All three variables greater than the CMA.
Source: Calculated using Statistics Canada, 2007 (2006 Census).
Category 7 also generally shows large beta coefficients (with some exceptions), again confirming that even homeownership and single-family dwelling occupancy (without above average car commutes) as a facet of suburban ways of living are associated with higher incomes. In most CMAs, categories 3 and 6 show the third largest beta coefficients, meaning incomes there are higher than in category 1 neighbourhoods, the reference level. It is therefore consistently the neighbourhood categories with above average levels of homeownership that are most associated with higher income earners. For categories 2, 4 and 5, the coefficients are generally positive in sign, suggesting higher incomes in most categories with suburban attributes as compared to category 1, the most urban areas. But for these categories (2, 4 and 5), with below CMA average levels of homeownership, the coefficients are much smaller than for the categories including above CMA average homeownership rates, and not consistently statistically significant.
One exception is category 4 where the coefficient is negative (and statistically significant) in the four largest CMAs (Toronto, Montreal, Vancouver, Calgary) and two smaller ones (Hamilton, and Kingston) for individual income, and in Toronto also for household income. What this implies is that neighbourhoods having higher than CMA shares of single-family homes, but not homeownership and car commuting, are associated with lower incomes than the most urban category where all three variables are below the CMA average. In the larger CMAs, these neighbourhoods are found, for the most part, in the older suburbs. They point to the existence of a rental housing stock in the older suburbs with lower than average incomes. This is consistent with the decline associated with older, post-WWII suburbs in cities across North America (e.g. Vicino, 2008, Walks, 2011). In Hamilton and Kingston, the smaller CMAs, category 4 neighbourhoods are found also in the inner city, in the former case related to inner city decline and the latter in part to student rental housing.
In comparing the size of beta coefficients across CMAs, we can also glean interesting differences that relate to the metropolitan context. The ways in which the geography of income aligns with suburban ways of living is influenced by metropolitan size and economic structure. The largest effects from ‘suburban’ categories relative to the most ‘urban’ category are observed in the CMAs with large industrial components such as Oshawa, Windsor, and Hamilton but also in Barrie, Abbotsford and Saguenay (Table 2). The smallest effects occur in Toronto, Montreal, Vancouver, Calgary – the largest CMAs except for Ottawa-Gatineau – and to some extent Halifax, a mid-sized CMA. Therefore, in general, it appears that the relationship between income and suburban ways of living is weaker in the largest CMAs, and strongest in CMAs where manufacturing (or resource processing) remains a large component of the urban economies, and in those CMAs that are known to contain a large share of single-family housing stock. In the largest, post-industrial CMAs with post-Fordist employment structures, gentrification and condofication have brought more higher income earners to the central city (Walks and Maaranen, 2008), which blurs the relationship between income and our indicators of suburbanisms. It is in the mid-sized cities and those with a traditional Fordist manufacturing base that suburban ways of living are most associated with higher incomes.
Two other main points are worth highlighting in these findings. The first one relates to the higher incomes associated with our suburban neighbourhood types. The positive relationship between income and suburban ways of living is most apparent for the neighbourhood types including above average homeownership rates, which as we have seen are increasing in central and suburban locations. This pattern suggests that the continuing process of a return to the central city by the (upper) middle class and residential investment capital through homeownership (Ley, 1996; Walks and Maaranen, 2008) may be contributing not only to growing inequality in central cities but also to growing inequality in suburbs. Low-income neighbourhoods are associated with rental housing and lower than average automobile use found in central and outlying areas, particularly the suburbs built in the post-WWII years. Such an observation is again in line with recent studies that find an increase in poverty and inequality in the suburbs of Toronto and Vancouver over the past three decades (Hulchanski, 2010; Ley and Lynch, 2012). While we do not measure temporal trends, we can indeed confirm across an entire metropolitan system the dispersed location of some low-income earners.
Secondly, we note that certain ‘suburb-like’ neighbourhoods in the largest CMAs (except Ottawa-Gatineau) tend to have lower household average incomes than their most ‘urban’ neighbourhoods; these are neighbourhoods where commuting by car is not the norm but renting and residence in single-family dwellings is. This is a novel finding, because previous research has linked the suburbanisation of lower-income earners to neighbourhoods containing higher than metropolitan average shares of renting households in multi-family housing, particularly high-rise apartments (Walks, 2001) rather than the single-family housing as observed here. This could be partly related to the incidence of accessory dwelling unit rentals increasing particularly in large Canadian cities (Mendez, 2011; Tanasescu et al., 2010), or the presence of low-income seniors. But more generally, this finding points again to the decline of older suburban areas where there is an increasing transit-dependent, lower-income population (Walks, 2011).
Discussion and conclusions
We study three variables measuring a built-form/tenure/commute dimension of suburbanism and how these intersect with the geography of income. A finding that may be broadly generalisable to other metropolitan areas in the US and Europe that are experiencing downtown revitalisation is the consistently positive relationship between suburban ways of living and higher incomes: While suburbs may be becoming more diverse in social composition, suburban ways of living remain much more homogeneous in terms of their deep connection with higher social status because these suburban ways of living (such as homeownership) can occur in urban and suburban locations. Defined in this way, suburbanisation is indeed still spreading high social status to new geographic areas; and it is notable that this relationship holds across 26 metropolitan areas with different urban contexts and economies. We also found important differences among the CMAs, for instance the weaker association between suburban ways of living and higher income earners in the largest CMAs as compared to smaller CMAs due to the gentrification and condofication of their central cities (measured using beta coefficients). Therefore, in the post-Fordist cities, the urban is no longer associated exclusively with lower income earners. We have only considered suburban ways of living through an aggregate analysis of simple indicators – future research could add additional indicators of suburban ways of living. There is also an opportunity for more qualitative research on the diversity of suburban ways of living, and how they intersect with social status.
From a policy perspective, the troublesome implication of these findings is that homeownership, and thus suburban ways of living, continue to be largely the remit of higher income earners. It also suggests that the neo-liberalisation of the state is contributing to socio-spatial polarisation. As in other national contexts, the neo-liberalisation of the Canadian welfare state has led to the retrenchment of social safety nets and decline in affordable housing policies (Bunting et al., 2004). The spread of homeownership, and its positive association with income, is thus likely an outcome of what Hulchanski (2010) has called Canada’s ‘dual housing policy’ – the promotion of homeownership among well-off households, and the marginalisation of those in the rental sector. Hulchanski (2004) has documented the diverging incomes between renters and owners in Canada over time; and our analysis here offers a first comprehensive spatial dimension of this trend. Among our variables measuring suburban ways of living, tenure is the most important in delineating high- from low-income neighbourhoods across 26 CMAs. The evident policy implication is that there is opportunity for re-investment in the rental sector, by all levels of government, which would allow a broader segment of the population to reside in central cities.
A related implication is that continued promotion of homeownership in urban policy, such as is often the case in urban intensification efforts (Harris, 2011; Kern, 2010), will likely lead to the displacement of lower income earners – as we find here the higher income areas and homeownership align closely. Potential policy solutions are varied and range from requiring a share of new condominium developments to include low-income housing, promotion of co-operative housing, and purpose built rental housing in central areas. Further research is required on how the potential displacement of low-income earners through the spread of homeownership can be stemmed.
It is also notable that single-family dwelling occupancy alone is not associated with higher incomes. This is an important finding because prior research has generally documented poverty and low-income in suburban neighbourhoods that predominantly contain multi-family dwellings. We might have expected to see automobile use to have a stronger association with income as well. It is likely that the centralisation of higher income earners into denser areas where car use is lower and the suburbanisation of lower income earners, in some cases renting single-family dwellings, are contributing to this pattern. Interestingly, even the relationship between homeownership and income is somewhat less pronounced in the largest CMAs. This is an important nuance on prior research that associates central city revitalisation purely with the spread of homeownership. Due to rising housing costs, even higher income earners are finding themselves renting in central cities of large metropolitan areas. Due to the spread of lower income earners to inner suburbs, renting is also somewhat more common in some suburban areas although ownership still dominates. Future research should consider these changing tenure compositions of urban and suburban areas in more detail. Our analysis provides a first look at the utility of operationalising suburban ways of living, as opposed to suburbs as places, in quantitative analysis – the approach allows insight into several contemporary aspects of urban restructuring, and lays groundwork for future research in this area.
Footnotes
Acknowledgements
The authors thank the journal's reviewers and editors for their helpful feedback. The authors also thank Pierre Filion, David Ley and Elvin Wyly for comments on an earlier version of this paper, and Anna Kramer, Liam McGuire, Micheal Seasons and Robert Walter-Joseph for research assistance.
Funding
This research is supported by the Social Sciences and Humanities Research Council of Canada through funding from the Major Collaborative Research Initiative ‘Global suburbanisms: Governance, land, and infrastructure in the 21st century’ (2010–2017).