
Abstract
Given ongoing developments altering social and spatial cohesion in urban societies, a more comprehensive understanding of segregation is needed. Taking the ‘mobilities turn’ at heart, we move beyond place-based segregation approaches and focus on the practised urban experiences of individuals through a more comprehensive assessment of their activity spaces. This study contributes to people-based segregation research by mapping the activity spaces of individuals on the basis of mobile phone data in Tallinn (Estonia) and relating these activity spaces to (mainly) the users’ ethnic background (i.e. Estonian versus Russian). Significant ethnic differences in terms of (1) the number of activity locations, (2) the geographical distribution of these locations, and (3) the overall spatial extent of activity spaces are found. We also find that these differences tend to deepen as the temporal framework is extended. We discuss the main implications for segregation research and highlight some avenues for further research.
Introduction
Segregation is a multifaceted phenomenon consisting of interacting social, spatial and temporal dimensions. While from a sociological point of view segregation is above all about the absolute or relative lack of interaction between social groups, from a geographical point of view the focus is predominantly on the unequal distribution of social groups in physical space. Social-spatial segregation, then, is about the interplay between the social and the spatial dimensions of segregation.
Although the socio-spatial dimensions of urban segregation have been thoroughly researched, there remains a need for further research given both (1) the changing nature and new forms of segregation related to societal changes (Massey et al., 2009; van Kempen and Özüekren, 1998) and (2) methodological and conceptual developments in the social sciences. On the one hand, social systems are characterised by constant change, as exemplified by contemporary trends towards economic flexibility, consumerism, individualisation, diversification of lifestyles and increased mobilities (Urry, 2007). For instance, recent advances in mobile technologies have resulted in new, often highly uneven patterns of space-time compression. This affects social cohesion as some technologies only enable certain segments of the population to be mobile (Kesselring, 2006). As a corollary, policy-makers often face new socio-spatial divisions and associated threats to social cohesion (Cassiers and Kesteloot, 2012; Dukes and Musterd, 2012).
On the other hand, the social sciences are embracing new ways of looking at socio-spatial divisions in urban societies. Conceptually, for instance, we have seen the rise of the ‘new mobilities’ paradigm (Sheller and Urry, 2006), which starts from a critique of the trivialisation of the systematic movements of people for work, family life and leisure. The mobilities paradigm essentially challenges the ways in which much of the social sciences research ignores the multifaceted spatialities that daily social life presuppose. To date much segregation research has been what Sheller and Urry (2006) describe as ‘sedentarist’ while it (often implicitly) fetishises the fixed place as ‘the’ spatial dimension. In the case of segregation research, this spatial dimension has largely been the residential space.
The segregation literature has, of course, moved beyond the residential realm (Kwan, 2013; Schnell and Yoav, 2001) by paying attention to the variation of segregation levels across workplace/occupational (Ellis et al., 2004), educational (Burgess et al., 2005) and other social practices (Silm and Ahas, 2014; Tredoux and Dixon, 2009). However, in spite of these extensions, the literature has largely continued to rely on a place-based approach; analyses are based on the distribution of people in predefined spatial units (e.g. census tracts) and segregation is measured based on aggregated values of the distribution of people in given spatial units.
However, with a person-based approach, the measurement unit relates an individual per se to their use of space and time. Only a few studies have explored segregation by thus considering an individual’s physical mobility in space and time. For example, Wang et al. (2012) studied the extensity, intensity and diversity of individual activity spaces while Greenberg Raanan and Shoval (2014) calculated the Perceptual Segregation Index of individuals. The ability to conceptualise person-based segregation is being enabled by new methods of gathering and analysing data, for instance by monitoring their information and communication technology (ICT) usage (Ahas et al., 2010; Palmer et al., 2012).
Against this backdrop, and in line with Wang et al. (2012), this paper attempts to contribute to the theoretical and methodological framework of urban segregation research by proposing a more comprehensive, ‘mobile’ analysis of the spatial divisions of social groups from a multilayered temporal perspective. We aim to reveal how and to what extent spatial differences in human spatial mobility exist between individuals from different ethnic backgrounds based on mobile phone data. To this end, we present an empirical study of Tallinn, where one of the main social divisions is that between the Estonian-speaking majority and the Russian-speaking minority (Kulu, 2004: 310).
We start by briefly discussing the spatial dimension of segregation and human spatial mobility in general terms. We then narrow the conceptual and empirical scope by focusing on the idea of individual activity spaces and discuss how this idea can be incorporated into segregation research and measured through mobile phone data. This is followed by an overview of our research framework, the study context and methodology, after which we present the key findings. We conclude by discussing the major implications of this research and some potential avenues for future research.
Background and literature review
Segregation: The interweaving of social and spatial dimensions
Over the years, the literature on urban segregation has evolved into a broad field of study in which different dimensions of the overall process are highlighted. While commonly rooted in either structural or cultural-behavioural readings of what segregation means and how it comes about (see Andersson, 1998), empirical foci have become extremely diverse and include but are not limited to inequalities in: access to groceries (Lee and Lim, 2009) and healthy food (Wrigley, 2002); accessibility to urban amenities (Brambilla et al., 2013); and political recruitment (Stromblad and Myrberg, 2013). 1
In an urban context, social and spatial dimensions are combined to highlight the physical and functional separation of spaces occupied by different social groups engaging with the city. This involves tangible aspects such as the spatial concentration of social groups in specific areas of the city including the creation of socially homogenous spaces (e.g. Andersson, 1998), as well as more subjective aspects such as perceptions of this concentration and social homogeneity (e.g. Kouvo and Lockmer, 2013). The resultant interweaving of social and spatial structures is best conceptualised as a two-way relationship (Morgan, 1984). The extensive literature that connects the widespread (de)industrialisation of Western society in the last 200 years with changes in interpersonal relations, class structure and the spatial distribution of social groups across the city shows that spatial structures reflect aspects of social structures, just as spatial structures reinforce and influence the evolution of social structures.
Human spatial mobility and segregation
An individual’s spatial mobility consists of a complex pattern of movements and social practices in space and time. It is the outcome of the interconnection between individual factors (e.g. socio-economic factors, life values, preferences, attitudes and prejudices), interaction with other individuals, and external factors such as the surrounding environment and social structure (Hägerstrand, 1970; Pred, 1984). As a consequence, spatial mobility impacts an individual’s entire life: a visit to the park, daily commuting, weekly leisure activities and long-distance travelling or even migrating all hinge upon that individual’s willingness and ability to ‘move’ in time and space (Cresswell and Merriman, 2011).
In the ‘new mobilities’ paradigm, it is proposed that mobility in spatial, temporal and social dimensions has become a decisive condition for social interaction and integration (Flamm and Kaufmann, 2006; Sheller and Urry, 2006). For instance, studies suggest that individual spatial mobility is associated with the feeling of personal freedom (Flamm and Kaufmann, 2006), the level of subjective wellbeing (De Vos et al., 2013), the creation of social status and the formation of power relations in society (Kaufmann et al., 2004). As individuals’ social and spatial mobilities are interrelated in complex ways, ‘being mobile’ has become an established ideology in contemporary society, with the absolute and relative ability to move functioning as a new form of capital (Kellerman, 2012a; Urry, 2007). Therefore, differentiation in human spatial mobility can be considered as a factor that contributes to ongoing social differentiation or stratification, and thus becomes an element of segregation.
The analysis of the relation between urban segregation processes and ‘mobility’ pre-dates the current upsurge in research that has been fuelled by the ‘new mobilities’ paradigm. Savage (1988), for instance, was one of the first to link social mobility to geographical mobility by relating upward social mobility in post-war Britain to relocation. There has also been rising attention in how segregation is related to differential spatio-temporal accessibility of different parts of the cities, thus highlighting the importance of mobility in contemporary society. Paez et al. (2010), for example, calculate estimates of distance travelled that are specific to both geographical location and type of individual to map ‘opportunity landscapes’ and the concomitant accessibility deprivation in Montreal. Meanwhile, Ong and Blumenberg (1998) have shown how limited travel options are a major obstacle for welfare recipients in ‘job-poor’ neighbourhoods when they attempt to make the transition from welfare to work because of the geographical separation of their homes from employment opportunities. However, as we will argue below, there is room for additional research on how mobility, space and segregation intersect.
An activity space approach to socio-spatial inequality
As space can be seen as a social construction (Lefebvre, 1991), the cognitive embodied experience of and exposure to a given surrounding environment influences an individual’s identity (and vice versa). This exposure not only implies social, emotional and psychological perceptions of a given location, it also affects a person’s perceptions of society. Valentine (2008) argues that moral dispositions, ‘norms’ and social regulations are constituted by moving in and through different spaces, and as such, individual mobilities affect ethical judgements: how one should live, behave, or evaluate and treat others. From this perspective, segregation is not solely about social interaction ‘in’ the place where one ‘lives’, it is affected by the whole gamut of experiences in the surrounding environments in which activities are performed and through which travelling takes place (Kwan, 2013; McQuoid and Dijst, 2012).
To examine human spatial mobilities, a number of different concepts have been developed (see Schönfelder and Axhausen, 2010). One of the most commonly applied concepts is a person’s ‘activity space’ (Golledge and Stimson, 1997): in general terms, an activity space is delineated by the locations with which an individual has direct contact because of their regular activities, including travel between and around those locations.
There have been attempts to analyse socio-spatial inequalities through activity spaces. For instance, the relationship between human activity spaces and accessibility has been explored by showing how transportation influences social exclusion (Casas, 2007; Schönfelder and Axhausen, 2003), while from a time-geography perspective, it has been suggested that individual time-space trajectories of segregation tend to (re)produce patterns of social separation (Atkinson and Flint, 2004; Lee and Kwan, 2011). Meanwhile, Greenberg Raanan and Shoval (2014) apply a combination of mental mapping and ICT-tracking technology to show that there is a strong relationship between an individual’s perception of personal territory and their actual use of urban space, and also reveal a high level of perceptual segregation among individuals from different ethnic groups in Jerusalem. Attempts have also been made to combine place-based segregation research with the individual activity space approach. Wong and Shaw (2011), for instance, propose a methodology to assess the exposure dimension of segregation by taking into account the actual locations visited by individuals, while Farber et al. (2012) derive the exposure and clustering dimensions of segregation at the individual level by implementing person-specific and location-specific spatial analysis techniques based on a relative accessibility indicator. Palmer et al. (2012) propose the exploration of segregation in terms of the actual movement of an individual by measuring the extent of an individual’s activity space. Similarly, Wang et al. (2012) propose the use of an individual’s daily activity spaces to assess socio-spatial segregation, where extensity indicates the geographical extent of the human activity space.
The use of mobile phone data to explore human activity spaces
Probably one of the most promising ways to explore human spatial mobility is through mapping mobile phone use (Ahas et al., 2010; González et al., 2008). In this study, we apply a mobile phone-based data collection method that focuses on call detail records (CDRs). A CDR is a log file of a mobile network operator, which includes information on all outgoing call activities (CAs) of mobile phone users, i.e. calls, short messaging service texts and Internet and data services initiated by the phone owner. Given the ubiquity of mobile phone usage in people’s daily lives (Castells et al., 2007), access to CDR data offers researchers the opportunity to gain a better understanding of human mobility in space and time both at the individual and at the aggregated population level (Batty et al., 2012). The use of CDR has several advantages over conventional questionnaire and activity-travel diary surveys in human mobility research (Järv et al., 2014: 125). For instance, the data set is cost-effective while having the potential to produce an unlimited sample size over long study periods and to cover a large study area.
The following four assumptions are made when using CDR data in studies of human spatio-temporal behaviour: (1) a mobile phone in the data set represents one individual (i.e. a mobile phone owner); (2) CAs represent an individual’s footprint in space and time; (3) the amount of time spent in a location is strongly correlated with the amount of CAs within a given location; (4) a prolonged (e.g. one month) time period is needed to reveal the extent of an individual’s habitual spatial mobility because mobile phones are not used constantly while activities or travel are undertaken (Ahas et al., 2010).
Research framework
Within the context of the above discussion, four key features of our research framework stand out. First, we take into account the heterogeneity within predefined (ethnic) groups (Farber et al., 2012; Schnell and Yoav, 2001) by including in the analysis all the individual variables that are available in addition to an individual’s ethnic background. Second, as in Palmer et al. (2012) and Wang et al. (2012), we adopt a mobility-based approach to segregation by focusing on the spatial mobility of individuals and their actual overall use of space.
Third, our proposed methodology enables us to go beyond an examination of the daily habitual use of space to explore human activity spaces from a multilayered temporal perspective: we analyse a one-year empirical data set to study the space-time behaviour of individuals. This prolonged study period is essential as it reveals the ‘typical’ daily habitual use of space (Järv et al., 2014), which is becoming more flexible and fragmented in space-time (Hubers et al., 2008; Kesselring, 2006). For instance, blending of different mobility forms (daily, travel, migration, residential change) we see people with multiple residences, frequent long-distance travel for both commuting and leisure purposes (Flamm and Kaufmann, 2006). Moreover, the longer timeframe adopted in this study also allows us to examine the socio-spatial differences in those activity spaces that indicate individual spatial mobility beyond daily routine behaviour (Kellerman, 2012a, 2012b). We are therefore able to gain a fuller understanding of not only actual non-daily two-way mobility, but also the potential range of individual mobility in physical space.
Fourth, we attempt to combine segregation research with the individual activity space approach through a quantification of human spatial mobility and an assessment of the concentration of an individual’s activities and movements. Hence, the dimension of activity concentration may be considered as a person-based measure, similar to the place-based segregation measure of concentration (Massey and Denton, 1988). Given that segregation is not solely about social contacts, but is also affected by experience of the surrounding environments (Kwan, 2013; Valentine, 2008), concentration in relation to the human activity space gives an indication of the cognitive perception of society as a whole and the opportunity for face-to-face contacts with others. Hence, we interpret differences in the characteristics of activity spaces as indicators of socio-spatial inequality and we view differences due to ethnicity as an expression of ethnic segregation. It should be noted that this study does not attempt to explain these differences, although this certainly could be a topic for future research.
Case study: Ethnic segregation in Tallinn, Estonia
Context: Ethnic segregation in Estonia
Today, ethnic minorities comprise about one-third of the total population in Estonia, the largest group being a sizable Russian-speaking minority (Statistics Estonia, 2013). In this paper, we apply a loose definition of ‘ethnicity’ to refer to groups of people who identify with each other based on common ancestral, social, cultural or national experiences. In the Estonian case, the division between ‘Estonians’ and ‘Russians’ fits this definition in that both groups tend to be clearly distinguishable, not just in terms of their language, but also in terms of historical background and current socio-economic position.
The Russian minority mainly emerged after the Second World War. In 1945 there were almost no Russians in Estonia, but after annexation by the Soviet Union many migrated to the country and by 1989 (shortly before Estonia regained its independence in 1991), a peak of around 38% of the total population were immigrants from the Soviet Union (Kulu, 2004). Between 1944 and 1991, the country’s industrialisation was built largely around immigrant labour and the new housing estates that were built for these immigrants led to a clear-cut spatial division between Russian and Estonian residences. This spatial division between the two principal ethnic groups has remained largely unaltered with a high proportion of Russian speakers still living in the industrialised region of northeastern Estonia and in the capital city of Tallinn, especially in the northern (Põhja-Tallinn), western (Haabersti, Mustamäe) and eastern (Lasnamäe) areas of the city (Kährik and Tammaru, 2010).
Owing to the strict central planning, labour and housing policies of the Soviet era (Kährik and Tammaru, 2010) and the continuation of separate Estonian-speaking and Russian-speaking education systems (Vihalemm, 1999), both language groups have remained largely segregated in social and economic terms.
As a consequence, although our empirical framework is rather narrowly delineated by language group, we emphasise that in the Estonian context this difference does point to wider, structural differences in one’s position in the socio-economic system: the limited level of inter-marriage (van Ham and Tammaru, 2011), differences in housing (Kährik and Tammaru, 2010), urban processes (Tammaru et al., 2013) and income (Leping and Toomet, 2008).
Figure 1 provides a visualisation of the ethnic make-up of Tallinn and acts as starting point for place-based segregation research as it focuses on one spatially fixed and, to borrow the term of Sheller and Urry (2006), ‘sedentarised’ dimension: that of where people live. However, to go beyond this perspective and gain a fuller picture of ethnic segregation in Tallinn, we need data that can provide information on the different spaces through which people move.
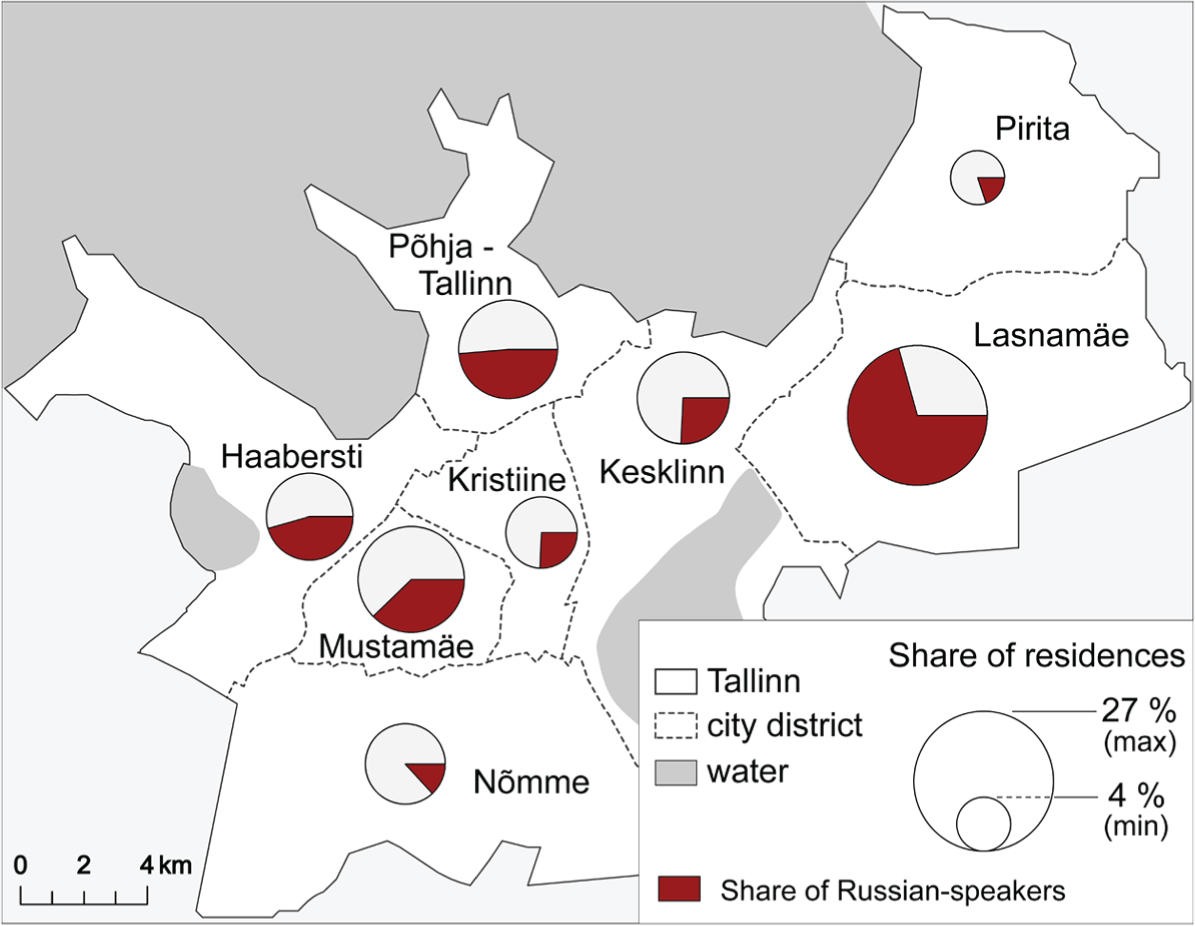
Distribution of residences (n = 393,222) and the share of Russian speakers by city district in Tallinn based on the 2011 Population and Housing Census data.
Mobile phone data
We analyse CDRs supplied to us by the largest Estonian mobile network operator, EMT, which has over half a million clients (95% of Estonia’s 1.38 million inhabitants use mobile phones; see Järv et al., 2012). The database contains records of all outgoing CAs initiated by the phone owner. Each CDR includes the unique identification (ID) number of the phone (randomly generated by the operator for every mobile phone); the exact time and date; and the mobile network antenna that provided the network signal. A supplementary data set of unique ID numbers consisting of each mobile phone owner’s year of birth, gender and preferred communication language with the operator was provided by the operator.
Geographical information for each CDR was obtained from the geographical coordinates of network antennas. The precision of the spatial accuracy of the CDR corresponds to the coverage of the network antenna (Järv et al., 2014: 127). It should be noted that this coverage area is not spatially fixed but varies according to population density. The data covers one calendar year (1 January to 31 December 2009) and was recorded in accordance with Estonian legislation for billing purposes by the operator, and not for the purposes of our study. This research is in accordance with European Union legislation on the use of personal data. 2
Sample selection
In our analysis, we regard language as a proxy for ethnicity and assume that the preferred mobile phone communication language of an individual indicates their ethnicity.
The home and workplace locations of each individual are extracted from CDR data on the basis of the ‘anchor point’ model (Ahas et al., 2010). For each individual in the sample, this model finds the two most frequently used mobile network base stations where mobile phone usage occurs. Furthermore, by taking into account (1) the average time of day and its standard deviations of (outgoing) CAs conducted in each activity location and (2) the spatial relationships between neighbouring activity locations, the model is able to distinguish between home- and work-time (work or education-related) locations.
We focus on the spatial behaviour of the economically active population, i.e. people between 20 and 64 who are living and working in Tallinn. We exclude mobile phone users who changed their home or place of work during the study period to ensure that we were analysing (both daily and non-daily) two-way mobilities of individuals throughout the study period.
Of course, individual mobile phone usage habits vary significantly in temporal and spatial terms as well as in relation to overall amount of phone usage. As these differences could cause spatio-temporal biases that would affect the results, to minimise this risk we selected individuals with relatively similar digital footprints and applied four additional criteria to select individuals who use their mobile phones more than the average user and who have similar calling patterns. We selected individuals who (1) had CDRs for each month of the study period; (2) used their mobile phones on at least 26 different days in each month; (3) generated on average 5.2–9.7 CAs per day in each month (values between the median and Q3); and (4) showed a standard deviation of average CAs per day in each month of less than 1.26 (median value).
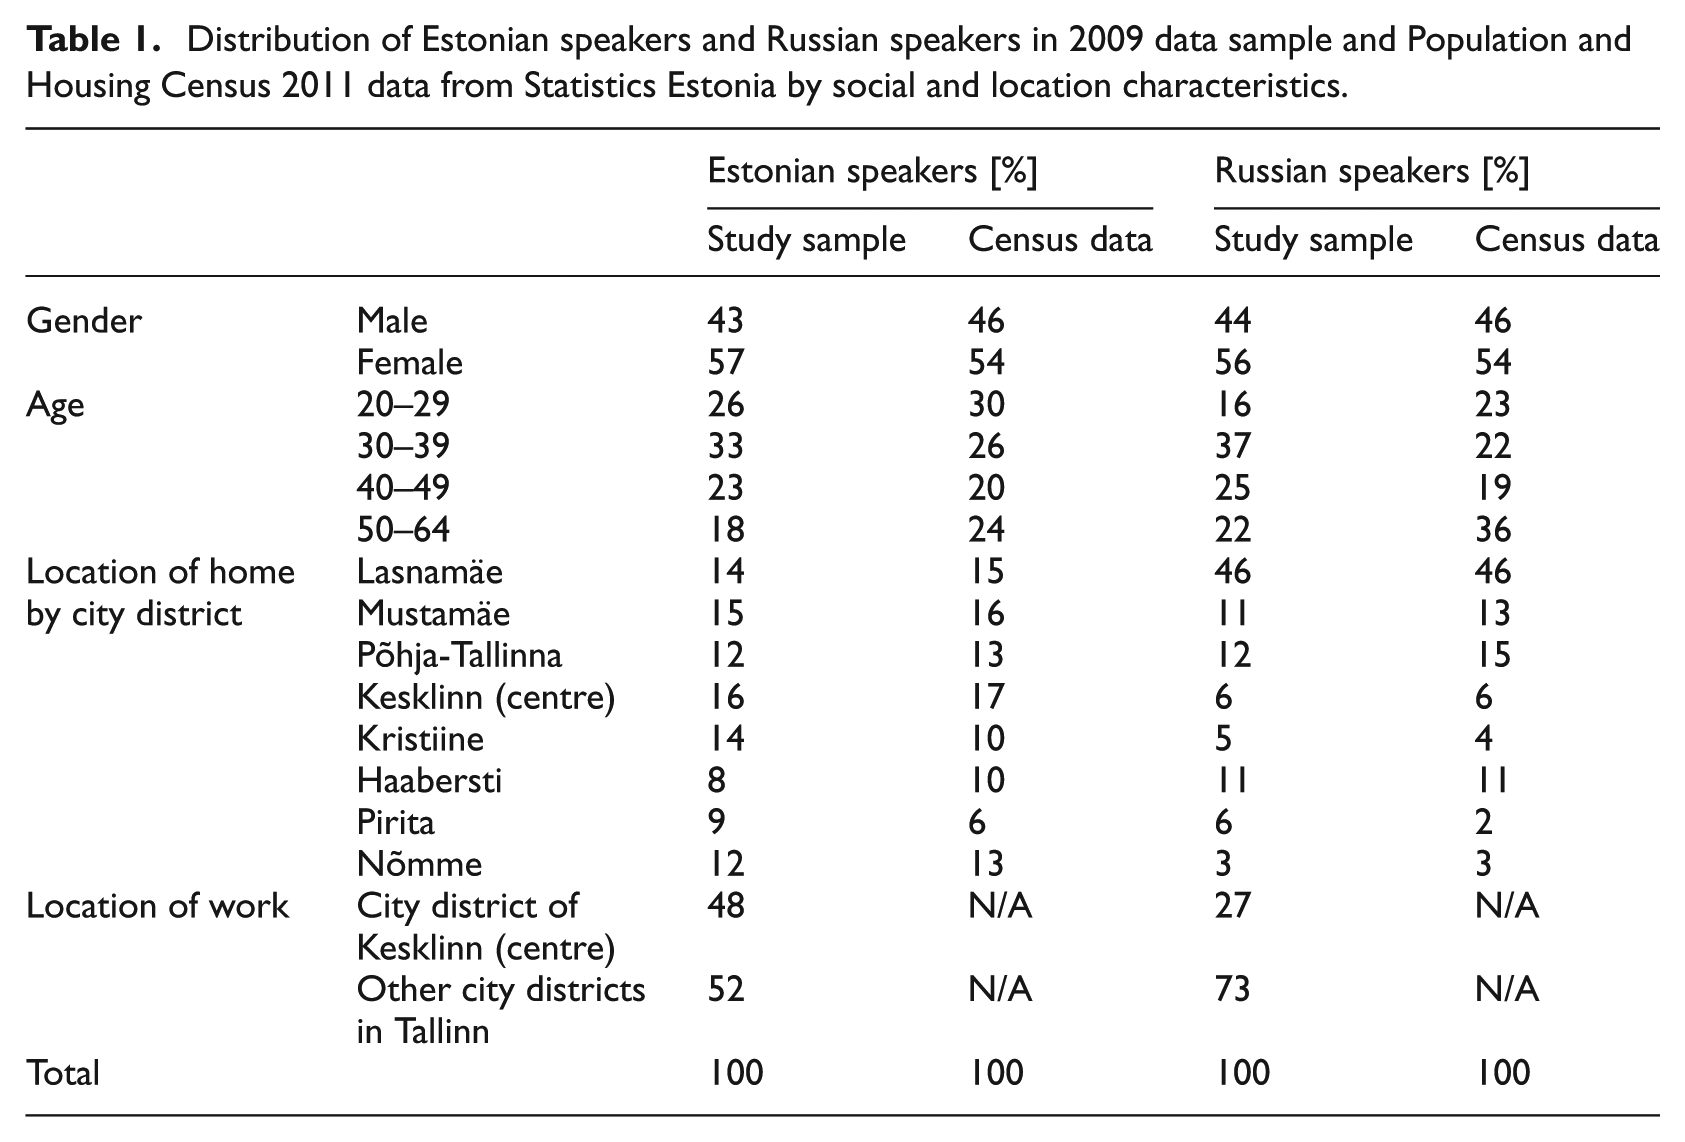
This resulted in a total of 560 ‘comparable’ mobile phone users and 1.3 million CAs during the study period. These individuals, on average, generated 192 CAs per month and 6.6 CAs per day and used their mobile phone on 28.8 days per month. Overall, the sample provides a good representation of the entire economically active population of Tallinn in terms of ethnicity, gender, age and location of home (Table 1). To further minimise possible bias in the model that might result from different mobile phone usage patterns, two fixed factors to describe the mobile phone usage of individuals were included in the analysis (as in Järv et al., 2014): a K-means cluster technique was used to categorise individuals into groups on the basis of the distribution of their CAs in a 24-hour period (Ghour) and in a one week period (Gweek).
Distribution of Estonian speakers and Russian speakers in 2009 data sample and Population and Housing Census 2011 data from Statistics Estonia by social and location characteristics.
Measuring activity locations and activity spaces
In our study, human activity spaces are studied using a straightforward point-based approach that enumerates unique destinations or activity locations and through more complex methods drawn from spatial statistics and computational geometry that measure actual uses of space (Schönfelder and Axhausen, 2010). 3
Here, the term ‘activity location’ denotes the coverage area of the operator’s base station within which a person has used their mobile phone. First, the number of distinct monthly activity locations (MALs) an individual visits is examined. Then, significant daily activity locations (DALs) are assigned from the MALs based on the number of CDRs in each activity location conducted in one month. However, differences in mobile phone usage make it difficult to define the appropriate frequency threshold of CDRs to determine the DALs. Therefore, multiple linkage analysis (MLA), which is derived from mathematical graph theory (see van Nuffel et al., 2009), is used to reveal subdominant locations that are important for the spatial structure of human mobility. Thus, by using MLA, meaningful DALs for every individual can be distinguished from the MALs on the basis of the frequency of the CDRs in each activity location. Finally, we examine the number of distinct annual activity locations (AALs) an individual visits during the entire one-year study period.
Based on the identified activity locations, the spatial extent of the activity spaces of each individual is assessed by implementing the standard deviational ellipse (SDE) technique, which is widely used in human spatial mobility research (Dijst, 1999; Järv et al., 2014; Schönfelder and Axhausen, 2010). The SDE represents the smallest possible area in which activity locations are found with a probability of 95%. To calculate individual SDEs, we implement a weighted measure based on the number of CDRs generated in each location so as to reflect physical presence and time spent in each activity space.
An individual’s annual activity space (AAS) is calculated on the basis of the spatial distribution of their AALs, a monthly activity space (MAS) is calculated on the basis of the distribution of their MALs and a daily activity space (DAS) is calculated on the basis of the distribution of their DALs (Figure 2). Each DAS is assumed to represent the spatial extent of daily habitual routines, building on Djist’s (1999) concept of an ‘actual action space’. Each MAS is assumed to represent both daily habitual routines and the realisation of broader potential spatial mobility, which thus describes the ‘potential action space’ (Dijst, 1999; Golledge and Stimson, 1997) from a monthly perspective. The AAS is assumed to represent overall potential mobility in physical space (Dijst, 1999; Kellerman, 2012a).
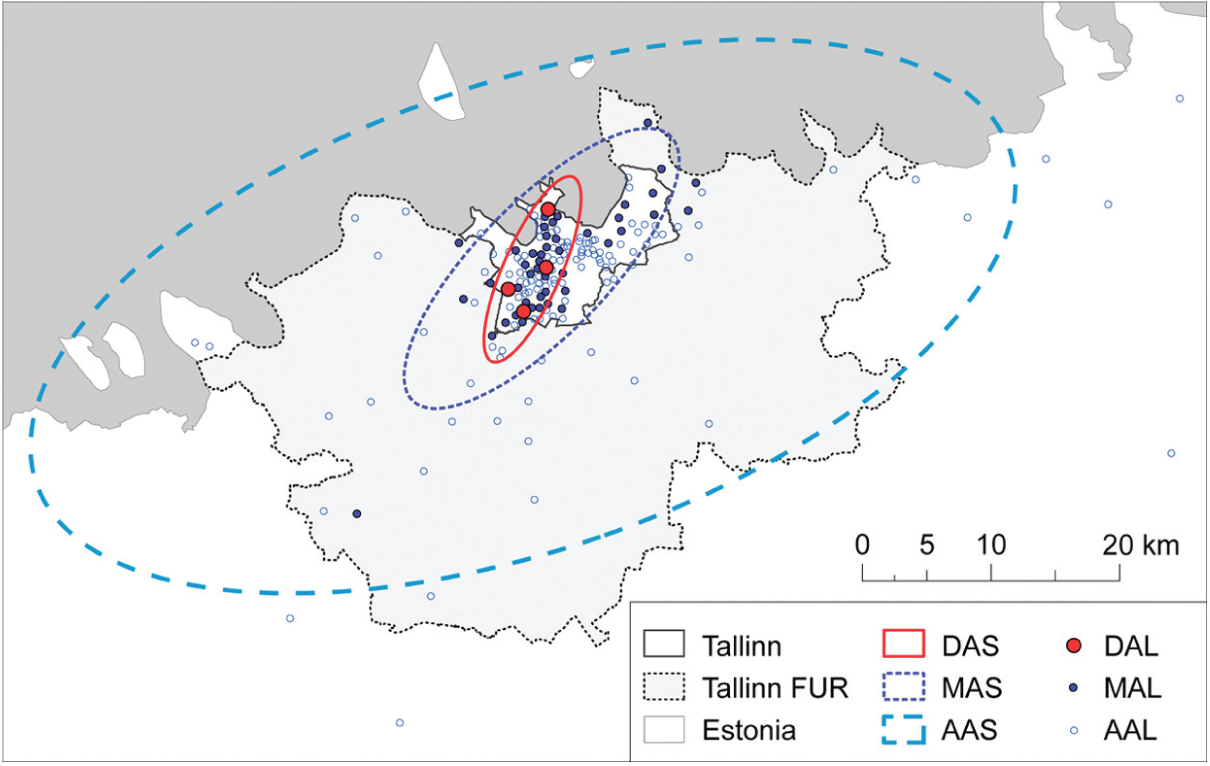
Visualisation of a 43-year-old woman’s annual activity space (AAS) based on her visited activity locations (AAL) in 2009. Her monthly (MAL, MAS) and daily (DAL, DAS) spatial mobility denotes the actual use of space in April 2009.
Data analysis
To assess the spatial extent of activity spaces, we calculate the 12-month mean of each individual’s MALs, DALs, MAS and DAS. However, intrapersonal variability in spatial behaviour can significantly influence typical monthly spatial behaviour (Järv et al., 2014). Thus, in order to find a person’s ‘typical’ spatial behaviour, we exclude months of markedly unusual spatial behaviour compared with typical behaviour during the 12-month period. The intrapersonal outlier month is identified using the median-based modified Z-score method (Iglewicz and Hoaglin, 1993). The modified Z-score (
Using the SPSS 20 software package, we determine which factors influence human spatial behaviour by implementing a univariate general linear model (GLM), where the explanatory power of the model and the effect of the explanatory variables are determined by the partial eta-squared (Garson, 2012). We apply six different GLM models (Tables 3 and 4) and all models include five social variables: gender, age, language, home and work location by city district (see Table 1) and four two-way interactions. Furthermore, we include two fixed factors to describe the temporal mobile phone usage patterns of individuals (Ghour and Gweek, Table 4) as well as four continuous variables to gauge an individual’s mean monthly mobile phone usage, i.e. the share of CDRs generated outside home and work locations (notHW), the mean number of CDRs per day per person (CDRavg), the mean number of days on which CDRs are generated per month per person (CDRdays) and the distance between the individual’s home and workplace location (HWdist).
Results
The geography of activity locations
First, the simple distribution of activity locations by administrative unit reveals that there are marked differences between the two language groups and that these differences slightly increase with the extended temporal framework of this study (Table 2). The results indicate that the activity locations of Russian speakers are more concentrated in Tallinn. 4
Distribution of the unique activity locations of Estonian speakers and Russian speakers based on administrative unit.
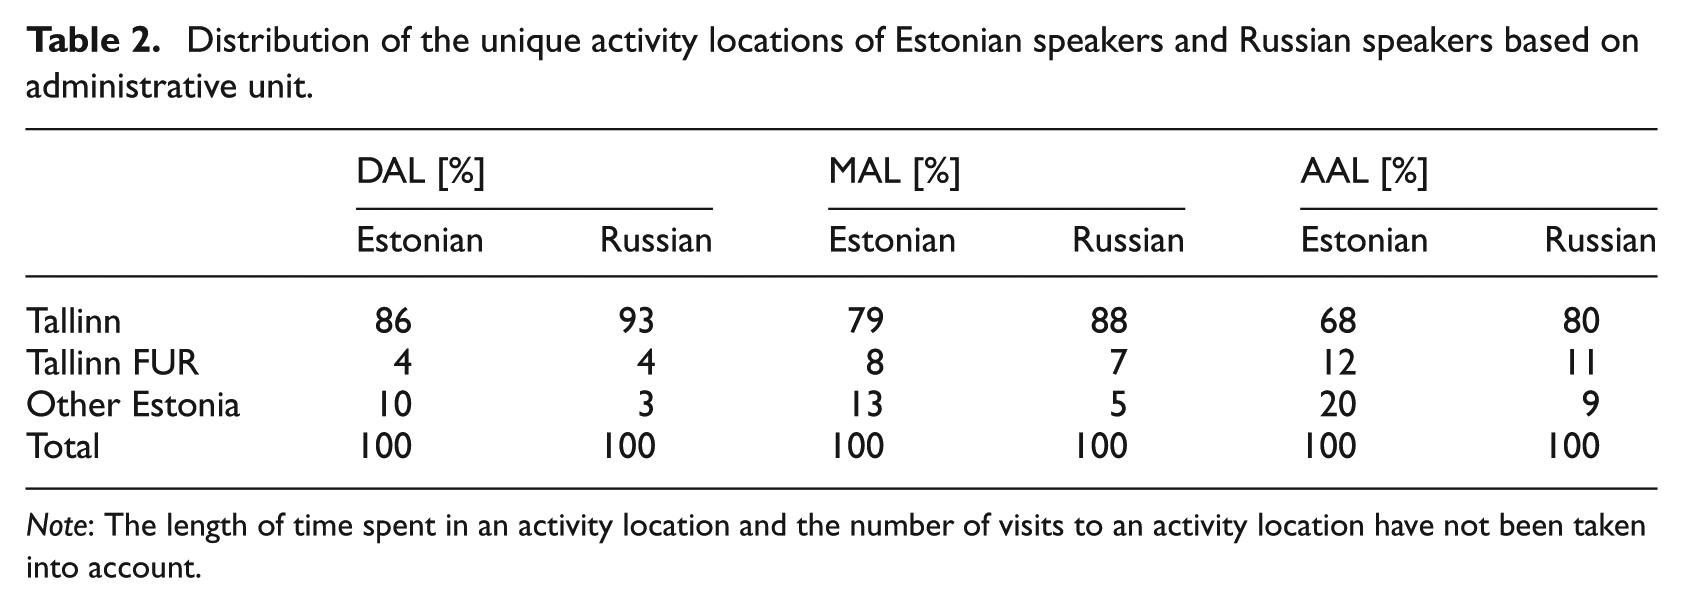
Note: The length of time spent in an activity location and the number of visits to an activity location have not been taken into account.
From the distribution of activity locations that are visited outside of the daily activity space (i.e. outside the city districts of Tallinn where all studied individuals live) throughout the year it can be seen that there are distinct spatial patterns for both language groups (Figure 3). Specifically, there are marked signs of ethnic segregation outside the daily activity space, which are predominantly related to leisure activities. Estonian speakers tend to travel more outside their daily activity space and they also tend to visit a more diverse set of destinations throughout the country. In the following sections, we will look at these essentially place-based results from the perspective of a person-based approach to segregation.

Distribution of activity locations outside Tallinn visited throughout the year at the level of local municipalities. The size of the symbol denotes the relative share of activity locations while the colour represents the share of Russian-speaking visitors.
Unique activity locations of an individual
In general, the median number of DALs was five activity locations with an interquartile range of four to six activity locations, the median number of MALs was 31 locations (interquartile range of 24–39 locations) and the median number of AALs was 131 locations (100–163 locations), respectively.
The three different GLM models in terms of DALs, MALs and AALs (Table 3) that are applied in an attempt to explain the number of activity locations at the individual level are statistically significant, albeit with various levels of explanatory power. The model for DALs has a weak explanatory power, with only 12% of the total variance for DALs explained. This indicates that despite social and residential differences, Russian-speaking and Estonian-speaking people have a similar number of daily habitual activity locations. The models for MALs and AALs each have a much larger explanatory power (72% and 59%, respectively). In addition to diversity in mobile phone usage, the variance is also explained by social factors. Language is by far the most important of these social factors and explains 13% of the total variance in the number of AALs.
Results of GLM analyses of the effect of interpersonal factors on the number of activity locations.
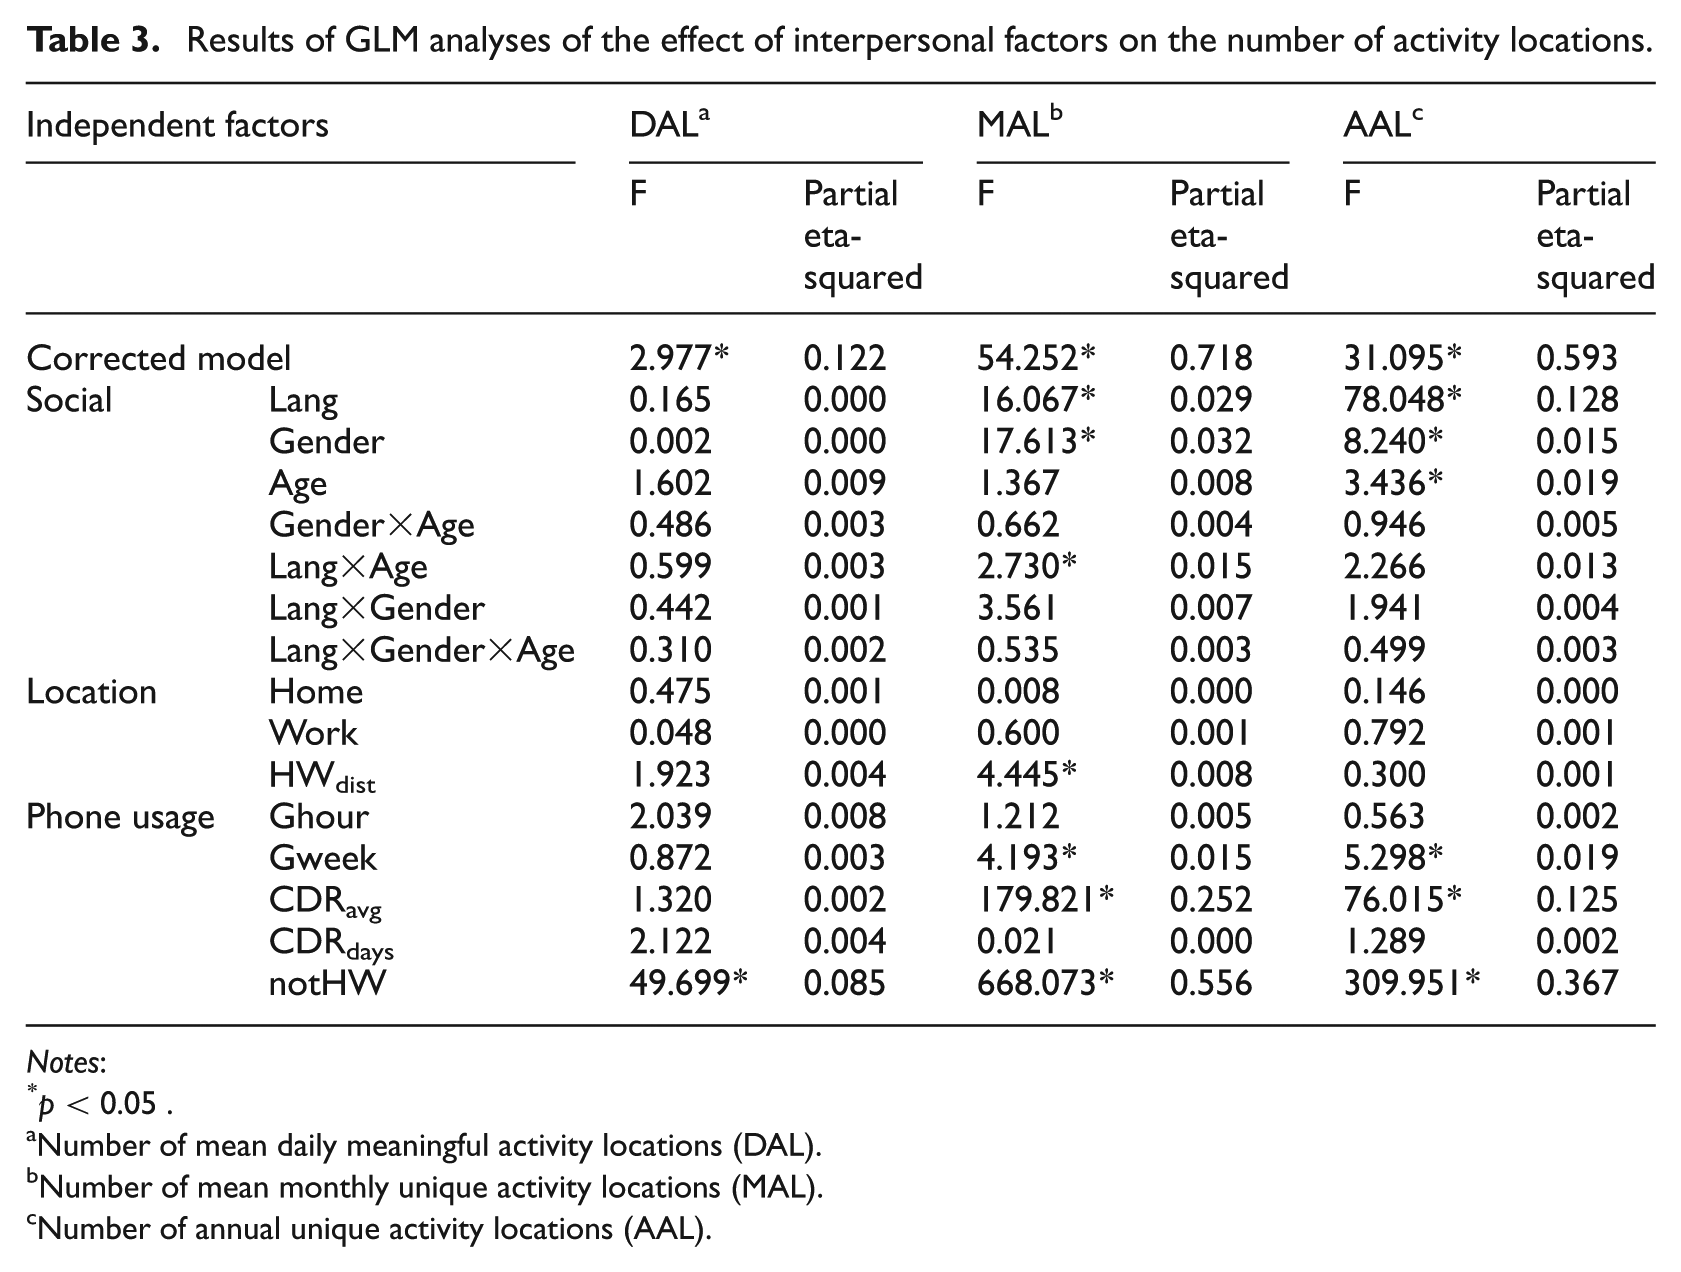
Notes:
p < 0.05 .
Number of mean daily meaningful activity locations (DAL).
Number of mean monthly unique activity locations (MAL).
Number of annual unique activity locations (AAL).
The size of activity spaces
In general, daily, monthly and annual activity spaces are all highly skewed towards greater values (mean > median). For all individuals studied, the median size of the DAS was 34 km2 with an interquartile range of 14–115 km2, the median size of the MAS was 332 km2 (97–2214 km2) and the median size of the AAS was 2715 km2 (679–8774 km2), respectively.
The three models that are applied to examine the size of the activity spaces at the individual level are also statistically significant (Table 4), albeit with weaker explanatory power than those that explain the number of locations. This appears to be primarily because of the smaller effect of mobile phone usage on the variance of the size of activity spaces. Conversely, the effect of language on the variance of the size of activity space is larger. The GLM model for the DAS explains 22% of the total variance in the size of the DAS, whereas language and the distance between home and workplace explain 4% and 6% of the total variance, respectively.
Results of GLM analyses of the effect of interpersonal factors on the size of activity spaces.
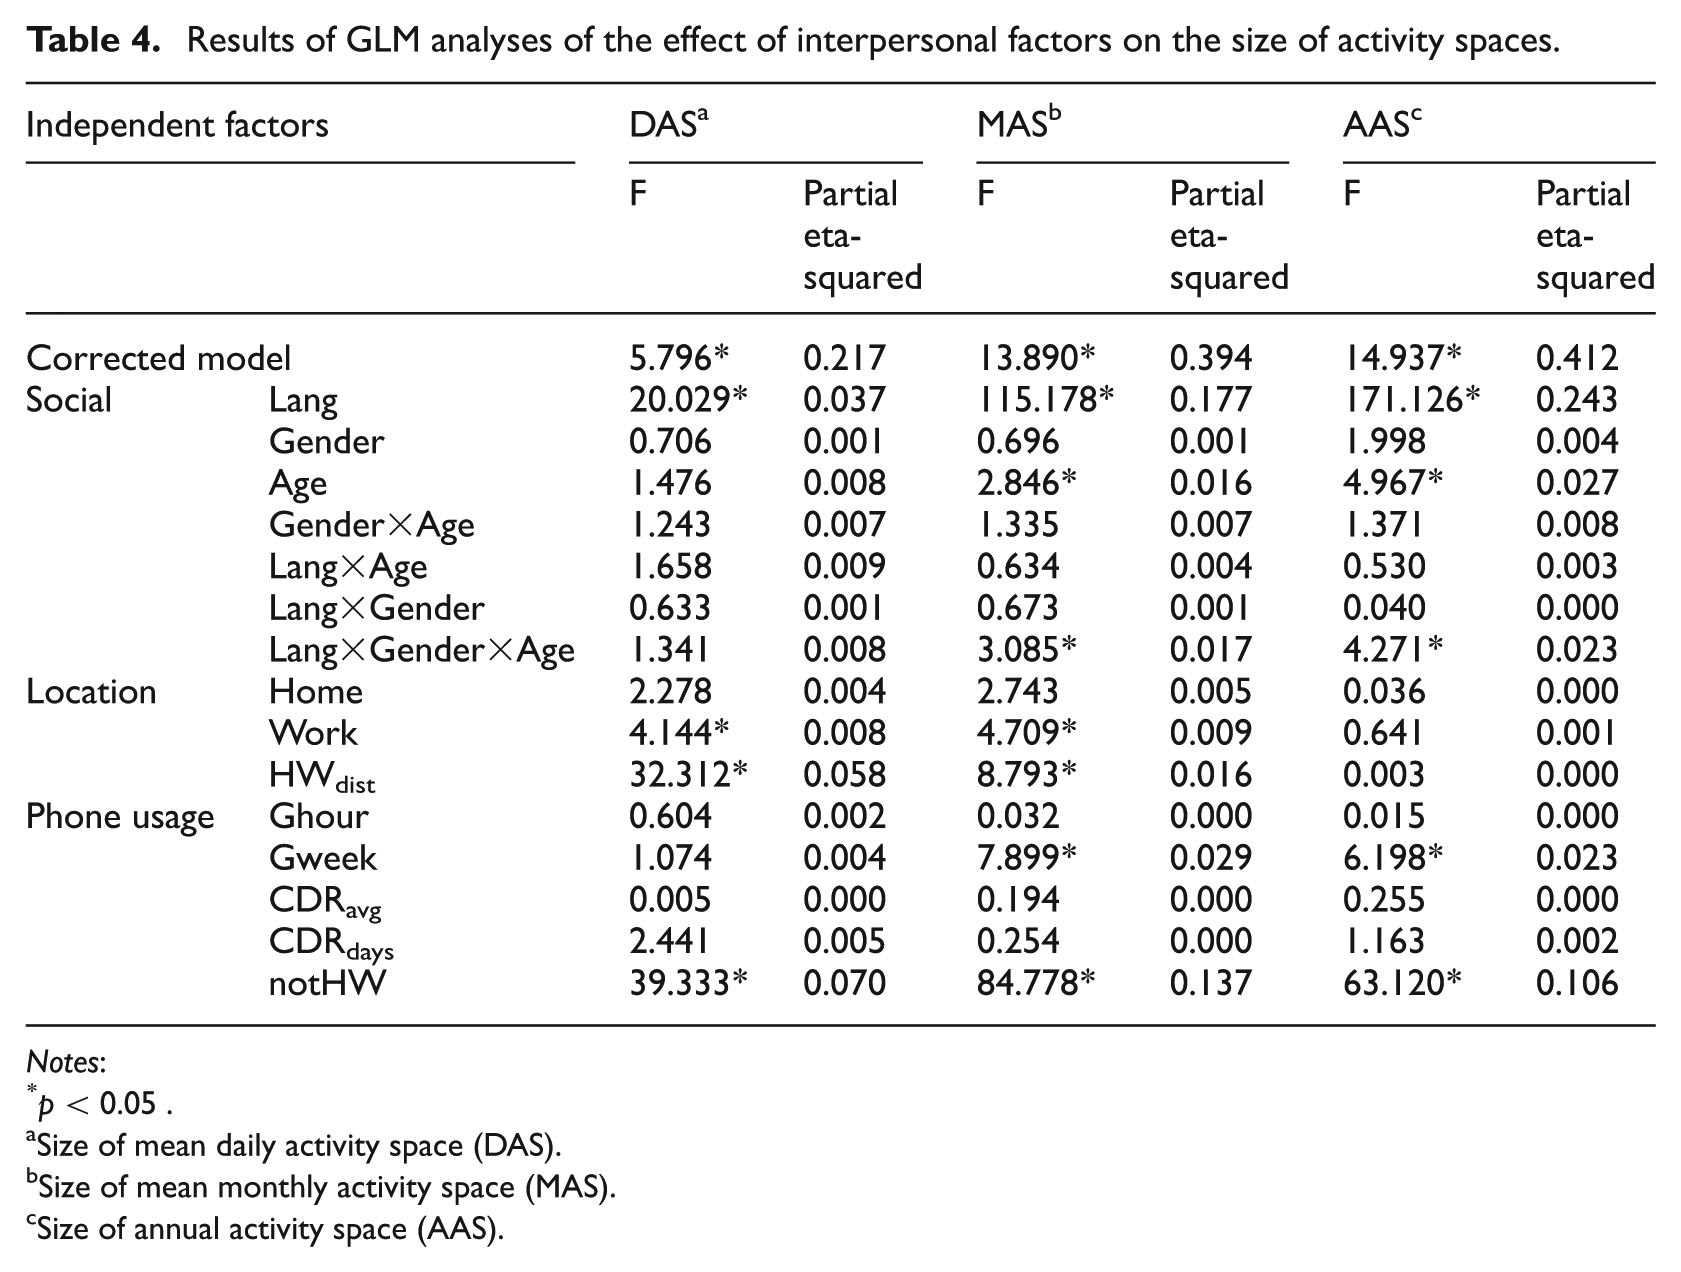
Notes:
p < 0.05 .
Size of mean daily activity space (DAS).
Size of mean monthly activity space (MAS).
Size of annual activity space (AAS).
The GLM models for the MAS and the AAS have moderate explanatory power in that they explain the variances in the size of the activity spaces by up to 39% and 41%, respectively. Age has only a weak influence while language explains 18% of the total variance in the size of the MAS and 24% of the total variance in the size of the AAS. In general, the spatial extent of the activity spaces varies significantly among individuals, however, significant differences in the size of activity spaces between language groups are evident; Estonian speakers have noticeably larger activity spaces than Russian speakers for all time periods (DAS, MAS, AAS).
Discussion and conclusions
Segregation is a multifaceted phenomenon where social and spatial dimensions are interrelated. Given the changing form of segregation and societal developments at large, the exploration of the spatial mobility of individuals is becoming increasingly important in gaining a more comprehensive understanding of socio-spatial inequalities (Kwan, 2013; Urry, 2007). This implies that researchers need to move beyond reliance on purely place-based analyses and also pay attention to person-based segregation to better understand segregation processes.
This paper has aimed to contribute person-based segregation research in line with Wang et al. (2012) and Palmer et al. (2012), by attempting to reveal differences in the actual use of space. Thus, we have demonstrated how mobile phone-based data has the potential to reveal hitherto hidden spatial differences between social groups and thus advance segregation research. Furthermore, we demonstrated the importance of the temporal perspective in segregation research (Kwan, 2013) and how the proposed methodology allows us to focus on social differences in personal activity spaces from a prolonged and multilayered time perspective (cf. Wang et al., 2012).
Our main findings are threefold. First, we find that – except for daily habitual activity locations – there are significant ethnic differences in the spatial extent and shape of activity spaces, even after controlling for other variables: Russian speakers visit significantly fewer activity locations and these activity locations are more spatially concentrated compared with those visited by Estonian speakers. Interestingly, the influence of language is evident on daily activity space even though we focused on economically active individuals who have relatively high mobile phone usage and a workplace. The smaller extent of spatial mobility observed in the Russian-speaking minority may indicate lower social status (Kaufmann et al., 2004) in relation to their daily use of space, whereas their monthly and annual use of space may indicate their lower capacity of ‘potential mobilities’ as a form of capital (Kellerman, 2012a: 180). Furthermore, the more concentrated spatial mobility of Russian speakers may indicate more limited integration into society that could reflect limited spatial learning through experience (Valentine, 2008).
Second, from a geographical perspective, the activity locations of Russian speakers are predominantly in Tallinn when compared with those of Estonian speakers who travel more widely in other parts of the country. Furthermore, when Russian speakers do journey beyond the confines of Tallinn, those visits are concentrated in specific regions of Estonia. In contrast, Estonian speakers visit a greater number of locations outside Tallinn; these locations are dispersed throughout the whole country and the distribution of visits to them is more equal. This indicates that beyond activities associated with daily life, the activity locations of Russian speakers tend to be concentrated in those regions of Estonia where Russian-speaking communities are well established (Kulu, 2004). This may be the voluntary choice of Russian speakers and may indicate the spatial distribution of the social networks of Russian speakers (Lee and Kwan, 2011). On the other hand, it may denote the existence of significant social constraints that determine the spatial behaviour of Russian speakers, such as the general absence of Estonian language skills among the Russian-speaking community in Estonia (Vihalemm, 1999), language skills are often seen as a prerequisite for human mobility (Kaufmann et al., 2004). Likewise, because of the communication barrier, Estonian speakers may be less likely to visit regions where Russian-minority communities are the majority population. A fuller understanding of the underlying factors that influence these patterns of spatial mobility would require further research, which could, for example, explore power relations between the two ethnic groups (Valentine, 2008; Vihalemm, 1999).
Third, ethnic differences in spatial behaviour tend to increase when the study period is extended: the longer the study period the stronger the differences in spatial behaviour between ethnic groups. This indicates that ethnic differences in the spatial behaviour of individuals may be even more evident beyond the daily habitual use of space. This highlights the need to understand segregation more comprehensively through, for example, an additional focus on spatial mobility beyond the fixed patterns of daily routine behaviour, including leisure-related and other activities that are located further away and/or take place over a longer periodicity as part of spatial experience (Kwan, 2013). However, the above explanation should be treated with caution because this study included a relatively small number of personal variables and hence additional research is needed to support or refute these assumptions.
Finally, we have demonstrated how our methodology can be employed in the field of (ethnic) segregation research. Despite several advances in the use of CDRs in person-based segregation research, there is still a need to further develop the methodology and theoretical framework to improve its applicability in segregation studies. For example, as also discussed in Järv et al. (2014), the peculiarities of individual mobile phone usage patterns can affect the results if they are not taken into account in the analysis. Although our aim was not to offer an explanation of the underlying causal factors of ethnic differences in human spatial behaviour, our study findings have highlighted several questions that could be investigated in future research. For instance, studies that use CDR data in combination with additional qualitative data on personal background (e.g. socio-economic attributes, life values, preferences, attitudes) would significantly help to improve our understanding of person-based segregation. Furthermore, it is essential to incorporate classical segregation indices (Palmer, 2013) in such studies and to consider temporality (Wang et al., 2012) in addition to the spatial perspective.
In the case of Estonia, our findings may be useful to policy-makers who aim to foster the integration of the Russian-speaking minority into Estonian society. Socio-spatial segregation that restricts encounters between the two ethnic groups, such as the language barrier that prevents Russians from communicating in Estonian (Vihalemm, 1999), could be addressed through spatial experiencing during non-habitual activities. For example, experiencing a wider range of locations and the consequent potential for informal encounters and interaction may help engender positive attitudes between these two groups and foster Estonian language skills among the Russian-speaking community.
Footnotes
Acknowledgements
The authors thank the mobile network operator EMT and Positium LBS for providing the data used in this study. The authors would also like to acknowledge the valuable comments received from the four anonymous reviewers. All remaining errors are ours.
Funding
This research was supported by Estonian Science Foundation Grant IUT2-17, EU Regional Development Foundation, Environmental Conservation & Technology R&D Programme project TERIKVANT (3.2.0802.11–0043) Research Grant of Estonian Academy of Sciences, and EU Regional Development Foundation project ‘Real-time Location-based Big Data Algorithms’ (3.2.1201.13-0009).