
Abstract
We examine Mexico City’s urban structure through a composite index by combining two previously existing metrics: one derived from the Urban Network Analysis tool (UNA), recently published by MIT researchers, and the other, using an Entropy Index, which in essence, represents the mixed land-use degree. The proposed composite index embodies a different approach from previous methods reported in the literature because it uses disaggregated data at the unit level, performs weighted cluster calculations through a network data set, and incorporates a mixed land-use metric. This method was developed in order to test if the urban arrangement showed signs of a polycentric condition under a particular centrality standpoint. We observed that Mexico City has a relatively weak polycentric urban condition.
Introduction
In recent years, many cities have undergone a job- and population-decentralisation process that has adopted a more polycentric form (Anas et al., 1998) which cannot be explained by the traditional monocentric model developed by Alonso (1964) based, in turn, on von Thünen’s analysis (Roca et al., 2009). Most literature refers to polycentric urban structures as areas where employment is concentrated not only in the CBD, but in several subcentres (Giuliano et al., 2007; McMillen, 2001) defined them in economic terms as clusters of activity of ‘sufficient magnitude to influence land prices and hence spatial form’ (Agarwal et al., 2012: 441) or as clusters of activity with considerably larger employment density than neighbouring areas with a significant effect over total job employment function (McMillen, 2001). Although monocentric cities could have decentralised jobs, according to McMillen those are not clustered together forming subcentres.
It is argued that new centralities emerge because in the beginning several advantages in producing and consuming in geographically central clustered structures exist. Later, this ongoing concentration generates diseconomies because of congestion and higher central land values, destroying the original qualities of centrality that first led to the creation of central clusters. In the end, those diseconomies cause dispersion and lead to the formation of new centralities far away from the original ones (Camagni, 2005; Fujita and Mori, 1997; Fujita et al., 2001; Glaeser, 2011; Muñiz et al., 2005; White, 1999). It seems that those agglomeration economies tend to form networks, which some authors claim to constitute the ultimate stage of the polycentric paradigm because previously dependent nodes from the main centre become less dependent, reducing the probability of daily commuting and thus, becoming more ‘sustainable’. Despite those assertions, it has not been comprehensively proven whether polycentric structures are better or worse in terms of key urban performance measures such as accessibility and travel sustainability compared with traditional monocentric structures (Parr, 2004). For instance, in a polycentrism and commuting study, comparing seven French urban areas, Aguilera and Mignot (2004) found that the average commuting distance on those subcentres has risen since their consolidation.
Another dimension regarding polycentric structures is that related to its origin. At least two types of polycentric structures can be distinguished: one arose from functional integration of previously independent city cores (Clark and Kuijpers-Linde, 1994), and another emerged from original towns’ engulfment by a central core growth (Champion, 2001). Despite Parr’s definition of Polycentric Urban Regions (PUR) as a plurality of centres linked together within a subnational territory under specific linking conditions (i.e. similar sized cities, centre specialisation), based on Giuliano et al. (2007) and McMillen (2001), megacities – such as the Mexico City Metropolitan Area (MCMA), emerged from original towns’ engulfment but not fulfilling with all Parr’s linking conditions – could have a certain polycentric degree. Acording to Agarwal, all metropolitan areas are polycentric (Agarwal et al., 2012), but to different extents.
This issue takes us to the scaling problem. Anas et al.’s (1998) outstanding paper stated that ‘[…] it becomes somewhat arbitrary to say how large a concentration of employment is required to define a location as a subcenter’ (1998: 1431). And even though they approach the fractal theory as a way to describe urban spatial patterns – Batty and Longley argue fractals can be useful for that purpose because of the self-similarity across a range of scales, but they point out urban fractals are product of our mathematical imagination (1994: 96) – they assert that the definition of such clusters is not an easy task because subcentres’ detection depends completely on the spatial scale and on the spatial unit at which the phenomenon is measured. In this regard, Shearmur et al. (2015) argue that quantitative methods, based on complex statistical analysis for measuring job subcentres, have a high degree of subjectivity (Johnston, 1968), and that there cannot be definitive answers for determining subcentres within urban areas or even a degree of polycentrism (McMillen and Smith, 2003).
Regarding this polycentric paradigm, Mexico City’s authorities have just promoted the development of several urban thematic centralities called ‘ZODES’ (Economic and Social Development Zones) as a public policy measure expected to reduce motorised mobility, increase density and improve economic performance. At least, two ‘ZODES’ have been publicly promoted: ‘The Health City’ and the ‘City of Knowledge’. They are supposed to be nodes of economic progress based on a polycentric model (GDF, 2013), although specialised literature underline that those alleged benefits have yet to be confirmed (Parr, 2004).
At the same time, the National Institute of Statistics and Geography of Mexico (INEGI) has published a national geo-referenced economic database, disaggregated at economic unit level, which, in conjunction with network analysis tools, allows for the development of composite indexes that could eventually assist planners to mainstream the above-mentioned planning policies.
In this sense, there have been several efforts to develop consistent methods of polycentric urban form detection, primarily through job subcentres formation. The main difference between these and the proposed method is the use of disaggregated data, which may prevent issues such as ecological fallacy, a problem which ‘occurs when it is inferred that results based on aggregate zonal (or grouped) data can be applied to the individuals who form the zones or groups being studied’ (Openshaw, 1983: 8). Another difference is the incorporation of a mixed land-use index, which integrates theoretical notions of how an urban centrality should be conceived nowadays.
Although most of the previous methods were developed in the USA, some researchers in Mexico have undertaken studies with what appear to be contradictory conclusions. While Aguilar and Alvarado (2005) found polycentric evidence in the MCMA using tract-level data, Suárez and Delgado (2009), using a job-to-housing ratio, found little evidence of this. In this regard, the proposed index seeks to identify not just job subcentre formations, but urban centralities without depending on deep local knowledge. We presume this index will be useful to assess Mexico City’s alleged polycentric condition, for a better understanding of the urban structure, as well as to support the ongoing urban and planning process within the MCMA. Facing the fact that there is no general methodology for determining subcentres, and that all of them have a certain degree of bias, this work focuses on presenting another way to understand urban structure, mainly through redefining the centrality concept, and by doing this, examining if the MCMA can be said to have a polycentric condition.
This paper is divided into seven sections. In the second part we define the urban centrality concept used in this paper. The third section describes Mexico City’s urban and economic structure and relates the proposed composite index with ongoing planning policies. The next section enlists some previously used methods for measuring urban centralities. The fifth part describes the composite index used in this research. Part six presents results of the applied methodology, and part seven offers a set of conclusions related to both Mexico City’s alleged polycentric condition and the methodology itself, discusses shortcomings of the proposed method and outlines future improvements.
Redefining urban centrality
Nowadays, since more than half of the world population lives in urban areas (Soja and Kanai, 2008), and cities in advanced economies have increasingly become more service-oriented at least since 1940 (Hall, 1997), we believe there is need for a redefinition of the ‘centrality’ concept.
While for Christaller centralities were places where a minimum threshold population was required to generate the supply of a good – limited by a range in which consumers are willing to go in order to get a good or a service (Carter, 1987) – for others they are the spatial organisation of key points in which different production and consumption exchange processes take place, where urban activities and flows are most concentrated, and where the most intense social activities happen (Castells, 1974; Polydorides, 1983; Terrazas, 2010). Centrality is the property of some places of polarising space and attracting people, objects, functions and information (González-Arellano, 2010).
Some of the above-mentioned urban centrality definitions imply that, for a significant exchange to take place, a considerable gathering of people is needed. Others assume that a cluster of activities per se is a strong enough driver to attract people. Either way, it seems that the concentrated interaction between ‘activities’ and ‘people’ is essential for centrality. But in order to have these ‘intense social activities’, another complementary dimension of urban centrality could be retaken from Jane Jacobs. One of the most important principles she defended was ‘[…] the need of cities for a most intricate and close-grained diversity of uses that give each other constant mutual support, both economically and socially’ (Jacobs, 1961: 12). What she learned from direct observation was that this diversity would be achieved by allowing districts to have more than one primary function in order to avoid overspecialisation; thus, to have vibrant 24/7 urban environments.
Today, suburban and exurban postindustrial spaces in most places around the world are characterised by a relative lack of mixed land use, a general absence of compact urban fabrics and a marked deficiency of multi-functional spaces, features that Jacobs and other authors have claimed to be essential to the formation of urban central places (Gandelsonas, 1999; Harvey, 1990; Soja, 2000). Ironically, these kinds of emerging job-clusters are taken into account when describing a polycentric condition, at least within the MCMA case. According to Zhao and Lu (2011), relatively recent studies have observed there is a positive correlation between higher mixed land-use developments and reduction of motorised travel; that a more balanced job–housing ratio is related with high proportions of non-motorised travel; that urban form pattern (compact–dispersed) has an impact on travel mode choice and number of journeys; that a compact city model has positive impacts on the natural environment; that higher density models can effectively reduce distances among origins and destinations; and that high density is directly related to a more intense public transportation use and to more pedestrian journeys.
Given this ‘new’ sustainable paradigm, urban centralities are crucial elements not only for public policy intervention in order to improve urbanites’ life, but for reducing energy consumption, elevating cities’ competitiveness through reduction of traffic congestion (by bringing closer origins and destinations), and for making a more rational use of territory. Also, this model would effectively allow what other researchers claim to be one of the main reasons for being gathered in a city: innovation process through traditional face-to-face contact (Camagni, 2005; Florida, 2003; Glaeser, 2011; Storper and Venables, 2002).
Within this context, our proposed urban centrality definition is one in which there is a critical mass of people, activities, flows, facilities and infrastructure, that allows the most significant economic, political, cultural and social exchanges, within a relatively mixed land-use, multi-functional and compact urban fabric environment, which widen the possibilities of reducing motorised travel. Spaces defined as ‘Centralities’ should have the capacity not only to attract trips, but also to retain them (i.e. via mixed land use). Centralities should not be conceived today just as employment clusters, but as spaces where the most intense activities of urbanites take place (Florida, 2003; Glaeser, 2011). Accordingly, the proposed CCI integrates two variables that greatly represent the above-mentioned dynamics.
Mexico City’s economic shift
The MCMA structure, which now comprises 16 districts (delegaciones) of the Federal District (FD), 59 municipalities of the State of Mexico and one of Hidalgo, has been directly related with the historical concentration of administrative powers within Mexico’s central valley since Aztec times. Its urban growth process began during the 1950s and is basically due to massive migration from the countryside to the suburbs and to metropolitan peripheries. Within this metropolisation process, several native towns, which today serve as second- or third-order centralities, were literally engulfed by the urban sprawl (Aguilar and Ward, 2003; Lindón, 1997).
Mexico City’s physical expansion can be credited with the accelerated economic and demographic growth that took place during the midst of the 20th century; a gentrification process that primarily pushed low-income population sectors towards the periphery; a policy of restricting industries within the FD boundaries which encouraged factories to settle down within the State of Mexico during the 1960s and 1970s; and a demographic boom during the 1980s (Rébora, 2000). This depopulation of the historical city centre led to a rapid population growth within the State of Mexico municipalities and its redistribution among metropolitan peripheries (Aguilar and Ward, 2003).
According to several authors, both the MCMA and the FD have gradually decreased its relative share in manufacturing since 1970 (Connolly, 1993: 58), (Pradilla, 2000: 40). For Aguilar and Ward (2003), there has been a dispersion of manufacturing activities and an emergence of new urban centres at a metropolitan level. There has also been a clear trend in the rise of value-added services employment within the central area of the MCMA. This has not meant an overall disappearance of manufacturing, but a consolidation of light manufacturing, especially within the metropolitan periphery. Hard data seem to confirm this: commerce and service related jobs reached 77% of total jobs in the FD in 2009 while this proportion reached 67% within the State of Mexico (INEGI, 2014).
This industrial employment decentralisation process has triggered several structural changes for the MCMA. One indirect effect is the emergence of new mono-functional settlements (social housing) sprawled over the vast territory, clearly disconnected from the transport network (Monkkonen, 2011). While the majority of industrial activity is now located in urban fringes and in some metropolitan corridors, old industrial clusters and sectors in the FD had evolved into service, commerce or residential areas, accentuating the gentrification effect. For Casado (2012), there has been a relative job decentralisation process towards the metropolitan periphery, but in a lesser extent to the residential one. This has been also noted by Suárez and Delgado (2009), concluding that there is little evidence to establish whether the MCMA is largely polycentric, because identified employment potential subcentres only accounted for less than 2% of the total numbers of jobs (Suárez and Delgado, 2009: 2208).
One of the main reasons for their findings is that most formal employment of the MCMA (nearly 70% of economic units with more than ten employees per unit) remains heavily concentrated within a few central delegaciones of the FD. This employment hyper-concentration (Aguilar and Ward, 2003) contrasts with social housing policy developed during 2000–2010, which resulted in construction of several social housing units located very far away from job centres (Monkkonen, 2011). As these new social housing units had no nearby large employment subcentres – subcentres that Aguilar and Ward (2003) consider as providing cheap labour and serving as dormitory towns – the immediate effect of this policy has been an increase of commuting distances to an average of 21.9 km from social housing units to centric jobs destinations (Eibenschutz and Goya, 2010); an increase in transportation expenses of low-income families (ITDP, 2012); an exacerbation of socioeconomic segregation between the centre and the periphery (Monkkonen, 2012); and the emergence of uninhabited and abandoned social housing units that, in certain municipalities, has reached 45% of total housing stock (INEGI, 2014).
Both the Federal Government and various local governments have recently been developing specific policies to diminish negative impacts of these failed housing programmes. For example, the Federal Government is trying to induce a more mixed land-use and compact urban development under a polycentric model to reduce abandoned housing rate (DOF, 2014), while the FD has designed the above-mentioned ZODES programme, which seeks to reduce mobility by bringing closer origins to the most frequent destinations (such as job centres) via rising density, land-use diversity and inducing subcentres’ economic specialisation (GDF, 2013). In this sense, several studies have shown that there is evidence of a significant association between higher densities, mixed-use development, more circulation patterns and pedestrian ‘friendly’ environments with less car travel (Boarnet and Crane, 2001: 824). The assumption is that fewer car trips and a rational use of public transportation could benefit urban environments by shortening travelling distances. Moreover, Guerra recently found that even MCMA households located in those low-diversity and inaccessible peripheral neighbourhoods are among the least likely to drive (because of low incomes), when they drive, they drive ‘a lot’ (2014: 13). Guerra argues that if this population were able to shift travel mode to a private car, in the long run this would eventually collapse the whole metropolitan mobility system.
All studies seeking evidence of a polycentric condition within the MCMA (Aguilar and Alvarado, 2005; Aguilar and Ward, 2003; Casado, 2012; Shearmur et al., 2015; Suárez and Delgado, 2009) have found the formation of job subcentres. At the same time, all of them share the conclusion that the MCMA is still dominated by a very strong CBD, bringing on a very unbalanced urban structure where most of the people living on the periphery need to commute long distances. But as those studies are mostly job-based, they are not able to tell in which job subcentres there is a chance for implementing the above-mentioned public policies. And even though the MCMA had no polycentric conditions, according to Parr (2004), their results show signs of weak job-clustering formations, which with correct policy intervention, could eventually lead to a stronger polycentric structure.
Detecting urban centralities: Some previous methods
Among the most widely used methods on employment data are those developed by McDonald (1987) and by Giuliano and Small (1991). While McDonald proposed empirical criteria to identify urban employment subcentres by using gross employment density and employment–population ratio, the latter determines minimum thresholds for employment density and total amount of jobs. Census tracts, which surpass the threshold, are identified as potential employment subcentres.
Other evolving works, such as Bogart and Ferry (1999), defined centres as places with both high-quantity and high-density employment. Their research method, applied in the City of Cleveland, extended Giuliano and Small’s process and used a location quotient to identify the economic specialisation of subcentres. Muñiz et al. (2005) and García-López and Muñiz (2010) have been working with employment density- and threshold-derived methods to determine Barcelona’s polycentric condition. This has also been the case for the MCMA, where Aguilar and Alvarado (2005) used a minimum employment threshold to determine subcentres. While these methods have been criticised because of cut-offs determining whether a specific agglomeration of employment actually constitutes a differentiated cluster, Alpkokin et al. (2007) seem to have found a way of solving this issue by inspecting plots of logarithmic normalised employment density against rank size. By doing so, they can determine, by observed slope, the most suitable cut-off that defines the cluster area.
For the MCMA, Graizbord and Acuña (2005) proposed a method that inspects outstanding commuting flows in order to determine urban subcentres. This technique utilises a mobility survey (EOD-07) aggregated to municipal level. Also, Suárez and Delgado (2009) identified employment subcentres based on both peaks in the employment density gradient and capacity to attract working trips, not by using the EOD-07 survey but by evaluating the jobs–housing ratio. González-Arellano (2010) developed a visual model based on the Hägerstrand (1970) space–time geographic theory, in which urban centralities are the outcome of concurrence of outstanding flows, based on EOD-07 survey data. When several single trips come together in both space and time, and form what Hägerstrand called a ‘station’, it can be accounted as an urban centrality.
Thurstain-Goodwin and Unwin (2000) located town centres using Kernel Density Estimation (KDE) and by developing a centredness index. Batty (2001) explored the emergence of polynucleated clusters using agent-based simulation and, more recently, Crucitti et al. (2006) and Porta et al. (2012) have been using a multiple centrality assessment method (MCA) where centralities are first measured along network data sets and then transformed into a raster image through KDE in order to correlate data with economic activities. This model, as the SANET network analysis toolbox developed by Okabe et al. (2006), only uses streets as arcs and street junctions as nodes, leaving the buildings outside the equation.
While ‘static’ methods assume beforehand that people would be attracted to a specific geographic spot because of the presence of an economic cluster (jobs), ‘dynamic’ approaches assume that people go where there is ‘something’ that is attracting them. Our proposal adds a diversity vector to the employment subcentre, modifying the centrality concept by integrating the possibility of more self-restrained neighbourhoods.
Centrality–mixed land-use composite index
The GIS tool
Sevtsuk and Mekonnen (2011) developed an ArcGis toolbox called Urban Network Analyst (UNA). Unlike SANET or other topological network analysis tools, whose main feature is to carry out spatial analysis over the network using only arcs (streets) and nodes (street junctions), UNA introduces buildings as a third analysed element. They argue that previous tools have been insufficient when explaining specific urban phenomena because of a lack of one main urban element: the building, which is the place where most trips originate and end. While other network analysis tools that only use nodes and arcs would return the same values for different buildings situated along the same arc, UNA allows for differentiated outcomes depending on building location. UNA also allows buildings to be weighted depending on their particular characteristics, such as volume, employment, etc. (Sevtsuk and Mekonnen, 2011: 4).
The UNA toolbox calculates different measures of centrality, quantifying the importance of each node in a graph. This allows the measurement of how centric each computed element is related to other adjacent elements. This tool computes five different centrality metrics: Reach, Gravity, Betweeness, Closeness and Straightness (for a detailed description of each algorithm used, please refer to the UNA toolbox manual in Sevtsuk and Mekonnen, 2011). Each algorithm can be computed with restrictive variables (buffer, decay) and can also be weighted by specific attributes.
The data
INEGI has collected and publicly released national geo-referenced data on economic units. Main attributes of this data set include location, range of employees and a standard classification of economic activity. This database, called Directorio Nacional de Unidades Económicas (DENUE 2009), was used to detect clusters along the network and to develop a mixed land-use index (entropy index).
The second data source used was the Sistema de Información para la Consulta Censal (SCINCE 2010), which is a national database containing socioeconomic data. From this source, the street network to create a computational network data set was extracted, and the housing data, combined with the DENUE, allowed us to develop the entropy index.
The proposed centrality–mixed land-use composite index
The composite index developed here is merely intended to identify urban arrangements, containing both the capacity for attracting and retaining trips. By highlighting areas comprising those aspects, we expect to identify centralities that could be said to have some self-restrain potential. Once centres are identified and hierarchised, it will be possible to read urban structure (mono-polycentric), confront it with other dynamics, such as travel behaviour, and propose more targeted urban policies to specific situations.
The proposed Composite Centrality Index (CCI) is based on two different measures. On one hand, the Reach centrality metric from the UNA was used. The Reach metric was chosen from other metrics because what matters in the first place is the cluster formation process. The Reach measure ‘captures how many destinations each building reaches within a given network radius’ (Sevtsuk, 2010: 84). The algorithm computes Reach values for all points in the system. In doing so, it is possible to visually detect clusters. If, for instance, reach is weighted by number of jobs within a building, then the result for each evaluated point would be number of jobs reached within a specified buffer (see Figure 1).
The reach centrality, Rr[i] of a building i in a graph G describes the number of other buildings in G that are reachable from i at a shortest path distance of at most r. It is defined as follows:
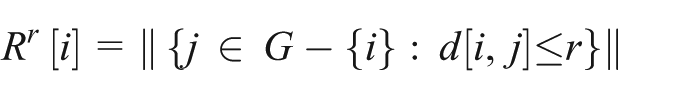
where d[i,j] is the shortest path distance between nodes i and j in G, and ||S|| is the cardinality of the set S. If nodes in G are weighted, then reach is defined as follows:
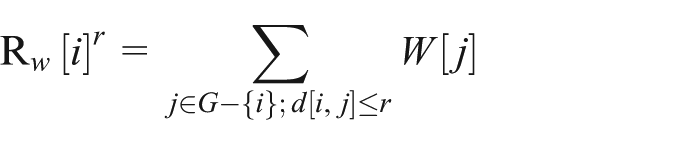
where W[j] is the weight of node j. (Sevtsuk and Mekonnen, 2011: 8)
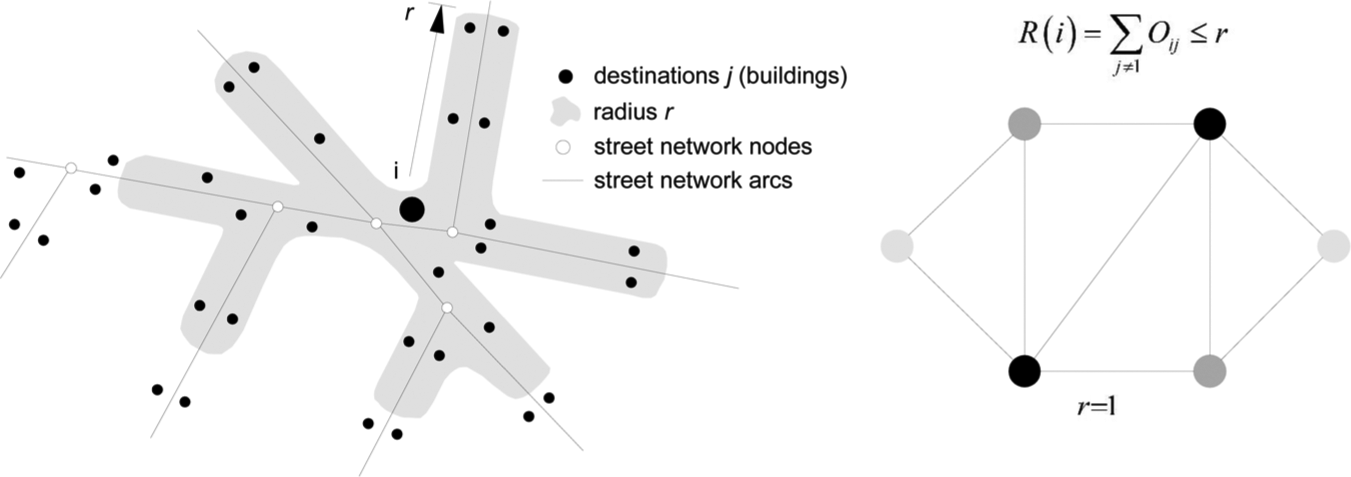
Reach rationale. Redrawn from Sevtsuk and Mekonnen (2011).
In this paper, we filtered the database used to compute the Reach measure using only economic units with 11 or more jobs per unit, because our intention is to identify significant flows. Also, informal jobs, which are very important to MCMA’s economy and urban structure, were left out because of lack of data. Since almost one-third of economic activity in the MCMA is informal, including them in the Reach measure would surely bring different results.
On the other hand, an Entropy Index (Cervero and Kockelman, 1997: 206) is used as a mixed land-use measure:
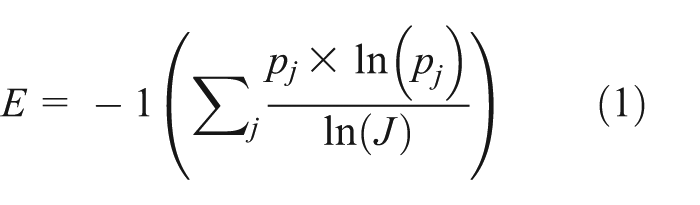
where j represents the land uses considered within the study, pj the proportion of land-use category j within a 1000 m radius, and J the number of total land-use categories. Entropy ranges between 0 (homogeneity, mono-functional areas) and 1 (heterogeneity, wherein the developed area is evenly distributed among all land-use categories). The more mixed land use, the more chance for allowing walking trips instead of motorised ones. Entropy Index was chosen among other dissimilarity measures because it is widely used within land use–travel behaviour studies. Also, it represents Jacobs’ added dimension to the urban centrality redefinition proposed earlier.
In order to build the CCI, reach centrality must be linearly scaled to fit the range 0–1, such as the Entropy Index. So, we find reach centrality proportion for each measured point as follows:

where Rr[i] is the reach centrality of a building i and Rr[i]max is the maximum score of the ith attribute.
Finally, the proposed CCI is defined as follows:

where pR is the proportion of economic units or jobs reached, WR is the assigned weight to economic units or jobs reached, E is the entropy, and WE is the assigned weight to the Entropy Index. CCI will range from 0 (less centrality) to 1 (more centrality).
Whenever possible an ‘expert panel’ should assign weights to each variable valuing how important each vector is against another: i.e. job clustering or mixed land use. In the absence of such a panel, two weighting criterion were used: the ranking procedure, and the pairwise comparison method (Malczewski, 1999: 177). Both methods yielded the same results, based on assigning more importance to the entropy variable.
Results
The model was statistically validated through Ordinary Least Squares Regressions, and visually by exploring whether detected urban centralities outside the central core ‘matched’ known urban centralities using a Google Earth image layer.
The first validation strategy consisted on comparing CCI results against some existing centrality measures, using EOD-07. We calculated total trips attracted and also work trips attracted by district, because the latters represents almost one-third of all trips. Owing to sample unit mismatch between CCI and EOD-07, CCI mean value and its components (reach and entropy) were also aggregated at the district level. First, OLS regressions were run between trips attracted as dependent variable. Table 1 shows outcomes (model 1 and 2). Reach index has a positive relationship with both trip types, but the goodness of fit (R2) significantly improves for work trips. This variable alone explains more than 75% variance of working trips (even though the Reach index uses only economic units with 11 or more employees).
Regression models.

Second, we ran a multivariate model adding the Entropy variable aside of Reach. As shown in Table 1, models 3 and 4 indicate that trips’ attraction within the MCMA has to do only with jobs in each district, but not with Entropy. The Reach index continues to be statistically significant, with a positive relation with both type of trips attracted. However, the Entropy index is not statistically significant in both cases, while goodness of fit shows only a marginal improvement.
Finally, we tested the relationship between trips attracted and the proposed CCI (see models 5 and 6 in Table 1). They indicate that the CCI maintains a positive relation with attracted trips, despite reduction of goodness of fit. A plausible explanation for this would be that, as seen in previous models, trips’ attracted variable is much more related with the Reach index, which is representing job clustering, and that the mixed land-use index (Entropy) does not seem to play a key role in centralities’ formation within the MCMA. The fact that the Reach index by itself is the variable that better explains trips attracted does not mean the mixed land-use index is of little effective use. On the contrary, it demonstrates that within the MCMA’s urban planning, job-clustering has been privileged without taking into account diversity.
A second validation strategy consisted on visual inspection of maps. First, as seen in Figure 2(a), which represents the number of jobs that can be reached from each economic unit within a 1 km radius along the street network, we observed formal employment hyper-concentration dominating the metropolitan structure. Even though it is possible to identify some subcentres, the enormous amount of formal jobs within the central area eclipses other possible smaller subcentres from this visualisation. In order to reveal the presence of this hidden ‘polycentric’ structure we need to normalise the Reach index (Figure 2(b)). Then, we can find some emerging subcentres, although smaller in comparison with the CBD.
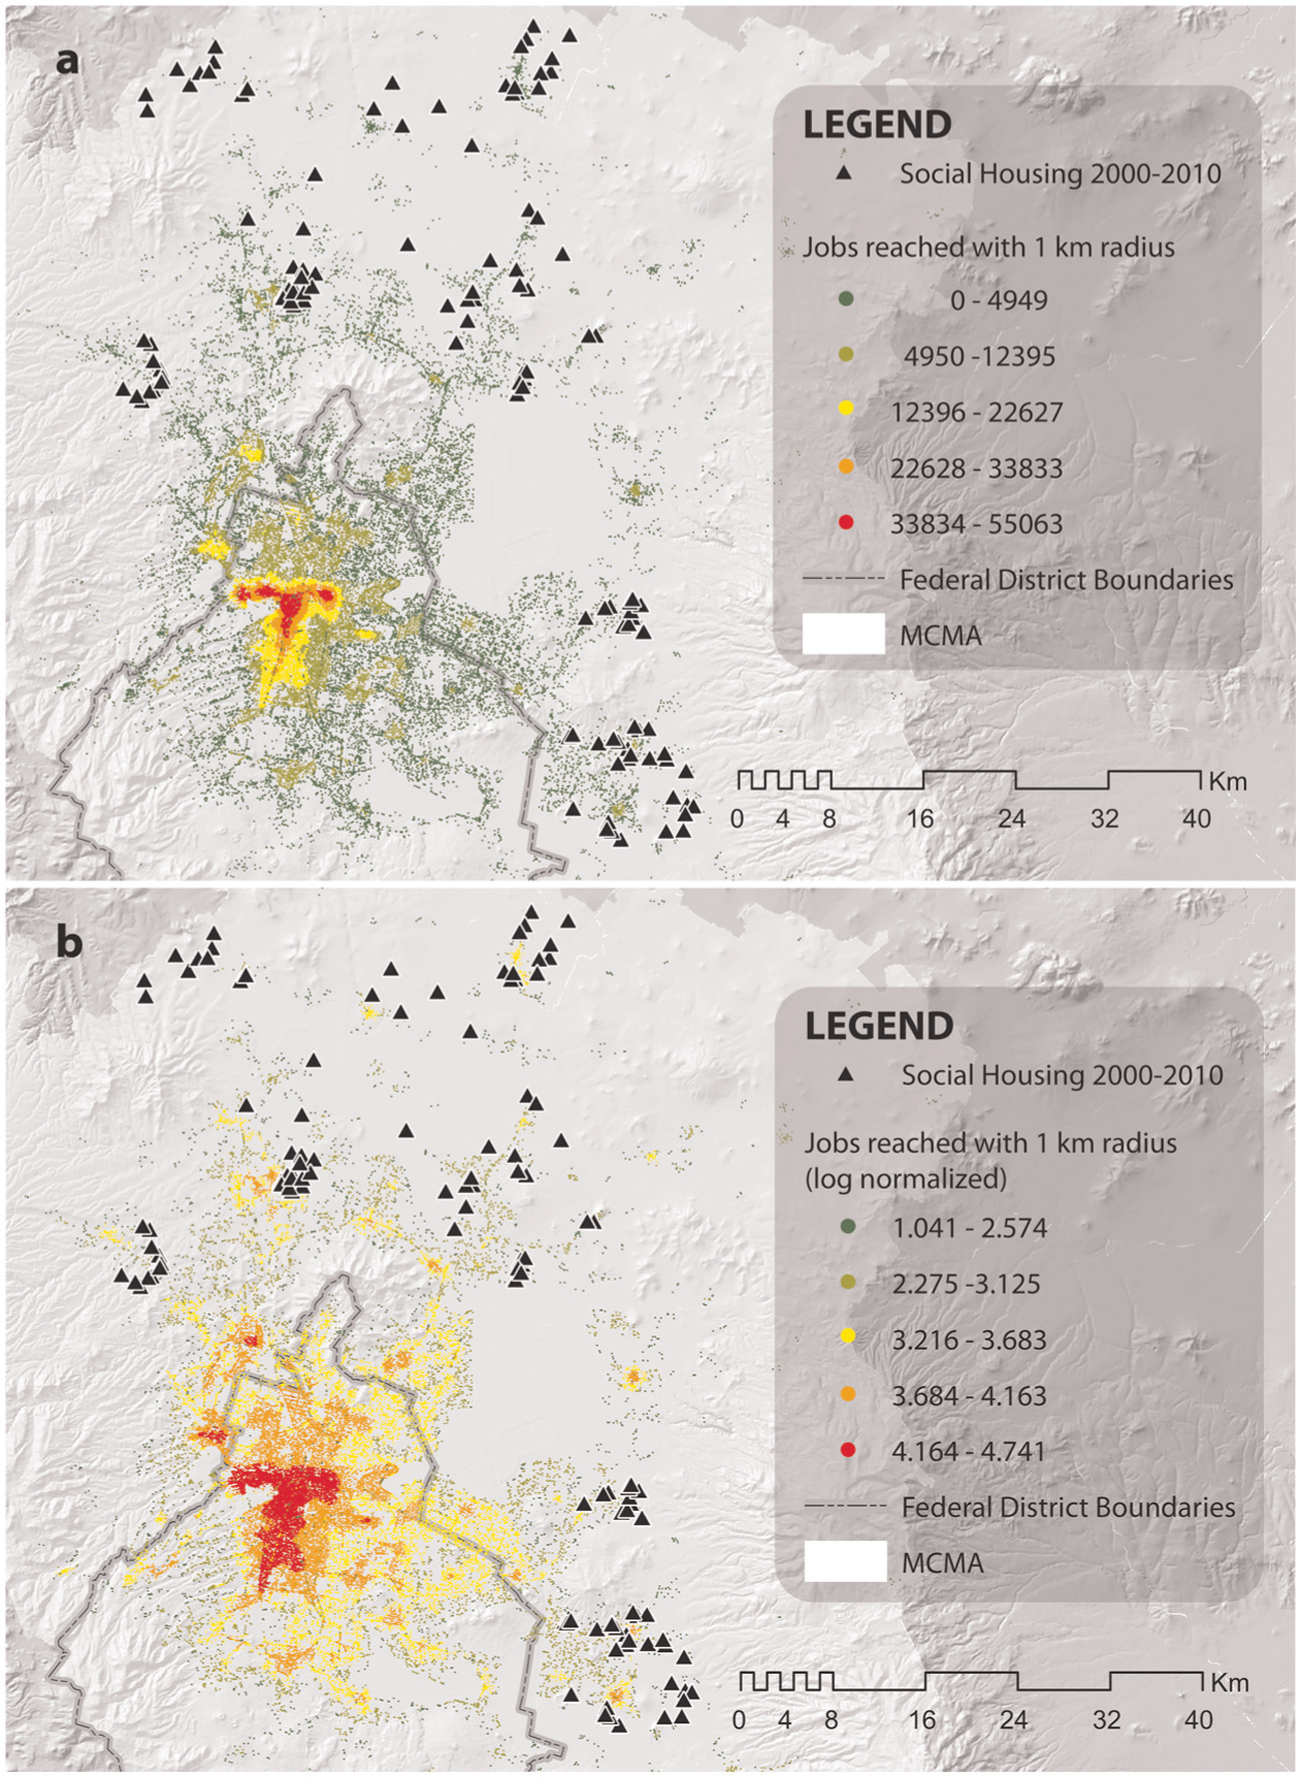
(a) MCMA employment reach centrality. (b) MCMA employment reach centrality (normalised log ratios).
Figure 3(a) and 3(b) express centralities found under our CCI. Comparing the ‘first’, ‘second’ and even the ‘third’ order centralities with a Google Earth Image layer, it emerged that most of the selected points that had a high CCI value were in fact economic units located within native towns. In this case, we observed some outer urban centralities arising. Most of the ‘second order’ centralities match historical town cores that had been engulfed by urban sprawl (as noted by cited authors). Although those maps show signs of a polycentric condition trend, the MCMA cannot be considered to be in an advanced stage of polycentrism, mainly because of a lack of formal jobs in those subcentres and because of a considerable size difference between them and the CBD. In terms of other authors’ findings, these results are very similar to observations by Suárez and Delgado (2009) and González-Arellano (2010).
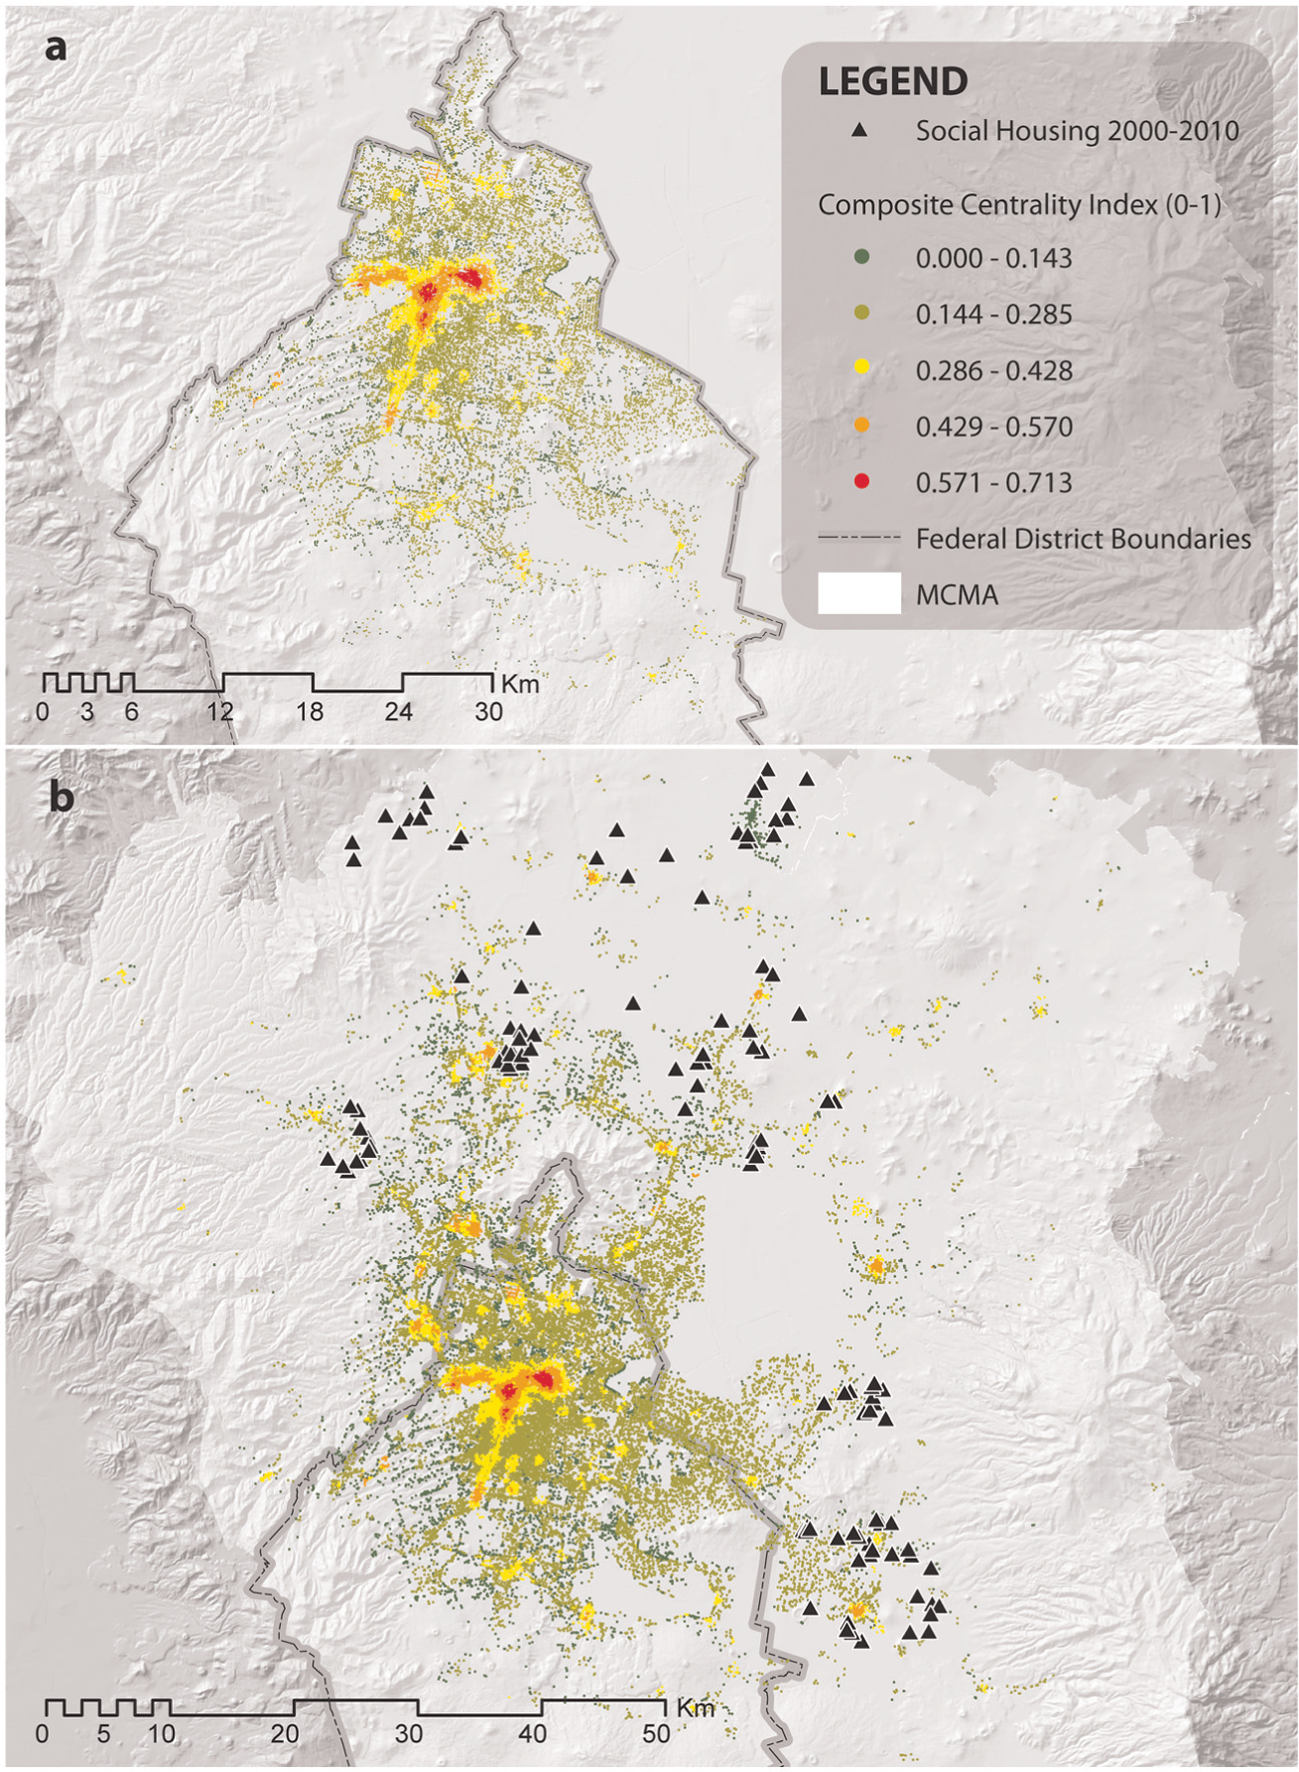
(a) FD CCI (UNA + entropy index). (b) MCMA CCI (UNA + entropy index).
In terms of our centrality standpoint, those maps show some small clusters with self-restrain potential that could eventually raise their CCI value by inducing a more balanced land use (i.e. introducing more economic units or dwellings) in order to reduce commuting. Figure 3(b) illustrates an urban structure, which has very high CCI values in central districts, and smaller peripheral clusters with high CCI, in which people could eventually live, work, spend leisure time and, thus, become ‘more sustainable’. As can be seen in Figure 3, the majority of recent social dwellings have been constructed in the State of Mexico, far from Mexico City’s historical core and, also, far from any substantial job cluster. Despite land value issues, a different social housing strategy could be developed (i.e. by subsidising land as an alternative to house units subsidies) to reinforce emerging urban centralities instead of spreading large housing units in the middle of the hinterland.
Finally, as Figure 3(a) and (b) show, most CCI values are very similar in both cases. The two images show no significant difference, despite the system scale at which the CCI was generated and regardless of equal intervals classification. We noticed a generic boundary condition problem that implies that, as there are no continued agglomerations shared by the FD and the MCMA, the Index’s values do not change drastically. But if there were large clusters between the two entities, at the moment of running the algorithm separately, there surely will be miscalculations over that specific area because of missing data.
Conclusions
Although we observed an emerging trend of a polycentric condition within the MCMA, and that people living in those distant subcentres do not necessarily have to go to the CBD to fulfil their daily basis needs in several services, we believe those facts are not enough to define those subcentres as urban centralities, nor for considering the MCMA as a consolidated polycentric structure, because those subcentres lack sufficient formal economic activities and because there is a huge difference between the size of the centres. EOD-07 data confirms this assumption: exurban residents have to commute long distances to reach their formal job destinations, mostly located in the CBD.
Despite the signs of an emergent polycentric structure in both the MCMA and the FD, it seems to be in its first stages, since the CBD’s weight still strongly dominates the urban structure. According to Parr (2004), it is far from being considered as a Polycentric Urban Region. Original towns now serving as dormitories and service clusters should raise their share of jobs and mixed land-use allocation to improve their self-restrain potential and, therefore, become more polycentric (other considerations should be taken into account, such as an orientation towards an economic specialisation). We believe that confronting this CCI method against urban policies before implementing them could eventually enhance territorial coherence and reduce energy consumption to achieve a more sustainable urban development.
In terms of the method itself, there are other variables that must be included in a future version of this proposed CCI, such as transit infrastructure, a job-to-housing ratio measure, and other neighbourhood design characteristics. This will allow more precise urban centrality detection and a less blurry urban centrality categorisation.
Second, we should include another step in which those detected centralities conform territorial units (area, instead of a set of points). This will help planners to identify potential self-restrain areas (neighbourhoods, districts, census tracts) and compare them at the same territorial scale at which urban policies are developed.
Third, and only when available, the CCI should consider flows from a travel diary survey, because in absence of this, detection is only considering the polarisation effect caused by economic clustering, but not real flows. Also, other centrality measures such as betweenness, straightness or gravity, as suggested by Porta et al. (2012), could be included.
Future work on this method should at least deal with a more robust calibration and validation than the empirical one performed in this analysis, especially in the weighting procedure and in the cut-offs method at which centralities are detected. Categorisation of urban centralities – once they are detected – could be done by the approach proposed by Alpkokin et al. (2007) instead of using equal intervals. We believe this proposed CCI could be applied indistinctively to several metropolitan areas, in order to understand, at first glance, urban structure principles.
Further steps with urban centrality research should be aimed at looking for density thresholds (limits) and mixed land-use ratios in order to avoid what other researchers have found to be perverse effects of density and zoning policies, such as congestion (Levinson and Kumar, 1997), segregation, gentrification or overspecialisation.
Footnotes
Funding
This research received no specific grant from any funding agency in the public, commercial, or not-for-profit sectors.