
Abstract
Our purpose was to determine the relative importance of individual- and park-related characteristics in influencing both local park use and specific engagement in active sports, walking and sedentary pursuits. We surveyed 3815 adults living within 0.80 km of one of 24 study parks in four US metropolitan areas. Chi-square statistics and baseline-category logit models examined how perceived safety and park characteristics were related to park visitation and types of park activities, controlling for city, individual and park characteristics. Survey participants who perceived the parks as safe (88%) had 4.6 times the odds (95% CI 3.5–6.0) of reporting having visited the study park. Men and African Americans were more likely, and older individuals and those who self-reported being in fair or poor health less likely to perceive parks as safe. Parks having low incivilities scores and those with four or more different facilities, such as tennis courts, swimming pools, basketball courts, etc., were more likely than parks with fewer facilities to be perceived as safe. While park facilities had a much smaller odds ratio for predicting park visits (1.8), it affected 70% of the population. The implication is, if these associations are causal, modifying park facilities may have a greater population impact than improving perceptions of park safety. Our findings are consistent with studies suggesting that increasing the variety of park facilities and offering more organised activities may encourage physical activity among specific target groups.
Introduction
Given the high levels of physical inactivity that characterise the American population (Centers for Disease Control and Prevention, 2014), efforts to promote more activity are warranted. In urban areas where parks are available, safety issues are frequently cited as a barrier to park use and physical activity. Perceived safety typically is measured by asking individuals how safe they feel their neighbourhood is from crime (Bedimo-Rung et al., 2005). In multiple qualitative studies, lack of safety has been cited by both adolescents and adults, and in particular women, as a reason for not using parks or engaging in outdoor physical activity (Baran et al., 2014; Bedimo-Rung et al., 2005; Centers for Disease Control and Prevention, 1999; Cohen et al., 2011, 2012a; World Health Organization, 1995). However, we identified only one study that found an association between neighbourhood safety and physical activity levels (Centers for Disease Control and Prevention, 1999). In that study, data from five states (Maryland, Montana, Ohio, Pennsylvania and Virginia) showed a higher level of physical inactivity among persons who perceived their neighbourhoods as unsafe. The effect of unsafe neighbourhoods appeared highest among older persons, women, racial/ethnic minorities and persons with a high school education or less. More data are needed on the relationship between park use and the perceptions of park safety. The first step in examining this association is to determine whether park visitation is influenced by the perception that a park is safe.
It is not clear whether improving perceptions of safety would make a difference in the use of local parks. Even when parks are perceived as safe they may be underutilised (Evenson et al., 2009). In one study where the perceptions of safety were documented as improved after the parks were renovated, park use did not increase, primarily because the renovations were accompanied by budget cuts that resulted in decreased programming at the park and reduced hours of service (Montoye et al., 1996). In several other studies, factors such as programming, park size and facilities appear to be strong predictors of observed park use (Caughy et al., 2001; McKenzie et al., 2006; Pikora et al., 2003). Whether it is more important to address safety perceptions or to address the programming and facilities in parks to increase park use and park-based physical activity is not known.
For this study we interviewed residents living close to neighbourhood parks. Our purpose was to determine the relative importance of individual- and park-related characteristics, particularly the perception of safety, in influencing both local park use and specific engagement in active sports, walking and sedentary pursuits.
Methods
Design
The study population consisted of adults who lived within one-half mile (0.80 km) of 24 public neighbourhood parks and were administered an anonymous survey regarding their use of the park. One-half mile (0.80 km) was adopted as the standard based on travel survey data (Baran et al., 2014), and we surveyed individuals in four US cities: Albuquerque NM, Chapel Hill/Durham NC (hereafter referred to as Chapel Hill), Columbus OH and Philadelphia PA (Cohen et al., 2011). The study was intended as a validation of the Systemic Observation of Play and Recreation in Communities (SOPARC) in a variety of cities to see if it could be used across different cities in different seasons (Cohen et al., 2011). Parks were chosen that were considered as generally representative of the parks in the selected cities; they were required to occupy at least 20 acres. Study protocols and surveys were reviewed and approved by each local Institutional Review Board. Survey participants were restricted to adults age 18 or over; interviews were conducted at housing units selected at random. We used a structured questionnaire to interview adults age 18 and older who first opened their doors and consented to taking the survey. The number of resident surveys needed for each park was determined based upon power to detect a moderate effect, based upon previous studies of parks in Los Angeles (Cohen et al., 2007). In some locations where sufficient numbers of households were not available or accessible (e.g. locked entries in apartment buildings, locked gates and guard dogs, no one home), intercept surveys of those living within a one-half mile (0.80 km) geographic radius of the park were conducted at busy locations, such as nearby storefronts and bus stops. The same survey instrument was used for both survey types. Before initiating the survey, staff asked potential survey participants their address and used this information to confirm whether their residence was located within one-half mile (0.80 km) of the target park. Survey participants provided verbal consent for participating.
Measures
We hypothesised that personal attributes as well as park characteristics combine to influence park use for physical activity (PA). Consistent with Bedimo-Rung and colleagues’ Conceptual Model of the Role of Parks in Public Health (2005), we separated our analysis of safety issues into individual characteristics of users and potential users and physical park environments. Person-specific information reported in both surveys included age, gender, race, Hispanic/Latino ethnicity, height, weight, perceived health status, perceptions of park safety and typical activities they engaged in while in the park. Since health issues affect one’s ability to participate in certain types of activities, this was inserted in the model, as it may be a potential confounder in the analysis. These characteristics were later grouped as follows: age (18 to 24, 25 to 46, and 47+); ethnicity (non-Hispanic white (NHW), Hispanic, African American, other); body mass index (BMI) (underweight/normal weight, overweight/obese, with overweight/obese defined as a BMI of > 25 kg/m2) (World Health Organization, 1995); general health (excellent, very good, good, fair, poor) (Montoye et al., 1996); residence distance from park (≤0.40 km, > 0.40 to 0.80 km); and perceived park safety (very safe/safe, not very safe/not safe at all).
Park-specific characteristics were summarised for the number of outdoor facility types provided (e.g. basketball courts, play areas and picnic tables) (three or fewer, four or five, more than five); indoor recreation facility (e.g. ping pong tables, work-out equipment) (no, yes); provision of organised activities (no, yes), and presence of physical incivilities, as described below. The number of different facility types provided was determined by first assigning one point to each of the following: outdoor basketball courts, dog parks, multipurpose fields, picnic areas, playgrounds, pools/waterparks and tennis courts. Multiple facilities of the same type (e.g. two tennis courts) were recorded as one facility type (i.e. one point).
To assess incivilities we used a modified version of the PIN3 neighbourhood audit instrument, designed to capture characteristics hypothesised to be associated with adult PA (Evenson et al., 2009). The selected items focused on replicating a priori constructs developed by two different research groups, including physical incivilities using a tool by Caughy and colleagues (2001) and constructs related to walking and bicycling developed by Pikora and colleagues (2003). We measured physical incivilities (defined as physical disorder associated with increased crime) along road segments adjacent to and surrounding each park, rating the overall condition of surrounding buildings, whether any buildings were burned or boarded up, condition of resident-kept grounds, condition of public spaces, amount of litter and amount of graffiti on a scale of one (excellent or good condition) to three (poor, deteriorated). There were six neighbourhood incivility measures, which are the average ratings in the following aspects: condition of residential units, burned or boarded up units, condition of resident-kept grounds, condition of public spaces, amount of litter and amount of graffiti. We scored the amount of litter or graffiti on a scale of 0 = none, 1 = a little, and 2 = a moderate or considerable amount. We calculated a summary incivility score using the principal component analysis method. The incivility score is a weighted sum of the six individual incivility measures where the weights were given by the loadings of the first principal component which explains roughly 40% of the total variance in all six incivility measurements after standardisation. The summary incivility scores ranged from 1.0 to 7.0, with a higher score indicating more incivilities.
To determine the frequency of organised activities occurring in the parks, we used observations from our park survey that was conducted in concert with the neighbourhood survey (Cohen et al., 2011). In this study SOPARC methodology was used to conduct four observations per day in each of the 24 parks (McKenzie et al., 2006). SOPARC assesses PA within parks, has been used in over 40 studies, and has been shown to be reliable (Cohen et al., 2011). A park was coded as providing organised PA if any activity area hosted a scheduled exercise class, sport practice or competition led by park staff or adjunct personnel. As part of a related study we observed the parks for four days in each of three seasons (a total of 48 observations per park, with winter excluded), and tabulated the total number of observed organised activities. Of the 34,512 visits to observe target areas over all cities/parks/seasons/days/periods,0.9% were recorded as having organised activities.
Statistical analysis
We first examined survey participants’ characteristics using descriptive statistics and then conducted chi-square tests to examine if there were significant differences in their characteristics across the four locations. Next, we conducted statistical modelling for the binary and categorical outcomes of park visits. The outcome variables were derived from the key questions, ‘How often do you come to this park?’ (responses consisted of ‘daily’ to ‘never’); and ‘What do you usually do while at this park?’ (more than one response was allowed). These questions have acceptable validity and reliability (Evenson et al., 2013). We classified survey participants as engaging in active sports if they reported their usual activities to include one or more of the following team or individual activities: baseball, basketball, soccer, tennis, volleyball, Frisbee, handball, skating, aerobics, gym activity or using gym equipment, swimming and running/jogging. We classified participants as walkers if they reported ‘walking’ or ‘walking with a dog’, but not engaging in active sports. We classified participants as engaging in sedentary activities if they reported their activity as caring for children (babysitting, playing with kids, playground use, and write-in responses that indicated they take children to the park), spectating, eating, relaxing, meeting friends or watching the dog, but not walking or active sports.
We first used a logistic regression model to examine the binary outcome ‘ever visit your park’. When the ‘perceived safety’ variable emerged as a key factor for predicting park use we more closely examined factors associated with this variable. We conducted a mediation analysis on the model examining factors associated with ever visiting the park, with ‘perceived safety’ as a potential mediator for the effect of neighbourhood physical incivilities on the models using the classic mediation analyses from Baron and Kenny (1986). The mediation analysis uses two regression models (one with the factor only, the other one with both the factor and the mediator). Changes in the coefficient estimates of the factor indicate the role of the mediator. For example, if the effect of the factor changes from significant (without controlling for mediator) to insignificant (including mediator), it suggests that the mediator fully mediates the effect of the factor. For more details of the mediation analysis method, see Baron and Kenny (1986) and Fritz and MacKinnon (2007).
We further conducted a baseline-category logit model for multinomial outcomes (Agresti, 2002) with the following mutually exclusive outcome categories: never visited the study park; reported sedentary activities with no walking or active sports in the park; some walking but no active sports; and some active sports. Independent variables included gender, age, ethnicity, BMI, perceived health status, distance from park to residence, perceived park safety, city, incivilities, number of facilities and number of observed organised activities. In these analyses we controlled for the city-level indicator to account for the inherent between-city differences in the mean outcome that are not explained by all covariates in the analysis.
Results
Univariate descriptive statistics of individual and park characteristics
Of the 3815 survey participants, 76.9% were recruited from randomly selected households and 23.1% from street intercept interviews. About half of participants were between ages 25 and 46 (mean age = 42 years; median = 39 years), about half were women (51%), and 56% NHW, followed by African American (25%), Hispanic (12%), and other ethnicities (7%; Table 1). Gender, age, and ethnicity distributions were significantly different across the cities. Chapel Hill survey participants were more often female (58%) and were older than those from other cities, and Philadelphia survey participants were the youngest and had the highest proportion of males (57%). The Columbus and Philadelphia parks had the highest proportion of African Americans, while Albuquerque had the highest proportion of Hispanic survey participants.
Survey respondent characteristics.
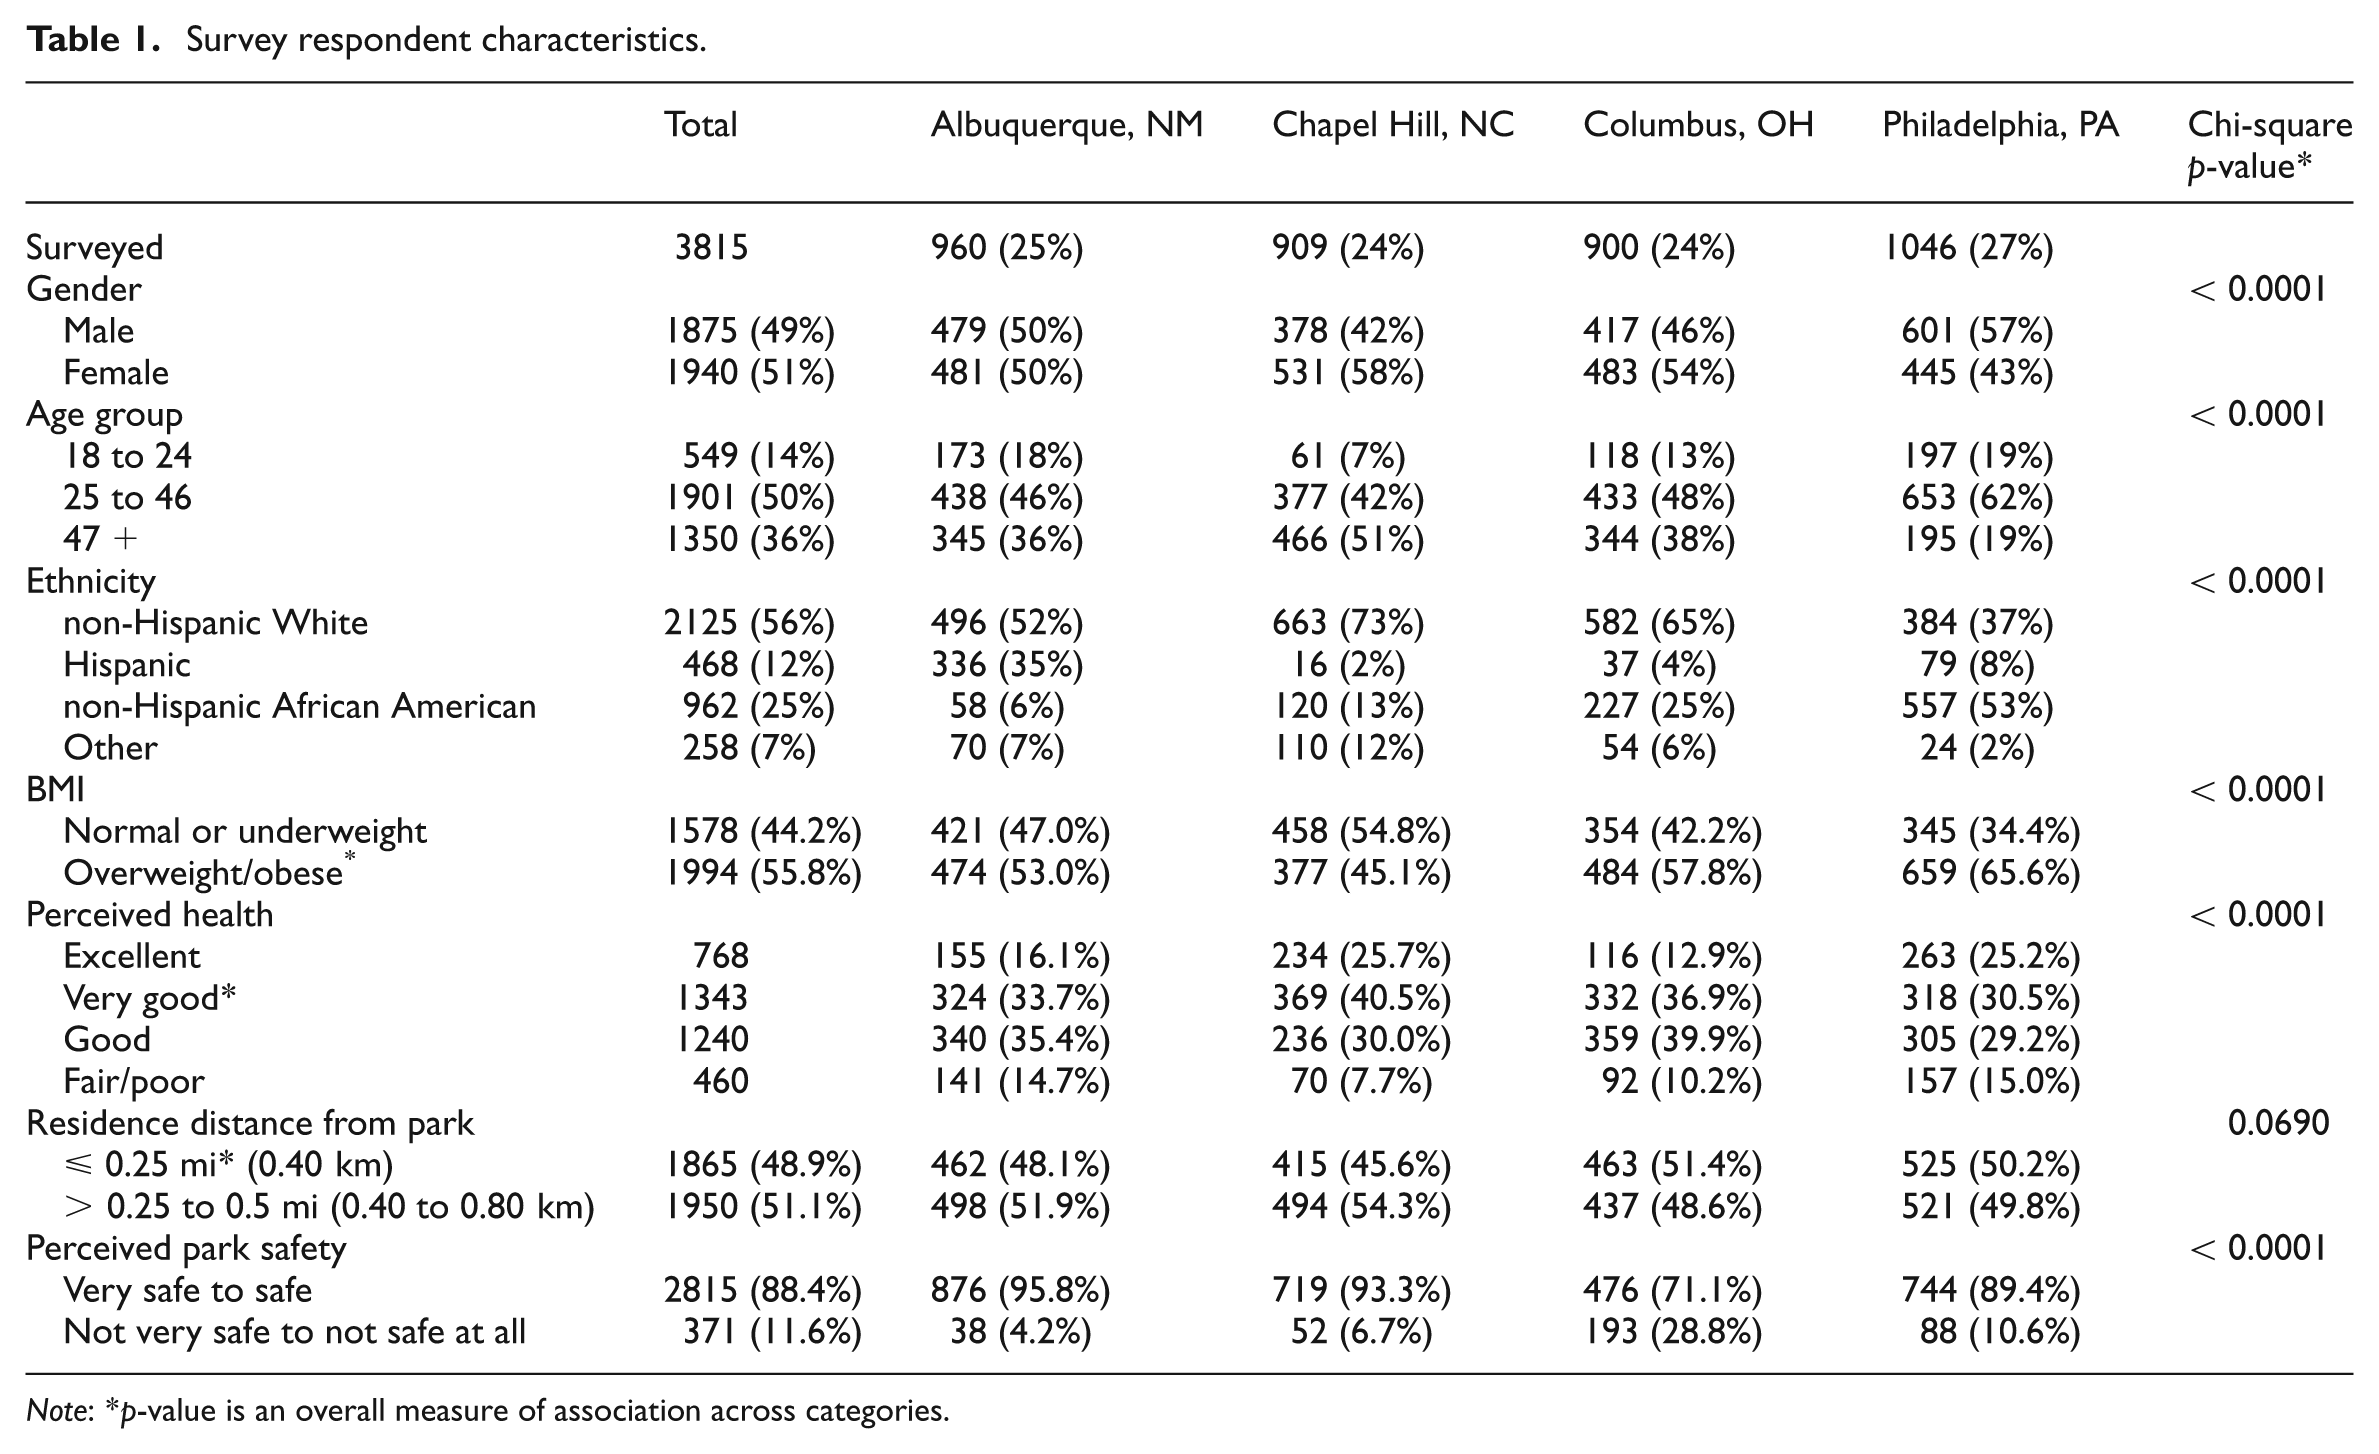
Note: *p-value is an overall measure of association across categories.
The 24 parks in the four cities had a similar number of different types of park facilities (range 4 to 6; median 4 to 6), but the facility types differed. For example, five Philadelphia parks had swimming pools, but the parks in Albuquerque and Columbus had none.
Indoor activity facilities were available in all six Philadelphia parks, three parks in Columbus, but only one each in Albuquerque and Chapel Hill. Overall, fewer than 30% of all parks had more than five facilities (see Table 2). Organised activities were seen occurring (using SOPARC) at all six parks in Chapel Hill and Philadelphia, in four in Albuquerque, and in three in Columbus. Chapel Hill parks had the lowest physical incivilities score (2.8), followed by Albuquerque (3.5), Columbus (4.2) and Philadelphia (4.2), but the differences were not statistically significant. Survey participants’ ratings of perceived safety in the 24 parks in the four cities were very positive but varied significantly, with over 90% of Chapel Hill and Albuquerque residents viewing their parks as safe or very safe, compared with 89% of Philadelphia and 71% of Columbus residents (p < 0.0001) (Table 2).
Park level characteristics.
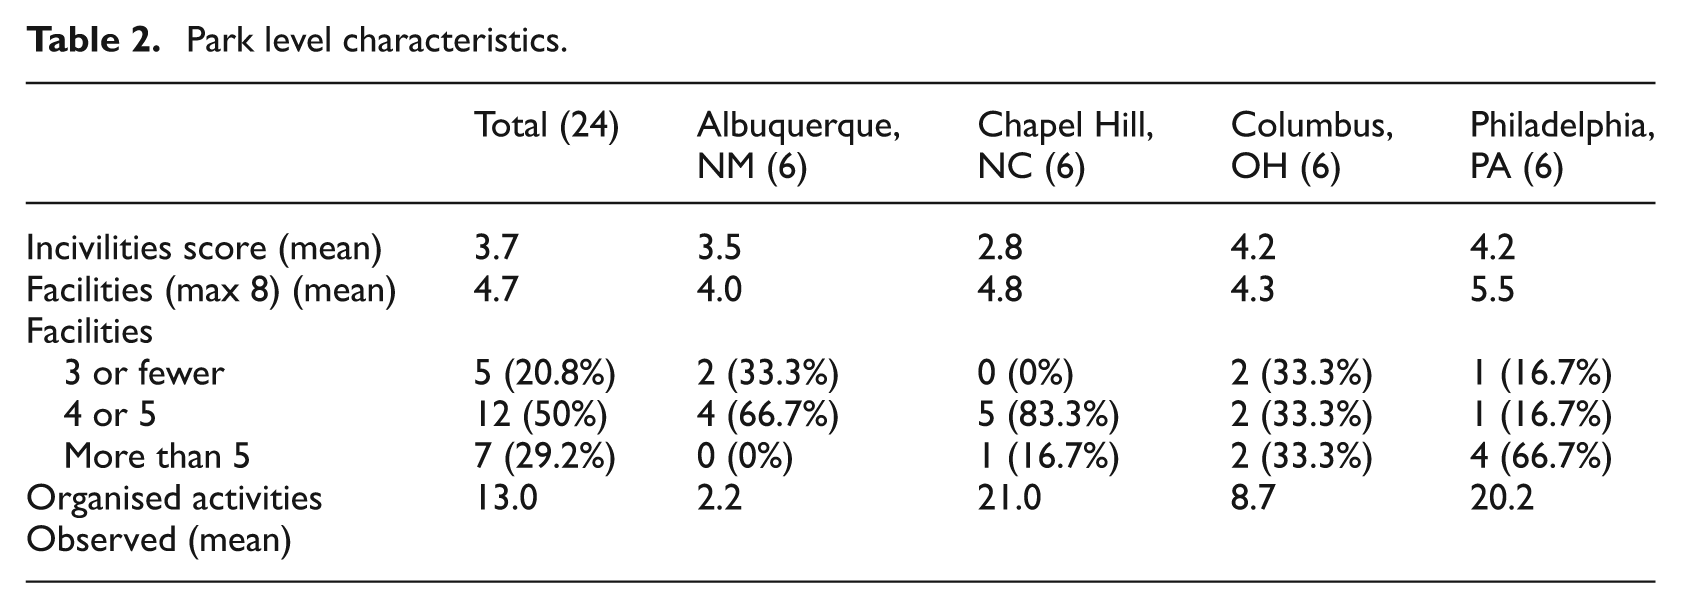
Perceptions of safety differed by gender, age group, race/ethnicity, city, as well as the poverty level in the neighbourhood of residence. Overall, 86% of women and 90% of men reported the parks to be safe or very safe (p = 0.0005). Among persons over age 47, 13.6% considered their local park to be unsafe, versus < 11% of persons younger than 47 (p < 0.04). Hispanics were most likely to view the park as safe/very safe (93%), compared with African Americans (86%), NHWs (88%), and others (90%). Among those who lived in neighbourhoods with a poverty level below the median, 16.6% consider the parks unsafe versus 6.4% among those who lived in neighbourhoods above the median poverty rate. Where parks had more than five facilities, concerns about safety were lower than where parks had fewer than five (9.8% versus 13.7%, p < 0.0005).
Ever visited the park
Of the 3815 survey participants, 2374 (62%) reported that they had visited their neighbourhood park at least once, with similar proportions for women (61%) and men (63%). The neighbourhood physical incivilities scores and park safety questions were highly correlated, the constructs underlying these variables were related, and both variables were associated with ever having visited the study park. Perceived safety was negatively correlated with neighbourhood incivility scores (higher incivility scores were associated with less perceived safety). To address this we conducted a mediation analysis on the model examining factors associated with ever visiting the park, with ‘perceived safety’ as a potential mediator for the effect of neighbourhood physical incivilities on the models using the classic mediation analyses from Baron and Kenny (1986). We found that the effect of incivility score was mediated by perceived safety. A separate model (not shown) without the mediator resulted in a significant relationship between neighbourhood incivility score and ever visited the park [OR = 0.93; 95% confidence interval (CI) 0.87–0.99]. Including the perceived safety variable resulted in an insignificant estimate for incivility score, while the mediator was significant (Table 3).
Characteristics associated with ever having visited the study park, and with perceived safety of the park. Cells are odds ratios and 95% confidence intervals.
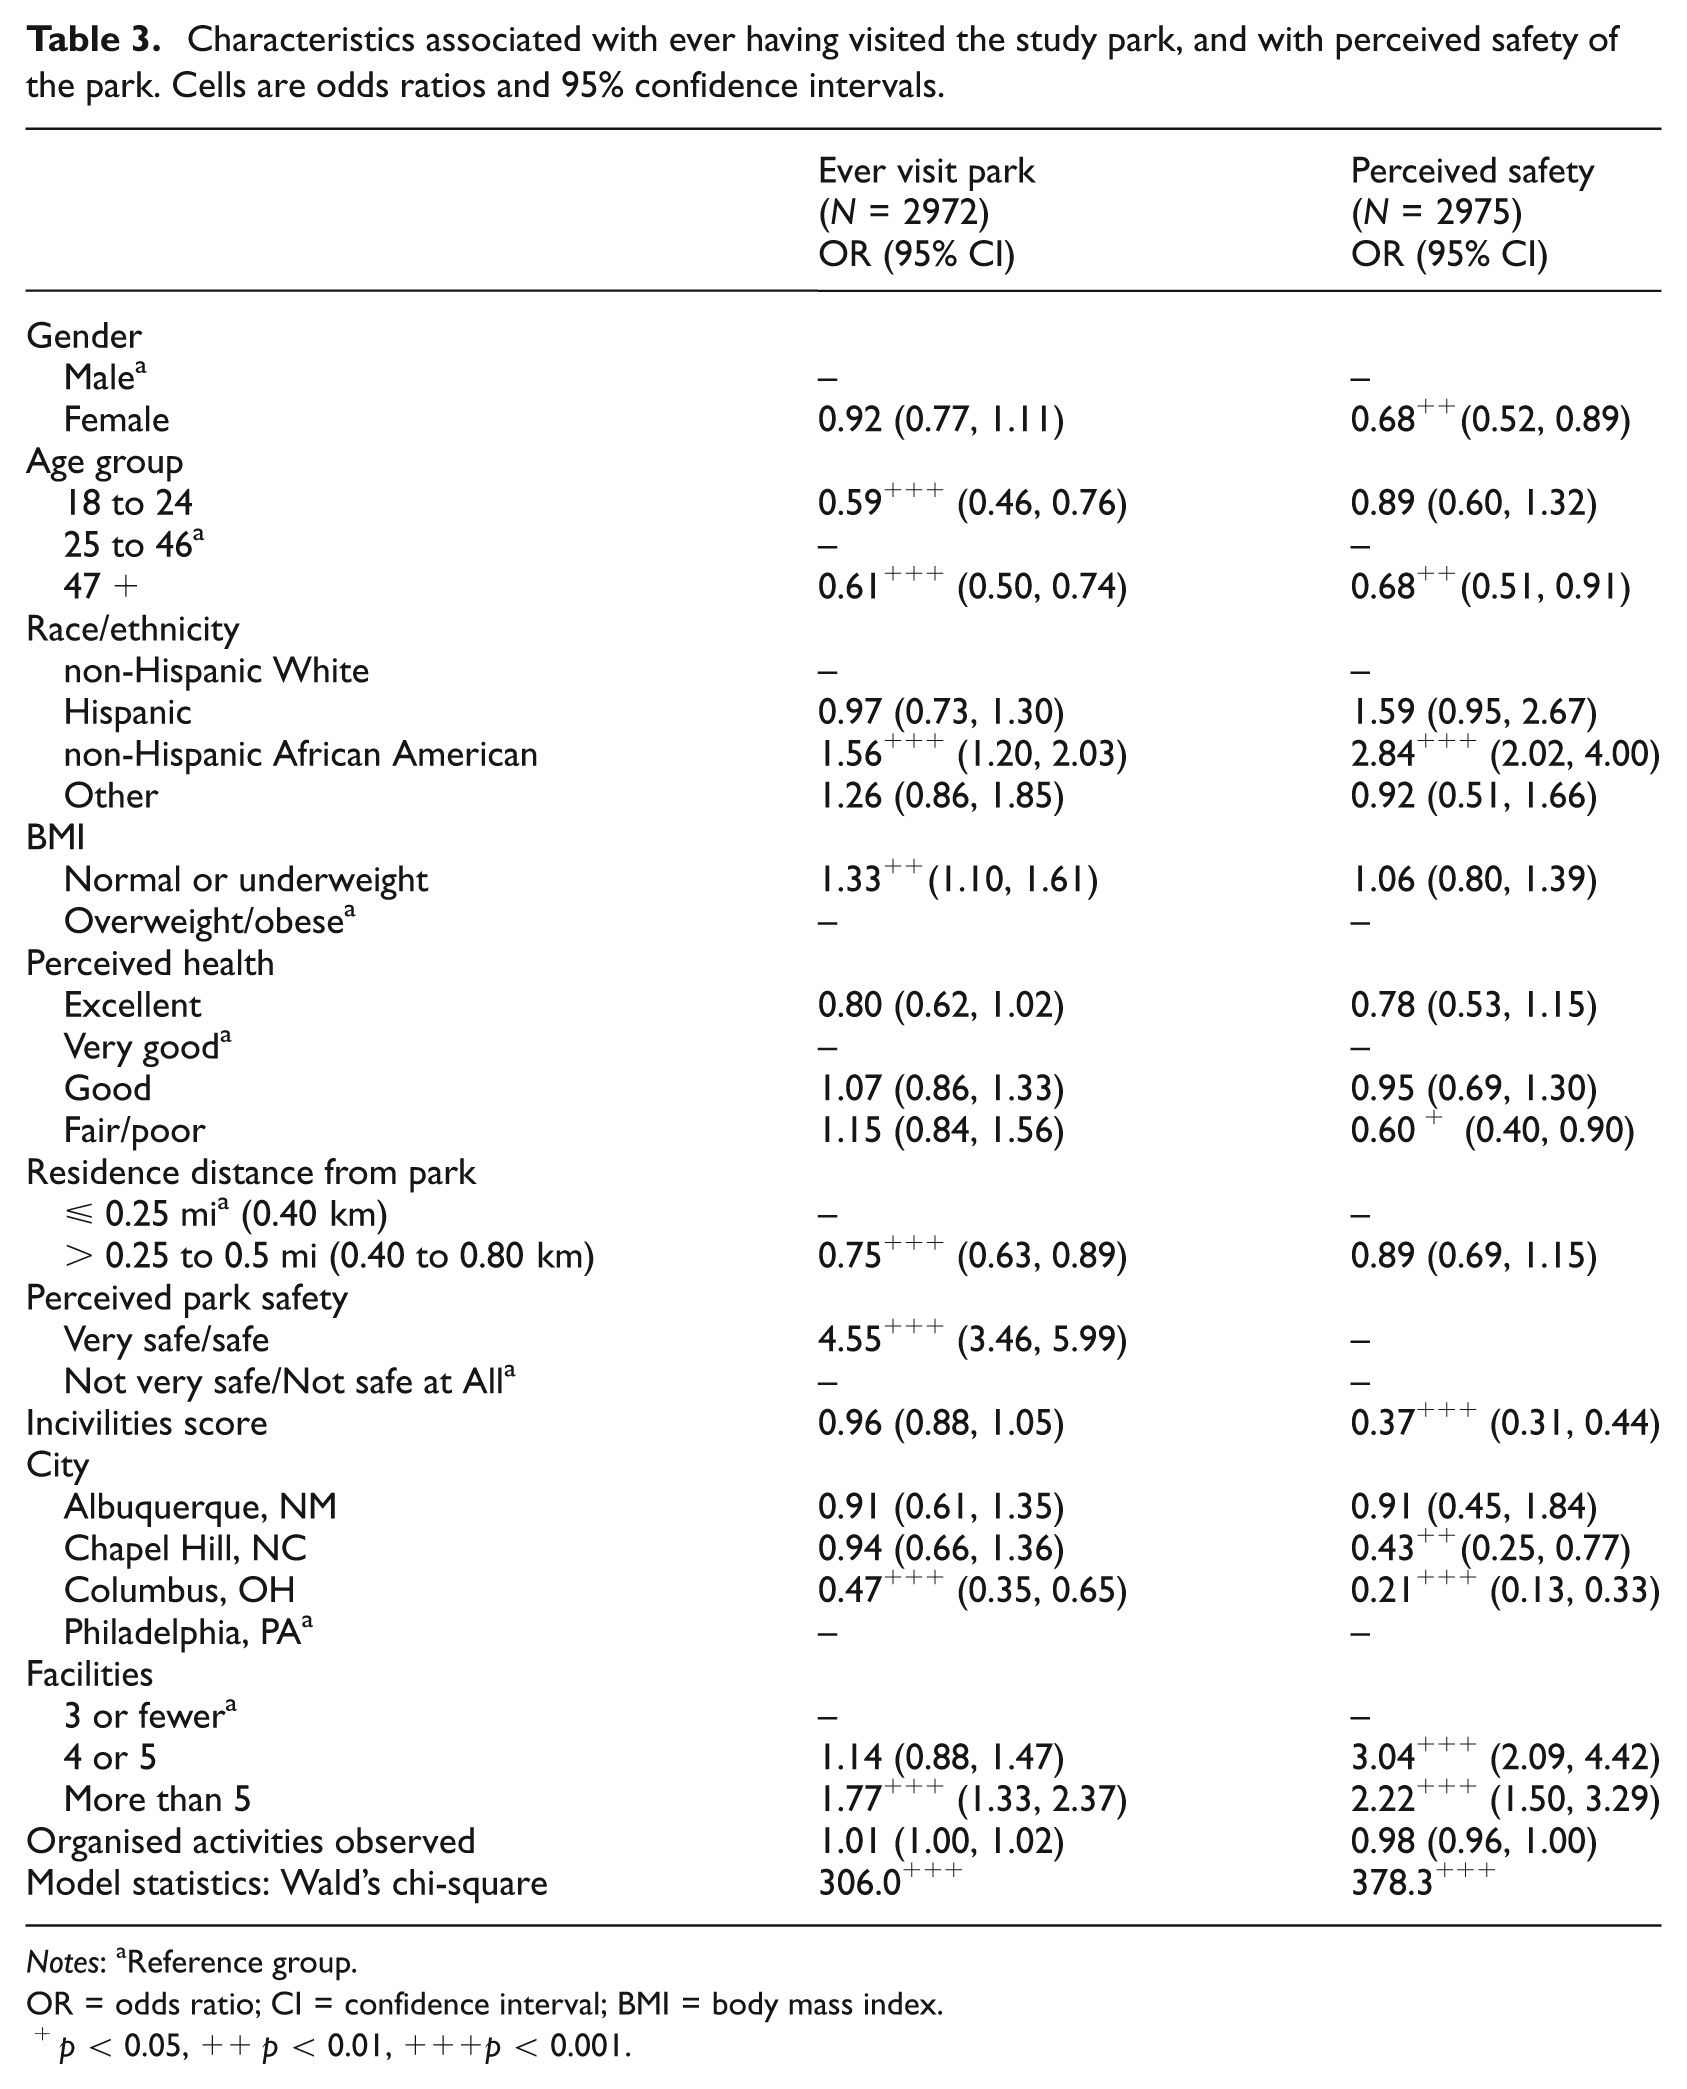
Notes: aReference group.
OR = odds ratio; CI = confidence interval; BMI = body mass index.
p < 0.05, ++p < 0.01, +++p < 0.001.
Factor levels significantly associated with ever having visited the study park included perception the park was safe, age group between 25 and 46, African American race, a normal or below normal BMI, living within 0.40 km of the study park, and the park having more than five different types of facilities (Table 3). We found that the number of facilities had a notable effect in attracting local residents to visit their parks. In particular, residents around parks with more than five types of facilities had an odds ratio of 1.77 (p < 0.001) to ever visit their parks compared with residents around parks with fewer than three facilities, controlling for all other factors.
Perceived safety
Survey participants were more likely to report having visited the park if they perceived it as safe. Since this variable was the factor most strongly associated with ever having visited the park (OR = 4.6 CI 3.46–5.99), we also developed a model to determine factors associated with perceived safety. Among person-specific variables, African Americans were more likely than the reference group to perceive the park as safe (odds ratio = 2.84) and were more likely to have visited a study park (odds ratio = 1.56), after controlling for other observed covariates. Females, those aged 47 or older, and those reporting fair or poor health were less likely to perceive it as safe, controlling for other factors. Park-specific variables associated with perception of the park as not being safe included having a high neighbourhood incivility score and having three or fewer types of facilities.
Types of park activities
The most frequent types of activities that residents reported doing at the parks for both genders were sitting/relaxing, eating, walking and caring for children. Other common activities were playing outdoor basketball and meeting friends. In Philadelphia, 12.5% reported playing baseball, more than the other three cities combined. A greater proportion of Philadelphia park users reported playing indoor and outdoor basketball. Chapel Hill had more running and ‘other activities’ which most commonly included spectating and bicycling, and had the most observed organised activities, with Albuquerque parks having the fewest. Men visited the parks more often than women and relatively more reported engaging in active sports (46% versus 29%, p < 0.0001). Of those participating in active sports 60% were men.
A similar proportion of men and women reported engaging in individual sports and activities (skating, aerobics, gym activity, swimming, running/jogging). The activities most commonly reported by women were walking, playing with children, using the playground, sitting and celebrating, while those most commonly reported by men were walking, basketball, playing with children, using the playground and sitting. Almost three-quarters (71%) of women not engaged in more active sports were walkers, compared with 54% of men. Among walkers, 57% were women. Providing childcare was reported by 69% of women and 51% of men.
Table 4 presents results of the baseline-category logit model for the different park activity categories. Although perceived safety, BMI and residence distance from parks were significantly associated with the odds of having ever visited parks, they were not significantly associated with different activity categories in parks. There was a notable level of heterogeneity among park activity categories in some person-related and park-related factors. Women were less likely than men to engage in active sports (OR = 0.57, p < 0.001) but were as likely to walk or be sedentary in parks. Compared with the reference age group (age 25–46 years), younger people (age 18–24 years) were less likely to visit parks for sedentary activities (OR = 0.43, p < 0.001) or walking activities (OR = 0.46, p < 0.001), and older people (age > 47 years) were less likely to visit parks for sedentary activities (OR = 0.51, p < 0.001) or active sports (p = 0.40, p < 0.001). Compared with NHWs (the reference group), African Americans were less likely to visit parks for walking (OR = 0.65, p < 0.05), but more likely to visit parks for active sports (OR = 1.93, p < 0.001) or sedentary behaviour (OR = 1.56, p < 0.01). Compared with those with very good perceived health, people with fair/poor health were more likely to visit parks for sedentary activities (OR = 1.69, p < 0.01). Those who categorised themselves as being in fair to poor health were more likely to be overweight/obese (69% versus 31%) than those self-reporting to be in excellent to good health (p < 0.0001). Compared with parks with three or fewer types of facilities, residents around parks with more than five types of facilities were more likely to visit their parks for walking (OR = 1.59, p < 0.05) or sports (OR = 2.21, p < 0.001). Organised activity was significantly associated with increased odds to engage in active sports in parks (OR = 1.02, p < 0.001) (Table 4).
Baseline-category logit model (N = 2803) for the multinomial patterns of park use, where the reference level for all three outcome categories was ‘never visit parks’. Cells are odds ratios and 95% confidence intervals.
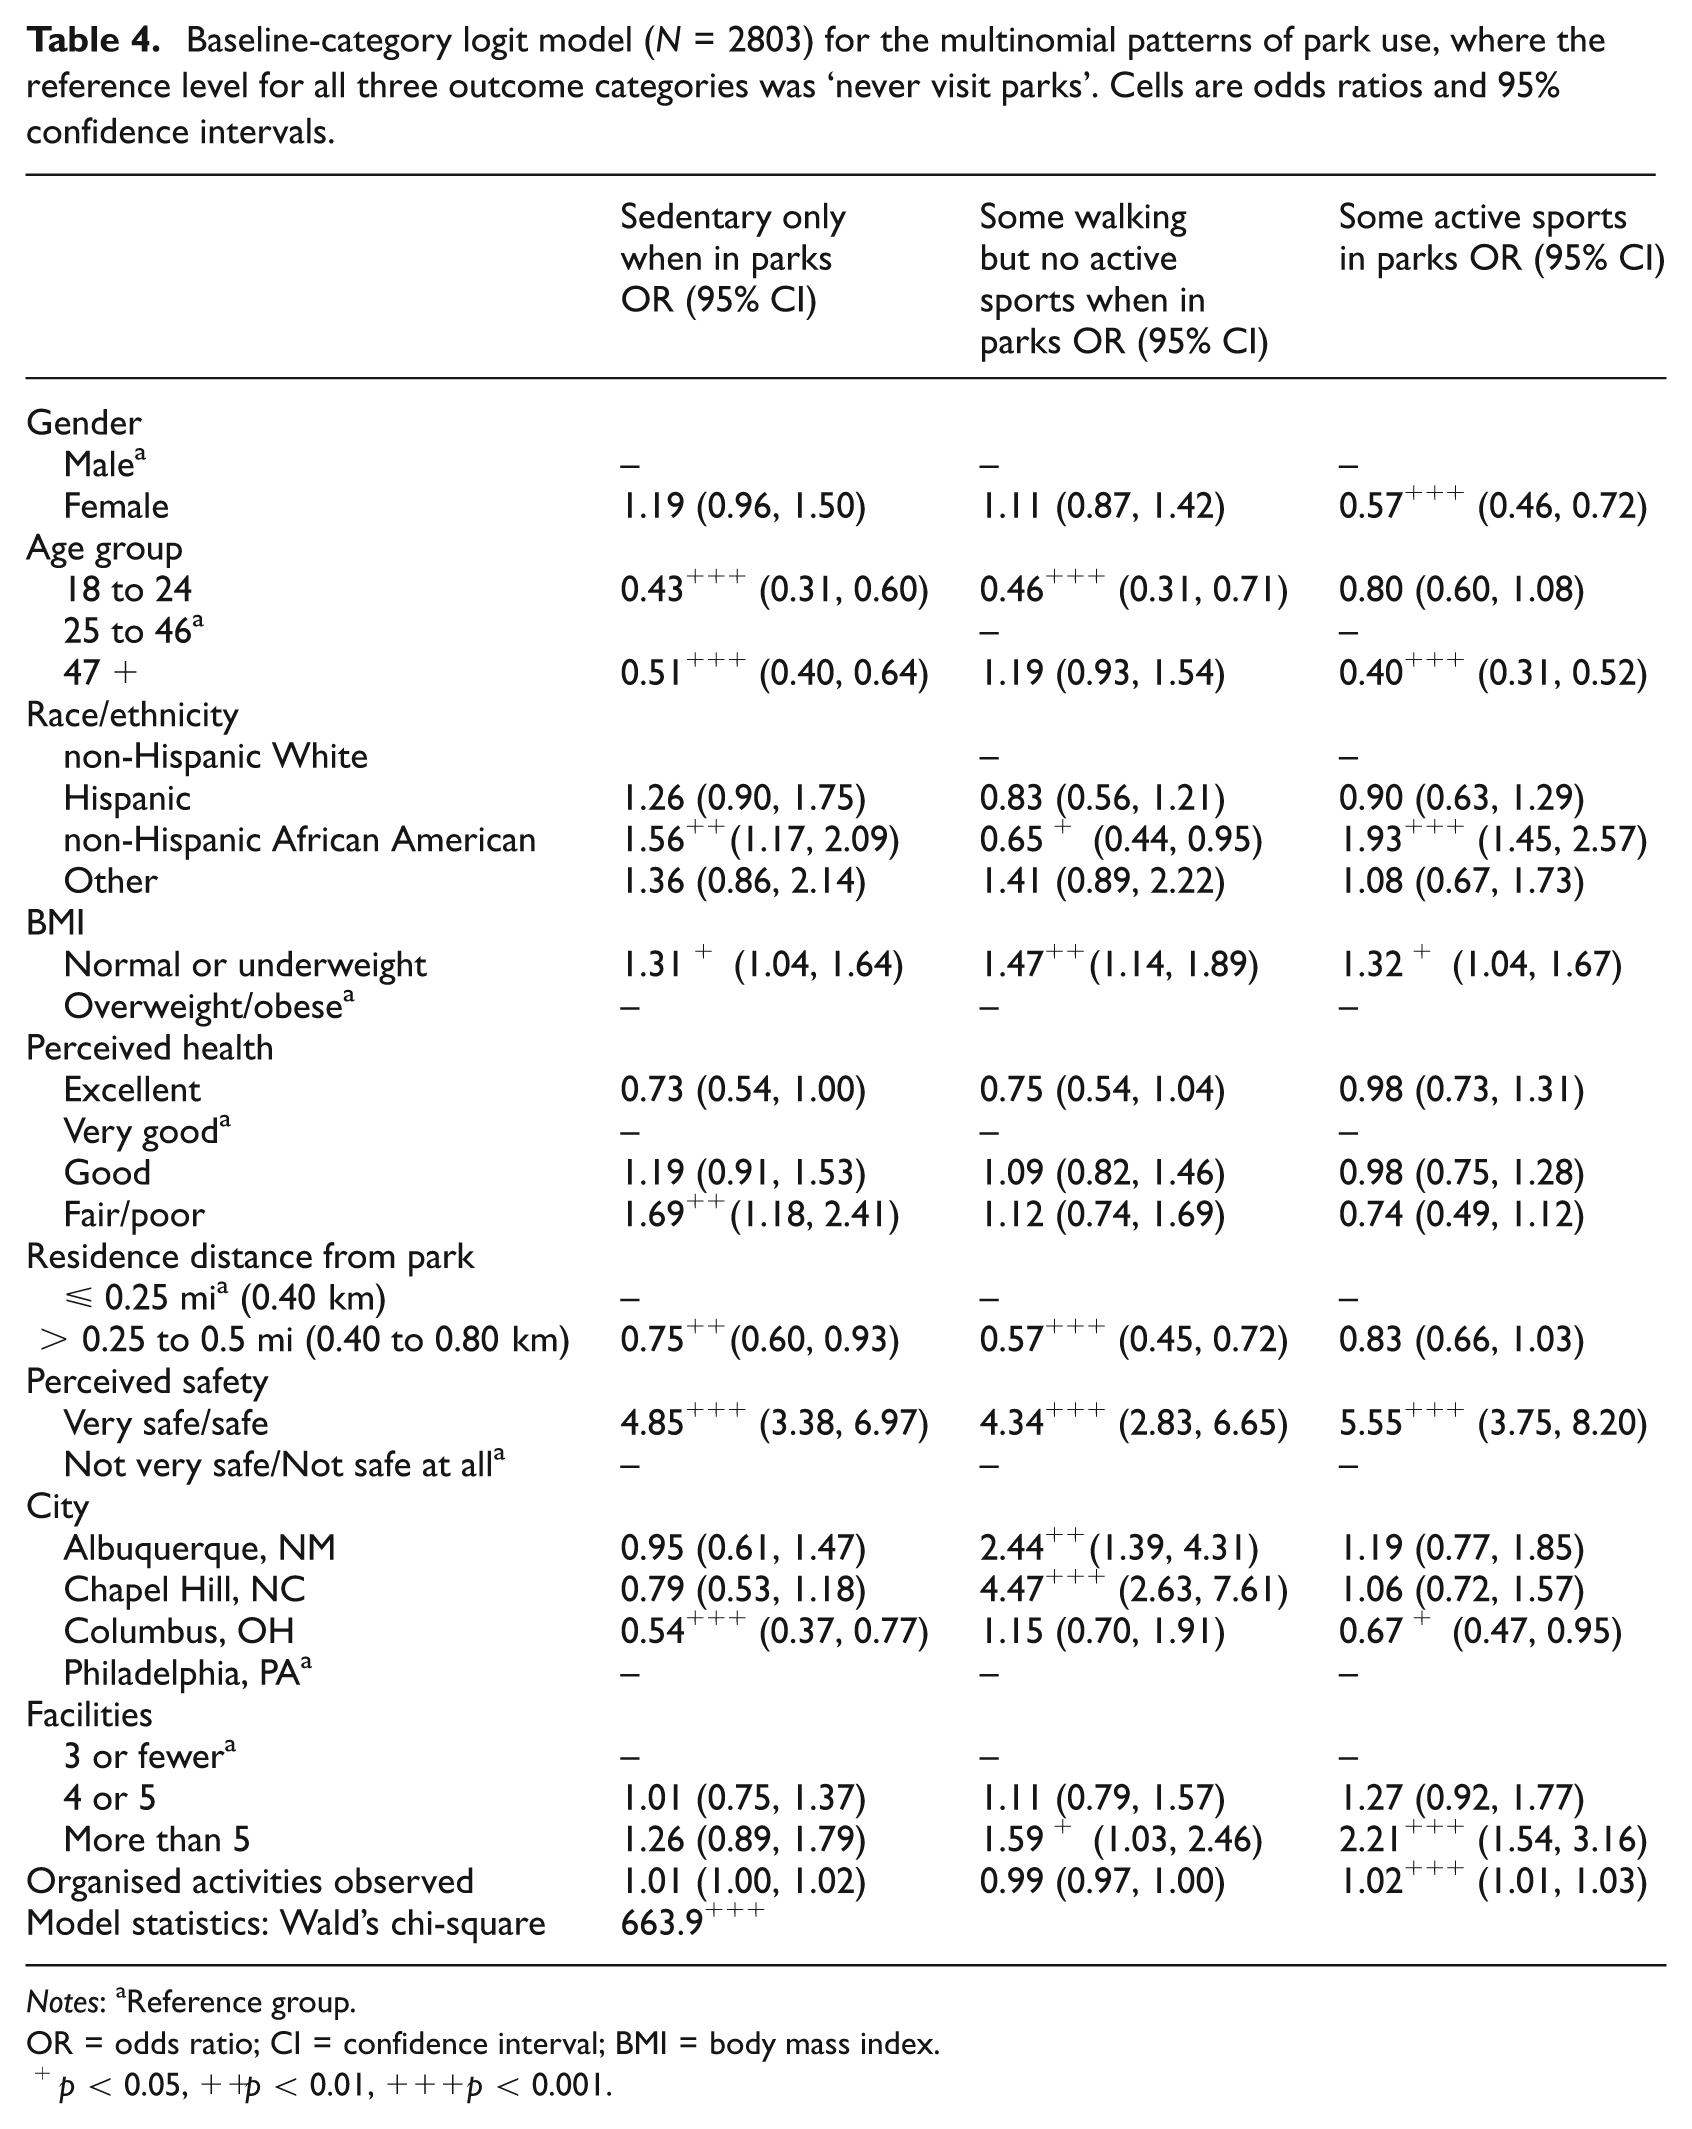
Notes: aReference group.
OR = odds ratio; CI = confidence interval; BMI = body mass index.
p < 0.05, ++p < 0.01, +++p < 0.001.
Discussion
Although it is tempting to look at odds ratios and call out the factors with the highest values as the most important, the data in our study actually point to factors with smaller odds ratios as potentially having a greater population impact. While the perception of safety has a strong effect (OR = 4.6 for having ever visited parks), it only affects a small proportion of the population (average 11% in the study sample reported feeling unsafe). In contrast, park facilities had a much smaller odds ratio for predicting park visits (1.77), but it affects more than 70% of the population. This suggests that were the associations proved causal, rather than just associational, modifying park facilities would have a greater population impact than improving perceptions of park safety.
Reported activities in parks were correlated with the number of different park facilities and whether organised activities were offered. This supports the finding that having a variety of facility types may be among the most important factors that encourage park use. Boslaugh and colleagues (2004) found that both individual and neighbourhood characteristics were significant predictors of how individuals perceived physical activity opportunities in their neighbourhood. A cross-sectional study of 20 park users in Durham, NC showed that parks with more facilities, such as shelters, picnic areas and basketball courts, had more visitors than parks with fewer facilities (Baran et al., 2014).
Data from a study similar to the present investigation found park programming to be one of the most important determinants of park use, indicating that programming specifically for older individuals may be an important means to increase PA in neighbourhood parks (Cohen et al., 2012b). Overall, the results of the neighbourhood surveys in our study suggest considerable opportunity to facilitate increased park use and PA levels through increasing the number of facilities and organised activities offered in community parks (Cohen et al., 2012a).
Park observations using SOPARC have consistently found more males than females frequenting parks (Cohen et al., 2007; Floyd et al., 2008; McKenzie et al., 2006; Reed et al., 2012). Women had significantly lower odds to perceive parks as safe, but after controlling for the perception of safety, women reported rates of park use similar to men, but they were less likely to engage in active sports. Younger adults reported less involvement in sedentary activities or walking in parks compared with adults, and older people were less likely to be sedentary or active in parks. This suggests that park administrators might sponsor more team sports if they want to increase the involvement of young adults; if they want to attract older adults, they may need to try other approaches. Increasing the number of walking paths, paving them or providing lighting, for example, could encourage walking.
Park surveys have not typically focused on BMI as a correlate for park use. We found that high BMI was negatively associated with park visitation, not only among those participating in active sports or walking but also among those involved in sedentary activities. In our study however, overweight or obese individuals who did visit their park were neither more nor less likely to report participating in active sports, walking or sedentary activities compared with normal or underweight adults. Thus, a challenge seems to be getting people to parks in the first place.
Limitations to our findings include a non-random selection of parks in that we intentionally included parks in both high- and low-income neighbourhoods. Unmeasured factors may be related to the cities themselves as well as cultural factors unique to the different cities. In addition, our study relied on self-report data, which have potential bias in that physical activity tends to be over-reported (Rzewnicki et al., 2003). Activity classifications based on reported categories, such as ‘childcare’, may not accurately classify the physical activities performed. While most of the 3815 surveys were selected from randomly selected addresses, 23% were from intercept interviews in the community and this group may be less representative than the group sampled at home. Although the parks selected were generally representative of the parks in the selected cities systematic criteria specified only that the park occupy at least 20 acres. Finally, the cultural factors influencing park visitation and analyses of specific facility types are beyond the scope or our paper.
In summary, although perceptions of park safety have a clear association with park use, the ultimate impact of addressing safety perceptions in promoting physical activity may be less than anticipated. Our findings are consistent with studies suggesting that increasing the variety of park facilities and offering more organised activities may encourage PA among specific target groups.
Footnotes
Funding
This study was funded by a grant from the National Institutes of Health, National Heart, Lung, and Blood Institute R01 HL092569. The methods, observations, and interpretations put forth in this article do not necessarily represent those of the funding agency.