
Abstract
Housing, employment and economic conditions in many nations have changed greatly over the past decades. This paper explores the ways in which changing housing markets, economic conditions and government policies have affected vulnerable individuals and households, using Australia as a case study. The paper finds a substantial number and proportion of low income Australians have been affected by housing and employment that is insecure with profound implications for vulnerability. Importantly, the paper suggests that in Australia the economic gains achieved as a consequence of mining-related growth in the early 2000s were translated as greater employment security for some on low incomes, but not all. Enhanced access to employment in this period was differentiated by gender, with women largely missing out on the growth in jobs. For the population as a whole, employment gains were offset by increased housing insecurity as accommodation costs rose. The paper finds low income lone parents were especially vulnerable because they were unable to benefit from a buoyant labour market over the decade 2000–2010. They were also adversely affected by national policy changes intended to encourage engagement with paid work. The outcomes identified for Australia are likely to have been mirrored in other nations, especially those that have embraced, or been forced to adopt, more restrictive welfare and income support regimes.
Introduction
Over recent decades there has been considerable policy and academic debate on the use of market-based policies to achieve national, social and economic objectives. The shift away from more established policy settings has been variously labelled as the rise of neoliberalism (Duggan, 2012; Harvey, 2005) and the emergence of a ‘workfare’ state (Peck, 2001; Peck and Jones, 1995). A reliance on new policy settings has been widely reported, with neoliberal policies employed in Europe (Kirby and Murphy, 2011), Australia (Argent, 2005), South Africa (Bond, 2000) and many other nations (Dingleday, 2007). The critique of neoliberalism has been challenged in a number of regions, with Ong (2006) arguing that in south-East Asia, neoliberalism is a ‘malleable’ technology of governance that has been adopted by different governments in different ways, assisting them to compete in global markets. Relatively recent political developments appear to have reinforced the trend towards neoliberalism, with the Cameron Government in the UK (Deas, 2013), the Abbott Government in Australia (Grattan, 2014) and the Harper Government in Canada (Donald, 2014) further reducing public services and limiting access to income support and other publicly-funded benefits.
The analysis of neoliberal policy settings and their consequences often struggles to capture their full impact. While evaluations often focus on whether policies achieve narrowly defined targets, shifts in income support and access to publicly provided services may have profound and cumulative implications on many dimensions of life. This paper uses Australia as a case study, examining the probability of a household experiencing precarious housing, precarious employment, or both during a 10-year period of economic and policy change. It analyses this incidence for low and high income households across Australia before considering how policy change may have affected the incidence of housing and employment precariousness across the population.
Economic change, neoliberalism and the Australian housing market
Over the past two decades Australia has experienced its second longest period of sustained economic growth, with only the ‘long boom’ (Stilwell, 1980) from 1949 to 1972 of greater duration. At the same time, the nation has experienced ongoing economic restructuring, an opening up of the economy and labour markets, and growth in mineral exports since 2000 (Kearns and Lowe, 2011). From a social welfare perspective such change has had both adverse and positive consequences: on the one hand, the boom in export earnings has resulted in rising real incomes for Australians (Whiteford, 2013) and buoyant revenues for government, which has enabled policy innovation in key areas, including the funding of childcare, assistance to persons with a disability and investment in education. On the other, growth in the minerals sector has resulted in a ‘patchwork’ economy (Beer, 2012), as the rising value of the Australian dollar and inflationary pressures have ‘crowded out’ manufacturing and other established industries.
Australian governments began to adopt avowedly neoliberal policies from the mid-1980s (Pusey, 1991). Significant policy shifts included macro-economic policy reform, such as the floating of the currency and formally adopting monetarist policies, as well as introducing more restrictive access to unemployment benefits; cuts in outlays on public housing and some other services; and privatisation of assets. New policy settings were introduced with the intention of generating a more productive and globally-competitive economy, as a mechanism for ensuring scarce public resources would be allocated to those in greatest need, and as a strategy for empowering private sector investment.
Policy reform has contributed to economic growth, but also rising levels of inequality (Western et al., 2007) and a growing crisis of housing affordability on a number of indicators. Income inequality has risen in Australia over the past two decades (Whiteford, 2013), and there has been a growing perception that society has become less equal. However, as Meagher and Wilson (2008) observed, disquiet with a less egalitarian society has been tempered by a limited understanding of the nature and impact of inequality, a belief that economic growth will provide solutions to the challenges of poverty and disadvantage, and a distrust of redistributive policies and programmes. Analysis of inequality in Australia has concluded that while income inequality has grown over the past 20 years, consumption inequality has remained relatively constant. The difference can be attributed to growth in programmes of assistance and income support that have provided many vulnerable Australians with ‘social wage’ benefits that compensate for their limited incomes (Beer and Forster, 2002). As a number of observers have noted, Australia has a large and complex welfare system that provides benefits to up to 32% of households (Marcuse, 1996) and on average the Australian Government spends more than $20,000 on each individual (Productivity Commission, 2014). Per capita spending on indigenous Australians is estimated to be more than twice that figure. Many households are vulnerable to change in entitlement regimes, especially through market oriented reforms (McClure, 2014).
The housing market is a second influence on the welfare of Australians. Across a number of measures Australia is considered to have some of the least affordable housing globally (Demographia, 2013) and this phenomenon is not limited to the major metropolitan centres, with the regional city of Port Macquarie listed as the most unaffordable housing market in Australia, followed by Sydney. The causes of Australia’s housing affordability crisis are multi-dimensional and complex (Yates and Milligan, 2008) and include tax arrangements that provide favourable treatment to capital investments over those that generate profits (Wood et al., 2008); the impact of negative gearing for investment in rental properties; the withdrawal of government support for investment in new public rental housing; relatively high mortgage interest rates for home purchasers; and structural failure in housing supply (Flood and Baker, 2010). The latter is especially significant as the Australian Government’s National Housing Supply Council (Commonwealth of Australia, 2012) estimate a shortfall of 130,000 dwellings, an undersupply that is predicted to grow over the next 30 years to more than 250,000 dwellings (NHSC, 2012).
A decline in housing affordability has been accompanied by change in employment conditions. Australia’s labour market began a process of de-regulation in the early 1980s, with economic growth accompanied by an expansion in non-conventional forms of employment, including casual and contract work (Burgess and Campbell, 1998). Labour market data for September 2013 showed a labour force of 11.6 million persons, and an unemployment rate of 5.7%. Fully 30% of the labour force was employed on a part time or casual basis, and this was substantially higher than for comparator economies including the United Kingdom, New Zealand, Canada and the United States (ABS, 2013). Other research also found higher rates of insecure employment in Australia relative to other nations (Campbell and Burgess, 2001).
Housing and labour market researchers have hypothesised that changing forms of employment have affected the ways in which households have been able to participate in the housing market. Wulff and Maher (1998) commented upon growth in the number of households remaining as private tenants for 10 years or more. Winter and Stone (1998, 1999) examined the argument that younger Australians were no longer able to enter home purchase because of their ‘marginal attachment’ to the labour force, that is, an extended reliance upon casual and contract forms of employment that eroded their capacity to either save a deposit or secure a mortgage. They found both factors limited entry into home ownership, a position that eased after 2000 as alternative mortgage providers emerged. However, high interest rates and escalating house prices from 2001 raised a new barrier to home ownership (Productivity Commission, 2004), with mortgage repayments excluding many (Beer, Faulkner, et al., 2011).
Policy change, labour market restructuring and declines in housing affordability find expression within the household (Doogan, 1996; Johnes and Hyclak, 1994; Muellbauer and Murphy, 1990), effectively shaping the life chances of individuals. For both individuals and households across Australia position within the labour market is the primary determinant of wellbeing, but as Randolph (1991) noted, housing plays an important mediating role. Income support and other government funding serves as part of the ‘social wage’ that Labor governments have argued forms part of an implicit contract between Australian citizens and the public sphere (Harding, 1995). Changes to employment, housing or government support can have a profound impact, and at the level of the individual the three determinants of wellbeing interact in multiple and complex ways. For example, change in the form of employment – from permanent, full time employment to casual hours – affects both the capacity to purchase accommodation and the ability to gain access to income support and other social-wage expenditures. More broadly, Peck (2001) has argued that neoliberalism requires the implementation of ‘workfare’ states, that minimise public outlays on income support, encourage individuals into the available work, and place downward pressure on wages.
Precarious housing and precarious employment: Analysing complex outcomes
Economic change, policy change and shifts in the housing market have the potential to affect the life chances and wellbeing of all parts of the population, and most especially the vulnerable. What is unclear is how ‘at risk groups’ have been affected over time, which vulnerable populations have been most affected and what role policy change has played in either mitigating or exacerbating risk factors. Risk is a defining feature of contemporary society (Beck, 1992, 2000) and the concepts of precarious housing and precarious employment make direct reference to the marginal position of many households. The work of a number of researchers (Baker et al., 2013a, 2013b; Mason et al., 2013; Wood and Ong, 2010) has emphasised the critical role of disaggregated analysis for understanding the interaction between housing and labour markets. Broad scale analyses do not reveal the extent to which changes in policies and the economy differentially affect high and low income households in Australia. By considering the differences in exposure to housing and employment problems between income groups, it is possible to develop a better picture of the true impact of housing and labour market conditions on the Australian population. Moreover, estimates of who is simultaneously experiencing what we would term precarious housing and employment gives insight into how many households in Australia may require both housing and employment support (Wood, 2009).
Defining the precariously housed and the precariously employed
Households were defined as precariously housed if they experienced two or more of the following: housing costs (rent/mortgage) in excess of 30% of gross household income; they lived in a private rental property; or they experienced a forced move in the preceding 12 months (collected as part of the residential mobility component of the HILDA dataset). The first measure, housing costs in excess of 30% of household income is a commonly used definition of unaffordable housing in Australia, with the focus of analysis often limited to households in the lowest 40% of the income distribution (Gabriel et al., 2005). This ‘Ottawa’ definition of housing affordability (Stone et al., 2011) is well established in the literature (Berry, 2004; Hulchanski, 1995; Whitehead, 1991) and widely used by policy makers in Australia.
The second indicator of precarious housing is living in private rental accommodation. In Australia private rental housing is an insecure tenure due to limited lease terms and the relative powerlessness of tenants vis-à-vis landlords (Paris, 1993). Burke and Ralston (2004) and Beer, Baker et al. (2011) noted that while private rental housing offers tenants greater choice, public rental housing is often preferred because of the security public rental housing offers, the absence of discrimination and/or harassment, the ability to access support if needed, and the capacity to match dwelling location and type with need. The third key measure of precarious housing used in this study was whether a household was affected by a recent forced move. Such involuntary relocations provide definitive evidence both of a lack of security and stability, but also of a high probability of additional forced relocation (Wood and Ong, 2010). Forced moves are often overlooked because of the absence of reliable data. Slatter and Beer (2003) estimated there were 10,000 evictions in South Australia’s housing market annually, while later work showed that forced moves frequently resulted in rough sleeping, institutionalisation and the need to fall back on the support of friends and relatives (Beer et al., 2006).
Household level employment status was defined as ‘precarious’ when all adults in a household active in the labour market were either employed on a casual or labour hire contract, or were unemployed. Fixed term contracts were not classified as precarious because they more closely mirror the terms and conditions of permanent contracts than casual contracts, and fixed-term contract workers have been shown to be socio-demographically similar to persons employed permanently. Self-employment was not considered precarious as this employment arrangement represents a diverse group and it is difficult to generalise from their experiences. The self-employed can be amongst the poorest but also the most well remunerated individuals within the Australian labour market. Excluding self-employment from the definition of precarious workplace arrangements leads to a conservative estimate of the prevalence of precariously employed households.
Methods and analysis
To provide an overview of the level of precariousness in housing and employment across the Australian population, we estimated the prevalence of Australian households experiencing each outcome for the most recent available year of data, 2010. This estimate was based on data from the Household, Income and Labour Dynamics in Australia (HILDA) survey, a nationally representative panel survey of Australian households and individuals conducted annually since 2001. Households and individuals participating in HILDA are surveyed each year and information is collected using face-to-face interviews and self-completion questionnaires. The analysis described in this paper is based upon 54,908 responses across the 10 years and is drawn from households containing at least one person aged between 25 and 64 where the household has been represented in any or all waves.
Prevalence was calculated for different household types and we also estimated the relative association (as an Odds Ratio and 95% Confidence Interval (CI)) between precarious housing and precarious employment in 2010 for each household type. Population prevalences were estimated by weighting the sample prevalence of each outcome to the underlying population (based on the sampling methods of HILDA), using the svy suite of commands in STATA 11.0. To examine trends over time in relative inequalities between lower and higher income households we used generalised linear regression models to estimate the relative risk (and 95% CI) of individuals being precariously housed and/or employed in each year, comparing households in the lower 40% and upper 60% of the national income distribution. We then estimated the population prevalence of each outcome for each year in the period 2001 to 2010, stratified by the four dominant household types (couple-only households, couples with child/ren, lone parents with child/ren, and persons living alone) and restricted to households in the lower 40% of the national income distribution.
Precarious housing and employment by household type in 2010
Different types of household were not equally likely to experience disadvantage in employment or housing. While the majority of households in Australia comprise couples or couples with children (65%), the overwhelming majority of the remainder are lone person or lone parent households. Just 11% of households containing at least one person aged 25–64 fell into neither of these categories. This remaining population is further divided into a large number of household types – such as households comprised of un-related adults – and are not further discussed as the focus here is on the major trends in precarious employment and housing across Australia. Using HILDA data just over six million households comprised the lowest 40% of the income distribution in Australia at 2010, with 1,129,000 of these households affected by both insecure housing and employment.
Over 7% of Australian households in 2010 were lone parent households with children under 15 years of age, and 1.6% of these households had a child under five. Lone parent households with children had the highest prevalence of precarious housing and precarious employment. Amongst lone parent households with a child under five years of age, fully 39% were precariously housed, 45% were precariously employed and 16% were both precariously housed and precariously employed (Table 1). Circumstances were not significantly better for lone parent households with older children: some 22% were housed precariously, 32% were in precarious employment and 9% experienced both precarious housing and precarious employment (Table 1).
Percentage of households in precarious housing and/or employment, selected household categories, 2010.
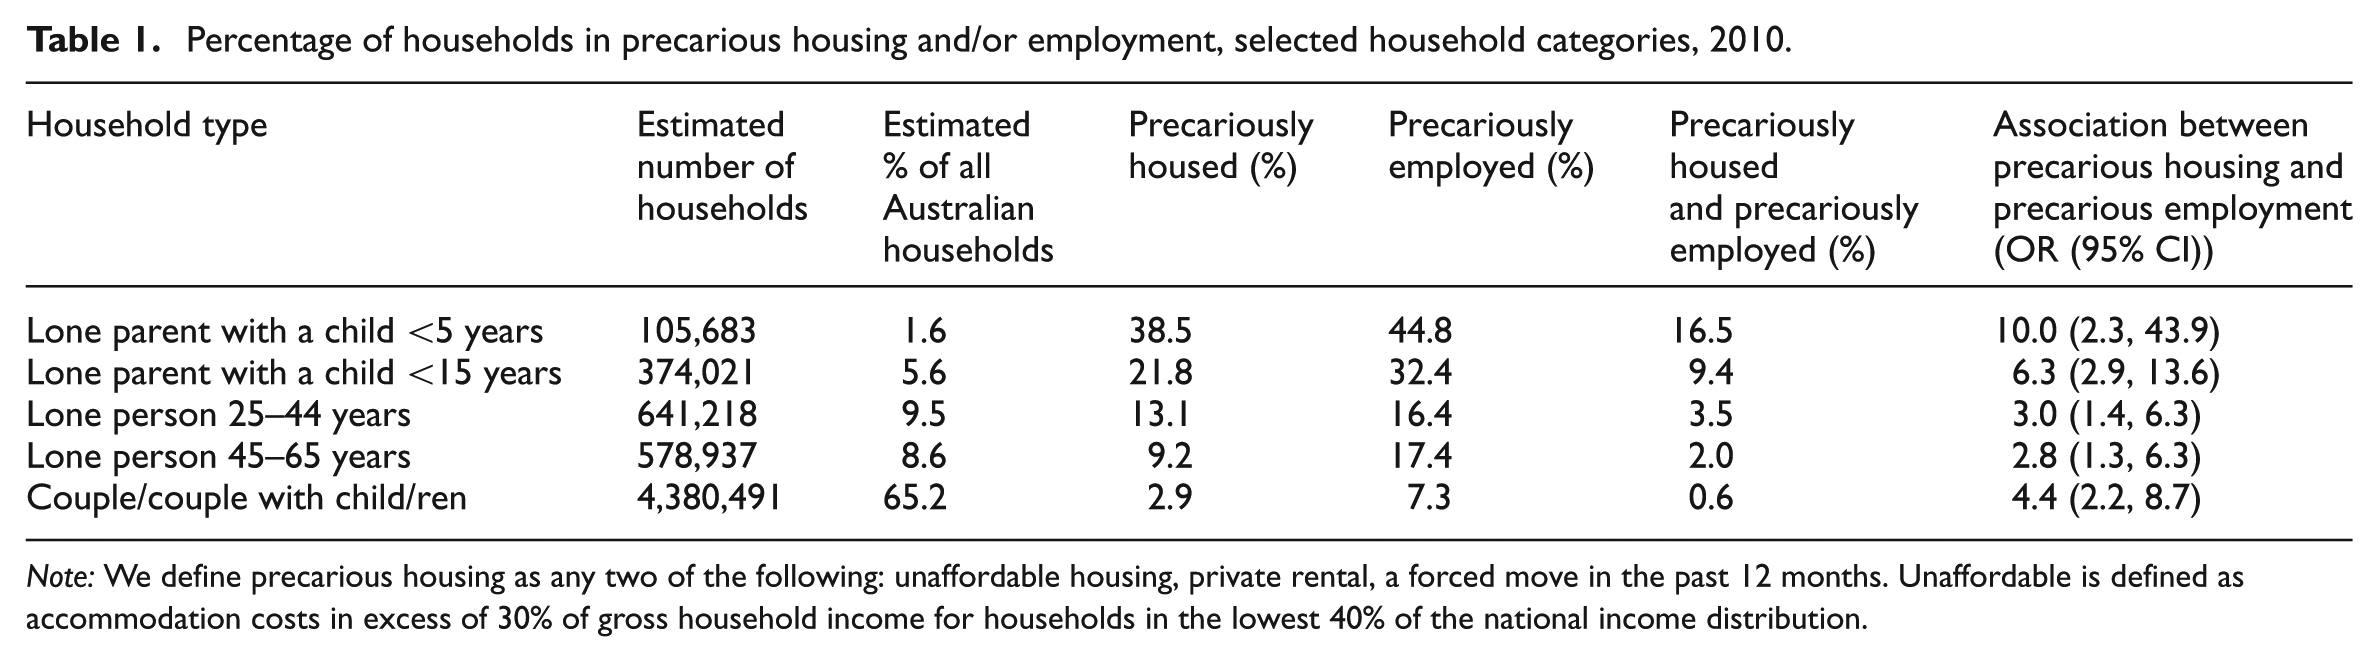
Note: We define precarious housing as any two of the following: unaffordable housing, private rental, a forced move in the past 12 months. Unaffordable is defined as accommodation costs in excess of 30% of gross household income for households in the lowest 40% of the national income distribution.
The final column of Table 1 presents ‘odds ratios’. These are a statistical measure of the probability, for each household type, of having precarious housing and precarious employment. These ratios estimate that lone parent households in Australia with a child under five years of age where employment was precarious were 10 times more likely to be in precarious housing than a comparable household with secure employment. A comparable level of risk existed for lone parent households with a child up to 15 years of age, where those without secure employment were 6.3 times more likely to be in insecure housing arrangements when compared with those employed on a continuing basis. The impact of precarious employment on precarious housing was less substantial – but still notable – for the other population groups.
Trends in relative inequalities by income (2001–2010)
Comparing lower and higher income households, persistent inequality in precarious housing and precarious employment was observed over the 2001–2010 period, with some year to year fluctuations. The data also suggest that relative inequalities in employment vary less over time than relative inequalities in housing (Figures 1 and 2). On average across the 10 years, lower income households were around four and a half times more likely to experience precarious housing when compared with higher income households. This relative inequality was highest in 2004 (RR 6.5; 95% CI: 5.0–8.4) and lowest, relatively recently, in 2009 (RR 3.5; 95% CI: 2.8–4.4). These results need to be placed within the context of recent shifts in Australia’s housing markets. House prices rose in the early 2000s and were accompanied by a rise in interest rates that generated an affordability crisis for many tenant and home purchasing households (Productivity Commission, 2004). Interest rates fell substantially in 2009 as the Australian Government and its agencies sought to counter the effects of the global financial crisis (GFC). Lower income households were approximately five times more likely to be in precarious employment when compared with higher income households. In contrast with housing, this risk was highest in 2009 (RR 6.2; 95% CI: 5.1–7.4) and lowest in 2001 (RR 4.2; 95% CI: 3.7–4.8).
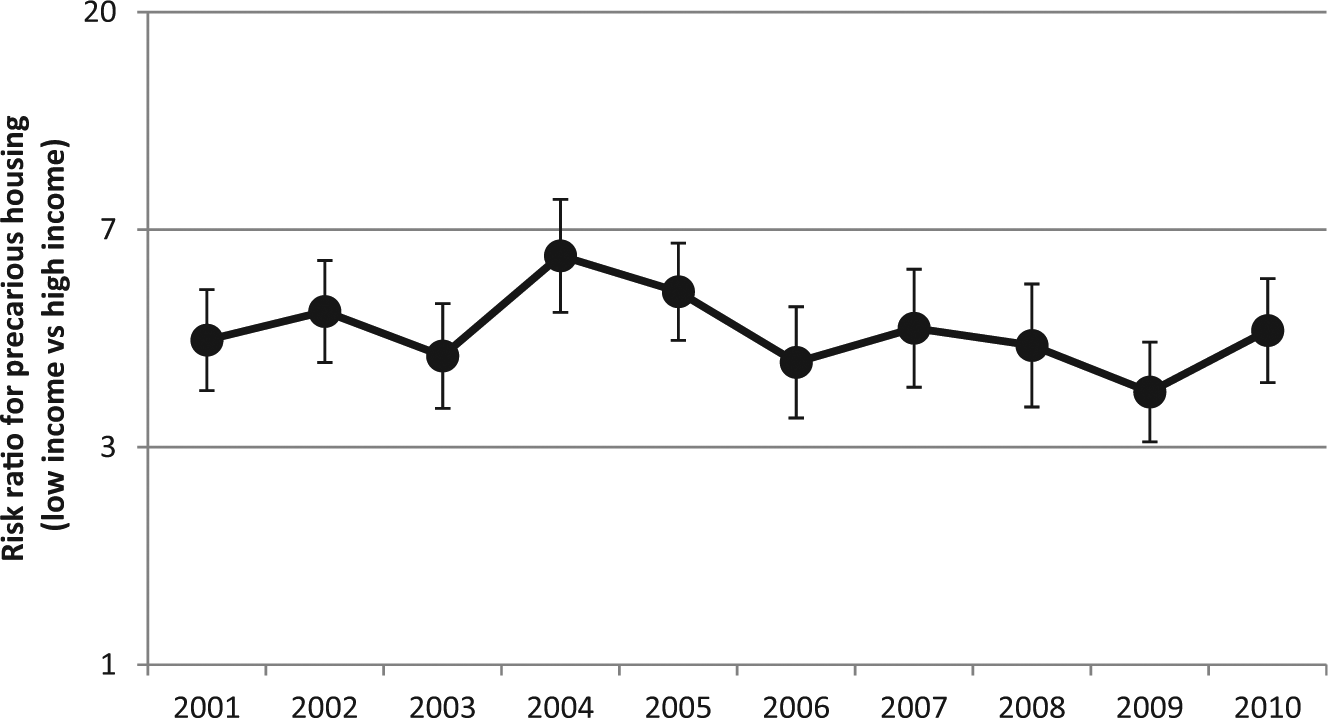
Relative risk of being precariously housed: Low income vs high income.
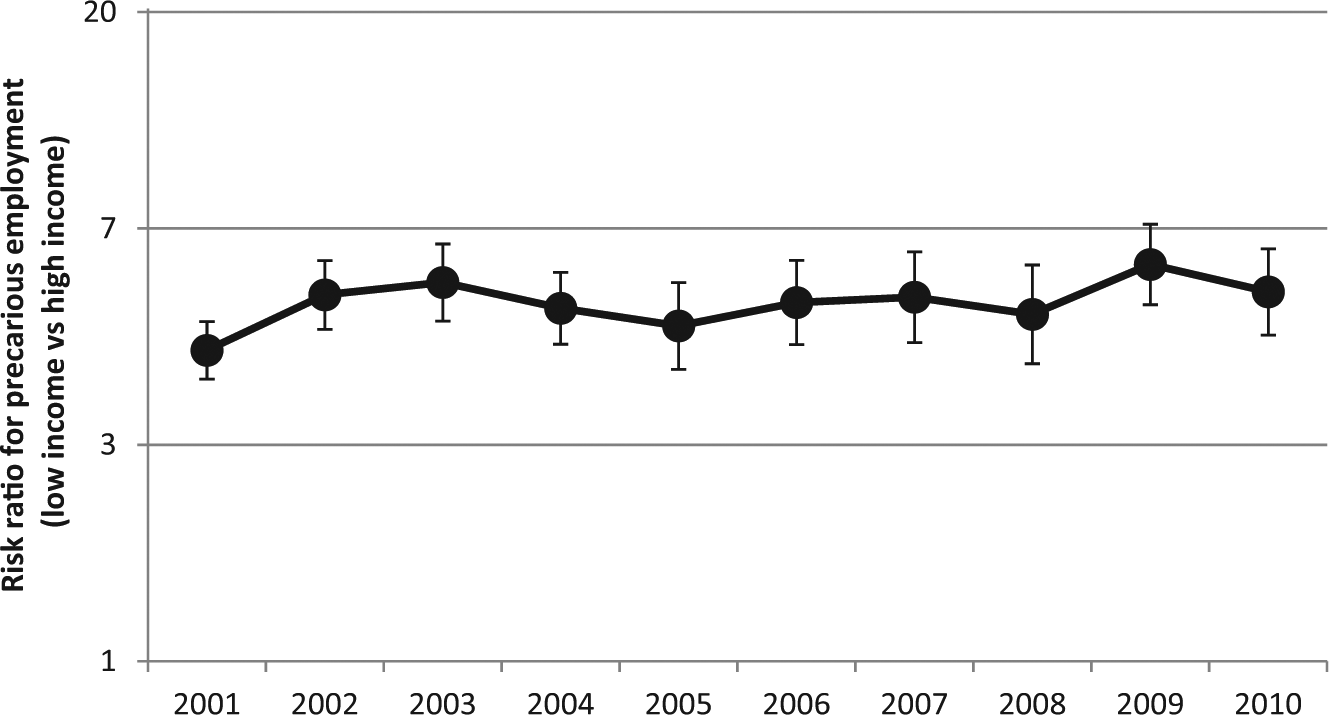
Relative risk of being precariously employed: low income vs high income.
Relative inequalities in the likelihood of experiencing both precarious housing and employment were on a much larger scale than either indicator in isolation and appeared to more closely reflect movements in the housing market than those in employment (Figure 3). Importantly, the data emphasise that low income households were at a very much greater level of risk to adverse social and economic circumstances when compared with those on higher incomes, a finding that mirrors US experience (Saegert and Evans, 2003). No overall trends were evident over time, rather it is possible to observe brief periods of increase and decrease in relative inequalities. The relative risk of being in precarious employment and housing was highest in 2003 (RR 18.7 (95% CI: 9.7–36.2)) and lowest in 2006 (RR 8.0 (95% CI: 4.0–16.2)); however, the confidence intervals overlap on these estimates.
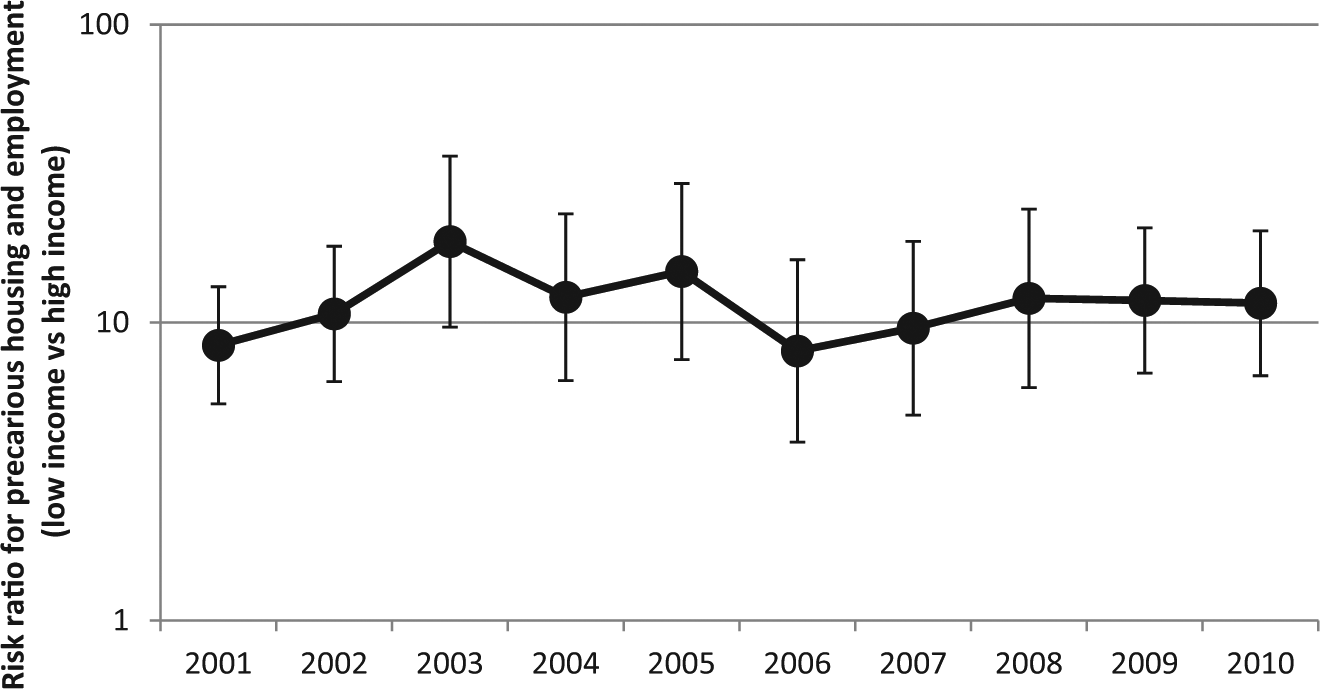
Relative risk of being precariously housed and precariously employed: Low income vs high income.
Precarious housing and employment by household type (2001–2010)
Change over time in precarious employment and precarious housing was examined for the period 2001 to 2010 for low income households for each of the major household types (Figures 4, 5 and 6). The prevalence of precarious housing amongst lower income households shows a clear separation according to household type as distinct from couple households. Lone parent and lone person households were more likely to be in precarious housing than their couple household counterparts at all years within the decade. This difference is likely to reflect the financial impact of potentially two, rather than one, wage earners within the household. Throughout the decade lone parent and lone person households recorded a rate of precarious housing approximately double that evident for households comprised of couples and couples with children. The only major exception was the period 2004 to 2007, when the prevalence of precarious housing fell for lone parent households, before a sharp return in 2007. This remission to high levels of precarious housing for lone parents reflects a shift in the treatment of lone parents by Australia’s social security system, especially those with older children. In 2007 the Howard Government introduced welfare to work reforms that required persons in receipt of a parenting payment to engage in at least 15 hours per week of work from the youngest child’s seventh birthday. Fok and McVicar (2012) found this reform resulted in many parents ‘exiting’ income support and, we would conclude, secure housing. The imposition of these new conditions on supporting lone parents forced a significant percentage back into precarious employment, and further marginalised their position in the private rental market.
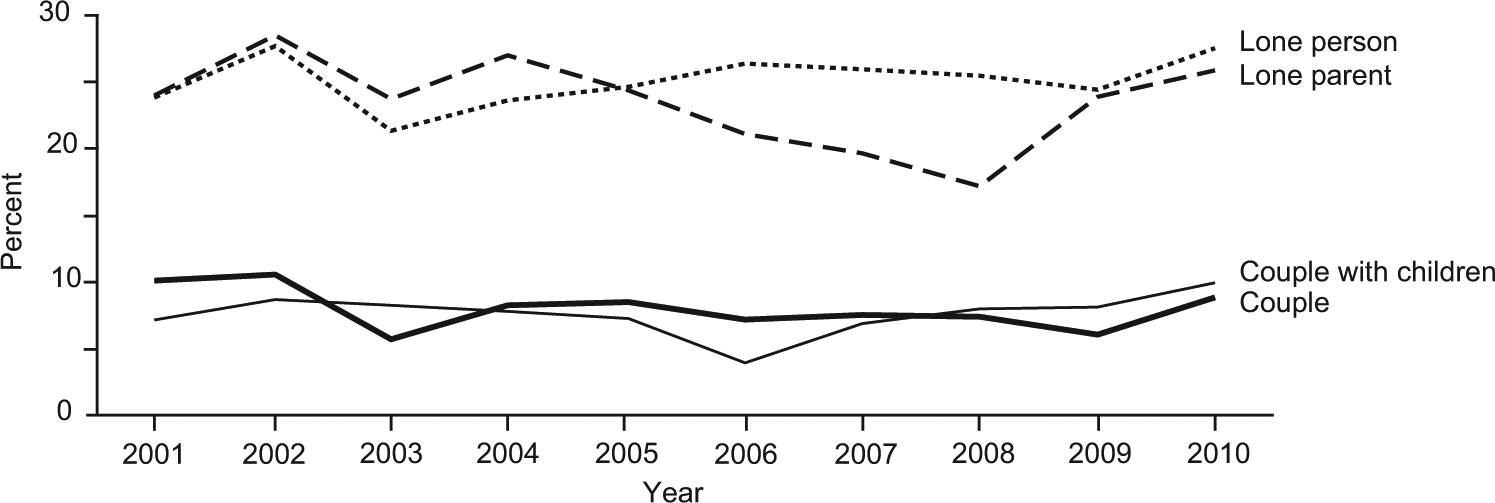
Low income households, per cent precariously housed.
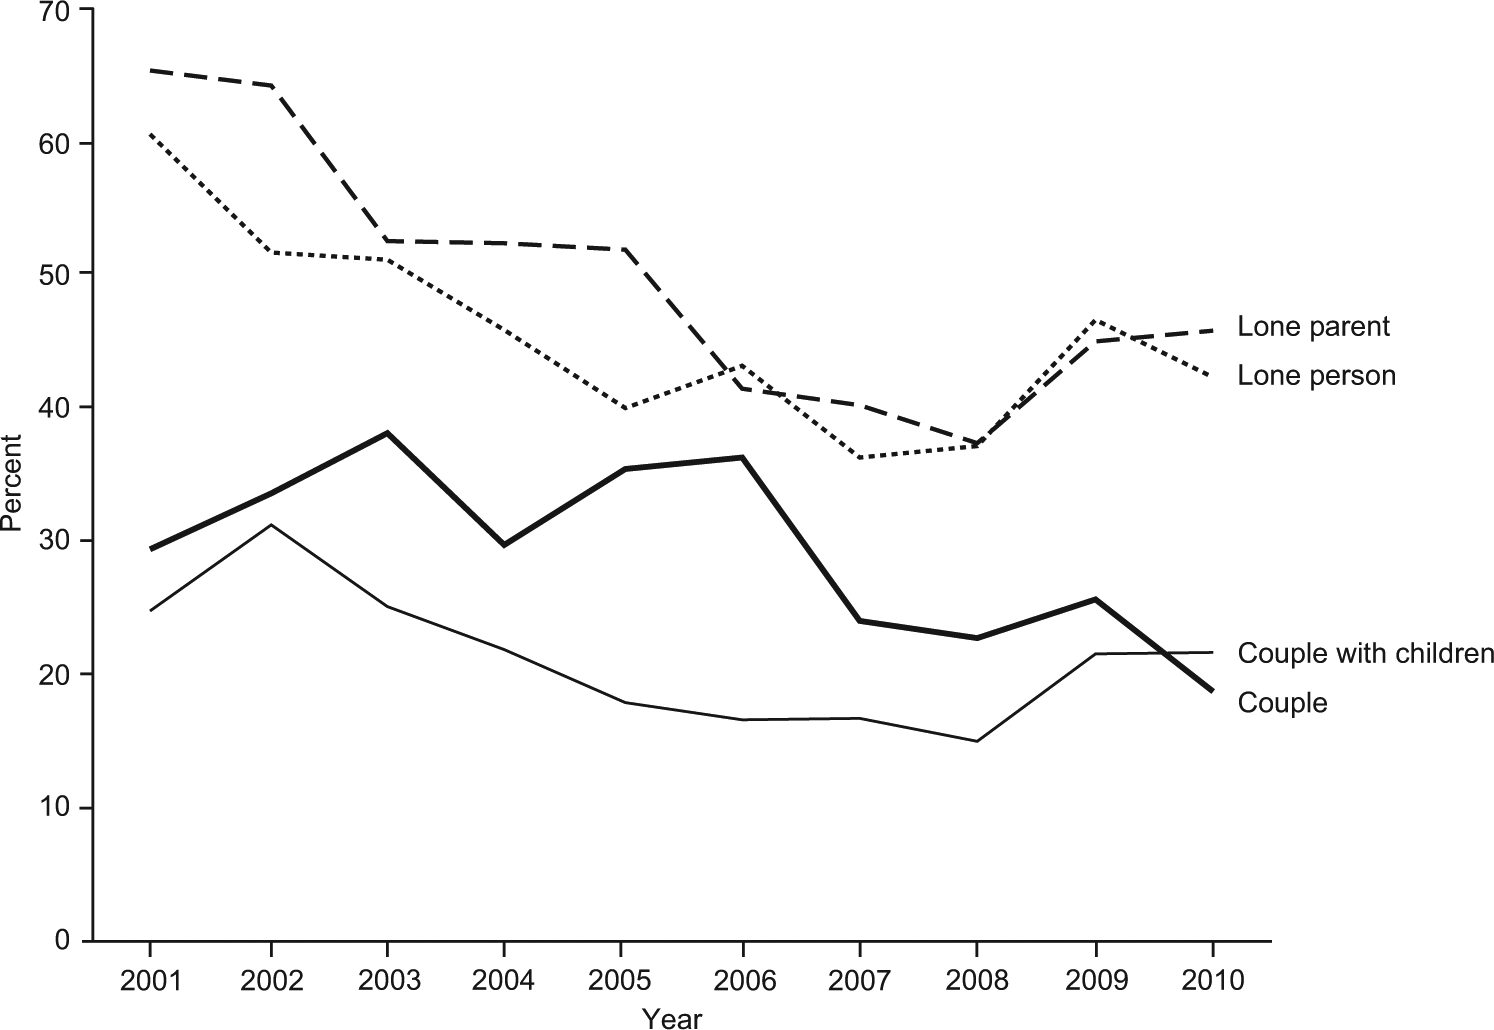
Low income households, per cent of households precariously employed, 2001–2010.
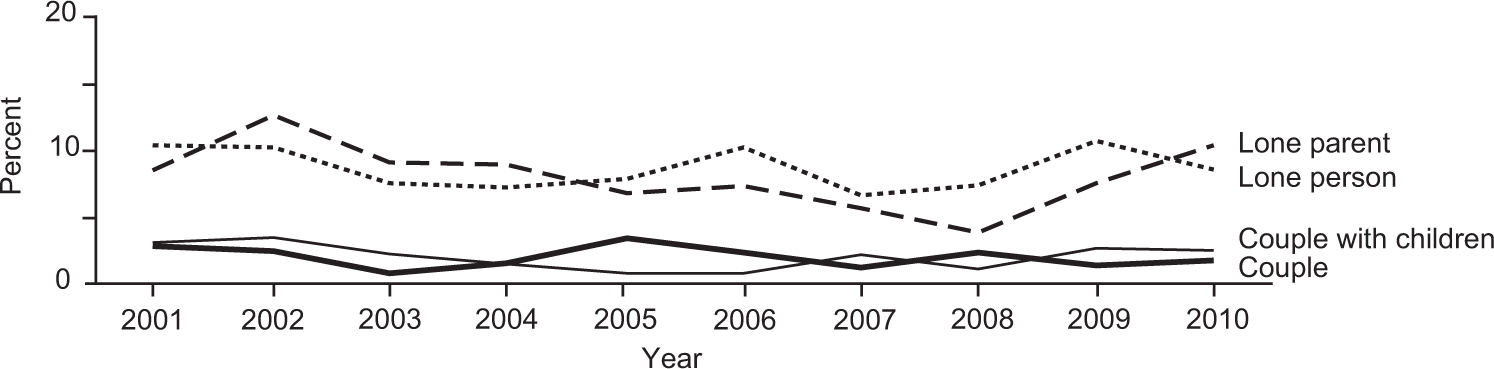
Low income households, per cent precariously housed AND precariously employed.
Precarious employment in lower income households exhibited a similar household type patterning. Lone person and lone parent households had the highest prevalence (in excess of 60% in 2001), while couple only and, more particularly, couple with children, households had a lower prevalence of precarious employment across all years. Across all household types, there was a downward trend in the prevalence of precarious employment over time until 2007, when the likelihood of being precariously employed appears to have increased substantially for lone person and lone parent households, partly as a consequence of change within the administration of government-provided income support.
Lower income lone parent and lone person households had the highest incidence of combined precarious housing and precarious employment amongst all low income households. Over the 10 years, between 6% and 13% of lone parent and lone person households experienced both precarious housing and precarious employment, compared with couple and couple with children households that ranged between 0.5% and 4%. The percentage of lone parent households affected by both precarious housing and precarious employment experienced a sustained fall from 2002 to 2008, before rising sharply over the subsequent two years. The combination of precarious housing and precarious employment for couple only and couple with children households remained around 2% for the decade.
Overall, approximately 5% of all households across Australia are confronted by both a precarious position in the labour market and precarious circumstances with respect to their housing. This is a substantial impact, with 1,129,000 households affected by this two-dimension challenge. It is highly likely that comparable processes are evident in other developed economies, because while Australia has had a higher rate of precarious employment than other economies, many nations have embarked on a similar policy trajectory. These outcomes, importantly, are not evenly distributed. The households at greatest risk were found to be sole persons and lone parents (especially those with a child under five years of age) in the lowest 40% of the income distribution. Lone parent households without work and a child under five years of age were 10 times more likely to be in precarious housing than a similar household with secure employment. The corresponding ratio for sole parents with a child between five and 15 years of age was 6.3 times that of their employed equivalents and three times for lone person households aged 25 to 44. The data reinforce the view that security of employment is pivotal to the capacity to find secure and affordable accommodation.
This investigation of precarious housing and employment also reflects broader social processes including issues of gender. The feminisation of poverty has been well documented in Australia over a considerable period (Cass, 1985) and the concentration of women in lone person and lone parent households is well established in Australia (Baker and Tually, 2008). Researchers have also documented a relationship between gender and precarious employment (Vosko et al., 2009). There is a strong gender dimension to the outcomes generated by the analysis within this paper and that women are more likely to be affected by the combination of adverse housing processes and labour markets. Wood and Ong (2010) argued that couple households with children were more likely than other household types to experience housing stress. Our analysis examines a different set of social and economic conditions, as precariousness is broader than housing stress, though many households are affected by both. We can conclude, however, that for women living without partners, the presence of a child or children in the home adds to the risk of being exposed to precarious housing and precarious opportunities for employment.
Our analysis has shown variation within the population in the level of exposure to precarious housing and precarious employment, as well as change over time in the percentage of households affected by one or both risks. As Figure 5 demonstrated, a substantial percentage of the low income population was confronted by a precarious labour market position. Labour market circumstances, however, improved for all household types over the period 2001 to 2009 as Australia reaped the benefits of a buoyant economy fuelled by mining revenues. The level of risk within the labour market increased after 2008 as a consequence of the GFC, with the most vulnerable household types experiencing the largest rise in precarious labour market circumstances. The data also suggest that low income households experienced a disproportionate share of the negative impacts of the GFC, especially given its limited impact on the economy overall.
Conclusion
The problems of housing affordability in Australia have been well documented in both the academic literature (Beer et al., 2007; Berry, 2004; Stone et al., 2011; Yates and Milligan, 2008) and government policy documents (Productivity Commission, 2004). What has been less well understood is the general relationship between housing, policy change and employment and how the three interact to generate either greater opportunity for households or more profound disadvantage. The data and discussion presented in this paper has shed light on the ways in which changing social policy, access to employment and the housing market have operated in combination to significantly affect the wellbeing of an already vulnerable group – women who are sole parents. The targeting of welfare reform on sole parents was intended to encourage a return to work, but formal and informal barriers to employment meant that change simply reduced household incomes and placed sole-parent households in more precarious accommodation. The analysis presented here has shown that housing and labour market processes interact to generate substantial risks for some households and that it is possible to identify a group that is confronted by risks generated by both the housing system and the formal labour market.
Further research is needed into how the processes discussed in this paper find expression geographically. Australia’s labour and housing markets are very uneven geographically, and its likely – though not certain – that the challenges for vulnerable populations discussed in this paper will be more acute in the large metropolitan centres. Housing markets, labour markets, policy and population are all affected by geography. Our capital cities (especially those on the eastern seaboard) for example, have more extreme problems of housing affordability alongside different labour market pressures than much of regional Australia. The aim of this paper has been to build a picture of overarching national trends; we stress the importance of subsequent work at various spatial scales. Subsequent analysis will build on the findings of this paper, to develop a more nuanced, geographical understanding of the way that housing and employment problems interact in different policy jurisdictions – across Australia’s cities and regions. Further research is called for and this may need to be enabled through a new data source, as the HILDA dataset does not lend itself to spatial disaggregation.
The incidence of precarious housing amongst low income households appeared to move in response to drivers independent of the labour market, exhibiting a pattern that was relatively stable overall. The housing of low income lone parents improved from 2002 to 2007, before a change in social security arrangements initiated a rapid reversal. When precarious housing and precarious labour market positions were considered together, the outcomes were relatively stable over time but with greater variability amongst low income lone person and lone parent households. One of the clear conclusions to come from this research, therefore, is that buoyant economic conditions and an improving labour market did little to reduce the risks faced by those most vulnerable within Australian society. Any gains generated by the prospect of more secure employment were eroded by the impact of a tighter housing market. In addition, government decisions were shown to have the capacity to expose a significant percentage of already vulnerable households to greater risks.
There are clear policy implications from this analysis. First, a reliance upon economic growth alone is unlikely to improve the circumstances of households in precarious positions. This conclusion challenges neoliberal philosophies and practices (Peck, 2001). Specific policies are needed that address housing security and affordability in order to ensure acceptable outcomes. Second, shifting public policies have profound consequences for targeted households. Our data analysis found a significant increase in the percentage of low income lone parent households affected by precarious housing and precarious labour market circumstances (and the combination of both) post the 2007 parenting payment reforms. While Fok and McVicar (2012) considered the policy reforms to be relatively successful in encouraging individuals back into the paid workforce, our research suggests it came at a significant cost to a key group of households who had few opportunities to find either better housing as a result of increasing hours of employment, or less precarious employment. Our conclusion emphasises the importance of understanding the full impact of policy decisions.
More broadly we can conclude that despite both policy innovation and a strong economy, inequalities in the housing market did not decrease in aggregate over the period 2001 to 2010. Indeed, some housing-related dimensions of inequality worsened over time. These outcomes suggest that aggregate policy settings were incapable of reducing the incidence of precarious housing and labour market positions and those alternative policy frameworks are needed. This could include measures to increase the security offered to private rental tenants and/or boosting the supply of social housing in order to provide a realistic level of assistance to the most vulnerable.
Footnotes
Acknowledgements
This paper uses unit record data from the Household, Income and Labour Dynamics in Australia (HILDA) Survey. The HILDA Project was initiated and is funded by the Australian Government Department of Social Services (DSS) and is managed by the Melbourne Institute of Applied Economic and Social Research (Melbourne Institute). The findings and views reported in this paper, however, are those of the author and should not be attributed to either DSS or the Melbourne Institute
The data used in this paper was extracted using the Add-On package PanelWhiz for StataÛ. PanelWhiz (http://www.PanelWhiz.eu) was written by Dr. John P. Haisken-DeNew (![]() for details. The PanelWhiz generated DO file to retrieve the data used here is available from the authors upon request. Any data or computational errors in this paper are the authors. The authors extend their thanks to Ms Christine Crothers for her production of the figures used in this paper.
for details. The PanelWhiz generated DO file to retrieve the data used here is available from the authors upon request. Any data or computational errors in this paper are the authors. The authors extend their thanks to Ms Christine Crothers for her production of the figures used in this paper.
Funding
The research reported in this paper was funded by Australian Research Council Linkage Project 100200182