
Abstract
Prior studies in finance have examined the comovement of stock returns of firms headquartered in the same location. One interpretation of the results is that local investors have a ‘local bias’ due to an information advantage on local firms. We propose that localised agglomeration economies affect the fundamentals of local firms, resulting in the local comovement of stock returns. Using data for China A-share listed firms from 1997 to 2007, we find evidence of the comovement of stock returns of Chinese firms headquartered in the same city. We find inconsistent evidence for the local bias theory. The comovement of the stock returns of firms headquartered in the same city is stronger when the agglomeration economies in the city are stronger, suggesting that localised agglomeration economies provide an alternative explanation of the comovement of stock returns.
Introduction
Urban agglomeration economies enhance the productivity of firms in cities (Rosenthal and Strange, 2004) by improving their fundamentals such as revenues, earnings, investment returns and future cash flows (Dougal et al., 2015; Jennen and Verwijmeren, 2010). Therefore, agglomeration economies should have an influence on stock markets because finance theory says that any change in the firm’s future cash flows or fundamentals should be impounded into stock prices (Ross et al., 2014). Although urban economists have done extensive studies to theorise on and empirically test agglomeration economies, surprisingly few have paid attention to the relationship between agglomeration economies and capital markets. 1
In finance, increasing attention has been paid to the economic effects of geography on capital markets. One documented anomaly is that, after controlling for risk factors, stock returns of firms headquartered in the same location are significantly correlated (Anderson and Beracha, 2008; Coval and Moskowitz, 1999, 2001; Pirinsky and Wang, 2006). These findings are interpreted as investors’ local bias, the phenomenon that investors prefer to invest in stocks of firms that are geographically close to them (Baltzer et al., 2013; Ivković and Weisbenner, 2004; Seasholes and Zhu, 2010). 2 Empirical evidence has confirmed that local bias exists in the capital markets of many countries, including the US, Germany and Sweden (Karlsson and Norden, 2007; Mavruk, 2008; Rudorfer, 2007). 3
Local bias can result from information asymmetry or investors’ behaviour. The information asymmetry explanation argues that investors geographically close to the headquarters of a firm have better information about that firm and the investors are more likely to invest in the stocks of such firms (Coval and Moskowitz, 1999, 2001; Kalev et al., 2008). 4 On the other hand, the investors’ behaviour explanation states that investors’ social interactions and activities are usually confined within local regions. Investors within the same local social network are more likely to exchange local information and make similar investment decisions. For example, Hong et al. (2004, 2005, 2008) and Brown et al. (2004, 2008) find that investors are more likely to invest in a stock market when more people in their neighborhood invest in that stock market. Anderson et al. (2011) find that culture is another significant determinant of home bias in institutional portfolios. It is worth noting that these two explanations are not mutually exclusive since the behavioural explanation accommodates the plausible situation that investors can have an advantage in obtaining information about local firms via their social interactions with other local investors.
A large body of literature in urban economics has provided theoretical explanations and empirical evidence that localisation economies – the external economies arising from the spatial concentration of firms in the same industry in a city – can enhance productivities of firms in the same clustering. In addition, firms from different industries that co-locate in a city can benefit from urbanisation economies – the external economies arising from city size and industrial diversity. 5 If the enhancement of firm productivity increases firm fundamentals, leading to higher earnings, then the fundamentals of firms located in the same city will be correlated due to common agglomeration economies. Translating this to stock markets, the correlation of fundamentals will cause the stock returns of firms located in the same city to be correlated. Moreover, firms that are located in a city with a higher degree of industrial diversity and that are in an industry with a higher degree of local concentration will tend to have a stronger correlation in fundamentals; therefore, their stock return comovement will be stronger. While this line of theoretical reasoning is very intuitive, surprisingly there has been little supportive empirical evidence in the finance and urban economics literature.
We aim to answer two main questions: Is there a significant correlation between the stock returns of firms headquartered in the same city in China? If so, can urban agglomeration economies explain this correlation? We focus on China primarily for three reasons. First, the stock market in China has a short history (about 20 years) and its investors consist of a large proportion of small investors whose investment decisions are less likely to be based on firm fundamentals and this may lead to stronger local bias (Seasholes and Zhu, 2010). From a regulatory perspective, China’s stock market is quite different from the US and other developed markets and this may make the local bias phenomenon different in China. For example, there are more regulations and trading constraints and more government interventions in both the economy and the stock markets in China. Second, due to regulations on labour mobility (such as the hukou system) and urban growth control, many Chinese cities are considered too small for agglomeration economies to be fully developed (Au and Henderson, 2006). Third, China is undergoing rapid urbanisation and the city system has been evolving. Spatial equilibrium that workers receive the same utility and firms receive the same profits across cities may not hold, which tends to bias against finding a positive correlation between agglomeration economies and firm financial performance (Jennen and Verwijmeren, 2010). Overall, compared to a developed country such as the US, China’s unique institutional features provide an environment against finding a significant effect of agglomeration economies on the local comovement of stock returns. Therefore, the results from developed markets may not be applicable to China. To the extent that other emerging markets have gone through similar economic reform processes that China has, our results may have resonance in these other countries.
We find that, after controlling for standard risk factors, a significant local correlation between stock returns exists in the Chinese capital markets. Consistent with the urban agglomeration economies theory, we find that the stock returns of a firm headquartered in a city with stronger localisation economies and urbanisation economies are correlated more highly with the stock returns of other local firms headquartered in the same city. Furthermore, the local correlation of stock returns can be partially explained by the local correlation between earnings. This suggests that correlated local fundamentals are one of the driving forces of local comovement of stock returns. In contrast, we find inconsistent evidence for the information-based local bias explanation.
Our study makes two main contributions to the literature. From the perspective of urban economics, we extend the agglomeration economies literature to capital markets and therefore contribute to the understanding of the impact of firm location choice and industrial agglomeration on capital markets. From the perspective of asset pricing theory, we apply the agglomeration economies theory to explain the local comovement of stock returns, thereby offering an alternative interpretation to the local bias theory. Our findings are informative to investors making portfolio decisions and to firms making location choices. The finding that urban agglomeration economies can explain the local comovement of stock returns most likely holds as well in developed countries, where urban agglomeration economies are well entrenched and shown to enhance firm productivity (Baldwin et al., 2010; Combes et al., 2012; Henderson, 2003).
The next section introduces the datasets and outlines our tests of whether local correlation of stock returns exists in Chinese capital markets. We then review both the information-based local bias theory and agglomeration economies theory and test which theory better explains the local comovement of stock returns. The section after that provides more robustness checks, and is followed by a concluding section.
Local correlation of stock returns in Chinese stock markets
The comovement of stock returns of firms headquartered in the same city
A basic question is whether local correlation of stock returns exists in the Chinese capital markets. Related studies are few (Feng and Seasholes, 2004; Li et al., 2014; Wongchoti and Wu, 2008). We define ‘local’ at the city level in this paper and directly test if the stock returns of firms headquartered in the same city in China move together. 6 Using the location of headquarters as the location of a firm is standard in the related literature (Coval and Moskowitz, 1999, 2001; Hong et al., 2004, 2005) and we follow suit to be consistent. Moreover, the headquarters of a multi-unit firm is the centre for information collection and processing, communication with consumers and investors and decision making, and the analysis of agglomeration economies applies to headquarters as well as to establishments (Davis and Henderson, 2008; Strauss-Kahn and Vives, 2009).
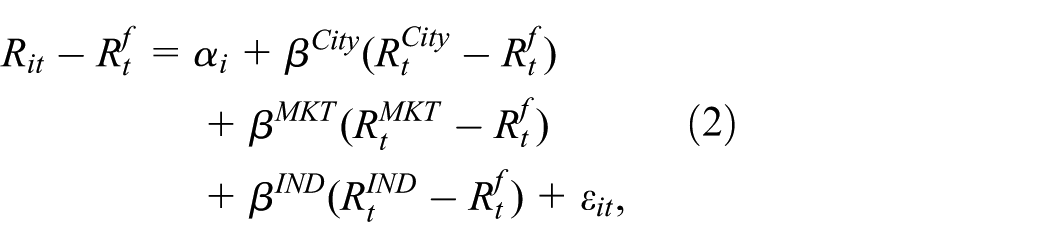
We first test whether there is comovement of stock returns of firms headquartered in the same city. The classic asset pricing theory states that only market risk matters to stock returns. Therefore, we use the capital asset pricing model (CAPM) as the baseline model and test whether a stock’s returns are correlated with the returns of other stocks headquartered in the same city, conditioning on market risk factors. Following the standard methodology in finance (Anderson and Beracha, 2008; Pirinsky and Wang, 2006), our model testing the local correlation of stock returns is specified as follows:

where Rit is the monthly return of stock i. Rtf is the risk-free interest rate. RtCity is the equally-weighted average monthly returns of all stocks of firms headquartered in the same city, excluding the stock in question, to avoid spurious correlations. RtMKT is the monthly market return, calculated as the equally-weighted average monthly return on all the A-share stocks. The coefficient of interest is
Empirical results suggest that the single-factor CAPM does not perform well in asset pricing tests (Carhart, 1997; Fama and French, 1993). Industry specific factors are likely to be very important in explaining stock returns as firms in different industries may perform differently with regard to locational fundamentals. For example, firms producing products for a nation-wide market may be less affected by local factors, while firms selling locally may be more affected by local factors. Therefore, we also estimate an extended CAPM by including industry average returns:
where RtIND is the equally-weighted average monthly returns of the industry to which the firm in question belongs, excluding the stock returns of the firm in question.
It is well established in the finance literature that the market risk premium (RMKT-Rf), the value factor (HML), size factor (SMB) and momentum factor (MOM) should capture all the risk associated with stock returns. Accordingly, as an additional robustness check, we specify our third model as:

where HML, SMB and MOM are constructed following the same methodology specified in Fama and French (1993) and Carhart (1997). Specifically, HML is the value factor, defined as the difference between the returns on a portfolio of high book-to-market ratio firms and the returns on a portfolio of low book-to-market ratio firms; SMB is the size factor, calculated as the difference between the returns on a small-stock portfolio and the returns on a big-stock portfolio; and MOM is the momentum factor, defined as the difference between the returns on a portfolio of stocks whose prices have increased recently and the returns on a portfolio of stocks whose prices have decreased recently.
Stock returns, financial variables and other firm attributes information are extracted from the China Stock Market & Accounting Research (CSMAR) database. We restrict the sample period to be between 1997 and 2007 and the city attributes data are drawn from the China Urban Statistic Yearbooks from 1998 to 2008, published by the China Statistics Press. 7 The industry classifications follow the China Securities Regulatory Commission’s (CSRC) standards. We use a firm’s registration location to locate the city of its headquarters. Following Pirinsky and Wang (2006), we select a city only if it hosts at least five listed firms’ headquarters. To estimate time series models, we require that each stock has at least 24 monthly returns during the sample period. Applying these selection criteria leads to a sample of 1047 stocks.
For each model, we run time-series regressions and obtain estimated coefficients for each stock. We average the coefficients and compute the t statistics by dividing the mean of the coefficients by the standard error of the coefficients. This procedure is similar to the two-step regression in Fama and MacBeth (1973) and is commonly used in the studies testing for local comovement of stock returns.
Panel 1 of Table 1 reports the results of testing the local correlation of stock returns for the whole sample period. The coefficient of the average stock returns of all other firms headquartered in a city, βCity, is significantly positive in all models, showing that, after controlling for risk factors, stock returns of a firm are positively correlated with the average stock returns of other firms headquartered in the same city. The diminishing pattern of the βCity coefficients (from column 1 to column 3) suggests that it is important to control for industry-specific and other risk factors in estimating a capital asset pricing model.
Testing local correlation of stock returns.

Notes: Following Pirinsky and Wang (2006), for each model we run a time-series regression to obtain estimated coefficients for each stock. Then, the coefficients are averaged and the t statistics are calculated by dividing the mean of the coefficients by the standard error of the coefficients. Superscripts ***, ** and * indicate significance at the 1%, 5% and 10% levels, respectively.
We also estimate models (1) to (3) for two sub-periods: 1997–2002 and 2003–2007. 8 The results are presented in panels 2 and 3 of Table 1 and the patterns are consistent with those in panel 1. 9 To further address the industrial heterogeneity of local correlation of stock returns, we replicate Table 1 using a one-digit industry classification. The results are shown in panel 4. The mean of βCity is not statistically significant for the mining industry and becomes negative for the finance and insurance industry, possibly due to the small number of firms in these industries. For all other industries, most of the means of estimated βCity are positive and statistically significant although the magnitudes vary substantially across industries. This further demonstrates that industrial heterogeneity does not erode the headquarters-city effect on stock returns.
How ‘local’ is the local correlation of stock returns?
The previous results show that the stock returns of a firm are correlated with the returns of other local firms, as well as with the market return. A natural question arises: Are the stock returns of a firm also correlated with firms located in other cities nearby? Or is the local comovement really ‘local’? We address this question by examining the relationship between local correlation and geographic distance, following the ideas of Grinblatt and Keloharju (2001) and Barker and Loughran (2009). Because longitude and latitude data for each firm’s street address are not available in China, we employ the methodology used in Fu (2007) and Anderson and Beracha (2008). We locate the longitude and latitude of the centroid of each city and compute the circular distance between any two centroids as the distance between the two cities, using the following formula:
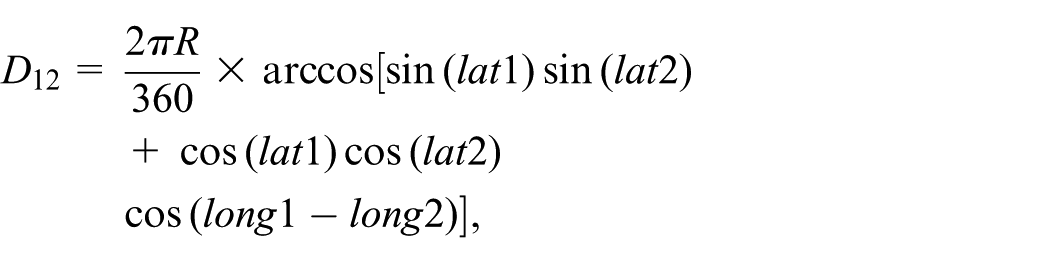
where R = 6378 kilometres (km) and lat and long refer to latitudes and longitudes of two points on the earth. If long1 = long 2, then, the distance is
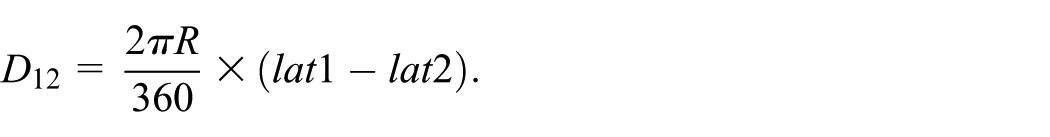
We assume that all firms are located in the centroid of each city and draw buffers (rings) of different radii around each city centroid: (0–500), (500–1000), (1000–1500) and over 1500 km. We treat the city where a firm is located as the first ring, cities within a radius of 500 km (excluding the city in question) as the second ring and cities within a radius of between 500 and 1000 km as the third ring, and so forth. We use
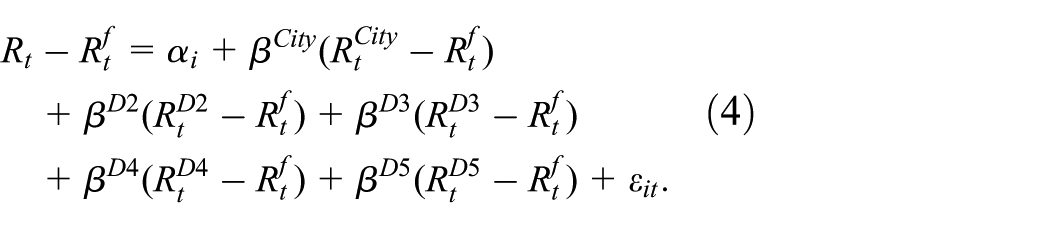
If the local correlation of stock returns is indeed local, the coefficients
The spatial decay of local correlation of stock returns.
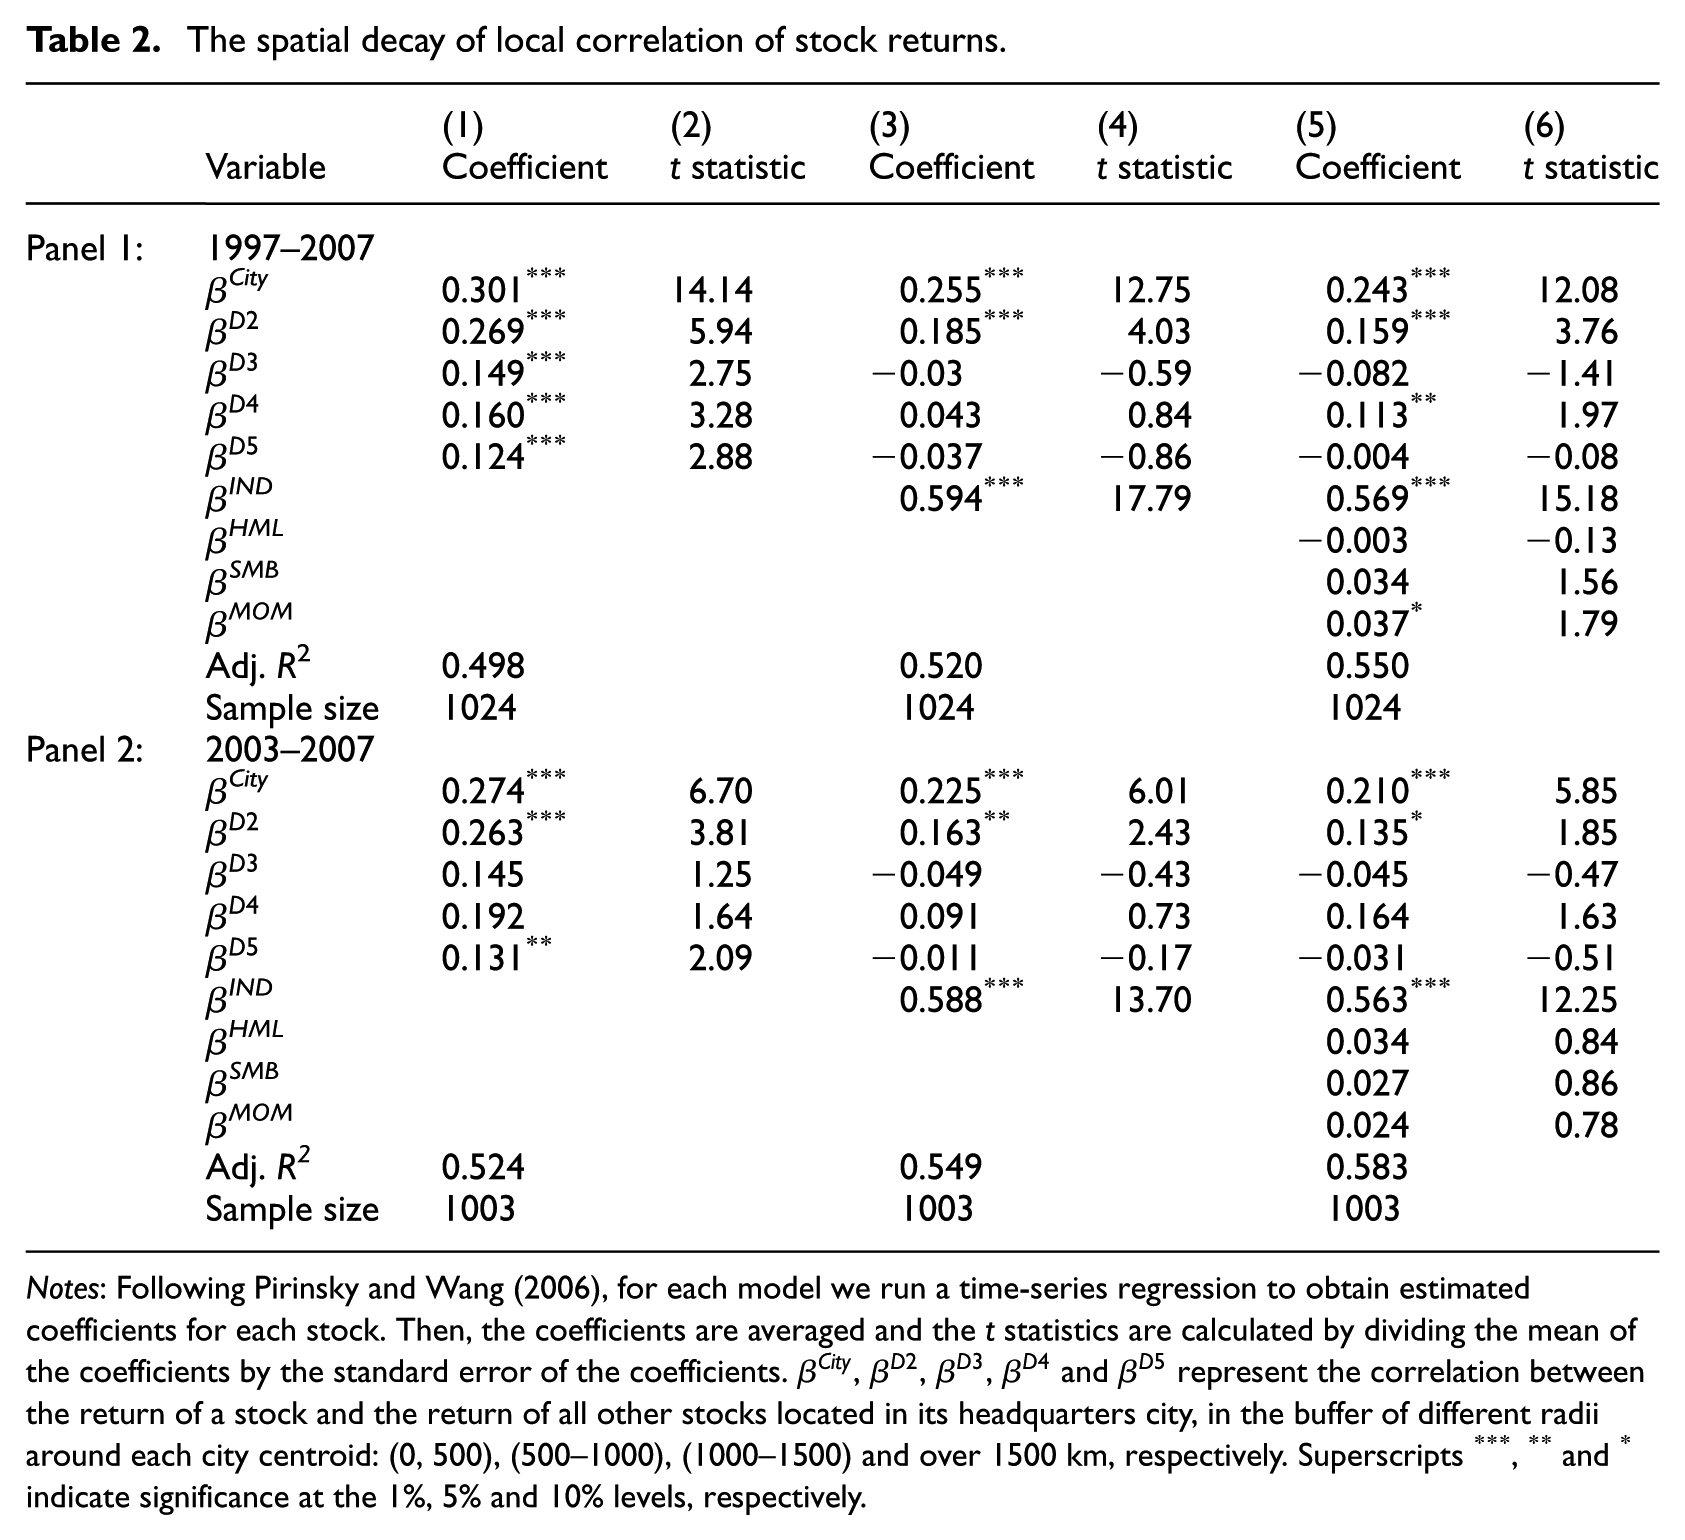
Notes: Following Pirinsky and Wang (2006), for each model we run a time-series regression to obtain estimated coefficients for each stock. Then, the coefficients are averaged and the t statistics are calculated by dividing the mean of the coefficients by the standard error of the coefficients.
The same pattern of attenuation holds for the two sub-periods and, to save space, only the results for the sub-period 2003–2007 are presented in panel 2. Since there is no a priori theory on how many rings we should draw, we carry out a series of experiments. For example, we draw two buffers by assigning all firms either in a city or outside a city; three buffers by assigning all firms in a city, outside a city but within a province, outside a province. All the results are similar (results are available upon request). Taking all evidence together, we conclude that there exists local correlation of stock returns at the city level in Chinese stock markets.
What causes the local comovement of stock returns?
In this section we test whether local bias or agglomeration economies can explain the local correlation of stock returns. As discussed in the introduction, local bias can result from information asymmetry or investor behaviour. Testing the investor behaviour explanation requires micro-data at the small geographic level (such as census block) or household level (Hong et al., 2004, 2005). Currently, such data are not available in China. Therefore, we do not test directly the investor behaviour explanation.
Local bias and the local correlation of stock returns
Since the headquarters of a multi-unit firm is its information and communication centre, proximity to a headquarters gives local investors an information advantage. The more asymmetric the information, the more information advantage local investors will gain. In general, local firms with smaller sizes, poorer performance and higher leverages tend to have more severe information asymmetry problems because such firms are usually not well known and have higher uncertainty (Coval and Moskowitz, 1999, 2001). These firms are generally neglected by investors and analysts and, as a result, it is more difficult for distant investors to obtain information about such firms. Therefore, local investors can have greater information advantages with regard to these local firms. Pirinsky and Wang (2006) provide supportive evidence that the local comovement of stock returns is associated with the above firm characteristics.
To test whether the local bias theory applies to Chinese capital markets we examine whether the local correlation of stock returns is stronger for firms with smaller sizes, worse performance, higher leverages and higher growth. We construct a set of firm characteristics variables as follows:
Log(MV) is the logarithm of the market value of a listed firm at the end of December of each year to control for firm size. ROA is return on assets to control for financial performance. Leverage is the ratio of debt to total assets. Firms with a higher leverage have more uncertainty in future performance and local investors generally have a greater information advantage on local firms (Coval and Moskowitz, 1999). Log(M/B) is logarithm of the ratio of market value of equity to book value of equity, measuring the growth potential of a firm. To remove the influence of outliers, Log(MV), ROA, Leverage and Log (M/B) are all winsorised at the 1% and 99% levels.
Localisation economies and the local correlation of stock returns
The concentration of firms in the same industry within a city can generate scale economies that are external to a firm but internal to the industry. Such external economies are called localisation economies, or Marshallian externalities, in the dynamic context (Henderson, 2003). The clustering of same-industry firms not only generates cost savings, through shared inputs and labour markets, but also facilitates knowledge spillovers and information flows among firms. Therefore, the fundamentals of firms in the same industry clustering in a city tend to move together, holding all else constant.
The spatial concentration of firms in one particular industry can also affect firms in other related industries in the same location, through backward and forward linkages. For instance, if information technology (IT) firms concentrate highly in a city, then industries closely related to IT, such as computer training and education, sales, maintenance, as well as industries loosely related to IT, such as service industries for IT employees, will also tend to concentrate in the city. Therefore, when an external random shock occurs, all other industries in the same city, as well as the IT industry, will be affected through the ripple effect. Translating this to capital market effects, stock returns of firms in the same city will fluctuate together.
In summary, the concentration of same-industry firms in a city can generate correlation of fundamentals among firms in the same city. A random shock common to all the firms in that particular industry will also affect the rest of the firms in the same city. When the shock transmits to the capital markets, the stock returns of all firms in the same city will be correlated, and the correlation will be higher if the degree of spatial concentration of that particular industry is higher.
To test whether the local correlation of stock returns is stronger for firms in a city with stronger localisation economies, we construct a location quotient index in terms of employment to measure industrial concentration (or specialisation) using data from the China Urban Statistics Yearbooks:

where
Urbanisation economies and the local correlation of stock returns
The concentration of firms in different industries within a city, as well as city size, can generate scale economies external to firms and industries but internal within a city. Such external economies are called urbanisation economies, or Jacobs externalities, in a dynamic context (Glaeser et al., 1992). Extensive empirical studies in urban economics have confirmed that urbanisation economies enhance firm productivity (Fu and Hong, 2011). Holding all else constant, firm fundamentals are also affected by urbanisation economies, and the financial performance of firms in the same city will change in the same direction. Consequently, stock returns of firms in the same city will move together.
City size and urban diversity may also affect information spillovers across firms of different industries and promote cross-industry innovation. In general, a larger, denser city implies more frequent unexpected social interactions. A higher degree of urban diversity may result in more connections between firms of different industries; therefore, a random shock common to a city will generate correlated information change and correlated fluctuation in stock returns.
To test whether the local correlation of stock returns is stronger for firms located in a city with a higher degree of urbanisation economies, we construct an urban industrial diversity index measured by one minus the Herfindal index, in terms of industry employment:

where
The advantage of using this diversity index is that its value lies between 0 and 1. If a city hosts many different industries, and each industry’s employment share is very small, then the diversity index will be close to 1. This index also takes into account both the distribution of employment across industries and the number of industries in a city. The computation of industrial concentration and industrial diversity uses one-digit industry classification from the China Urban Statistics Yearbooks. There are 15 industries from 1997 to 2002 and 19 industries since 2003. 11
In addition, local business cycles affect stock returns (Korniotis and Kumar, 2013). To test the effect of agglomeration economies on the local correlation of stock returns, it is necessary to control for important local macroeconomic variables. We therefore add the logarithm of city population size to control the city scale effect and gross domestic product (GDP) per capita to control for the effect of urban income on investment. GDP per capita may also capture the effect of local business cycles on capital markets. To control for heterogeneity in investment and in the legal environment of different cities, we also add city fixed effects (in this case we have to drop all the city level variables, such as industrial diversity, GDP per capita and city size, but still keep the industrial concentration index).
Results
Following the standard approach in the literature such as Pirinsky and Wang (2006), we regress βCity of each firm on the agglomeration economies variables and firm attributes for the whole sample period and also for the two sub-periods. Agglomeration economies variables and firm attributes are the average of the whole period or the average of each sub-period (1997–2002 and 2003–2007). Note that βCity measures the degree of local comovement of returns of a stock with the average stock returns of the headquarters city over a long period; this interpretation holds regardless of whether the stock returns data used are monthly, quarterly or of another frequency. The results are presented in Table 3, where
Agglomeration economies, firm attributes and local correlation of stock returns.
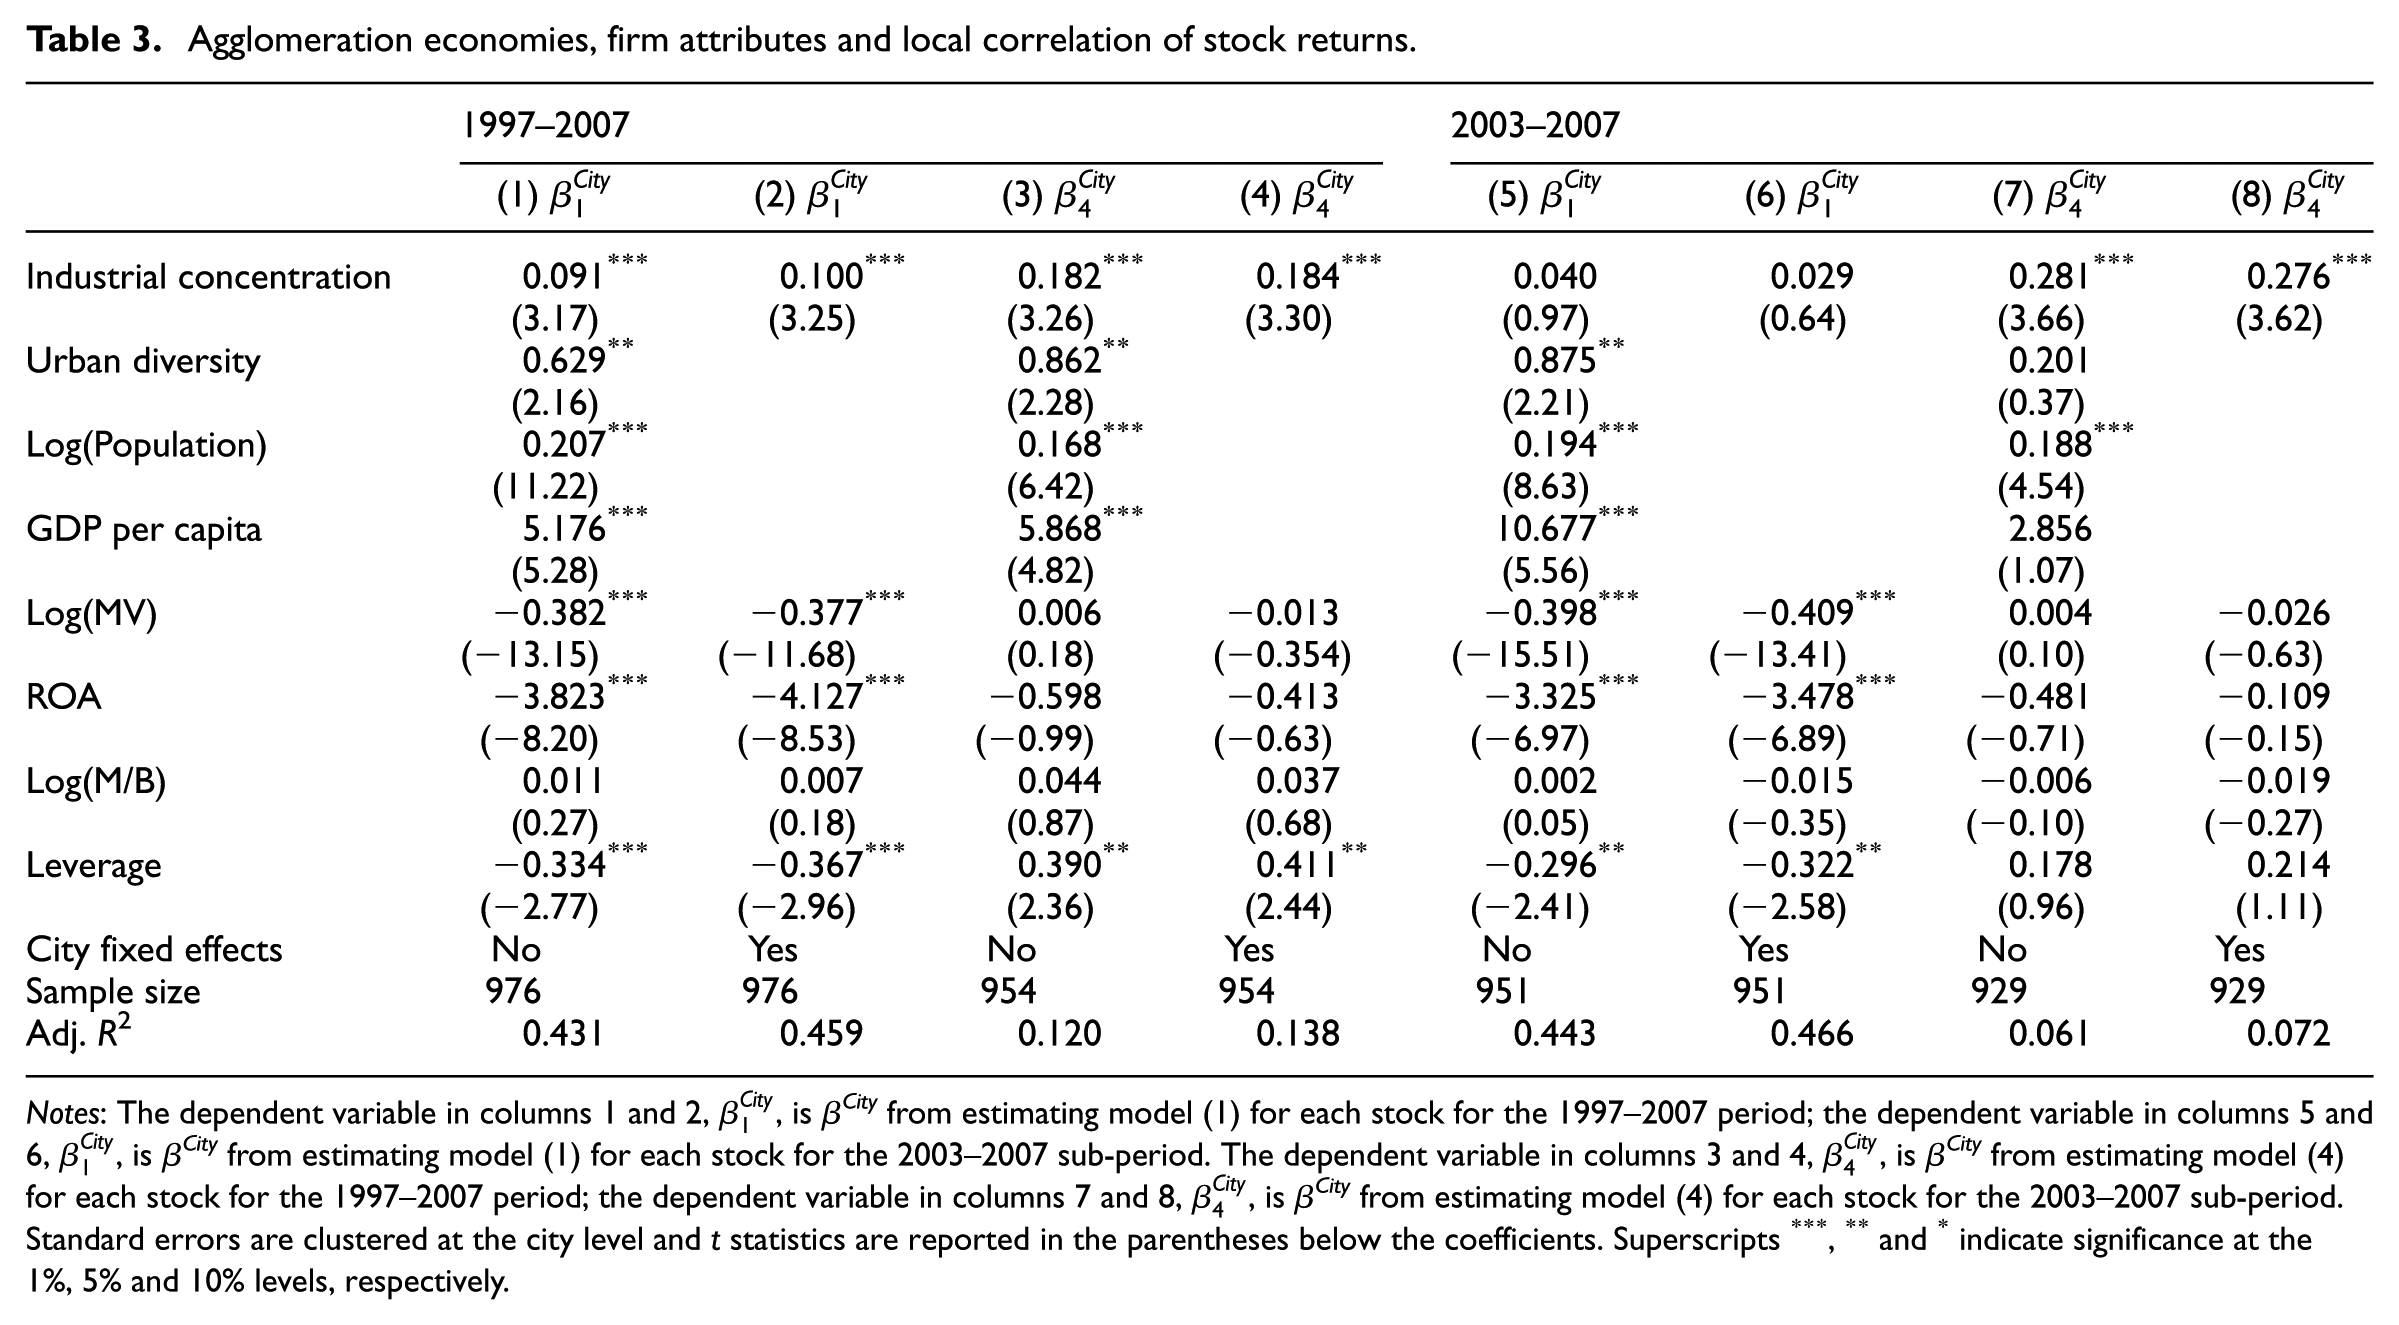
Notes: The dependent variable in columns 1 and 2,
Columns 1–4 of Table 3 indicate that the coefficients on industrial concentration are significantly positive in all model specifications, suggesting that the correlation with local stock returns is stronger for firms in a city with stronger localisation economies. The coefficients on industrial diversity and city size are also positive and significant, providing evidence that the local correlation of stock returns is stronger in cities with stronger urbanisation economies. Our findings are in contrast to Pirinsky and Wang (2006) where they find that local fundamentals cannot explain the local comovement of stock returns in the US.
Columns 1 and 2 of Table 3 show that the coefficients on market value of equity (Log(MV)) and return on assets (ROA) are negative and significant, consistent with the information-based local bias explanation that the shares of firms of small size or with bad performance tend to be held by local investors. However, these coefficients are insignificant in columns 3 and 4 suggesting little robustness. Furthermore, the coefficient on growth potential (Log(M/B)) is not significant in all columns. The coefficient on Leverage is significantly negative in columns 1 and 2, contrary to the local bias explanation, possibly because China has a much larger number of small investors than in the US. Seasholes and Zhu (2010) finds that unlike institutional investors, small investors’ local bias is based not on advantageous information but on non-fundamental familiarity with local firms, such as familiarity caused by advertising. The coefficients on Leverage in columns 3–4 reverse sign, again implying little robustness. Overall, the results in columns 1–4 of Table 3 show that there is little evidence supporting the information-based local bias theory.
The coefficients on GDP per capita in columns 1 and 3 are significantly positive, possibly because small investors in high-income cities have more funds to invest in stocks, creating stronger local bias. The positive, significant coefficients on city size (Log(Population)) in columns 1 and 3 can be interpreted in two ways: most likely, scale economies derived from city size result in a correlation of fundamentals among firms in the same city, but we cannot exclude the possibility that larger cities have more small investors thus creating stronger local bias.
Columns 5–8 present the results of estimating the same models for the 2003–2007 sub-period and they exhibit qualitatively similar patterns as the full period results, although in some models the coefficients on the agglomeration variables lose some significance.
In summary, Table 3 shows little evidence for the information-based local bias theory. However, Table 3 is consistent with the agglomeration economies theory: that is, for a firm located in a city with stronger localisation economies or stronger urbanisation economies, its stock returns are correlated more highly with the average stock returns of other local firms. Qualitatively similar results are obtained when βCity is estimated from models (2) and (3).
Robustness checks
Local correlation of earnings
Our previous analysis indicates that there exists local correlation of stock returns in Chinese capital markets and such local correlation can be partially explained by local agglomeration economies. If capital markets are relatively efficient, then, stock returns should capture firm fundamentals, implying that earnings of firms headquartered in the same city would be highly correlated too. It should be noted that in a spatial equilibrium, firms should earn the same profits regardless of locations; however, in real life business owners may sacrifice profitability for quality of life and profitability may not show a positive, local correlation with agglomeration economies (Jennen and Verwijmeren, 2010). Therefore, we follow Pirinsky and Wang (2006) and specify the following models to test whether earnings of local firms are correlated:

where dE is the earnings of a firm in quarter t minus earnings in the same quarter of the previous year (quarter t–4). This approach removes seasonal fluctuations. BEt is the book value of equity in quarter t. For each firm, we calculate the equally-weighted average of the earnings growth rates of all firms in a city,
Quarterly earnings data are available only since 2003; therefore, we estimate model (7) for only the 2003–2007 period. Similar to Table 1, for each stock we run a time series regression of model (7), and then compute the mean and standard error of the coefficients and the t statistics accordingly. Columns 1–4 of Table 4 present the results and show that a firm’s earnings growth is significantly and positively correlated with the earnings growth of local firms headquartered in the same city.
Local correlation of earnings.
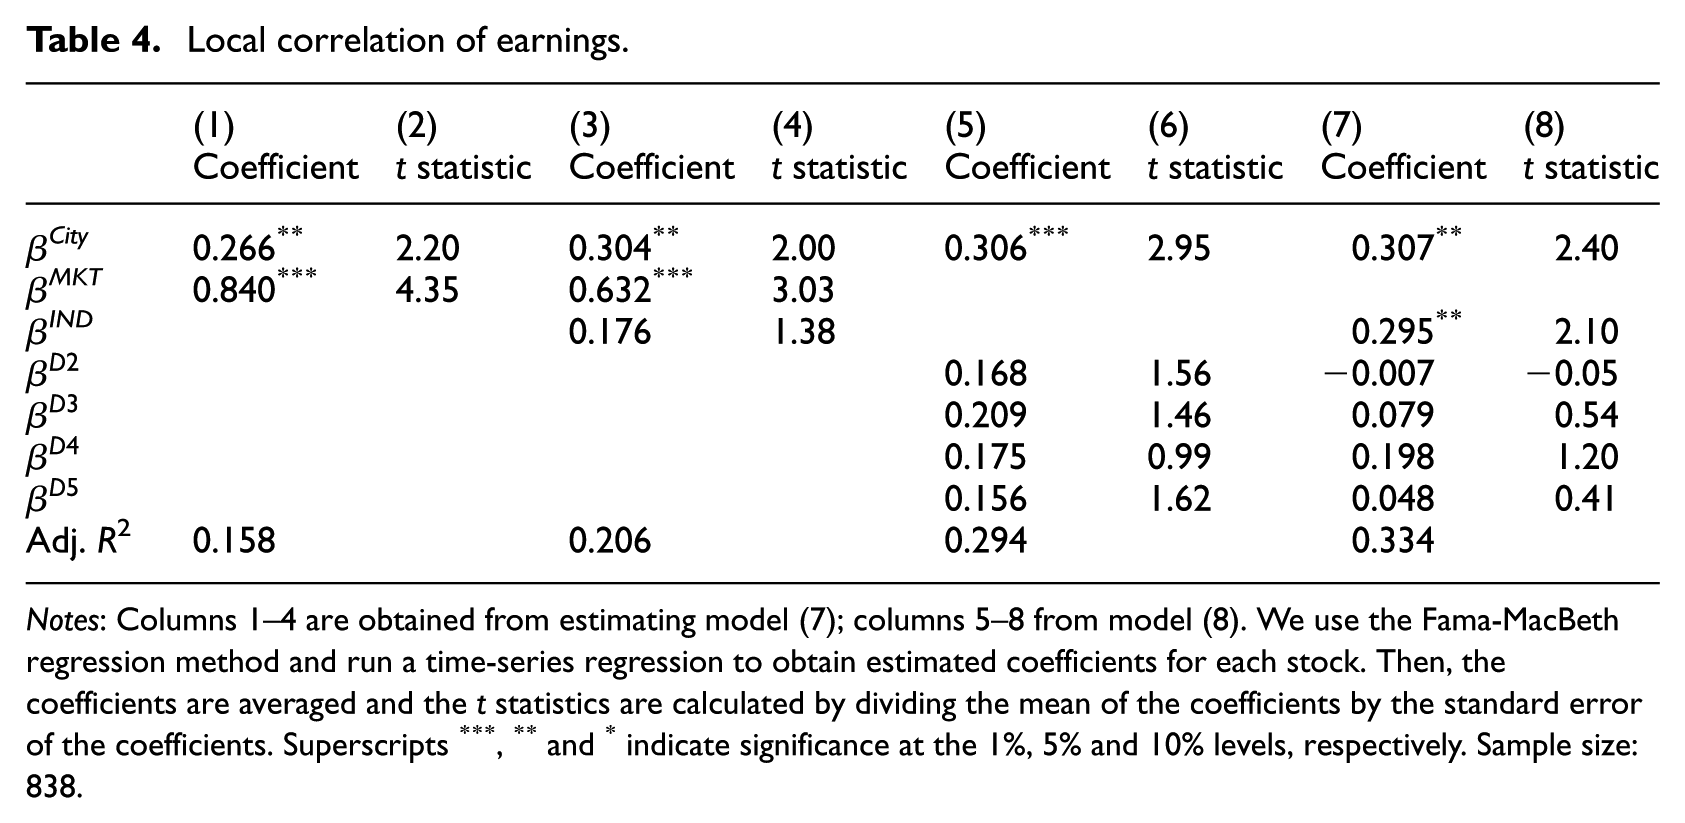
Notes: Columns 1–4 are obtained from estimating model (7); columns 5–8 from model (8). We use the Fama-MacBeth regression method and run a time-series regression to obtain estimated coefficients for each stock. Then, the coefficients are averaged and the t statistics are calculated by dividing the mean of the coefficients by the standard error of the coefficients. Superscripts ***, ** and * indicate significance at the 1%, 5% and 10% levels, respectively. Sample size: 838.
To further check whether the local correlation of earnings is indeed local, following the model (4) specification, we add to model (7) the equally-weighted average of the earnings growth rate in each ring:

where
Correlation between
city–return and
city–earnings
Thus far we have found local correlation of stock returns and local correlation of earnings. If the local correlation of stock returns is driven by correlated fundamentals, then we expect the local correlation of stock returns to capture the local correlation of earnings. We therefore regress the return
Correlation between local correlation of returns and local correlation of earnings.
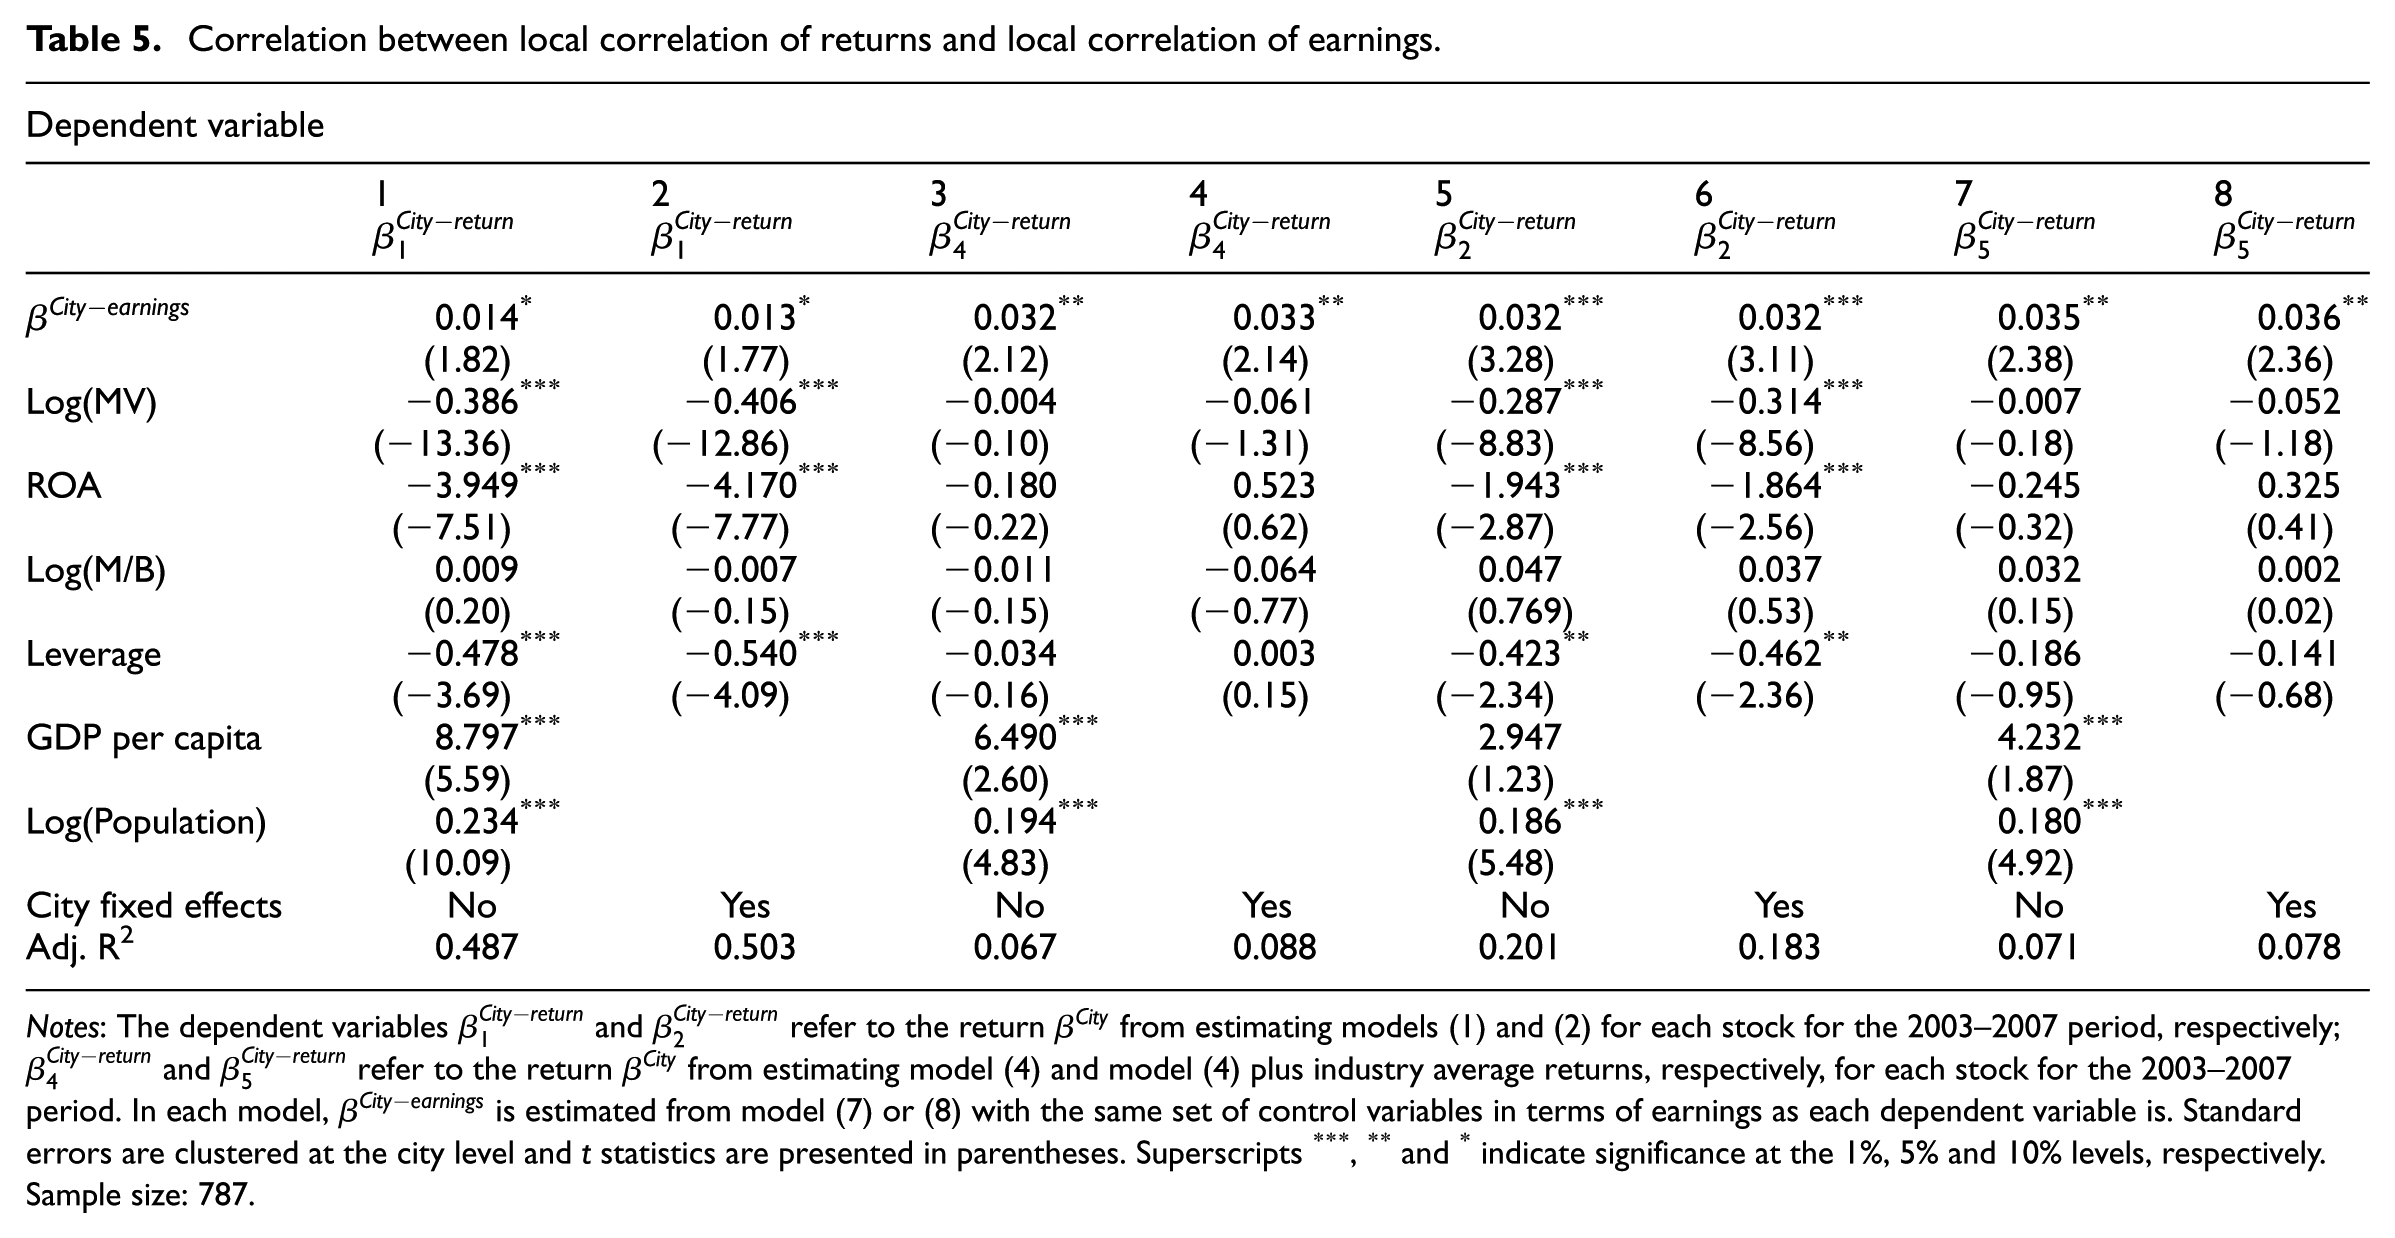
Notes: The dependent variables
Single- versus multiple-location firms
If a firm has only one operating location, then there is little discrepancy in using headquarters city as a measure of firm location; but discrepancy does arise for firms with multiple units spreading across different cities. As an additional robustness check, we distinguish single-location firms from multiple-location firms. Annual reports of listed firms in China usually do not specifically state how many operating locations a firm has; therefore, we infer whether a firm has operating units located in different cities based on textual clues in the annual reports, such as sales breakdown and description of business activities. During the 1997–2007 period, 15% of firms (145) are located in one city; 54% of firms (525) are located in multiple cities; and 31% of firms (306) have changed locations.
We create a Single dummy set to 1 if a firm is located in only one city during the sample period and a Change dummy set to 1 if a firm has changed its location status from a single city to multiple cities or vice versa. When adding these two dummies to all the models in Tables 3 and 5, we find that our previous results still hold and the coefficients of these two dummies are not significant in most cases (the results are available upon request). We conclude that although using headquarters city as firm location may generate measurement errors and estimation bias, the issue is not serious.
Conclusion
Both local bias theory based on information advantage and urban agglomeration economies theory predict that the stock returns of firms headquartered in the same location will be correlated. Although many empirical studies have tested the information-based local bias theory, few studies link urban agglomeration economies with the local correlation of stock returns. This paper tests how urban agglomeration economies and firm attributes affect the comovement of A-share stock returns in China’s capital markets. We find that after controlling for standard risk factors, the stock returns of firms headquartered in the same city are significantly correlated. In contrast to US research (Pirinsky and Wang, 2006), we find inconsistent evidence for the information-based local bias theory, possibly because there are more small and relatively uninformed investors in China. However, consistent with urban agglomeration economies theory, we find that the stock returns of firms headquartered in a city with stronger localisation economies or urbanisation economies are also correlated more highly with other local firms headquartered in the same city. We also find that the earnings of local firms are correlated; furthermore, the local correlation of stock returns are also correlated with the local correlation of earnings, suggesting that complementary to the local bias theory, localised agglomeration economies translate to capital market prices and provide another interpretation of the local comovement of stock returns.
Our study is the one of the few to explore the relation between urban agglomeration economies and capital markets through the premise that agglomeration economies affect firm fundamentals. Our findings contribute to the understanding of the spatial factors that affect asset pricing in the Chinese capital markets. Our findings can also be useful for investors in making portfolio choices and firms in making location choice decisions. For example, investors may need to consider the local industrial environment in order to make informed portfolio choices.
Footnotes
Acknowledgements
The authors thank the editor, Andrejs Skaburskis, and four anonymous reviewers for helpful and constructive comments on earlier versions of the paper. The authors have benefited from comments by Richard Arnott, Jim Davis, Yuming Fu, Li Gan, Shan He, William Kerr, Canlin Li, Debarshi Nandy, Judy Pereira, Stephen L. Ross, V. Brian Viard, Zhigang Zheng, Haomiao Zuo, and seminar participants at Southwestern University of Finance and Economics, Renmin University of China, Cheung Kong Graduate School of Business, Zhejiang University, and the China Economist Society 2010 Annual Conference.
Funding
Michael Firth acknowledges financial support from the Government of the HKSAR (GRF340412). Liwei Shan acknowledges financial support from Ministry of Education of the People’s Republic of China (14XJC790007) and from the Fundamental Research Funds for the Central Universities supported by the Southwestern University of Finance and Economics (JBK141107).