
Abstract
This paper demonstrates the contribution that historical property records can make to our understanding of long run urban change. We use a case study of two streets from the suburb of Carlton in Melbourne, Australia between 1870 and 1970. The property records form a panel database that can be interrogated using standard modelling techniques. These data are used to analyse change in the built environment over time, and identify the factors that may be influencing such change. With the assembled data we track built form, land value, ownership and land use over 100 years. We find that stability characterises the built environment over lengthy periods, but when change occurs it does so in bursts, rather than incrementally. Furthermore, these bursts of change are unevenly spread across our two case study streets, despite their proximity. The streetscape’s primary built material is the key factor shaping geographical patterns of land use change in the case study area.
Introduction
This paper examines land use change at the property level in Melbourne from 1870 to 1970. The paper’s main aim is to illustrate how we can use historical property records to better understand the drivers of long run urban change. We develop hypotheses about the nature and determinants of change in the built environment then test them using a panel database that is interrogated using standard modelling techniques.
Urban research has an enduring tradition of asking how and why cities change. Examples of research analysing long run urban change include Meen and Nygaard’s (2011) examination of planning restrictions in London from the 19th century. Also in London, Clark (2002) undertakes a long run (1700–1911) examination of average rents, while Meen (2009) measures rental affordability between the 19th and early 20th centuries. Urban researchers have also focused on whether urban poverty and wealth are spatially persistent over time. Much of this research finds that the geography of affluent and poor neighbourhoods endures over many decades, reflecting the role of path dependence in urban development. Path dependence occurs when households and firms become locked-in to a particular spatial structure (Nygaard and Meen, 2013). As a consequence the physical structure of cities may change only modestly for decades if not centuries, and impose constraints on the current decisions of households, firms and governments. Such path dependence is evident in European (Nygaard and Meen, 2013) and to lesser extent North American cities (Delmelle, 2015). In a study of four US cities, Delmelle (2015) finds significant continuity over five decades to 2010, particularly in disadvantaged areas; but also cases of significant gentrification, especially in the faster growing cites. Easterly et al.’s (2015) multi-century analysis of a single block in New York reveals at this very local scale a history of volatility punctuated by surprising changes in local urban characteristics. In Australian cities, where gentrification in inner city areas is prevalent, spatial persistence of poverty and wealth is less evident (Badcock, 2001; Forster, 2006). This body of research prompts us to ask what precipitates change when it does occur, and whether change is evenly spread across a city’s urban footprint.
Because many countries’ taxation systems were originally based on the taxation of land (Dye and England, 2009), long run property level records are commonly available. For example, Scotland’s Register of Sasines documents land transactions from 1617 onwards (Williams and Twine, 1991). Such records offer a rich resource for urban research. There are several studies that use contemporary property level data as the basis for longitudinal urban analysis. Delmelle et al. (2014), for example, analyse change in Charlotte, North Carolina from 1945 to 2008 using current observations on built form characteristics and knowledge of year of construction to make inferences about the changing nature of urban development (also see Cuthbert and Anderson, 2002).
By establishing a detailed long run property level account of change in the built environment, we can gain new insights into the drivers of built environment dynamics. These drivers include patterns of land ownership and use, urban infrastructure, planning policy, technological innovation and economic cycles. Further, analysing how cities have changed in the past can improve our understanding of how planning interventions and infrastructure investment can address contemporary urban challenges.
Our research is based on a property level case study of two streets from the suburb of Carlton in Melbourne (Australia), which are tracked every ten years from 1870 to 1970. With the assembled data we profile a variety of urban characteristics over time, including built form, land value, ownership and land use. We hypothesise that changes in land use are spread irregularly across the urban landscape because of differences in ownership patterns and built form. The research uses descriptive analysis of change and continuity over the 100 year period, as well as a logistic regression over three selected subperiods to explore the drivers of change. The paper’s main contribution advances methods for identifying the causes of land use change.
Conceptual framework and hypothesis
The key idea motivating our research is the observation that over the long run urban land uses change slowly and unevenly. This is due to path dependence that reflects inertia, land ownership patterns and built forms that are costly to retrofit or demolish and clear. When change does occur it is triggered by institutional interventions (such as infrastructure investment) or exogenous shocks (such as natural disasters or new technologies), and erupts in bursts that are unequally spread across the metropolitan area (Meen et al., 2007). There are three features of urban buildings that could account for uneven land use dynamics.
First, we hypothesise that fragmented ownership patterns increase the transaction costs of land assembly because the contiguity and size of land lots is an important feature of land markets. To construct a factory a firm must assemble a large site, but this can require the purchase of a number of smaller contiguous sites. Developers are then vulnerable to ‘hold up’, a situation that arises when all but (say) one land lot has been acquired, but the landowner stalls while hoping for a substantial price premium over the market price (Evans, 2004). Hold up risk is higher if ownership of the land targeted for development is subdivided into small separately owned lots. The intuition is that a small land owner believes their price premium will have negligible effect on the average price paid by developers, and hence on the chances of deals going through (Eckart, 1985). Sites with concentrated ownership can therefore be acquired more cheaply. Disjointed land ownership results in small scale developments that tend to persist in the long run. Unified land ownership favours development and is more likely to result in large scale built forms.
Our second hypothesis is that concentrations of home owners resist land use changes that threaten the values of their homes, and the character of their communities (the ‘not in my backyard hypothesis’). This resistance can shape planning regulations so that owner occupied residential areas change more slowly. This proposition is an important insight from the endogenous planning perspective (Fischel, 2004; Taylor, 2013). But a counter hypothesis is that owners’ ‘sweat equity’ adds value to their property which in turn can encourage redevelopment to higher values uses (Caulfield, 1994).
Third, we hypothesise that built materials, which are costly to demolish and clear for redevelopment, tilt the cost benefit calculus in ways that favour inertia. Positive shocks that increase the demand for space will raise the value of land in its most profitable use. Pressure to redevelop will grow if current land use is devoted to alternative less profitable uses, and in already built-up areas the demolition of existing buildings and the erection of new buildings typically precede land use change. The lower the per square metre cost of site clearance, the more worthwhile is redevelopment (Needleman, 1969). Land lots with capital improvements will differ in terms of demolition and clearance costs; those with iron, concrete, brick or stone structures will typically cost more to dismantle than ones built of wood.
When these three conditions – fragmented land ownership, home ownership and less adaptable built materials – are present, we hypothesise that land use inertia will characterise the built environment.
The Melbourne case study
Our research uses two streets in the city of Melbourne, Australia, as a case study over the 100 year period 1870 to 1970. Melbourne has a contemporary urban area spanning 9900 km2 and a population of 4.1 million (ABS, 2011). It had a prominent status in the hierarchy of Victorian-era world cities, with Asa Briggs recording that by 1891 Melbourne had the second highest rateable property value (after London) of any city in the British Empire (1963: 278). Melbourne’s history is well documented from European settlement in the 1830s (Davison, 1978), including detailed property archives held at the Victorian Public Records Office (VPRO).
The case study focuses on Bouverie and Cardigan Streets, in Carlton, a suburb on the northern fringe of Melbourne’s Central Business District (CBD) (see Figure 1). Bouverie St runs from the edge of Melbourne’s CBD to Grattan St, the site of the University of Melbourne. Cardigan St runs parallel to Bouverie St, two blocks to the east. Both street segments are 800 m long, and only 200 m apart. Their accessibility to key urban amenities (e.g. transport terminals) are the same and can therefore be excluded as a factor shaping differential land use.
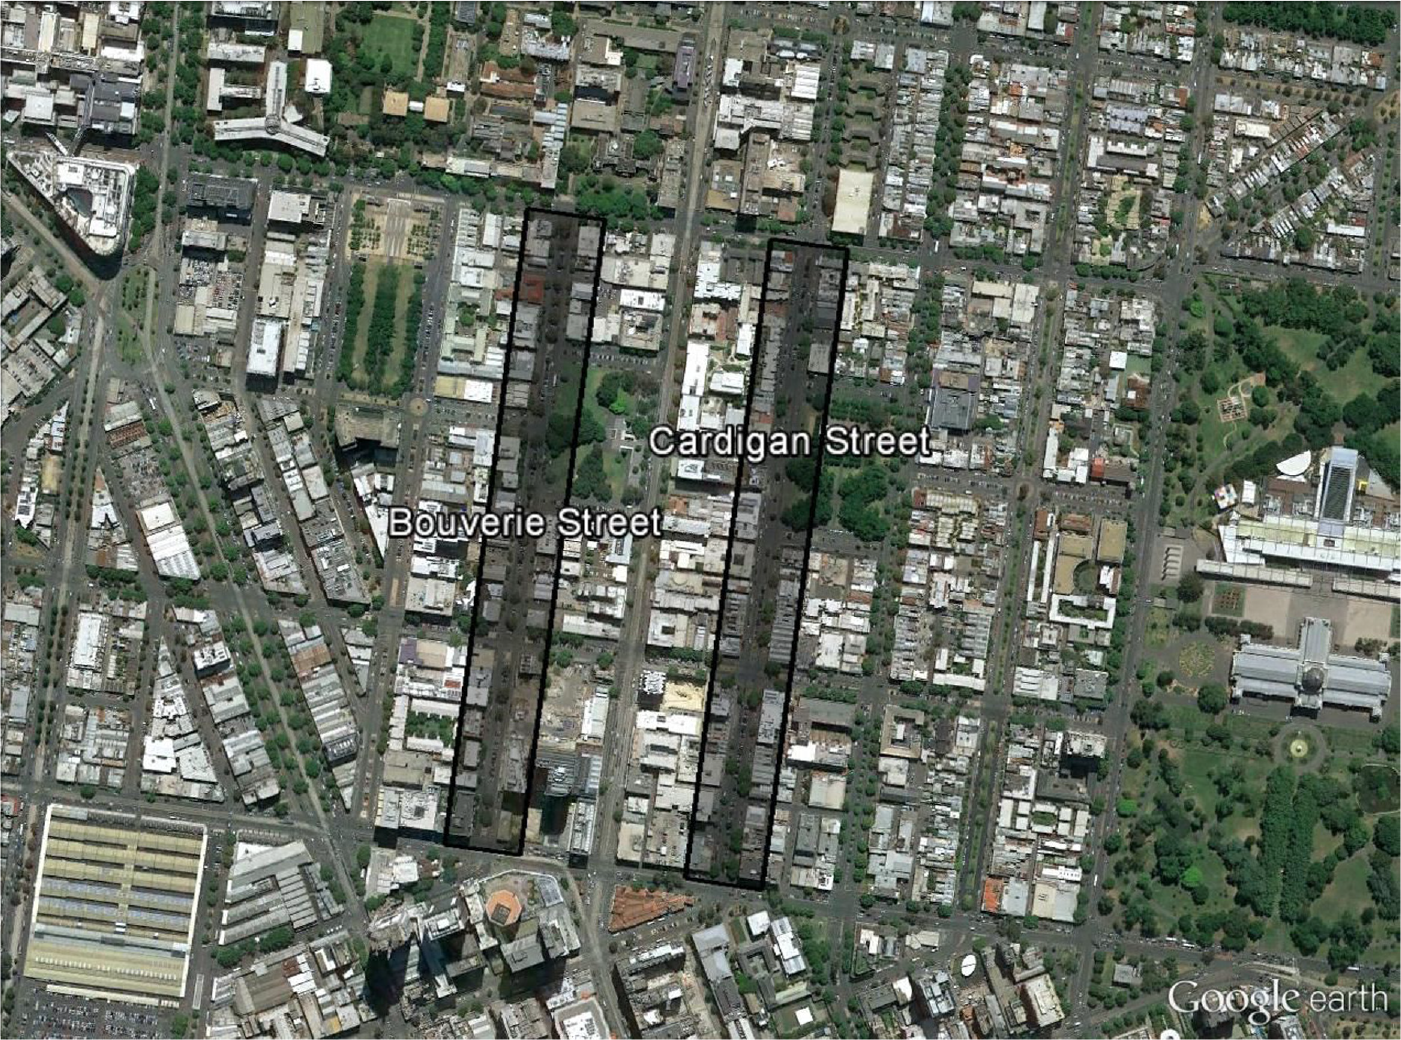
Study area.
The suburb of Carlton was developed in the early decades of settlement. The two street sections feature a mixture of 19th and 20th century built forms. However, they present different current day urban forms, with Cardigan containing significantly more 19th century residential buildings.
In the 100 years from 1870 to 1970, Melbourne’s population increased from 200,000 to 2.5 million (Office of the Government Statistician, 1903–1970). There were three long ‘booms’ in the metropolitan economy over this period, from the 1850s to 1890, the 1900s through to 1930, and the 1950s through to the early 1970s. These were also periods of population growth in Melbourne. The gold rush of 1851 marked the start of a period of sustained population growth, capital inflow and urban development (Davison, 2004: 15). The suburb of Carlton began during this period and between 1852 and the 1880s it was a relatively wealthy area (Chambers and Mayne, 2005). According to Berry (1984), capital has switched into residential investment immediately preceding the end of each boom. Indeed, Davison finds that in 1888 and 1889, the last years of the first boom, 70% of Melbourne’s private capital was directed into real estate construction (Berry, 1984: 14). In a parallel development land prices in the CBD soared, and industrial premises were pushed from the CBD to inner suburbs such as Carlton (Berry, 1984: 14).
The first economic boom ended in 1890, precipitated by a collapse in the international wool price. Melbourne’s population was stable over the following decade, even declining temporarily between 1892 and 1895 (Davison, 2004: 15). By the end of the 19th century the upper-middle classes had left Carlton for the eastern suburbs and working class residents took their place (Anderson et al., 2005). Economic recovery and population growth resumed from 1901, with population increase sustained through the First World War, the subsequent influenza epidemic, and the 1920s. The 1930s global depression slowed Melbourne’s development, as evidenced by a population increase of roughly 4% between 1930 and 1940, a sharp deceleration from the ‘roaring 20s’ that witnessed a 32% population increase.
Melbourne’s pre-1950 economic geography featured a concentration of jobs at the centre, but sharply segmented with white collar jobs in the CBD and blue collar jobs in factories, rail yards and docks in the surrounding inner city. This monocentric pattern of early urban development is often attributed to agglomeration economies (Chinitz, 1961). The working class population resided in the inner suburbs, close to their jobs, with middle class workers commuting from more distant suburbs (O’Connor et al., 2001). Following conclusion of the Second World War, a baby boom and overseas immigration drove population growth through to the 1970s. These population pressures were accompanied by a long term shift in Melbourne’s economic geography. Factories moved from the inner city to larger premises in new outer suburbs, and the working class moved with them to new lower-cost suburban housing (O’Connor et al., 2001).
Melbourne’s first significant built form policy intervention was the 1849 Building Act, requiring all buildings in the central city to have a building permit. This increased costs and precipitated a boom in poorly built dwellings in the unregulated inner suburbs such as Carlton, Fitzroy, Collingwood and Richmond (Lewis, 1999), which subsequently became identified as slum housing areas in the late 19th and early 20th centuries (Howe, 1988). But by the 1880s, similar building regulations extended to the Melbourne suburbs (O’Hanlon, 2002: 14) and the 20th century saw even greater government intervention in housing, most notably legislation enabling Local Government to demolish substandard housing and construct new housing (Workers Dwelling Act (1914); Housing Reclamation Bill (1920)) (Harris, 1988; O’Hanlon, 2002). In the City of Melbourne, roughly 2500 houses were condemned between 1920 and 1923, with most replaced by factories or workshops (Harris, 1988).
The 1954 Melbourne Metropolitan Board of Work’s (MMBW) Metropolitan Planning Scheme (MMBW, 1954) introduced metropolitan wide land use zoning. Inspection of the scheme confirms our study area as primarily industrial in the 1950s, which it zones accordingly. Heritage protection did not feature in planning controls until the 1970s (see Hamnett and Freestone, 2000). Trams have operated on adjacent streets including Swanston, Victoria and Elizabeth Streets from the 1880s (Vines, 2011). Since public transport infrastructure has remained unchanged through much of our study period, we do not expect it to have significant influence on land use change.
Method
The main data source is municipal council rate records held by the VPRO for a number of Victoria’s local government areas, including the City of Melbourne. The rate books offer lot level records of the urban physical structure. However, given data storage methods (microfiche and microfilm) and the level of detail, it is a resource intensive exercise to translate rate records into an analysable digital form.
We digitised 11 individual rate books at ten year intervals between 1870 and 1970. Before 1870, rates records were illegible for the two streets. After 1975, rates records are not publically available. There is nevertheless a healthy sample size with up to 288 individual property records in each year and a total of 2474 over the 100 year study timeframe. It is then large enough to capture long term processes governing change, though the limited spatial scope of the study prevents generalisation of the findings. The data set contains a higher number of rateable properties in the earlier sample years (280 in 1870) with numbers steadily declining from 1900 (262) through to 1970 (145). This is due to consolidation of land titles. For each property in the rate books we recorded land owner; land use (residential, industrial, commercial, vacant land and other) and property type; 1 annual rateable value in pounds; and − where possible − occupier; street number; building material; and number of rooms. Detailed land use maps from the Surveyor General’s Office, the Department of Lands and Survey and the MMBW, along with photographs of Bouverie and Cardigan Streets, enabled rate records to be matched with individual land plots. The digitised rate records provide the opportunity to track a number of urban characteristics over time.
Descriptive results
We organise the descriptive analysis under the themes of land use, ownership, built materials and land value. The descriptives help inform the sample design and specification of the logistic regression modelling reported in section ‘Regression modelling’.
Land use
Figure 2 illustrates the pattern of land use over the study period (1870–1970). Bouverie St ‘begins life’ as a largely residential street with housing accounting for roughly 70% of the built form between 1870 and 1920. However, a marked change in land use occurs from 1920 with the Bouverie streetscape transformed so that industrial land use becomes equally prominent. This occurs in two phases; first between 1920 and 1940; and then, after an interruption during and shortly after the Second World War, from 1950 to 1970. By 1970 residential uses had almost disappeared. In the first burst of change in land use (1920–1940) the shrinking residential presence is due to the rise of industrial buildings; the post-Second World War surge in land change features commercial land use, as well as continued expansion of industrial land use. Cardigan Street experiences less dramatic land use change. It retains a predominantly residential character in all but the final two decades of our timeframe.
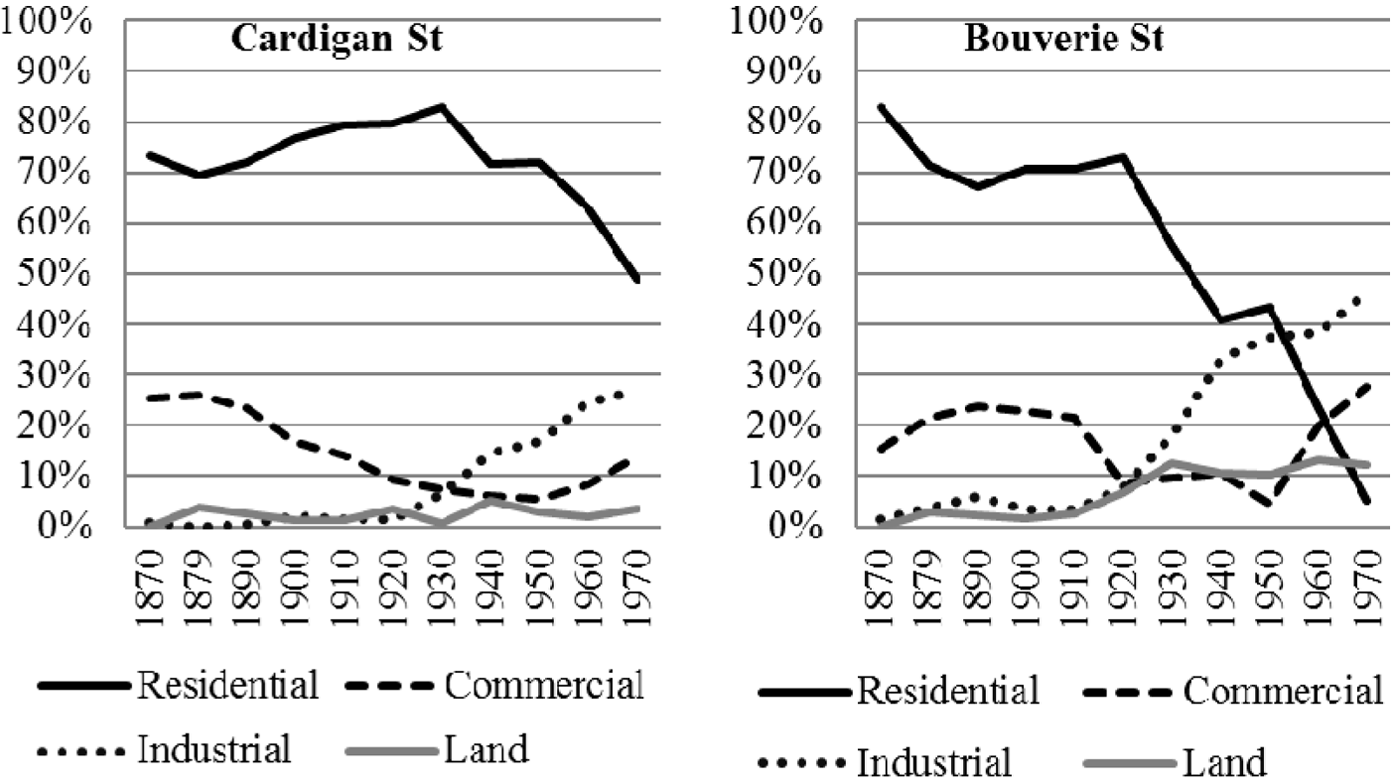
Cardigan St and Bouverie St percent of properties by land use, 1870–1970.
In the regression analysis, land use has been selected as the dependent variable best reflecting change in the built environment in our data set. We choose the three decades 1890–1900, 1920–1930 and 1930–1940 for the regression modelling. 2 The last two periods feature accelerated change but against the backdrop of contrasting macroeconomic fortunes – the ‘roaring 20s’ are followed by the Great Depression years of the 1930s. The 1890s offer contrast because change in land use is subdued, but there is an exogenous shock in the form of a collapse in wool prices that triggers a sharp decline in the Melbourne property market.
Ownership
We used two measures of the size distribution of ownership patterns along each street: the five owner concentration ratio; and the Herfindhal index (‘H index’). The five owner concentration ratio (C5) is the proportion of property titles accounted for by the five largest property owners. Thus:
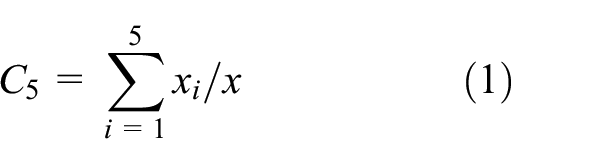
where

By squaring ownership squares the index gives most weight to the larger owners. The focus is on the three sample time periods (1890–1900, 1920–1930 and 1930–1940). In both streets, the H index reflects a dispersed ownership pattern with low H values of 0.03 (0.04) in Bouverie (Cardigan) street in 1890 that persist despite a contraction in the number of owners that is most noticeable in Bouverie. There is also a decline in the number of separate property titles in both streets, but especially Bouverie where the number of properties is halved (see Table 1). Thus average land plot acreage in Bouverie must be increasing, a trend to land consolidation that is correlated with a switch in land use away from residential to industrial. 3 The five owner ratio is invariably higher in Cardigan St. The largest five owners in Cardigan hold a property share that remains around one-third of all properties. In all but the year 1920 the equivalent share in Bouverie is roughly 30%.
Land values (constant prices 2012). a
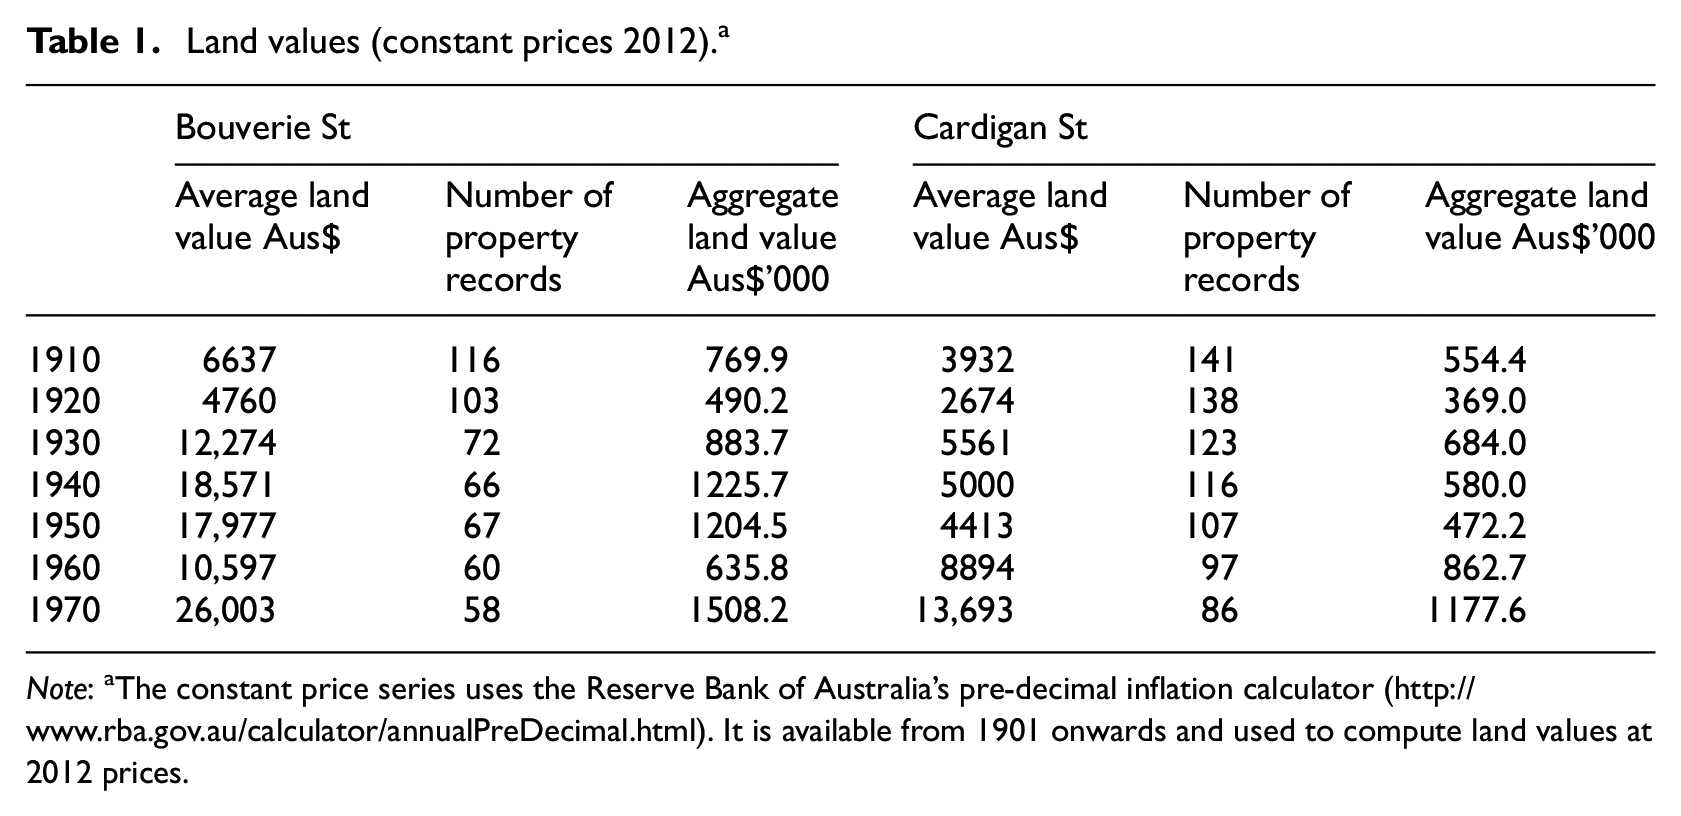
Note: aThe constant price series uses the Reserve Bank of Australia’s pre-decimal inflation calculator (http://www.rba.gov.au/calculator/annualPreDecimal.html). It is available from 1901 onwards and used to compute land values at 2012 prices.
Materials
Figure 3 compares the use of building materials along Cardigan and Bouverie Street from 1870 to 1970. Stone, iron and concrete are excluded as they always constitute a negligible percentage of materials. In 1870 over half Cardigan’s built structures were brick buildings, in contrast to Bouverie St where wooden buildings dominate. Brick is the more expensive material and since both streets were predominantly residential at this stage, Cardigan likely housed a more affluent population. The prominence of brick buildings in Cardigan St suggests that it escaped the poor quality building generated by the 1849 Melbourne Building Regulation Act. Despite depression during the 1890s and 1930s brick buildings increased dramatically in both streets. The pace of change is faster along Cardigan Street, with the proportion of brick buildings rising from approximately 50% in 1870 to 90% in 1910. In Bouverie Street change is slower, and off a lower base, with the proportion of brick buildings increasing from approximately 25% in 1870 to 90% by 1950.

Cardigan St and Bouverie St percent of buildings using indicated materials 1870–1970.
Land value
Average land values at 2012 prices are presented in Table 1. They are calculated by summing the assessed land values and then dividing by the number of land lots. The Reserve Bank of Australia pre-decimal inflation calculator (see Table 1, note a) has been used to convert current price values into a constant price series; but since this only becomes available in 1901, the time series reported in this section is truncated. Average land values are always higher along Bouverie Street, but as both streets have the same (unchanging) length, and there are fewer plots along Bouverie Street, part of the difference is due to the larger land plots along Bouverie St, a difference that becomes more marked with time as land along Bouverie switches from residential to industrial use
Assuming that the aggregate land area along each street remained constant, a comparable picture of differences in land value is afforded by each street’s total real land value (the product of average land value and number of property records). Over the 60 year period 1910–1970 the real value of land along each street roughly doubled, though the trajectory followed to that endpoint is not a parallel one.
The periods containing both World Wars (1910–1920 and 1940–1950) are associated with a slump in real land values along both streets. The post-First World War recovery in land values during the 1920s is again similar, despite a marked acceleration in the rate of land consolidation along Bouverie that we know to be associated with a sharp increase in industrial land use (see Figure 2). But in two decades there is a conspicuous divergence in total land value. By the 1930s industrial and commercial is challenging residential as the predominant land use along Bouverie, helping to maintain the momentum in its land values through the depression years. On the other hand residential housing continues to dominate the 1930s Cardigan streetscape, and proves much less resilient with land values falling (by 15%). The pattern is reversed in the 1950s, a period when home ownership rates surged (Bourassa et al., 1995). Residential Cardigan Street witnesses soaring land values while land values slump along more industrial and commercial Bouverie Street, the result being a convergence in total land values. By 1950 the industrial use of land was as important as residential use along Bouverie Street. But industries were now relocating to the outer suburbs (O’Connor et al., 2001) because access to port and rail hubs became less important, and road haulage is now the major transport node for distribution purposes. Both streets exhibit considerable volatility in aggregate real land values, though the booms and busts are more or less equally dispersed around their average aggregate values. 4
Regression modelling
The land use change (residential, industrial, commercial and other) dependent variable in the regression modelling was coded as a binary variable, with ‘0’ indicating no change, and ‘1’ indicating changed land use. For example, a residential land plot at time t is classified as having changed its land use if at time t+1 its classification is industrial, commercial or other. We estimate regression models that seek to explain change in land use as measured over the three decades 1890–1900, 1920–1930 and 1930–1940. As discussed above these are decades where there has been clear evidence of exogenous shocks or bursts of change in land use. The aim is to diagnose whether the change is spread evenly across the case study area, and if not what drivers account for the difference.
Regression models have been estimated for a pooled sample that stacks observations across all three periods. There was a low rate of attrition (around 2%) that arises because in a few cases we could not establish correspondence between properties in Year 1 (Y1) (1890, 1920 and 1930) and Year 2 (Y2) (1900, 1930 and 1940). In cases where separate and adjacent property titles merged between Y1 and Y2, the Y2 land use category of the merged title is referred to in order to classify whether land use changed on either or both Y1 property titles. Consider, for example, adjacent properties i and j. In Y1 property i is residential and j is industrial; these titles are merged in Y2 and the new property title formed as a result of merger is classified as industrial use. Property title i’s land use has changed, but j’s remains unchanged. The same algorithm is applied to identify the built material of structures sitting on merged property titles in Y2 relative to Y1.
A logit model is employed to estimate the probability (Pi ) of a property i changing land use between Y1 and Y2 as a function of its characteristics (Xi ) in Y1. The logit model has the specification:
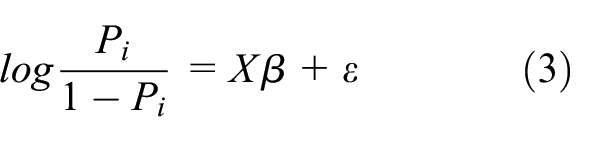
where β is a vector of unknown parameters to be estimated, X is a matrix representing observations on property characteristics and ε is an error term that has the standard logistic distribution, and is assumed independent of X. The property characteristics in matrix X include ownership status, whether it was part of a contiguous landholding (defined as two or more adjacent properties owned by a single entity), its rateable value and building material. We expect owner occupied land plots, and those not part of a contiguous land holding (thus requiring amalgamation to facilitate larger scale land uses) to resist change, especially if a building constructed of non-wood materials occupies the land plot. Transaction, demolition and clearance costs associated with change in land use are higher in the presence of these characteristics (see section ‘Conceptual framework and hypothesis’). Measurement of characteristics at their values in Y1 addresses simultaneity issues, which are likely to be especially important with respect to land values because we can expect changing land use patterns between Y1 and Y2 to impact Y2 land values. Rateable values in Y1 can be considered a predetermined variable especially given their assessed market values that will therefore lag contemporaneous market values.
Three controls are added. First, unmeasured variables that might affect the relative pace of development along Bouverie and Cardigan Streets are captured by the inclusion of a street indicator variable. If, for example, Cardigan Street has historically been the more prestigious address thereby attracting richer and more influential members of the community, the street dummy variable will capture effects resulting from this residential segregation. 5 Second, rateable values in Y1 are included because a developer will tie up more capital on sites with high rateable values. All else equal a developer will wish to acquire sites with a low cost of capital. Third, a series of time dummies is added to the regression with 1890–1900 the omitted reference category. The estimated coefficients tell us whether the pace of change has changed in later 20th century decades. These dummies are important because the coefficient estimates will shed some light on the role that different shocks play in accelerating or slowing development. Table 2 defines the variables used in model specifications.
List of variables. a
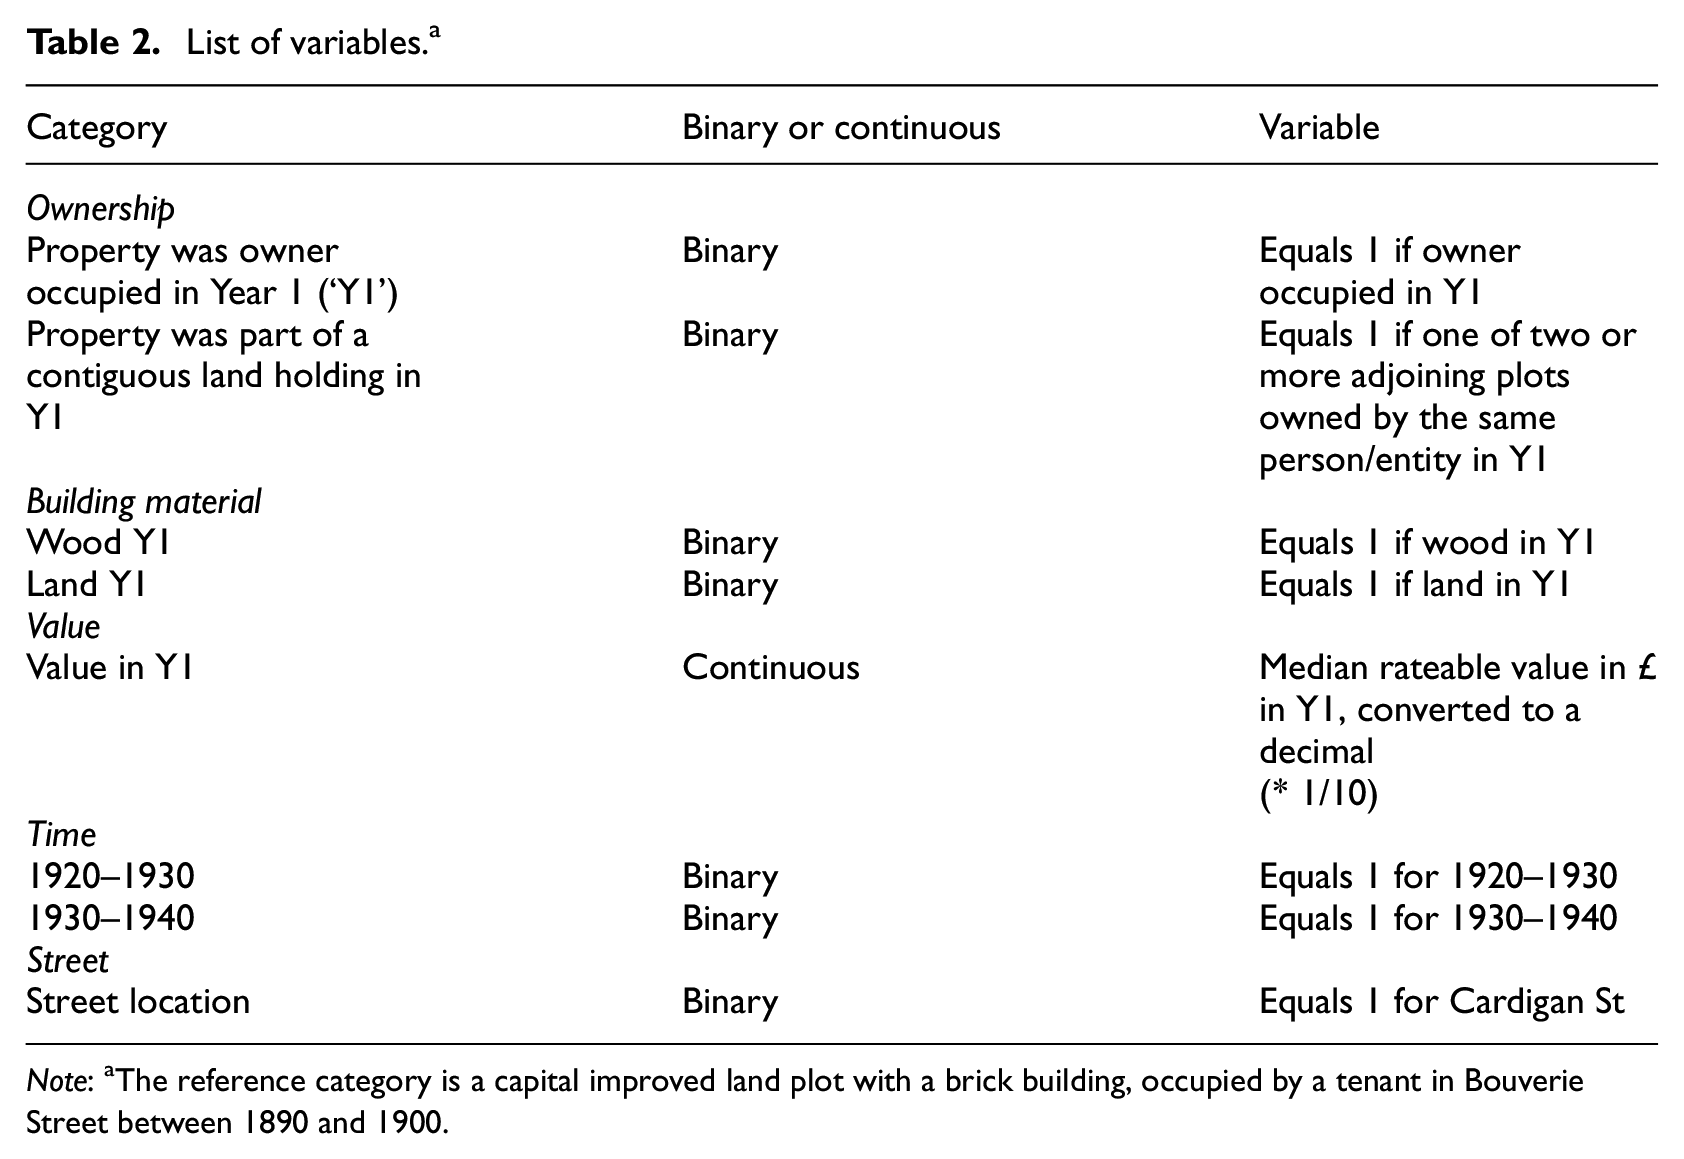
Note: aThe reference category is a capital improved land plot with a brick building, occupied by a tenant in Bouverie Street between 1890 and 1900.
Overall, 25% of observations changed land use from Y1 to Y2 (171 of 684 observations). The two streets had similar land use change during 1890–1900 (23% (26%) in Bouverie (Cardigan) Street); greater change in Bouverie Street during the 1920–1930 period (34% (14%) along Bouverie (Cardigan) Street); and identical change in 1930–1940 (29% in both streets). The pace of change during the Great Depression was relatively high.
Table 3 reports logit regression results for the total sample of property-periods. The first column lists coefficient estimates. In the logit model these estimates have little intuitive appeal, but can be transformed into odds ratios that for binary variables indicate the likelihood (the odds) of land use change when the binary variable is one, relative to those of the group identified when the binary equals zero. The odds ratios are listed in the column headed Exp (β).
Logit model estimates.

The key finding is that urban built form matters to the pace of development. Land lots occupied by easily demolished and cleared wooden buildings are nearly four times as likely to feature change in land use as compared with land lots with brick buildings. Vacant land is over eight times more likely, reflecting the absence of demolition or clearance issues. The initial 1870 built form exerts an enduring influence over the subsequent 100 year timeframe, and is therefore the source of path dependence in urban development across this small area of Melbourne.
A second key finding concerns ownership dimensions that were found to be statistically insignificant. The ‘sweat equity’ and ‘not in my backyard’ arguments offer two alternative hypotheses about the role of ownership, with the first promoting development and the second restraining development. Both could be present but cancelling each other out. The insignificant result for contiguous landholding is more surprising. It might reflect an unsophisticated financial acumen among individual property owners in late 19th and early 20th century property markets. It is also noticeable that land parcels with high rateable values (and therefore larger size) are no more or less likely to exhibit change of land use.
There is evidence that change in land use accelerated during the Great Depression era; the relevant coefficient is significant at 5% and implies that the odds of changed land use were 1.7 times the odds of change between 1890 and 1900. Population growth slowed in these two decades, and both feature severe recession. But by the 1930s the private motor car was a driver of suburban development, prompting middle class moves out of the inner ring of suburbs. Aggregate land values plummet along Cardigan in the 1930s (see Table 1), and likely reflect a ‘flight to the suburbs’ as by this time residential housing is much more important along Cardigan Street. The 1930–1940 dummy might then be capturing structural change triggered by a new transport technology.
Our estimates pick up no significant difference in the pace of change along the two streets. The statistical insignificance of the street indicator variable could nevertheless mask marked but offsetting differences in individual coefficient estimates when models are separately estimated for each street. We have therefore estimated logit models for street subsamples (not shown but available from authors on request).
They reveal that building material variables are again the most important determinants along both streets. Vacant land is most prone to change in land use, followed once more by land on which wooden buildings have been erected. Ownership remains largely unimportant. The pattern and pace of development is different across the two streets. Acceleration in the pace of development during the 1930s is only evident for Bouverie, though not statistically significant. However the 1920s prompts a strong (and statistically significant) quickening in land use change along Bouverie, yet a slowing pace of change along Cardigan (though not statistically significant). This difference is in stark contrast to aggregate land values which exhibit strong growth along both streets in the 1920s (see Table 1). Figures 1 and 2 suggest an explanation; by the 1920s, residential brick buildings have almost entirely replaced all other building forms along Cardigan, but on Bouverie vacant land and wooden buildings still account for roughly one-third of land lots. Large capital gains are therefore accruing to Cardigan owners of residential brick buildings that are likely jeopardised by change to commercial and industrial uses. On the other hand, commercial, industrial and vacant land occupied almost 30% of all Bouverie land lots by the 1920s, and so conversion of residential or vacant land to other land purposes posed less of a threat to capital values, or the immediate neighbourhood character.
Conclusions
This paper contributes to a body of research on the drivers of urban change by illustrating the use of historical property records. We have used these records to design a panel data base that can be interrogated using standard modelling techniques. This database is employed to analyse change in the built environment, and identify the factors driving such change. While the data have limited spatial scope, the research findings have a value in illustrating a novel approach that combines historical method with quantitative analysis of property records documenting land use, rateable value, building material and ownership at ten year time intervals over a 100 year time frame.
The other guiding influence in this paper is the idea that long run urban change occurs unevenly, rather than uniformly across a metropolitan area, because of differences in the built form and ownership patterns. This proposition generates three hypotheses about impediments to land use change that are tested by estimation of a logit model of land use change. The first proposes that fragmented ownership patterns result in small scale developments that tend to persist in the long run, while unified land ownership is conducive to redevelopment and land use change. Contiguous land holding, where one entity owns two or more adjacent properties, proved to be an unimportant influence on land use change. A second hypothesis proposes that owner occupiers of residential housing resist land use changes, and therefore owner occupied land lots will be associated with land use inertia. But the owner occupied status of buildings was again found to be unimportant. Our third hypothesis rests on the proposition that built materials, which are costly to demolish and clear for redevelopment, deter changes in land use. It was strongly supported by logit model estimates suggesting that buildings made from wood are nearly four times more likely to change land use than brick buildings. Vacant land was over eight times more likely to change use, offering further evidence of the importance of demolition and clearance costs. This supports Needleman’s (1969) economic model of improvement which predicts that redevelopment is more likely when the cost of clearing a site is lower.
If these findings were to be replicated using larger sample designs important academic and policy implications would follow. In Australian cities, gentrified inner urban areas tend to have a preserved built form (Badcock, 2001; Forster, 2006) – it is this ‘heritage’ aspect that gives them some of their value. The locations that were the first to gentrify in the 1970s may have been able to do so because of land use inertia in areas of Victorian-era brick housing. It was the original decision to build in these materials, rather than in wood, that caused persistence of residential land use over time and made these locations available to gentrifiers in the 1970s. Heritage controls that emerged at about the same time further reinforced the preservation of these locations. Neighbouring locations where wooden cottages dominated the initial built form were much more likely to change to non-residential land uses. Many of these largely industrial or commercial areas are now being redeveloped for higher density apartments in Australian cities. Therefore, the initial built material selection from more than 100 years ago is shaping the form of the contemporary city.
These implications are heavily qualified by the small scale case study approach. But a main aim of this paper has been to illustrate how historical property records can be used to gain a better understanding of the nature and determinants of long run urban change. These property records contain valuable information that enable drivers of long run change in land use (including planning reforms) to be analysed once the data is assembled as a panel through which land lots can be tracked. It is noteworthy that property records are rarely used in urban research, and where they have been employed, it is usually over a shorter study timeframe (Delmelle et al., 2014). Their rare use for the analysis of long run change is likely due to the high resource cost of conducting research on a geographical scale and study time frame sufficient to permit generalised conclusions to be drawn. While the geographic scope of our empirics is limited, the hypotheses that we explore and the empirical findings generated by our case study demonstrate the potential value of this approach to the urban studies field, and the importance of replicating our findings on a wider spatial canvas.
Footnotes
Acknowledgements
We are grateful to four anonymous referees for their helpful comments and suggestions. The authors are entirely responsible for any omissions or errors.
Funding
This research was partly supported by RMIT University internal seed funding.