




Abstract
The direction and mechanisms of the relationship between airport traffic volumes and property prices are somewhat unclear in the literature. This study adds to that body of knowledge by empirically investigating the role of airports as an essential driver of economic activity by creating employment and facilitating air travel between destinations. The two-stage least-squares (2SLS) approach is employed to investigate the link between house prices and the airport traffic volumes of New Zealand’s three key regions and airports (Auckland, Canterbury/Christchurch and Wellington) from July 2004 to December 2014. The empirical findings of the study suggest that airport traffic volumes positively and significantly influence the urban house prices of New Zealand’s three major regions.
Introduction
To date, a substantial body of literature has investigated various aspects of the impact of airport activity on local housing markets. For example, recent studies relating to hedonic analysis of the impact of the externalities of airport activity (e.g. Chalermpong, 2010; Cohen and Coughlin, 2008, 2009; Gualandi and Mantecchin, 2008; Matos et al., 2013; Nelson, 2004, 2008; Pope, 2008; Tomkins et al., 1998) have suggested that airport noise levels and close proximity to an airport have a significant negative influence on residential housing prices in the surrounding area. In addition, other studies (Beron and Murdoch, 2001; Suksmith and Nitivattananon, 2014) have claimed that air quality (i.e. air pollution and visibility) resulting from airport operations will also have a significant negative effect on surrounding house prices. These empirical studies are in almost unanimous agreement that an increase in air traffic volumes at an airport acts as a significant negative externality that reduces property prices. Similarly, the negative effect of airport activity on property prices is reinforced by the findings of Jud and Winkler (2006) who found that the announcement of a new airport hub will reduce property prices near the airport in the post-announcement period. Similar analyses (see, for example, Debrezion et al., 2007; and Carey and Semmens, 2003 ) have been conducted in the context of major roads and railway and have reported mixed results. This is largely due to the location/distance to the road/railway of interest and types of properties in the sample (apartments, houses, commercial/residential). In the current study, the focus is on the time series dynamics of airport traffic to the regional house price as a whole.
It should be noted that a well-developed and connected key commercial airport within a country/city acts as a central node that facilitates air transport movements (air passenger and air cargo traffic), tourist flows (domestic and international) and trade volumes (Appold and Kasarda, 2013; Tsui and Fung, 2016a, 2016b), as well as creating jobs and employment (e.g. Appold, 2015; Ding and Knapp, 2002; Mukkala and Tervo, 2013; Nelson, 1980). Importantly, an airport has long been considered to be a crucial generator of economic activity, and increases the attractiveness of a country/city for business development as air services are better able to connect territories by transporting travellers and cargo (particularly perishable and/or valuable goods) between destinations (e.g. Bilotkach, 2015; Cidell, 2015; Green, 2007; Percoco, 2010; Tsui and Fung, 2016b; Zak and Getzner, 2014). In addition, Graham (2008) and Karlsson et al. (2008) point out that an airport contributes to the economic development of a country or a city via four avenues: direct impacts, indirect impacts, induced impacts and catalytic impacts. However, the impact of an airport on economic development is mainly dependent upon the areas served by a given airport (Percoco, 2010). Furthermore, Button and Taylor (2000) suggest that international air transportation has four types of effects (i.e. primary effects, secondary effects, tertiary effects and perpetuity effects) on the local economy.
A growing body of literature also examines the impact of airport activity on metropolitan employment. For example, Hakfoort et al. (2001) found that the ratio of direct employment to indirect and induced employment at the Amsterdam Schiphol Airport is approximately 2 to 1. Brueckner (2003) provided evidence of the link between airline traffic and employment in metropolitan areas in the USA. In addition, Richard (2008) also found that 1 million passengers per annum generated 500 on-site jobs at German airports. These studies have important implications for metropolitan economic development emerging from airport activities, and suggest that airports go beyond merely flight operations (take-offs and landings) but also evolve into major business enterprises with spatial impacts and functional implications (Freestone, 2009). Importantly, airport activity (particularly passenger activity) is claimed to be a strong predictor of employment and population growth (Green, 2007). In addition, McMillen (2004) studied the impact of the building of a new runway at the Chicago’s O’Hare Airport and suggested that airport expansion may increase property values in the densely populated area surrounding the airport, as well as raising service-related employment and job creation in the Chicago area. Also, the increased economic activity from airport runway expansions led to an increased in employment (Tittle et al., 2013). However, Tomkins et al. (1998: 244) emphasised that ‘airport expansion and associated growth in income and employment place significant pressures on the local environment, not only from additional passenger throughput and air traffic movements, but also from expanding freight transit and maintenance operations’.
The significance of the link between airport activity and the price of houses surrounding an airport and the link between airport activity and the economic development of a country/city have been studied in previous research. In urban economic theory, a well-functioning regional airport being served as a central point will increase the city’s land values because of agglomeration economies and positive locational externalities, although property prices in the immediate residential areas may be depressed as a result of airport traffic congestion and noise. However, the research regarding the relationship between an airport’s traffic volume and regional house prices surrounding the airport has been scant in the extant literature, particularly regarding the direction of influence. One of the possible reasons for this is the issue of simultaneity during econometric analysis (Green, 2007); furthermore, its direct impact on the housing market is also ambiguous – unlike to the negative effects of the externalities identified by hedonic analysis (e.g. airport noise levels and air pollution). In the housing literature, the growth of residential property prices is dependent on many factors including the growth of population, income, employment, rents, building costs as well as land supply. National variables such as Gross Domestic Production (GDP), interest rates and exchange rates are believed to affect the local housing market as well. More recently, Leung et al. (2013) found that the New Zealand housing market is also influenced by changes in international commodity prices.
This paper overcomes the simultaneity issue by employing a two-stage least-squares (2SLS) analysis of New Zealand’s three major regional and international airports (i.e. Auckland, Canterbury/Christchurch and Wellington) whilst controlling for all necessary house price determinants at both the local and national levels. This approach allows us to correctly model the causal link between house prices and airport traffic volumes. The findings suggest that airport traffic volumes are indicators of local housing market growth. The contribution to the literature is twofold: first, it is the only study to date to study this unique linkage in detail; and second, we provide a thorough empirical analysis that uncovers causality in the airport traffic volumes and regional housing prices relationship.
Overview of the property indexes of New Zealand’s major regions and airport’s workload units, and descriptive statistics
The property index is obtained from the Real Estate Institute of New Zealand and reports the stratified median house price in the corresponding region. Developed in conjunction with the Reserve Bank of New Zealand, the stratified median adjusts for anomalies in sales across suburbs and is an ideal measure of the market trend in house prices. 1 Figure 1 displays the time plots of the property indices (stratified median house prices) of three key regions of New Zealand (Auckland, Canterbury/Christchurch and Wellington) and their respective international airports’ workload units (airport activity) between July 2004 and December 2014. Figure 2 depicts the boundaries of three key regions in this study. The descriptive statistics for the three key New Zealand regions and their respective international airports are presented in Table 1. As observed from Figure 1, the monthly house price index of the three major New Zealand regions experienced a relatively steady growth rate during the study period. House prices for these three regions exhibited noticeable growth during the period of July 2004 to June 2007, followed by a fall between July 2007 and July 2008 due to the global financial crisis (GFC).

Time plots of property prices and airport workload units for New Zealand’s three major regions and airports (July 2004–December 2014).

Boundary of three key regions in New Zealand (Auckland, Canterbury/Christchurch, Wellington).
Descriptive statistics of the property price index and airport workload units for New Zealand’s three major regions and airports (July 2004–December 2014).
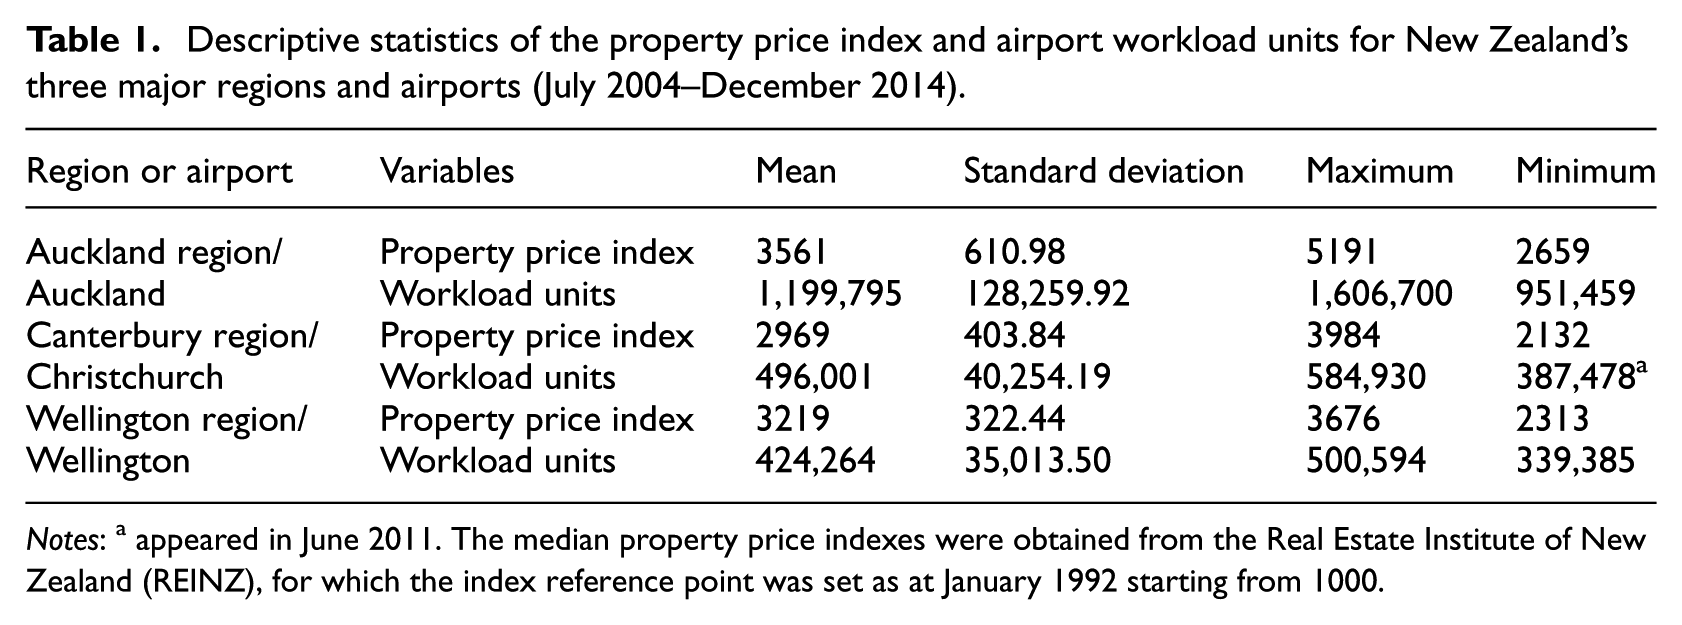
Notes: a appeared in June 2011. The median property price indexes were obtained from the Real Estate Institute of New Zealand (REINZ), for which the index reference point was set as at January 1992 starting from 1000.
However, house prices maintained robust rates of growth after July 2008. In particular, Auckland region’s property market (New Zealand’s largest city-region) presented the largest magnitude of growth when compared with the markets of Canterbury and Wellington during the sample period. This can be ascribed to the geographic location of Auckland with limited land supply for housing, size of its fast-growing local population, 2 a larger proportion of international migrants, and its role as New Zealand’s key trade and commerce centre, which facilitates local–global links (e.g. Baxendine et al., 2005; McCann, 2009; Shirely and Neil, 2013; Wetzstein, 2007; Xue et al., 2012). This may suggest that the link between property values and economic development is a function of the local economic landscape, which varies in terms of trade patterns and key industries of the city, etc. (e.g. Appold, 2015; Appold and Kasarda, 2013; Ding and Knapp, 2002; Mukkala and Tervo, 2013; Nelson, 1980).
Christchurch is the country’s second largest city and located in the South Island. The Christchurch housing market was characterised by the 2011 Christchurch earthquakes, where about 5% of the city’s housing stocks were demolished through liquefaction. Christchurch house prices dropped immediately after the earthquakes, and gradually rebounded because of a shortfall of liveable housing in the city. Wellington is the capital city and the growth of its housing market has been slow and stable since the GFC in 2007. This is partially due to the shrinking government sector since the National government took office in 2008. Meanwhile, the 2011 Christchurch earthquakes have since increased seismic awareness for residents in Wellington. 3 No doubt, regional house price cycles are seen to be driven contemporaneously by regional activity (Hall et al., 2006). On average, Auckland’s monthly property index (3561) was higher than Canterbury’s (2969) and Wellington’s (3219).
There are a total of 16 commercial airports offering scheduled flight services in New Zealand. Looking at the workload units 4 (airport activities) of New Zealand’s three key international airports, Auckland Airport is New Zealand’s largest and busiest airport as it handled the largest volume of air passengers and air cargoes within the sample. Auckland Airport’s influence and role within New Zealand’s aviation industry is mainly attributed to its hub and gateway status in transporting air passengers and air cargoes between a large number of international and domestic destinations through its extensive connectivity networks (De Wit et al., 2009; Lee, 2009; Tsui et al., 2014). Perl (1998) claims that access to international markets is seen to hinge upon an effective hub that can facilitate competition for freight and passenger traffic. Christchurch Airport is the second busiest international airport in New Zealand, located on the South Island of New Zealand, and its close proximity to one of the prime tourist destinations of New Zealand, Queenstown, attracts many international airlines (e.g. Air Pacific, Emirates, Fiji Airlines, Jetstar, Qantas, Virgin Australia, Singapore Airlines, AirAsia X 5 ). Wellington Airport is located in the capital city of New Zealand (Wellington). Its flight connectivity network primarily covers domestic destinations within New Zealand and the key trans-Tasman routes and destinations in the Oceania region (e.g. Brisbane, Gold Coast, Melbourne, Nadi and Sydney).
The average number of monthly workload units handled by Auckland Airport was 1,199,795, followed by Christchurch Airport (496,001) and Wellington Airport (424,264). Christchurch and Wellington Airports are important in their respective regions but only generated a fraction of the air traffic volumes of Auckland Airport (Vowles and Tierney, 2007). In addition, only Auckland Airport maintained an upward trend during the study period and experienced the largest average monthly growth rate (0.43%). The air traffic activities of Christchurch and Wellington Airports exhibited a more stable trend after 2008. Importantly, the plots of the monthly airport activities (which includes tourist flows) for these three key New Zealand international airports displays different growth patterns, alongside high seasonal patterns in traffic flows (Commons and Page, 2001; Gitto and Mancuso, 2012; Tsui and Balli, 2015).
Regarding the growth trends of international air travel of the three key airports, only Auckland Airport experienced steady growth throughout the study period owing to its extensive flight connectivity and coverage, 6 whereas the growth trends of Christchurch and Wellington Airports remained relatively stable. For domestic air travel, the three sampled airports exhibited differing rates of growth for the study period; Auckland experienced strongest growth in its domestic passenger traffic, followed by Wellington Airport and Christchurch Airport. Note that substantial fluctuations (volatility) in monthly airport traffic volumes are observed for these three key New Zealand international airports. Surprisingly, the global financial crisis 2008/2009 did not significantly impact airport traffic volumes. However, the Christchurch earthquakes of 2011 adversely affected the airport activity demand of Christchurch Airport for the period of February 2011 to January 2012, with the lowest level of workload units (387,478) occurring in June 2011.
Empirical models
Our empirical strategy is to use the region/airport-level panel data to investigate the relationship between property prices and airport traffic volumes in New Zealand. The data set covers the period of July 2007 to December 2014 for the three regions and key international airports of New Zealand (Auckland region/Auckland Airport, Canterbury Region/Christchurch Airport and Wellington Region/Wellington Airport). To control and mitigate any potential omitted variable bias, this study adopts the panel data regression model to analyse the property prices of New Zealand’s three key regions, as this allows us to control for observable region (city)/airport-level covariates and other unobservable factors in the panel aspects of the dataset (Hong et al., 2011; Wooldridge, 2002). However, one of the challenges in modelling and interpreting regression estimates of the property price data is the potential problem of endogeneity confounding any underlying causal relationships that may exist. For example, the presence of an omitted latent variable that influences both the property prices and the regressor of interest (airport’s workload units) will bias the regression estimates and our interpretation of the causal relationship, if any. As such, in the absence of experimental data, it is imperative for us to use instrumental variable(s) to overcome this estimation issue (Wooldridge, 2002). Finding a strong and valid instrument can be a difficult task, as two important conditions must be upheld (Villas-Boas and Winer, 1999):
The instrumental variable is correlated with the endogenous regressor of interest, and
The instrumental variable is uncorrelated with the error term of the regression of interest.
In this study, consistent with Stern (1996) and Mumbower et al. (2014), a measure of airport competition (an airport’s activity concentration or market power) is used as the instrument for an airport’s workload units. Airport competition, theoretically, satisfies the conditions for a valid instrument, as it should have an influence on an airport’s workload units. For example, Forsyth (2006) discussed and found significant links between airport competition and traffic volumes, and highlighted its welfare implications. Cui et al. (2013a, 2013b) claimed that the improvement of an airport’s competitiveness will decrease the market share of other airports. Similarly, the competitiveness of an airport will largely depend on ‘five core factors’: spatial, facility, demand, services and managerial (Park, 2003). Wang et al. (2016) also claim that airline market competition and airline market concentration have had strong and robust relationships with airline traffic volumes in China.
In this study, we analyse the workload of three major airports in New Zealand. When there is little competition, characterised as high concentration in national aircraft movement market share, the major airports are likely to experience relatively higher levels of workload. Similarly, in periods of high competition and low concentration in market share, major airports are likely to experience relatively lower levels of workload. Thus this satisfies the first condition for the adoption of a concentration/competition-type instrumental variable. However, there is no convincing argument that factors influencing property prices are related to the level of competition faced by local airports beyond the channel of airport activities/throughput. As such, it is likely that the second condition of a valid instrumental variable is also upheld. These two conditions will be empirically tested in this study using the F-statistic of the first-stage regression and the Hansen–Sagan J-statistic for overidentifying restrictions. 7
The fixed-effect panel regression of interest is written as equation (1):

where
Note that the control variables included in this study are those typically employed when modelling property prices: (1) national economic variables, namely national gross domestic product (GDP) per capita, migration, and number of unemployed persons; (2) variables that are likely to influence property investment: the interest rate (the cost of borrowing in a house purchase) and the exchange rate; (3) rent; 8 and (4) exogenous shocks: the global financial crisis of 2009–2012 and the Christchurch earthquakes of 2011.
As

where
The predicted prices of
In the 2SLS model, all the control variables in equation (1) are treated as covariate variables that may influence the relationship between property prices and an airport’s workload units. This is due to the complex and often confounding nature of macroeconomic linkages, such as unemployment, property prices and unobservable demand shocks in the local economy (Gerlach and Peng, 2005). As such,
The data used in this study were collected from various sources. Airports’ workload units (airport activities) were obtained from the airports’ annual reports and management. National GDP per capita, regional unemployment (the number of unemployed persons), migration, the supply of new houses, the material costs for the house construction and the median salary were sourced from Statistics New Zealand. New Zealand Airways provided the flight movement data for all New Zealand’s commercial airports (used to compute the HHI Index). The mortgage interest rate and exchange rate data were sourced from the Reserve Bank of New Zealand. The regional house price indices and rental data were retrieved from the Real Estate Institute of New Zealand and the Ministry of Business, Innovation and Employment, respectively.
Empirical findings and discussion
Unit root tests
In order to estimate the panel regression model, all variables must be stationary to avoid the modelling of spurious correlations (Aizenman and Jinjarak, 2009; Alba and Papell, 2007; Leung et al., 2013). We conduct panel unit root tests (i.e. Levin, Lin & Chu; Im, Pesaran & Shin; Augmented Dicky–Fuller (ADF), and Phillips–Perron (PP) tests) to ensure the stationary properties of all the variables included in this study. Table 2 presents the results of the panel unit root tests, and confirms that all the variables are non-stationary except for ln(rent), ln(exchange rate), and ln(HHI Index). We apply first-order differencing to all non-stationary variables in order to arrive at stationary transformations.
Panel unit root tests of the variables of interest (July 2004–December 2014).

Notes: The values indicate the p-values. The test is shown for the specification with the constant term only (no time trend). ** indicates that the rejection of the null hypothesis (
Estimation results
Table 3 presents the 2SLS regression results of the relationship between ln(property prices index) and ln(airport’s workload units), using ln(HHI Index) (airport concentration) as the instrumental variable. It should be noted that the panel model specifications are also based on the within-airport variation (rather than between-airport variation) in an attempt to estimate the unbiased model coefficients. The advantage of within-airport variation is that it permits stronger causal inferences and is more resistant to the endogeneity bias than in the cross-sectional regression analysis (Bilotkach et al., 2012).
Fixed-effect 2SLS models of the property prices of New Zealand’s three major regions and airports (July 2004–December 2014).

Remarks: *, **, and *** indicate that the explanatory variable is significant at the 0.10, 0.05, and 0.01 significance levels, respectively. Bootstrapped standard errors are contained in parentheses. a indicates the predicted value of ln(airport’s workload units) for the second-stage regression.
To better understand the inherent relationship between property prices and an airport’s workload units, we empirically estimate the relationship in Models (a) and (b) by excluding the control variables. Note that Model (b) considers the effect of seasonality on the housing markets in the three regions under consideration. The statistical significance of ln(HHI Index) on airports’ workload units in New Zealand in the first-state regression is reported in the top panel of Table 3. Significance in the first-stage regression facilitates the computation of the predicted values of ln(airport’s workload units) required in the second-stage regression analysis.
A statistically significant and positive coefficient estimate for ln(airport’s workload units) is reported in Model (c) at the 5% level. Together with Models (a) and (b), the empirical findings of this study support the literature’s general perception that the level of concentration at an airport has a significant impact on its air traffic volumes (Bilotkatch, 2015; Bilotkatch and Lakew, 2014). Overall, the coefficient estimate of ln(airport’s workload units) reported in all three model specifications are consistent (albeit with small differences in their significance levels).
Several key observations from the estimation results of Model (c) can be made. First, the statistically significant positive impact of ln(airport’s workload units) on the property prices of New Zealand’s three key regions suggests that air transport activities (air passenger and air cargo movements) passing through New Zealand’s three key international airports can generate more trade/business/related logistical activities and employment opportunities for the respective regions and cities. These transmission mechanisms are expected to have a positive influence on regional housing prices, ceteris paribus. Recent studies such as Bilotkach (2015) and Green (2007) have demonstrated the impact of airport activity on economic development.
Second, the statistically significant coefficient of ln(national GDP per capita) is consistent with standard economic theory, as it is an indicator of the purchasing power of a country (Eckes, 2011; Le Gallo and Ertur, 2003; Yueh, 2008). That is, higher growth in personal income and national economic output is associated with a greater purchasing power within the population’s ability to afford housing (Agnello and Schuknecht, 2011), ceteris paribus. It should be noted that New Zealand’s GDP per capita grew from approximately NZ$35,631 in 2004 to NZ$ 51,319 in 2014, equalling a 44.03% increase (Statistics New Zealand, 2015b). Arguably, the regional per capita GDP may be a better suited indicator of the level of economic development and purchasing power of a region. In unreported results, we re-estimate Model (c) using regional GDP per capita in place of national GDP per capita. The results remain consistent with those contained in Table 3. That is, there is a positive and statistically significant coefficient for ln(airport’s workload units) in the second-stage regression. 10
Lastly, it is surprising to find that the empirical results of ln(interest rate), ln(rent), ln(exchange rate), migration, ln(unemployed persons), the global financial crisis 2009–2012, and the Christchurch earthquakes 2011 have had no impact on the house price indices, ceteris paribus. The empirical results show that, except for national GDP per capita, none of the remaining control variables exhibited a statistically significant marginal covariation with property prices during the study period. This may be due to correlations with airport activities or other confounding factors. Note that the control variables are not instrumented and hence their estimated coefficients do not represent causation. Importantly, the findings of this study highlight the need to incorporate airport traffic volumes/activities when forecasting local housing market price movements in New Zealand cities.
Validity of instruments
An alternate model specification was employed to facilitate formal tests of the validity of the proposed instrumental variable, ln(HHI Index). In order to create an overidentified system of equations, we used the lags of ln(airport’s workload units) as the instruments. The use of internal instruments is possible under the assumption of sequential exogeneity (e.g. Arellano and Bond, 1991; Roodman, 2009; Schultz et al., 2010; Wooldridge, 2002). The second-order lag of ln(airport’s workload units) was used as an additional instrumental variable, as the panel tests for serial correlation reported that serial correlation of order one was present in the model. This invalidates the first-order lag as the valid instrument. The residuals of the model specification employing ln(HHI Index) as an instrumental variable are uncorrelated with the second-order lag of ln(airport’s workload units). Likewise, the residuals of the model specification employing the second-order lag of ln(airport’s workload units) as an instrument are uncorrelated with ln(HHI Index). 11 Coupled with the significant first-stage regression results, these results suggested that ln(HHI Index) is a strong and valid instrument.
Concluding remarks
Using the 2SLS model, this study examines the relationship between regional house prices and the airport traffic volumes of New Zealand’s three key regions and international airports (i.e. Auckland, Canterbury/Christchurch and Wellington) for the period of July 2004 to December 2014. The empirical findings of this study reveal that airport traffic volumes (an airport’s workload units) significantly influenced the house prices of New Zealand’s three major regions and cities. This confirms that, whilst airports serve an important role in a city’s transport infrastructure, they are also major generators of economic activities, such as the facilitator of international and domestic traveller flows, and the creator of jobs and employment. Among all covariates incorporated in this study, only national GDP per capita has a positive significant association with the property housing markets of New Zealand’s major regions, ceteris paribus. This may reflect the relationship between higher growth rates in personal income/economic activity and housing affordability.
The main contribution of this study is the comprehensive analysis of the impact of airport traffic volumes on regional house prices using a 2SLS panel model. More importantly, this particular issue has not been extensively researched and explored by prior studies. The 2SLS approach allows this study to produce a robust regression coefficient estimate for the property prices–airport traffic volumes relationship by mitigating the estimation issues caused by endogeneity.
The findings of this study highlight opportunities for developers to use value capture techniques in order to fund the building of housing and off-site airport infrastructure to support an airport’s operation and growth. A good example is the urban development of the new town of Tung Chung near Hong Kong International Airport (HKIA) that was aggressively and successfully developed by property developers through the transit value capture strategy. The railway infrastructure was financed with the ‘Rail + Property’ development programme (Cervero and Murakami, 2009). Owing to its close proximity to HKIA and Hong Kong hub-based airline headquarters (e.g. Cathay Pacific Airways, Dragonair, Hong Kong Airlines and Hong Kong Express), this area is attractive to airline personnel who wish to purchase or rent residential properties, which subsequently increases the house prices of the Tung Chung area. In addition, aviation-related infrastructures have been established in the precinct of HKIA, such as air freight terminals (Asia Airfreight Terminal Company, Cathay Pacific Cargo Terminal), aircraft engineering and maintenance providers (Hong Kong Aircraft Engineering Company Limited – HEACO, Hong Kong Aero Engine Services Limited – HAESL). Similar development of off-site airport infrastructure would likely support the future growth of air traffic volumes of New Zealand’s three key international airports.
In terms of future research, similar studies along this avenue can be conducted on other secondary/provincial cities and regional airports in New Zealand, and to explore whether airport traffic volumes and the growth of the aviation sector in those secondary cities may influence their respective property prices. Moreover, the methodology and the results of this study are likely to be of interest to other countries and regions (e.g. Australia and North America). This is particularly the case for those destinations that have been experiencing rapid growth of airport activities (increasing international/domestic air passenger and air cargo numbers) and rising property prices, such as in Sydney, Australia. Gaining a more accurate understanding of the link between airport workload and property prices will allow policymakers to implement value capture techniques to improve the welfare of the community and make better strategic decisions regarding airport construction and local development.
Footnotes
Funding
This research received no specific grant from any funding agency in the public, commercial, or not-for-profit sectors.