



Abstract
In the past decades, when São Paulo became the national manufacturing centre, it has experienced great population growth. Since then, many housing problems have emerged. In addition, the difficulties that inner cities face in attracting jobs and maintaining economic activities are particularly challenging. Indeed, even if many cities have successfully regenerated their central areas, the so-called inner city problem is still very much alive in the case of São Paulo. As a result although the city centre has abundant urban infrastructure it still has plenty of vacant spaces, including residential buildings. One could say that São Paulo’s city centre is characterised by a large number of empty spaces in an area that is simultaneously crowded with buildings and urban facilities. This paper intends to contribute to the empirical analysis of the determinants of vacancy rates, with a particular focus on historical city centres, using São Paulo Metropolitan Area as our case study. Our empirical analysis relies on district-level data for the years 2000 and 2010, and combines standard spatial econometric methods with hedonic modelling. Our results suggest that there are three main groups of determinants: individual buildings characteristics, mobility of households and neighbourhood quality. We find evidence that the historic central city is a distinctive submarket, needing special urban policies. Its determinants work differently when compared with the housing markets of other areas across the city.
Introduction
São Paulo’s metropolitan area is one of the largest urban regions in the world. As with any other large metropolitan area, understanding this city’s structure, problems and dynamics is not a simple task. The difficulties that inner cities face in attracting jobs and maintaining economic activities (see Begg et al., 1986, for an early discussion of British cases) are particularly challenging. Indeed, even if many cities have successfully regenerated their central areas, the so-called inner city problem is still very much alive in São Paulo. As a result although the city centre has abundant urban infrastructure it still has plenty of vacant spaces, including residential buildings. One could say that São Paulo’s city centre is characterised by a large number of empty spaces in an area that is simultaneously crowded with buildings and urban facilities.
The structure of cities has been studied by urban economists ever since von Thünen’s land use theory was adapted to urban contexts by Alonso (1964) and then by Muth (1969) and Mills (1972) in the so-called Alonso-Muth-Mills model (AMM).
Research on property and housing markets has followed a related but different approach. On the one hand, housing markets have been modelled with emphasis on the specific features of properties such as durability, heterogeneity and construction costs. On the other hand, research on real estate finance has been developing and applying a variety of valuation methods, focusing on supply and demand adjustment mechanisms and considering properties as assets.
We argue that there is a case for integrating the above-mentioned research fields because they analyse issues embedded in urban areas, where the spatial features of markets represent a unifying theme. Furthermore, we believe that the analysis of vacancy rate determinants is a suitable subject for such integration.
Among the early studies that incorporated vacancy rates into housing market models, Blanck and Winnick (1953) and Rosen and Smith (1983) propose the existence of a causal relationship between the deviation of vacancies from their alleged natural level and price movements. The natural vacancy rate is that at which prices tend to remain stable.
Inspired by the recent literature focused on searching and matching processes in labour markets, Gabriel and Nothaft (2001) split vacancy rates into two components: duration and incidence. A more heterogeneous stock leads to units being vacant for longer periods of time because the search process takes longer as buyers need to see more units before finding what they are looking for. Demographic features explain higher incidences of vacancy for specific markets. For instance, the increase in demand caused by new household formation can be met by formerly vacant units. Likewise, if households are more mobile and move more frequently, then more units become vacant during each period.
The validity of this price adjustment mechanism is questioned by Wheaton and Torto (1994), who argue that there should be a contemporaneous relationship between vacancy and rents. In their model, price movements depend on an equilibrium rent, which in turn depends on the net flow of consumers and past vacancy rates. Englund et al. (2008), building on the models of Hendershott et al. (1999, 2002), propose property models that incorporate demand for space factors on top of the usual deviations from natural vacancy rates and equilibrium rents. These factors are primarily justified by moving costs and long contract tenure. It is also worth noting that zero vacancy does not necessarily represent the optimal situation, as the housing search process takes time and consumers need a range of vacant units from which to choose. Nonetheless, an excess of supply is a waste of a scarce resource (Wheaton, 1990).
This stream of work also adds a focus on differences across segmented markets within a city, specifically the market of the historical city centre (Goodman and Thibodeau, 1998). In fact, the core idea underlining the AMM model is how different locations across segmented markets are valued. In contrast, the real estate finance literature on vacancy does not focus on the role of these intra-urban variations in vacancy drivers.
São Paulo has a general spatial pattern of residential vacancy, with high vacancies in central areas and low vacancies in the suburbs. Moreover, there is an unequal spatial distribution of transport infrastructure and urban facilities (such as parks, museums and other amenities), which are disproportionately concentrated in the centre and relatively scarce in other areas of the city. Combined, these features indicate that higher vacancy rates in the city centre seem to represent a misallocation of residential space that is well served by urban amenities.
The ‘housing deficit’ in São Paulo’s urban area amounted to 694,042 units 1 in 2010, whereas there were 476,112 vacant residential units in total (IBGE 2010 Census). This significant housing deficit indicates the need to seek alternatives in the provision of good quality housing and, clearly, the reduction of residential vacancy rates in the city centre might be an option. Nonetheless, to assess whether this is a sensible approach it is important that vacancy levels are monitored and their underlying drivers understood. This paper intends to contribute to the empirical analysis of the determinants of vacancy rates, with a particular focus on historical city centres, using the São Paulo Metropolitan Area (SPMA) as our case study. Our empirical analysis relies on district-level data for the years 2000 and 2010, and combines standard spatial econometric methods with hedonic modelling.
Housing in city centres and the case of São Paulo
Central neighbourhoods share some special attributes, such as proximity to jobs, availability of public transportation infrastructure and easy access to historical sites. These features support our view that such neighbourhoods might represent distinctive submarkets within a larger urban area. This section briefly reviews the attributes of historic city centres from a housing economics perspective.
Urban dynamics may lead to the deterioration of housing stock in older central areas, which become economically obsolete and do not provide incentives for investment. This fact alone would lead to occupation by lower income residents. Rosenthal (2008) highlights this process in the USA, showing that there are cycles of housing ages and income levels in neighbourhoods. In contrast, Glaeser et al. (2008) provide evidence that accessibility is more important than housing quality in household locational decisions. It is also worth noting that Brueckner and Rosenthal (2009) find that when we control for quality (age), richer households outbid poorer ones in central locations.
There is also evidence that the renewal of historical central neighbourhoods may significantly affect property valuation. For instance, Brueckner et al. (1999) note the role of amenities in explaining the persistence of rich historical city centres (Paris being a remarkable example). They also consider the existence of endogenous amenities created by the presence of high-income residents, such as good restaurants, shops and theatres. Finally, they also mention natural factors, such as the presence of rivers or proximity to the coast and historical amenities, such as monuments, buildings and parks.
We also note that in the case of derelict historical city centres mainly occupied by poor residents, there is a rationale for landowners to wait for higher prices rather than selling or renting their properties. As suggested by Brueckner and Rosenthal (2009), spontaneous gentrification may occur or governments may decide to invest in the renewal of historical sites. In any case, while owners wait for property values to rise in the future, vacancy rates are expected to be higher than they would be otherwise.
The literature reviewed above helps us to understand the economic development of São Paulo’s city centre and the nature of its housing issues. Over the course of centuries, São Paulo became a polycentric area, and the city’s original centre lost a great deal of its business relevance. During this process, the city centre was unable to avoid the development of a series of urban problems; it became relatively less attractive to residents, resulting in above average vacancy rates.
The issue of higher residential vacancies in the city centre has been relevant in the case of São Paulo for quite some time. In fact, since 1997, social movements have been promoting squatting in empty central buildings, aiming to convince the government to use these vacant properties as social housing.
The municipality launched a first attempt to renew the historic centre in 1997, changing the urban regulation for the area. In addition, the 2002 master plan created legal mechanisms that aimed to foster social housing in the city centre. Moreover, in accordance with the Statute of the City (2001) – a then newly established federal law – and its principle of social functions for private properties, the same master plan also included instruments to reduce vacancies, but these have yet to be implemented. Another potential source for the expected urban renewal was an investment programme funded by the Inter-American Development Bank, which deployed some US$100 million from 2003 to 2012. 2
To increase the employment pool of the city centre, during the 2000s the municipal and state public administrations occupied some of the city’s empty office buildings. The municipality also provided some social housing through retrofitting and restoration of empty buildings. 3 Altogether, the announced plans and initiatives created incentives for owners of vacant properties to wait for the eventual urban renewal, which reduced attempts to rent or sell properties in the early 2000s (Bonfim, 2004). In addition, owing to the lack of demand, the cost of keeping a building empty was lower than the cost of restoring and selling or demolishing and re-building.
The outlook nonetheless changed substantially during the subsequent period. Owing to substantial growth in per capita income, combined with institutional changes that reduced legal uncertainty in producing and financing housing, real estate markets in Brazil experienced unprecedented development and this extended to housing markets in São Paulo’s city centre.
To give an idea of the scale of the housing market boom, the median price of new residential units in São Paulo rose 184% from 2000 to 2010, some 94% higher than the cumulative inflation during that decade. 4 At the same time, the total number of vacant units decreased from 674,847 in 2000 to 476,112 in 2010. Because the total number of households increased by 22% during the decade while the population grew 10%, we can infer that there was a pent-up demand for new homes.
In the historic city centre, the decrease in vacant units was larger: from 38,604 in 2000 to 21,964 in 2010, a 43% decrease. Accordingly, the increase in the price of new units was higher, 342%, mainly because of price increases in the last year, 2010. The overall results of the dramatic recent developments in real estate markets were incapable of considerably changing the unequal spatial features of São Paulo, which we summarise below.
Starting with the location of income groups, the choropleth map of 2010 shows the average income of household heads (Figure 1), including a concentration of high values to the southwest of the historical city centre. It also provides evidence of other high-income areas on the city’s outskirts, which correspond to clusters of gated communities. Otherwise, low-income families mainly occupy suburbs. We can also see that the historical city centre is in an intermediate situation and is not one of the most valued regions.

Average head of household income choropleth map (Brazilian reais, 2010). The original map of enumeration districts is ‘masked’ by an urbanised area map.
The spatial distribution of housing developments by age is described in Figure 2. Here we can see that, up to 7 km from the centre, frequencies increase with distance and units built from 1985 to 1999 are more frequent than newer units. In contrast, from 13 km outwards an opposite pattern is found. Thus, the map indicates that the city has experienced a clear process of urban sprawl from 1985 to 2011.

Kernel density estimation of new housing units’ distance to historic city centre. Grouped by starting year.
It is worth noting that a large part of the housing stock in the city centre was built before 1985. Data on new developments indicate that from 1985 to 2010, 44,143 new units were built in the centre. Because the total number of properties in the region was around half a million by 2010, the stock has not been substantially expanded.
Finally, we note that despite its ongoing regeneration challenges, the city centre does have an above average transport infrastructure relative to suburban areas. As shown in Table 1, the historical city centre has the lowest ratio of residents with commuting times longer than 30 minutes or longer than one hour.
Population commuting more than 30 and 60 minutes according to rings of distance from the historical city centre.

Source: 2010 IBGE Census sample.
Empirical model of vacancy determinants
To estimate the determinants of vacancy rates we follow the hedonic modelling approach. Hedonic modelling has been widely used in real estate empirical applications. In this section we briefly describe hedonic price modelling and present how we apply it to the determinants of vacancy rates, highlighting its potential limitations.
As properties are normally fixed in space, their physical characteristics and location attributes are inseparable. There is a large number of possible combinations of characteristics, which makes comparison between two properties difficult. However, housing markets make consumers’ preferences explicit and rank properties through their prices. Rosen (1974) describes the housing market as a hedonic market. Hedonic regression links the price of a property to its attributes. The estimated coefficients of these attributes are their hedonic prices.
Studies by Rosen and Smith (1983) and Gabriel and Nothaft (2001) use the variations in vacancy rates and prices across cities and time to estimate a natural vacancy rate for each city, or the rate at which prices do not change. In this paper we adopt a different approach: we do not estimate the natural vacancy rate. We focus on explaining the vacancy distribution within the SPMA. Our methodology is similar to hedonic modelling; we try to explain vacancy variations using differences in housing and neighbourhood features within a city.
Hedonic modelling is valid because our regression is implicitly a hedonic price equation. However, our unit of analysis is not the house, it is the group of houses in a district. Hence, the estimated equation is similar to an average hedonic price equation. We then use vacancy rates as a substitute for prices (as the dependent variable). Vacancy rates are not an element of traditional hedonic modelling, perhaps because they can only be a feature of a group of properties and never an attribute of a unit of housing.
According to Wheaton and Torto (1994), there is a simultaneous relationship between vacancies and prices. Time on the market depends upon the number of vacant units and the number of consumers interested in them, which in turn depends on consumers’ preferences and mobility. One important feature of the housing market is the flow of consumers entering and exiting the market. To control for this, they create a variable called absorption (the net flow of consumers). They propose the following model of price/rent adjustment:

where

In this paper we choose the potential vacancy determinants to be tested empirically, following the Wheaton and Torto model. Among them are price factors, such as building characteristics, accessibility and the quality of the neighbourhood amenities; the determinants of supply adjusting speed; the determinants of new residents’ entrance; and the determinants of family mobility.
The assumption of a segmented market is tested for the historical city centre submarket, where we test whether the parameters are significantly different when compared with other areas of the city. The equilibrium price for the historic city centre could be different from the rest of the city, and following Wheaton and Torto (1994), the effect of vacancies on equilibrium prices could also be different in the city centre.
With that in mind, we make use of the panel structure of the data, including dummy variables for observations belonging to the centre as well as their interaction with the explanatory variables.
We also adopt spatial econometric methods because of potential spatial dependence and spatial externalities. One of the major issues in the estimation of hedonic housing models concerns unobservable variables of location amenities, which may or may not support the choice of the spatial structure.
In our cross-section regressions, we use a spatial method of moments (general spatial two stage least squares) estimator proposed by Kelejian and Prucha (2010). The model assumes that dependent variable Y is correlated to its neighbours through λ, the correlation coefficient between Y(n×1) and W(n×n). Y(n×1), and the disturbances u are correlated to neighbours through ρ. The spatial weights matrix is defined by ‘queen’ contiguity of order one, and the model structure includes spatial lags as follows:

For the panel estimation, we extend the model to a random effects panel, without the spatial lag of the dependent variable, following Kapoor et al. (2007). The observations for the years 2000 and 2010 are stacked, and it is assumed that the disturbances u are the sum of the spatial auto-correlation effect, a time-invariant effect,

Its variance-covariance matrix has two components,
Data and spatial patterns
Data
We use the Brazilian Population Census as our main source of information. Our unit of analysis is the district, a submunicipality area with an average of 200 housing units. We used a district panel for the years 2000 and 2010, totalling 21,594 observations.
The Census includes all households and therefore produces information about vacant units. The vacancy rate is the proportion of vacant dwellings among all residential units of a given stock. There is no distinction between units that are offered on the market and those that are not. We note that the features of the districts’ housing stock are based on the occupied housing units only, where residents were available to the census interviewers.
Nevertheless, completely vacant buildings are not frequent in our sample, and the occupied apartment units provide information with respect to the features of vacant units in our database. In 2010, half of the districts had no apartments, and the vacancy rate of these was 5.81%, while districts with apartments had a vacancy rate of 8.38%.
It is important to note that a dedicated survey was conducted in specific areas of the historic centre – the two most central and older districts – to map the totally empty buildings in the area. Of the 158 closed buildings identified, only 25 had residential functions. 5 However, the vacancy rate for that area, according to the Census data, is one of the highest in the city, 11.7% in 2010, indicating that vacant housing units are spread out among partially occupied buildings.
Many of the explanatory variables are proportions: the proportion of dwellings presenting a specific feature with respect to the total number of dwellings in the spatial unit, or the proportion of families with a certain feature with respect to the total number of families. Two features are measured in terms of inequality: the head of household’s income and the number of bathrooms. These allow us to capture the heterogeneity of residents and the heterogeneity of housing quality.
Micro data were not available at the district level, so these inequality indexes were calculated from grouped data for income ranges and grouped data for total number-of-bathrooms ranges. We assume that inequality of income within each range is zero. Thus, we observe the lower bound of the true Gini index. If the ranges are too wide, Gini will be underestimated. We use this lower Gini-bound formal definition from Kakwani (1980) for income distribution:

where T+1 is the income class, ft is the relative frequency of the tth income class and qt is the cumulative proportion of income received by the households in each income class. It is derived from a geometric approach that assumes that the true Lorenz curve is the connection of the interval limit values. Similar to the original Gini coefficient, this measure assumes values between 0 and 1, with higher levels indicating more inequality.
Spatial patterns
It is crucial to identify the specific features of a spatial subset of the data, the city centre. Moreover, understanding the specific pattern of high vacancies in the city centre is one of our key motivations. We thus engage with exploratory spatial data analysis (ESDA) to check for the existence of such a pattern.
Starting with tests of spatial auto-correlation, for the vacancy rate the global Moran’s I test statistic is 0.3 for the year 2010 and 0.2 for the year 2000, both significant at a 1% level, using a ‘queen’ first order contiguity weights matrix. This spatial dependence falls considerably in higher orders of neighbours, reaching, for example, 0.16 in the fourth order for 2010. Considering that spill over effects due to quality of housing do not go too far, it is seems reasonable to use the first order of neighbours.
The spatial pattern of high vacancies in the city centre is verified in Figure 3(a), a local Moran’s I map of the year 2000. There is a concentration of high-high clusters in the historic city centre, and scattered low value clusters in the suburbs.

Local Moran’s I map of vacancy rate clusters (a) 2000, and (b) 2010. The original map of enumeration districts’‘clusters’ of high and low values is ‘masked’ by an urbanised area map.
As shown in Figure 3(b), for the year 2010, vacancies are high in a central region that goes far beyond the historic city centre. This concentration of high-high clusters is surrounded by low-low clusters. Although the spatial patterns in both years have changed, both of them indicate high vacancies in more central locations.
The larger high vacancies cluster of 2010 aggregates different neighbourhoods. However, there is a difference in the behaviour of the centre. The vacancy rate fell for more than 75% of the spatial units. On average, this rate fell 4.3% more in the city centre. The difference in the vacancy rate between the centre and the rest of the region fell from 7.3% in 2000 to 3% in 2010. Together with the clearer pattern of 2000, this is why we analyse the city centre separately from the rest of the 2010 high vacancies clusters.
Estimation results
Equation (3) was estimated separately for the historic city centre and the rest of the SPMA in the years 2000 and 2010. 6 Next, we tested different coefficients and intercepts for the centre, estimating the spatial panel regression. 7 This was performed through the inclusion of interaction terms between the variables and the dummy variable indicating the centre. Equation (6) shows this inclusion:

where
Residential vacancy determinants for SPMA and historic city centre.
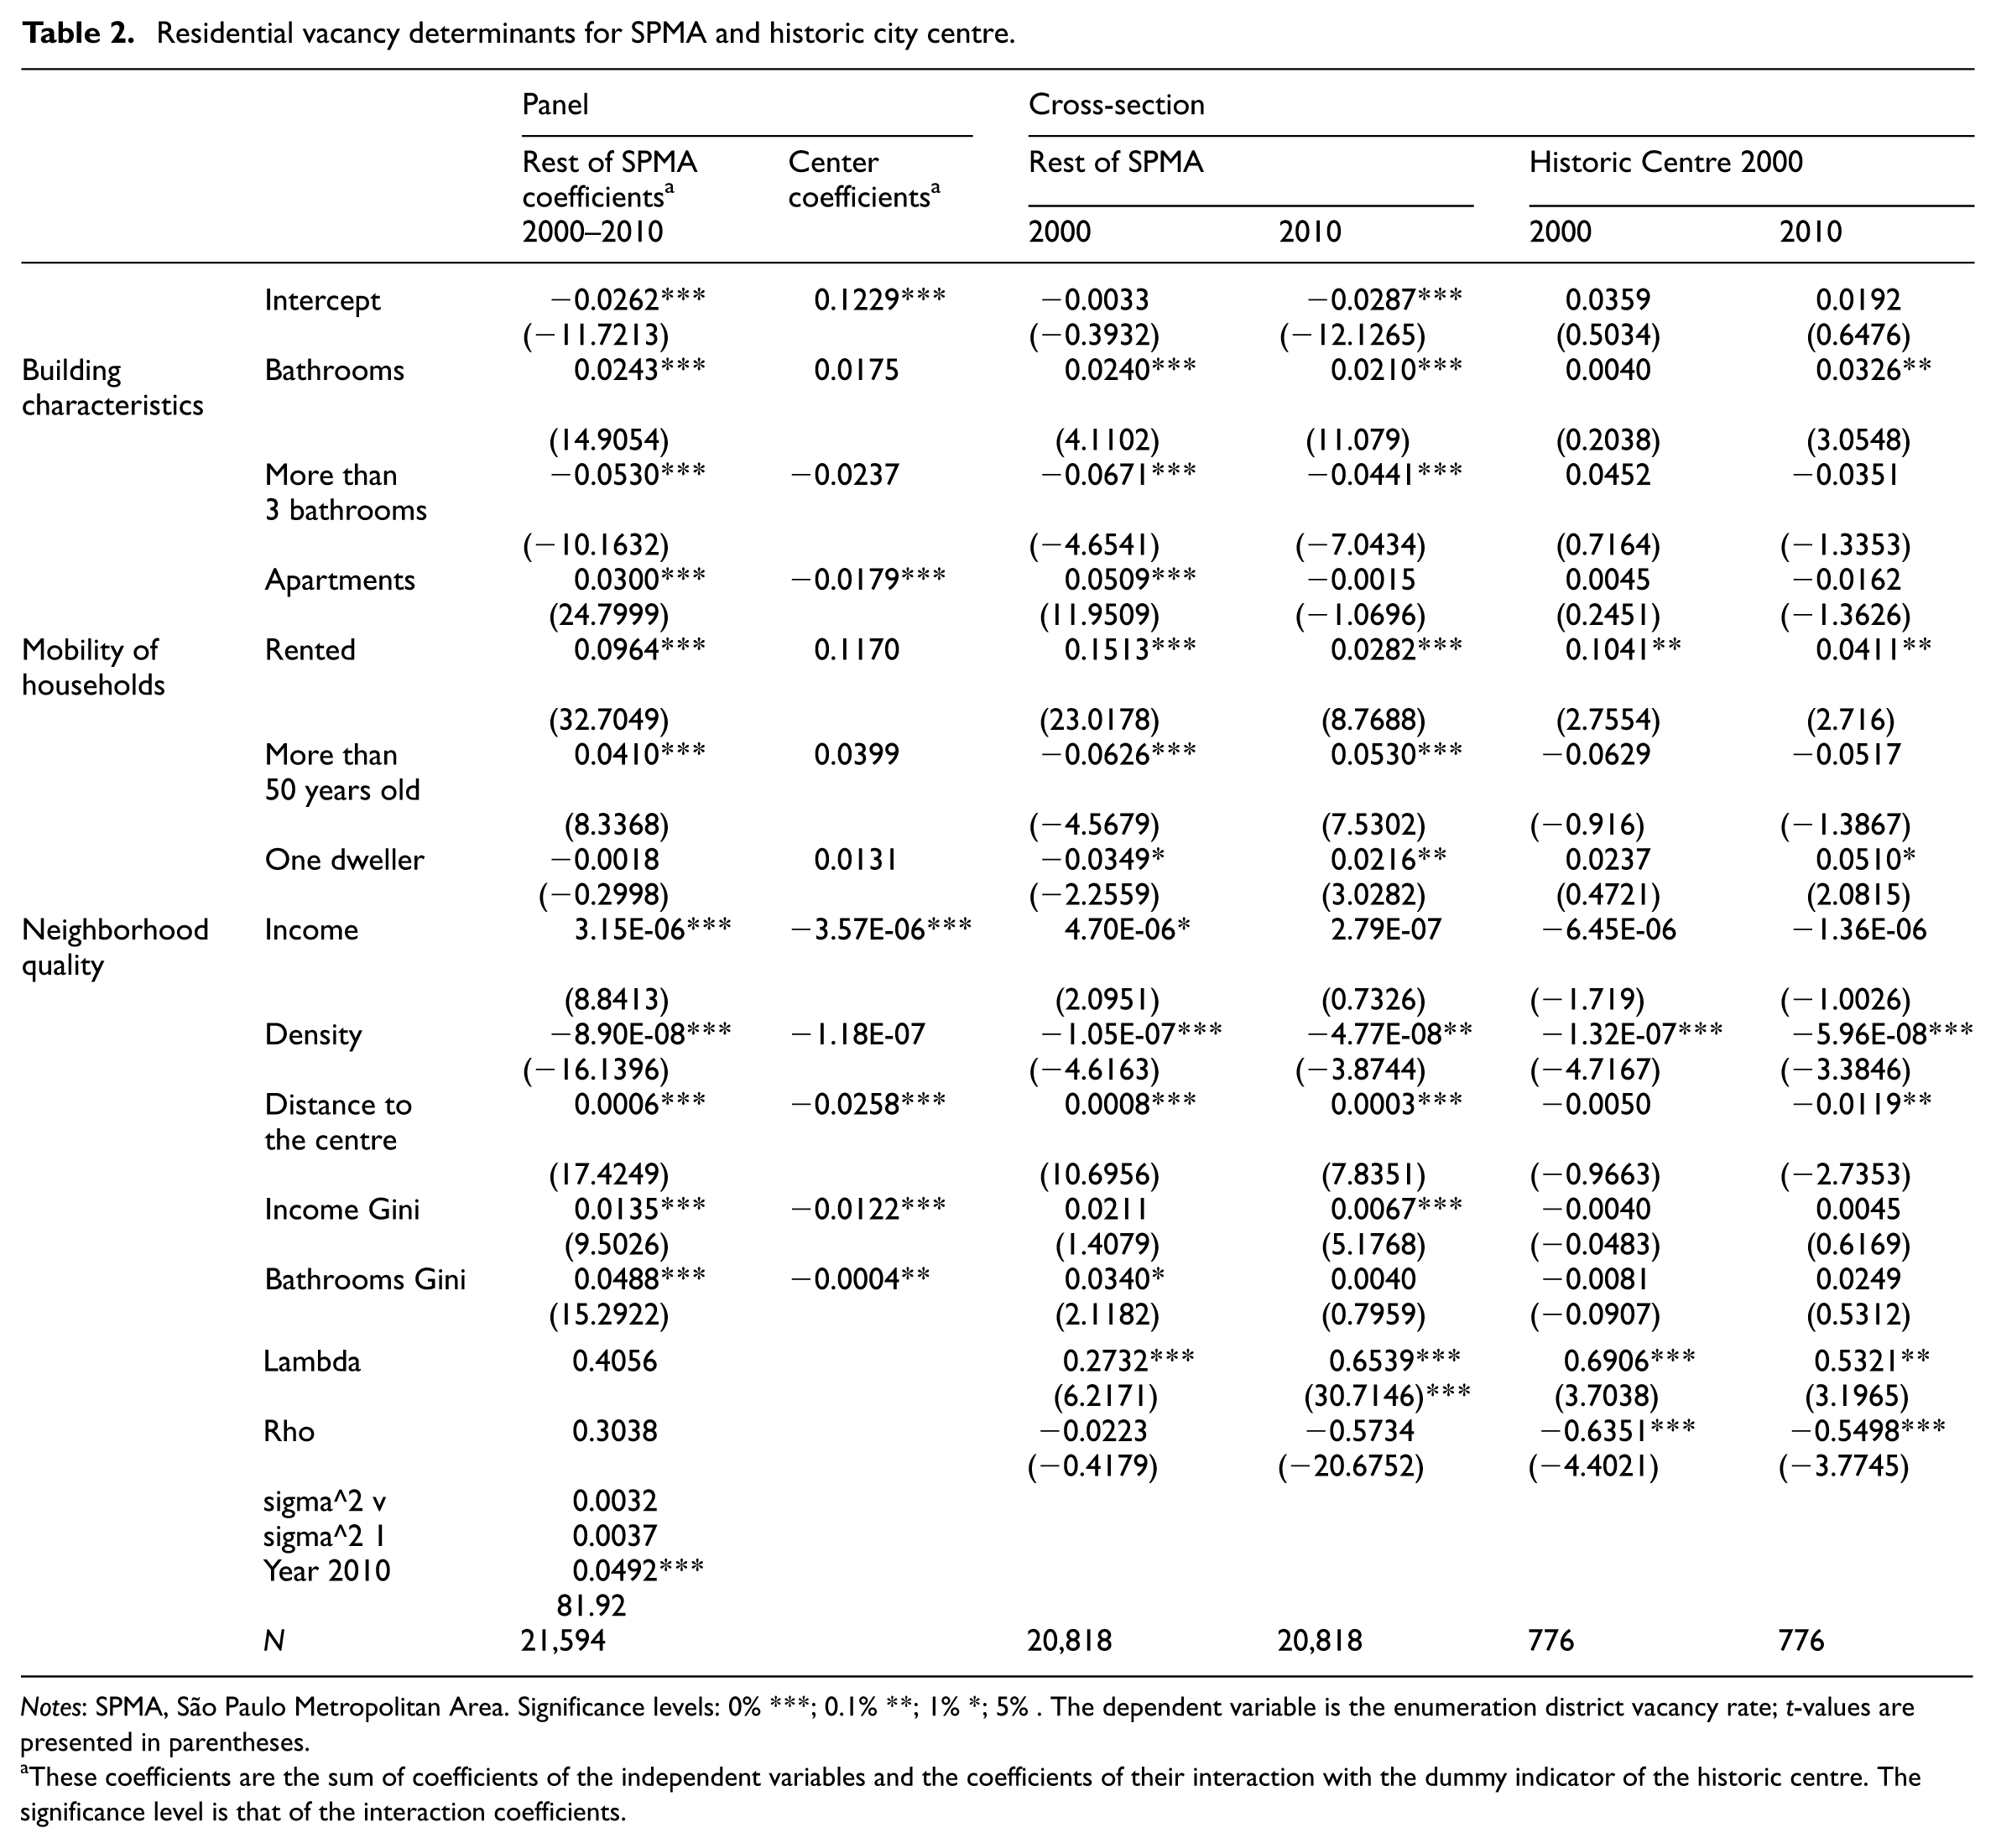
Notes: SPMA, São Paulo Metropolitan Area. Significance levels: 0% ***; 0.1% **; 1% *; 5% . The dependent variable is the enumeration district vacancy rate; t-values are presented in parentheses.
These coefficients are the sum of coefficients of the independent variables and the coefficients of their interaction with the dummy indicator of the historic centre. The significance level is that of the interaction coefficients.
We can group the vacancy determinants into three groups: building characteristics, mobility of households and neighbourhood quality. Starting with building characteristics, the average number of bathrooms and the proportion of units with more than three bathrooms explicitly measure the quality of housing. The results suggest that a higher average number of bathrooms implies higher vacancy. However, when other factors are held constant, higher quality units are chosen first. Then, in neighbourhoods with units with more bathrooms, fewer vacancies are expected. Hence we suspect that some mechanisms of adjustment towards the equilibrium are failing. Still, the proportion of units with more than three bathrooms is decreasing vacancy, working in the expected direction.
Moreover, the proportion of apartments in the stock has a positive impact on the vacancy rate. Apartment buildings are more difficult to rebuild than houses. They also rarely change their function. Therefore, their supply is more inelastic to changes in demand. The slower the adjustment of supply, the higher the vacancy rate.
However, variables measuring the mobility of residents directly affect the natural vacancy rate when the market is at equilibrium prices. For instance, a rented unit is likely to be vacant more frequently because it normally changes occupancy more frequently than an owned unit. The expected positive signal of the rented variable is confirmed by our regression.
In regard to neighbourhood quality, good quality neighbourhoods should have fewer vacancies, keeping the other attributes constant. Our results show that average income, density and distance to the city centre are significant determinants of vacancy connected to neighbourhood attributes.
Distance to the centre is confirmed as a negative factor. Indeed, it has been described previously as a negative attribute in the case of São Paulo. Moreover, in theory, higher average income is an appreciated neighbourhood amenity. However, the results show that average income does not contribute to decrease vacancy levels. We would argue that this result is consistent with that regarding the average number of bathrooms, which suggests higher friction in price adjustments in neighbourhoods with wealthier residents.
Population density is also a district feature. It seems to generate positive externalities, which might cause the neighbourhood to be more appealing. Additionally, greater densities make the matching process easier, lowering natural vacancy levels. Then, a positive determinant is expected, but in São Paulo we found a negative one.
Finally, we consider two determinants also influencing this matching process. The Gini coefficient of the number of bathrooms is a proxy for the heterogeneity of stock quality and the Gini of the head of household’s income is a proxy for demand heterogeneity. The more heterogeneity there is, the more difficult the matching process is. More time spent in the searching process leads to higher vacancy rates. These two variables corroborate this theory because the signs of their estimated impacts are positive.
In summary, most of variables have the expected impact on vacancy rates. However, there are some unexpected results, such as the negative effect of housing quality and income level on vacancies. These results suggest that adjustment frictions and the consequent mismatch between demand and supply play an important role in the market.
Determinants for the historic city centre
Testing whether vacancy determinants are different for the historic city centre is a key goal of this paper. The second column of Table 2 depicts the results of the panel data estimation. It shows that the historic city centre is a separate submarket.
The intercept is different, indicating a higher level of vacancy in the centre. The impact of the proportion of apartments on vacancy is negative in the city centre, while in the whole urban area it is positive. The natural increase of inelasticity of supply in apartments is compensated by another effect, probably of better valuation compared with houses because multistorey buildings are younger structures. The average income indicates that higher income areas inside the centre have lower vacancies. This determinant of vacancy has the opposite sign than that of the whole of São Paulo. The impact of the distance to the city centre suggests that areas closer to the border of the centre have lower vacancies. Conversely, areas closer to the periphery of the city have more vacancies. In fact, areas closer to the centre’s border concentrate fewer derelict buildings, whereas the periphery of the city is mainly poor. In addition, towards its southwest border, the centre has well valued areas as its neighbours. Compared with the whole city, the Gini coefficients of income and the number of bathrooms have a negative impact on vacancy. In the centre, heterogeneity is not slowing the matching process. The demand may also be more heterogeneous in this area, and the more heterogeneous stock implies lower vacancy.
Additionally, the cross-section estimation that only included city centre districts also suggests that the centre is a separate submarket. For instance, compared with the estimated coefficients of the rest of the SPMA cross section regressions, the distance to the centre for the year 2010 coefficient shows a different sign.
Concluding remarks
In this paper, we empirically investigate the determinants of residential vacancy rates in the SPMA, with a particular interest in São Paulo’s city centre. Combining hedonic modelling with spatial econometrics, we find evidence of three main groups of determinants: individual building characteristics, mobility of households and neighbourhood quality. These findings are in line with the previous literature on vacancy rates and urban economics.
The empirical vacancy determinants indicate ways in which policy makers could interfere to change market conditions and improve the provision of good quality housing. In general, one might think of policies that aim to reduce the natural vacancy rate or, alternatively, measures with the objective of correcting upward deviations from the natural vacancy level. For instance, the enforcement of laws that punish owners for keeping units vacant can influence and expedite the price adjustment process.
We find evidence that the historic central city is a distinctive submarket and its determinants work differently when compared with the housing markets of other areas across the SPMA.
We believe our results indicate that the methodology adopted in this paper is promising and has the potential to be applied to other metropolitan areas that need to provide housing and have excess vacancies with good urban amenities in the city centre. In Brazil, this is the situation of Fortaleza and Recife.
Nonetheless, we also acknowledge that this study is subject to potential limitations because of the lack of important controls such as housing age, price and rent levels and dynamics. We also see room for improvement in the theory underpinning the empirical analysis. Here we would welcome models that could point to observable variables with the potential of capturing deviations from equilibrium prices/rents and, particularly, deviations from natural vacancy rates.
Footnotes
Funding
This research was funded by a Brazilian National Council for Research, CNPQ, doctorate scholarship.