
Abstract
Urban parks and public transport are indispensable elements of a compact megacity for their environmental and social values. However, few measures of urban park accessibility have considered the public transport travel mode. Based on the framework of geographic information systems (GIS) network analysis, this study proposes an innovative method to incorporate public transport travel mode into urban park accessibility evaluations. Taking Shanghai, China, as the study area, we measured home to park and park from home travel times on multi-modal transport networks, calculated the accessibilities by multiple equations, and compared accessibilities for different districts. These methods extend current accessibility measures by calculating accessibility at a realistic level, and provide a measure of public transport service for urban parks. The results for Shanghai show that approximately 99.95% of home to park routes might include public transport. The distribution of home to park public transport accessibility of the city was uneven. The patches with best accessibility tend to be distributed in the built-up area in the city centre. Public transport access to urban parks is inhomogeneous for different districts, because of urban park locations, road network characteristics, and uneven public transport supply. The distribution of park from home public transport accessibility has no significant correlation with district development stage. Public transport service in Shanghai takes no account of the factors of park star rating or size. Positive actions are required to improve the equity of public transport access to the important public health resources of urban parks.
Introduction
Urban parks are indispensable elements of a compact megacity for their crucial environmental (Chiesura, 2004; Liang et al., 2017) and social functions (Van Dillen et al., 2012). In particular, they provide citizens with open-air physical activity spaces for aesthetic (Barbosa et al., 2007), psychological (Germann-Chiari and Seeland, 2004), restorative (Ulrich, 1984), and recreational functions (Takano et al., 2002). To experience the benefits of activities in urban parks, citizens must have reasonable access to these resources (Reyes et al., 2014). Geographical accessibility assessment is the starting point for investigating land utilisation (Kang, 2015). Increasing car usage and dependence has resulted in negative effects on physical (Paulley et al., 2006) and environmental health (Gorham et al., 2002; Shannon et al., 2006), and public transport modes are becoming more important (Costa and Markellos, 1997; Hensher, 2007). Reasonable public transport access to urban parks is essential and should be considered for the sustainable development of cities, especially compact megacities. Shanghai, the largest and most densely populated city in China, has limited urban parks and well developed public transportation. There is a great need to assess the public transport service to urban parks on the basis of accessibility for citizens in the compact megacity of Shanghai.
Citizens usually go to parks directly from their residence (McCormack et al., 2010). Home to park public transport access is influenced by factors such as road layout, traffic conditions (Cutts et al., 2009), arrangement of public transport routes and stops, residence location (La Rosa, 2014), and park distribution and attraction (Kaczynski et al., 2008; Talen, 1997). Urban parks with convenient public transport service and shorter distance are preferred (Hörnsten and Fredman, 2000), and the attractiveness of a public open space is associated with the probability of a high level of access (Giles-Corti et al., 2005). Citizens might also like to visit more distant urban parks that have more attractions. For the current study, the factor of elevation height need not be considered as Shanghai is located on a plain.
Many previous studies have focused on assessing accessibility to urban green spaces or urban parks. Some studies conducted access measurement via simple radius buffering method (Moseley et al., 2013; Nicholls and Shafer, 2001; Potestio et al., 2009; Richardson et al., 2010). This method is straightforward and often used in early studies, but encounters three main issues: (1) citizens may not go to the closest green space or park for various reasons, such as its size, attractiveness, or socialising with friends; (2) it neglects the spatial distribution of green spaces or urban parks; (3) it ignores accessibility of realistic access routes. Some studies used gravity models to assess accessibility with the distance from each neighbourhood to each green space as travel friction (Hillsdon et al., 2006; Li et al., 2005). This method may address the first issue, but the others remain unsolved. As the focus on geographical accessibility increased, Euclidean, Manhattan, and vector-based road network distances have been used for calculating accessibility measures (Apparicio et al., 2008; Higgs et al., 2012). Some studies incorporated statistical analysis of trip length on the basis of survey data and simple Euclidean distance (Coombes et al., 2010; Dai, 2011; Kessel et al., 2009). These methods address the first and second issues, but the third remains unsolved. To address the three main issues, some studies used vector-based road network distance, which is significantly more precise than Euclidean or Manhattan, to assess accessibility (La Rosa, 2014; Sander et al., 2010). With the development of geographic information systems (GIS) network analysis modules, more advanced methods for vector-based road network distance evaluations were applied and integrated with urban landscape characteristics (Comber et al., 2008; Kuta et al., 2014; Nicholls, 2001; Oh and Jeong, 2007; Talen and Anselin, 1998). However, these GIS network analysis methods fail to include accessibility by public transport mode and encounter some new issues, such as access from different neighbourhoods to the same green space, and the park size may not sufficient to include complex options citizen choosing which park. None of the previous studies have addressed all of the issues above. GIS network analysis methods could be used and combined with suitable calculation methods to assess the public transport accessibility to urban parks or green spaces and tackle the issues above. The interactions of different parks and neighbourhoods and complex destination selection factors are required to be considered. Citizens may choose a park because of its attractiveness. Some previous studies considered accessibility by public transport mode (Lee, 2005; Mao and Nekorchuk, 2013; Mavoa et al., 2012; O’Sullivan et al., 2000; Widener et al., 2015; Yigitcanlar et al., 2007), but these studies were all focused on public health functional destinations, rather than urban parks or urban green spaces.
Shanghai has relatively low car ownership owing to a long period of strong regulatory controls including a quota system on registrations, high public transport supply and strong ridership and mode share. Thus, Shanghai is a good case study to explore public transport access to parks. To bridge this gap in the body of knowledge of public transport access to urban parks, we used GIS to measure home to park public transport accessibility for the compact megacity of Shanghai. Our objectives were to: (1) provide a new approach for assessing accessibility by public transport to urban parks; (2) assess the arrangement and supply of public transport to urban parks in the compact megacity of Shanghai on the basis of accessibility via multiple transportation modes, such as rail transits, buses and ferries; (3) assist planners and policy makers to develop intervention programmes for planning, construction, and development of the compact megacity of Shanghai.
Materials and methods
Study area
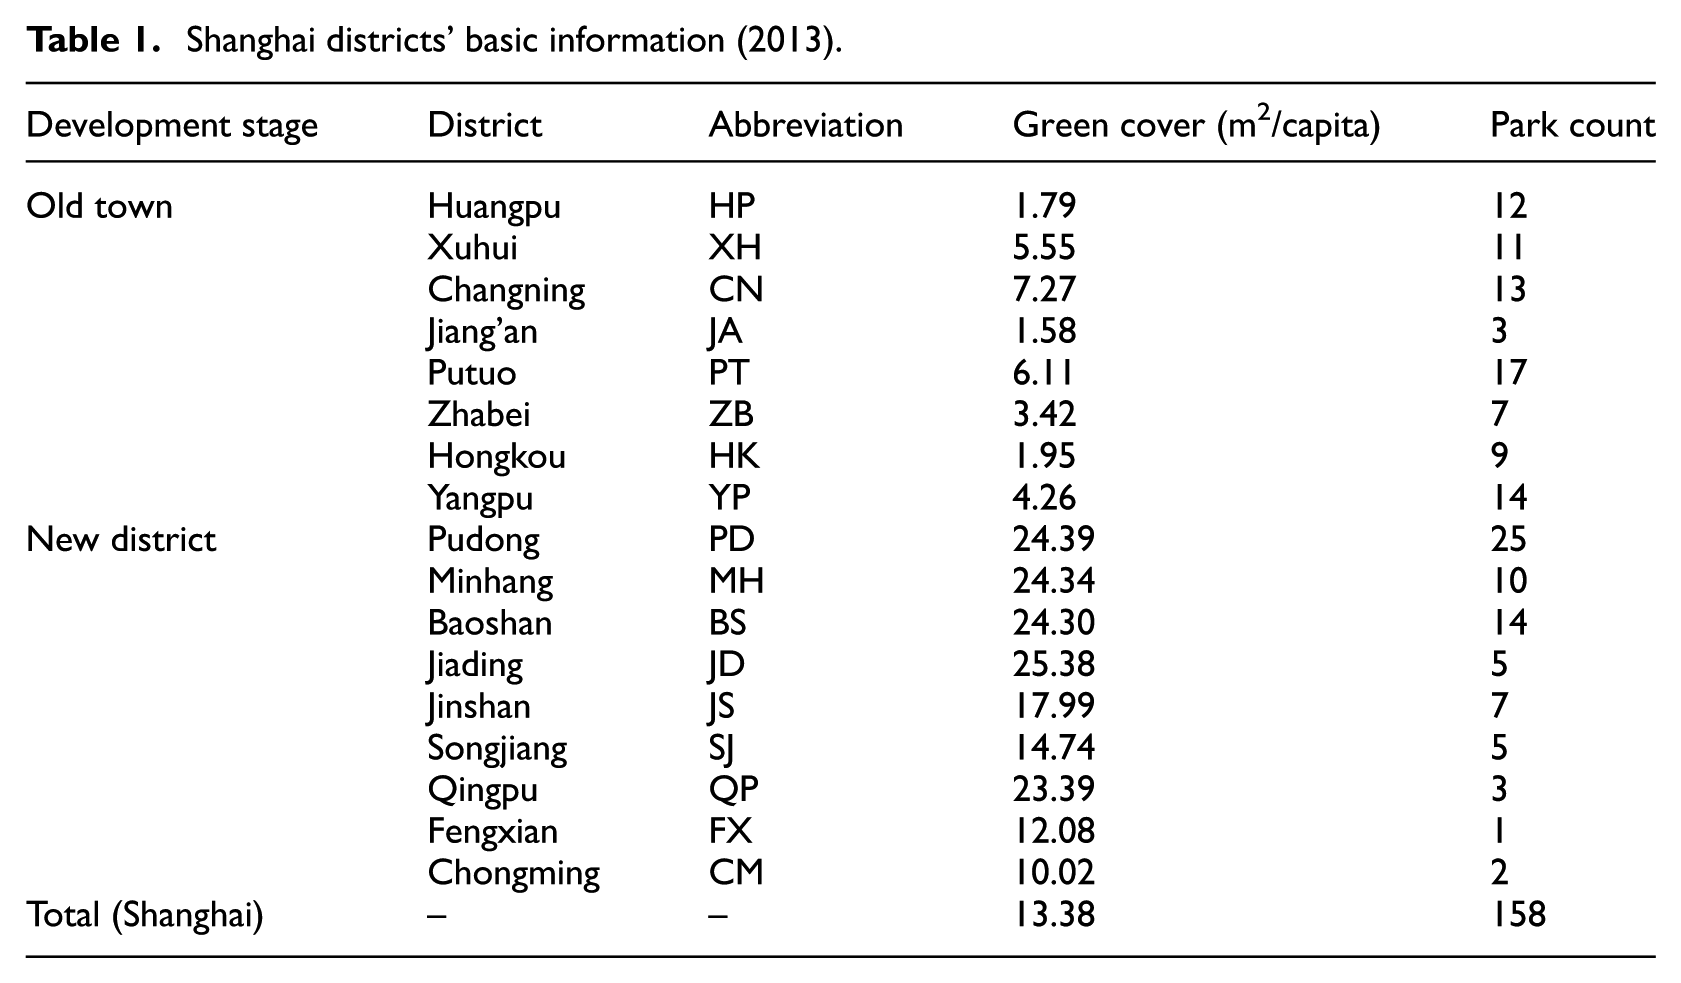
The study area centres on the city of Shanghai (121°50′E, 31°40′N), which is the largest and most densely populated city in China (Figure 1). Covering an area of 634,050 ha, it has 17 districts, including eight old and nine new towns (Table 1). The population density of Shanghai was 13,400 people per km2 in 2010, almost 1.6 that of New York and 2.8 that of London (Wang et al., 2012). After the Shanghai World Expo in 2010, the green ratio of the city and its built-up area exceeded 20% and 37%, respectively. The per capita green cover of the city was 13.38 m2 in 2014, which, compared with other cities in the world, is much less than adequate (Fuller and Gaston, 2009). As a congested and compact city with meagre ground urban green space, it is essential to enhance the usage efficiency of Shanghai’s urban green space. Along with the city’s rapid urbanisation and economic development, both urban park and public transit in Shanghai had great development. In Shanghai, there were 40 public transit lines in the early 1950s and more than 1300 public transit lines in 2014. From 1995 to 1999, 23 new urban parks covering 293.9 ha were built. In spite of fast development, urban parks in Shanghai are still limited. Until 2014, there were 161 urban parks covering 2240.39 ha, only about 0.35% of its city area.
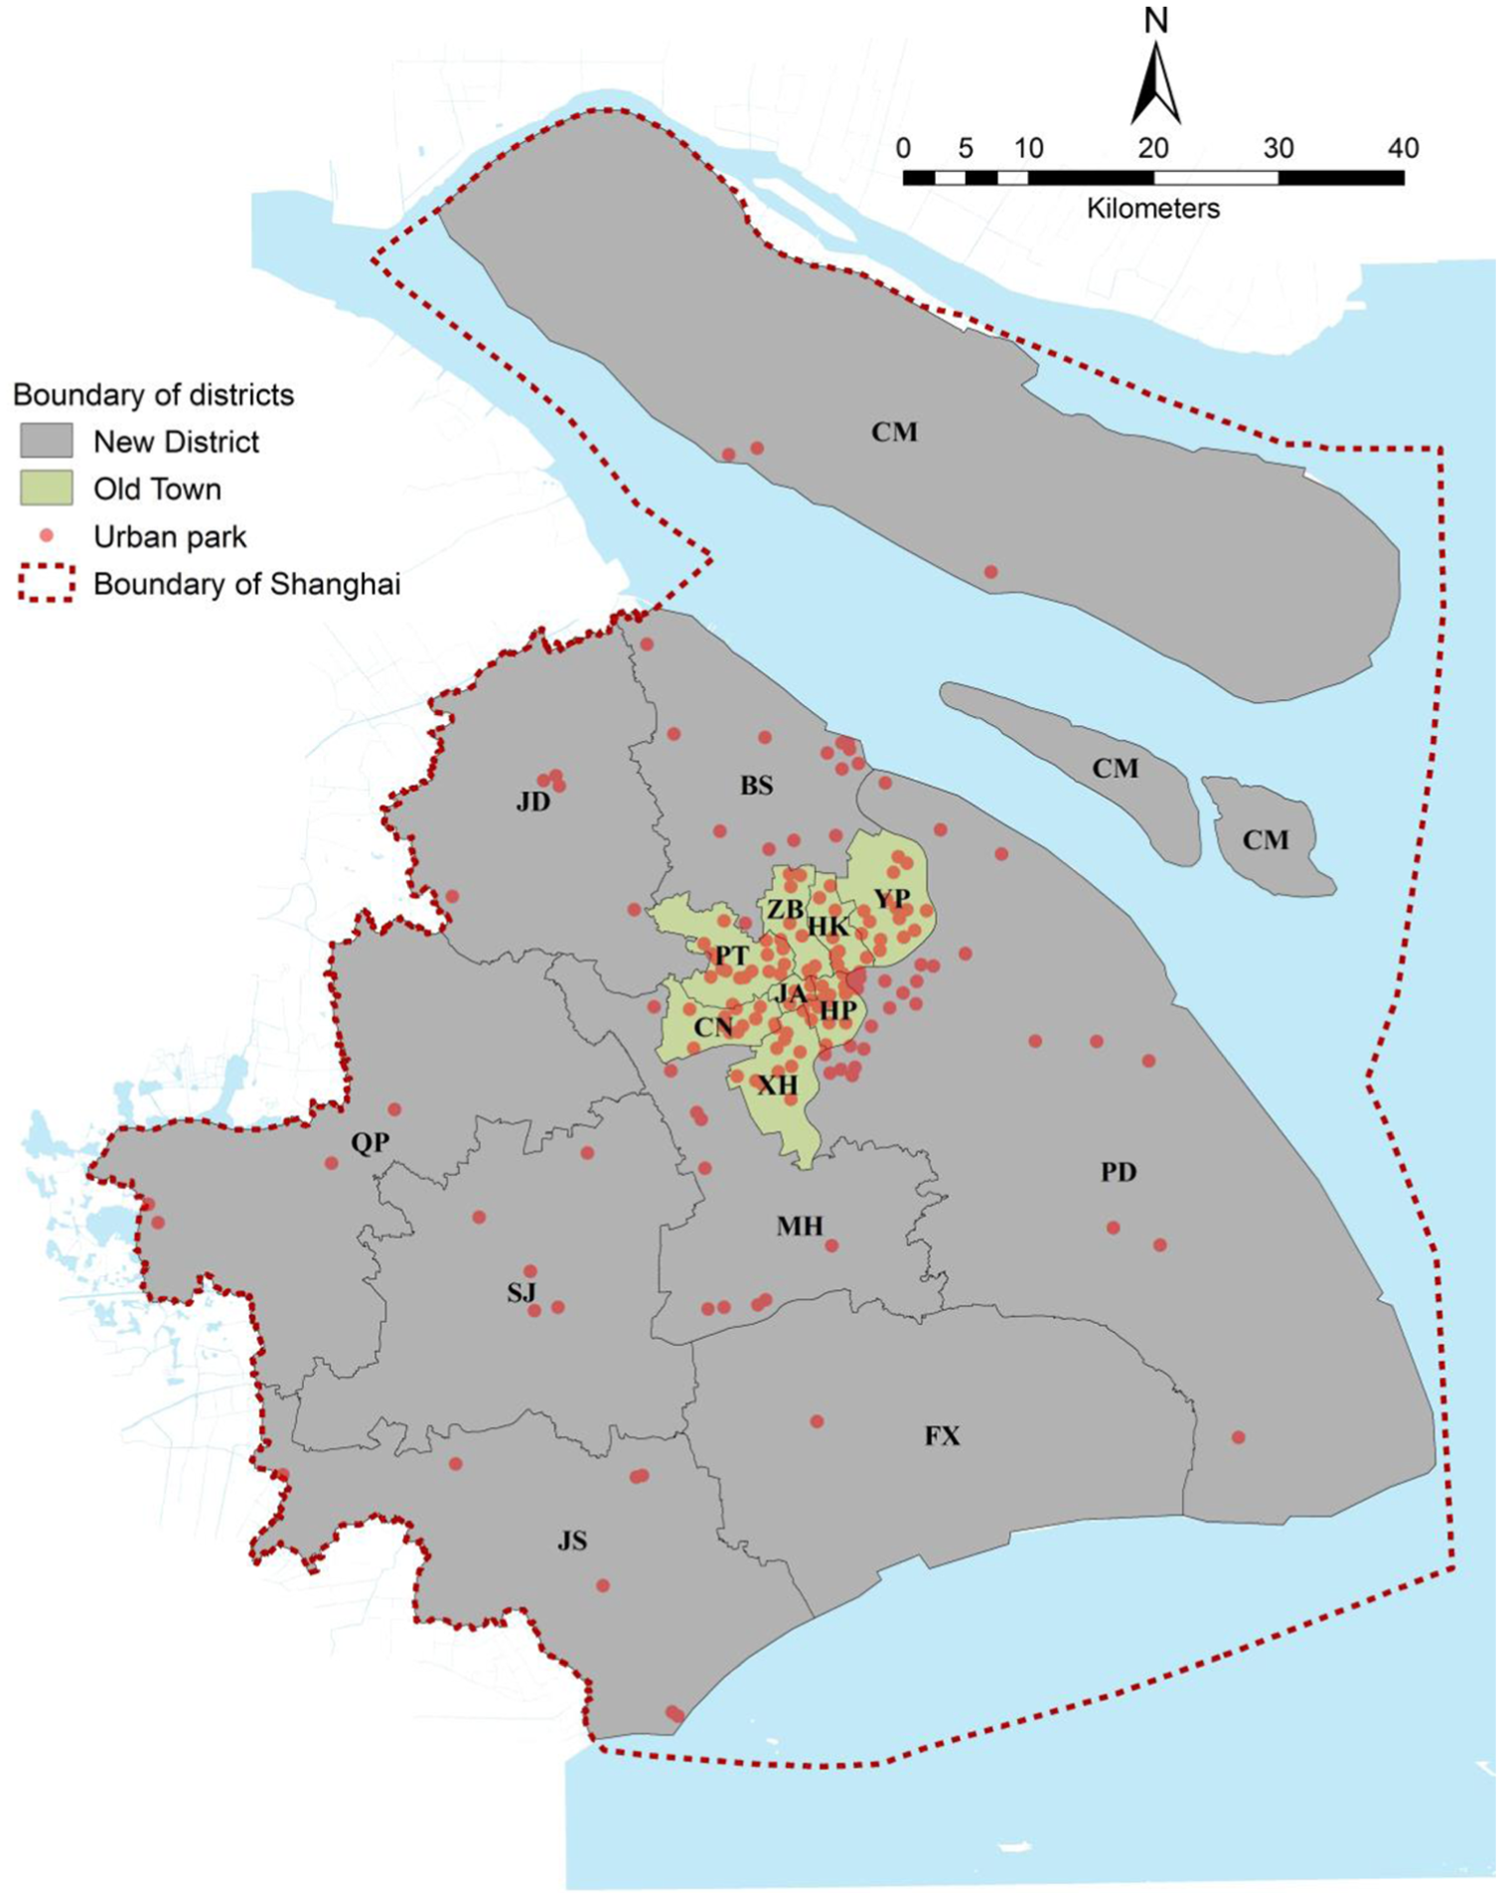
Study area.
Shanghai districts’ basic information (2013).
Data preparation
Our research focused on Shanghai’s publically accessible parks. Park data was sourced from the official website of Shanghai Administration Department of Afforestation and City Appearance (http://lhsr.sh.gov.cn/). The list of urban parks in Shanghai and their various characteristics are published annually. For this study, we used data from the end of 2014, which listed 161 public urban parks in Shanghai, distributed as shown in Figure 1.
The Shanghai Administration Department of Afforestation and City Appearance organise and publicise star ratings (i.e. 5, 4, 3, 2, and 1) for the parks in Shanghai every year. The standards for park rating (http://lhsr.sh.gov.cn/) were studied, written and amended by professionals on the basis of public consultation. The factors considered in the standards for park rating, such as Shanghai park classification, area, visitor numbers, facilities, security, service, landscape and scenic, maintenance and management, were rational and comprehensive. On the basis of a large survey via varieties of ways and methods, the park rating in Shanghai was on the focus of citizen’s concern and on the basis of actual situation. The star rating of urban parks might not reflect all aspects of park attractions, but it includes the general factors that concerned citizens, and is by far the most reliable, convincing and important evaluation to directly indicate park attractions to citizens and travellers, and partly determines visit options. The Accessible Natural Greenspace Standards (ANGS) (Handley and Nature, 2003) classified parks in Shanghai by size for four categories: R1 (0–2 ha), R2 (2–20 ha), R3 (20–100 ha), and R4 (100–500 ha). Shanghai parks’ star rating and area rank are summarised in Figure S1 (available online).
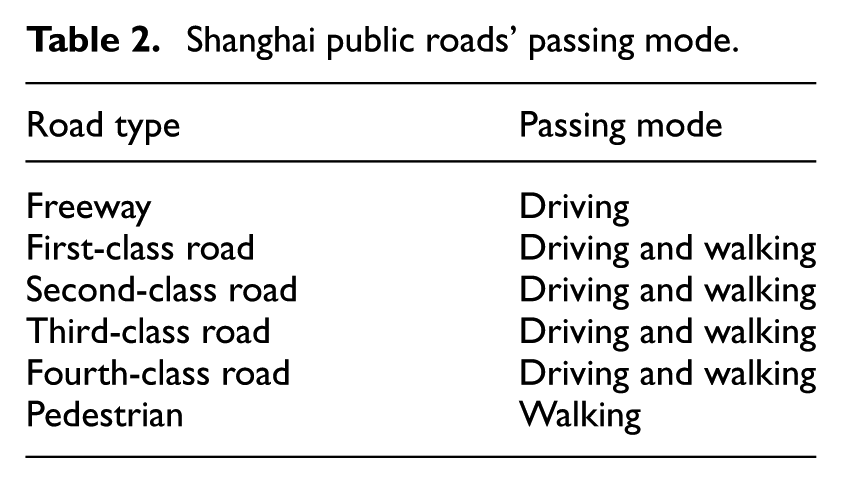
Transportation data for 2014 were compiled and purchased from the government (http://www.jt.sh.cn/export/), including road and public transport digital maps. The Shanghai public road and public transport networks are shown in Figure S2 (available online). The public road network contains six road types, as shown in Table 2. Public transport is the transportation of people by means of buses, trains, or other vehicles running on fixed routes (Collins Dictionary, 2000); public transport refers to bus, rail transit and ferry in this research. The public transport data for buses, rail transits, and ferries included transport stops, routes, and schedules. Since trips to urban parks are usually during daytime, our study focused on daytime public transport routes. Details of the more than 1400 public transport routes used in this study are summarised in Table 3.
Shanghai public roads’ passing mode.
Shanghai districts’ basic information.

As well as park and transportation data, other data were compiled from a number of key sources, purchased from the government (http://ngcc.sbsm.gov.cn/), including satellite images (resolution of 0.5 m × 0.5 m, taken in 2015) and digital maps of district boundary, park and community. Field trips for parks and public transport condition in Shanghai were performed in May 2015 to check and validate the compiled data, and the data were subsequently input to ArcGIS (10.2 Esri) software for geo-referencing and digitising.
This study uses spatial data, the network analysis toolbox in ArcGIS, and multilevel models to obtain the spatial accessibility from home to urban park via public transport to assess the public transport service to urban parks. The research methodology is illustrated in Figure 2. GIS network analysis was employed to calculate the distance or travel time of the shortest network path from site access points and provide the actual routes of site catchment. After digitising, the road and public transport data were edited as components to create a multi-modal transport network. The multi-modal transport network combines the networks of walking streets and roads and public transport, using travel time and distance as network impedances. The walk travel time for each street segment was calculated by the length of the street segment and walking speed 1.2 m/s, based on field observations of walking speeds in China (Yang et al., 2006). Public transport travel time for each route segment was calculated using the length of the route segment and the speed for each route.

Schematic of the proposed method.
Public transport travel time calculation methods
We considered potential access from more than 8900 communities to 161 urban parks via public transport or walking mode. Distance and travel time from community entrance to park entrance were calculated. The distance of 800 m (approximately 0.5 mile) was typically used as the maximum likely walking distances for people to walk to a park (National Highway Traffic Safety Administration, 2002; Donahue, 2015; LaPlante and Kaeser, 2007; Sherret, 1979), i.e. if the distance between a community and park was not more than 800 m, walking mode was assumed. For larger distances, other modes, such as public transport, would be taken.
Public transport travel time includes four parts: access to origin transport stops via walking, transport waiting time, duration of public transport journey from origin to destination transport stops, and access to urban parks via walking. Only transport stops within 400 m of the community and park entrances were considered as origin and destination transport stops (El-Geneidy et al., 2010; Hsiao et al., 1997). For a given community, i, and park, j, the quickest travel time from the community entrance – the transition space between the residential quarters to the urban space for most urban residential area were closed managed in China – to the park entrance via public transport is:
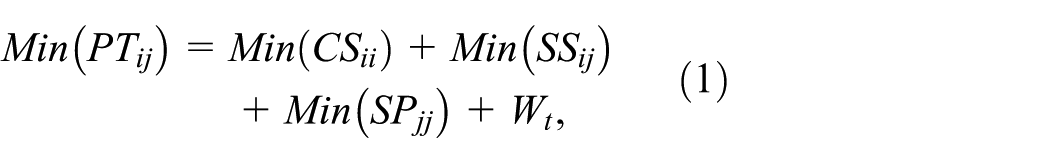
where
Home to park public transport accessibility calculation methods
In this study, the accessibility indices of public transport mode include: (1) the quickest travel time by public transport; (2) the shortest distance via public transport; (3) park attraction value. Based on the accessibility measurement studied by Geertman and Ritsema Van Eck (1995), the public transport accessibility calculation formula for community to urban parks was:
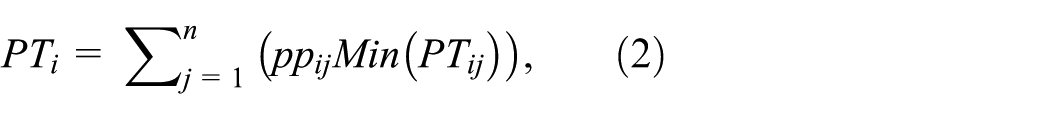
where, for a given community, i, and park, j,
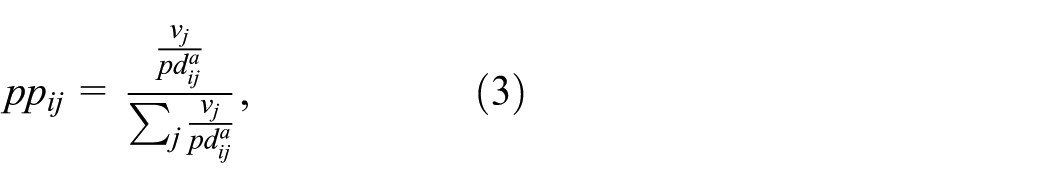
where a is a decay factor (2.0);
Park from home public transport accessibility calculation methods
The public transport accessibility calculation formula for urban park from communities was:

where, for a given park, j, and community, i,
Results
Public transport service area
Within easy walking distance, citizens may go to the park from home on foot. As the threshold set as 800 m, the possible park walking areas were shown in Figure 3. Most walking areas are in the built-up regions, especially the largest region around the city centre. This is partly because the majority of urban parks in Shanghai are located in the built-up area, particularly the city centre, and also because communities tend to be closer to urban parks in the downtown area.
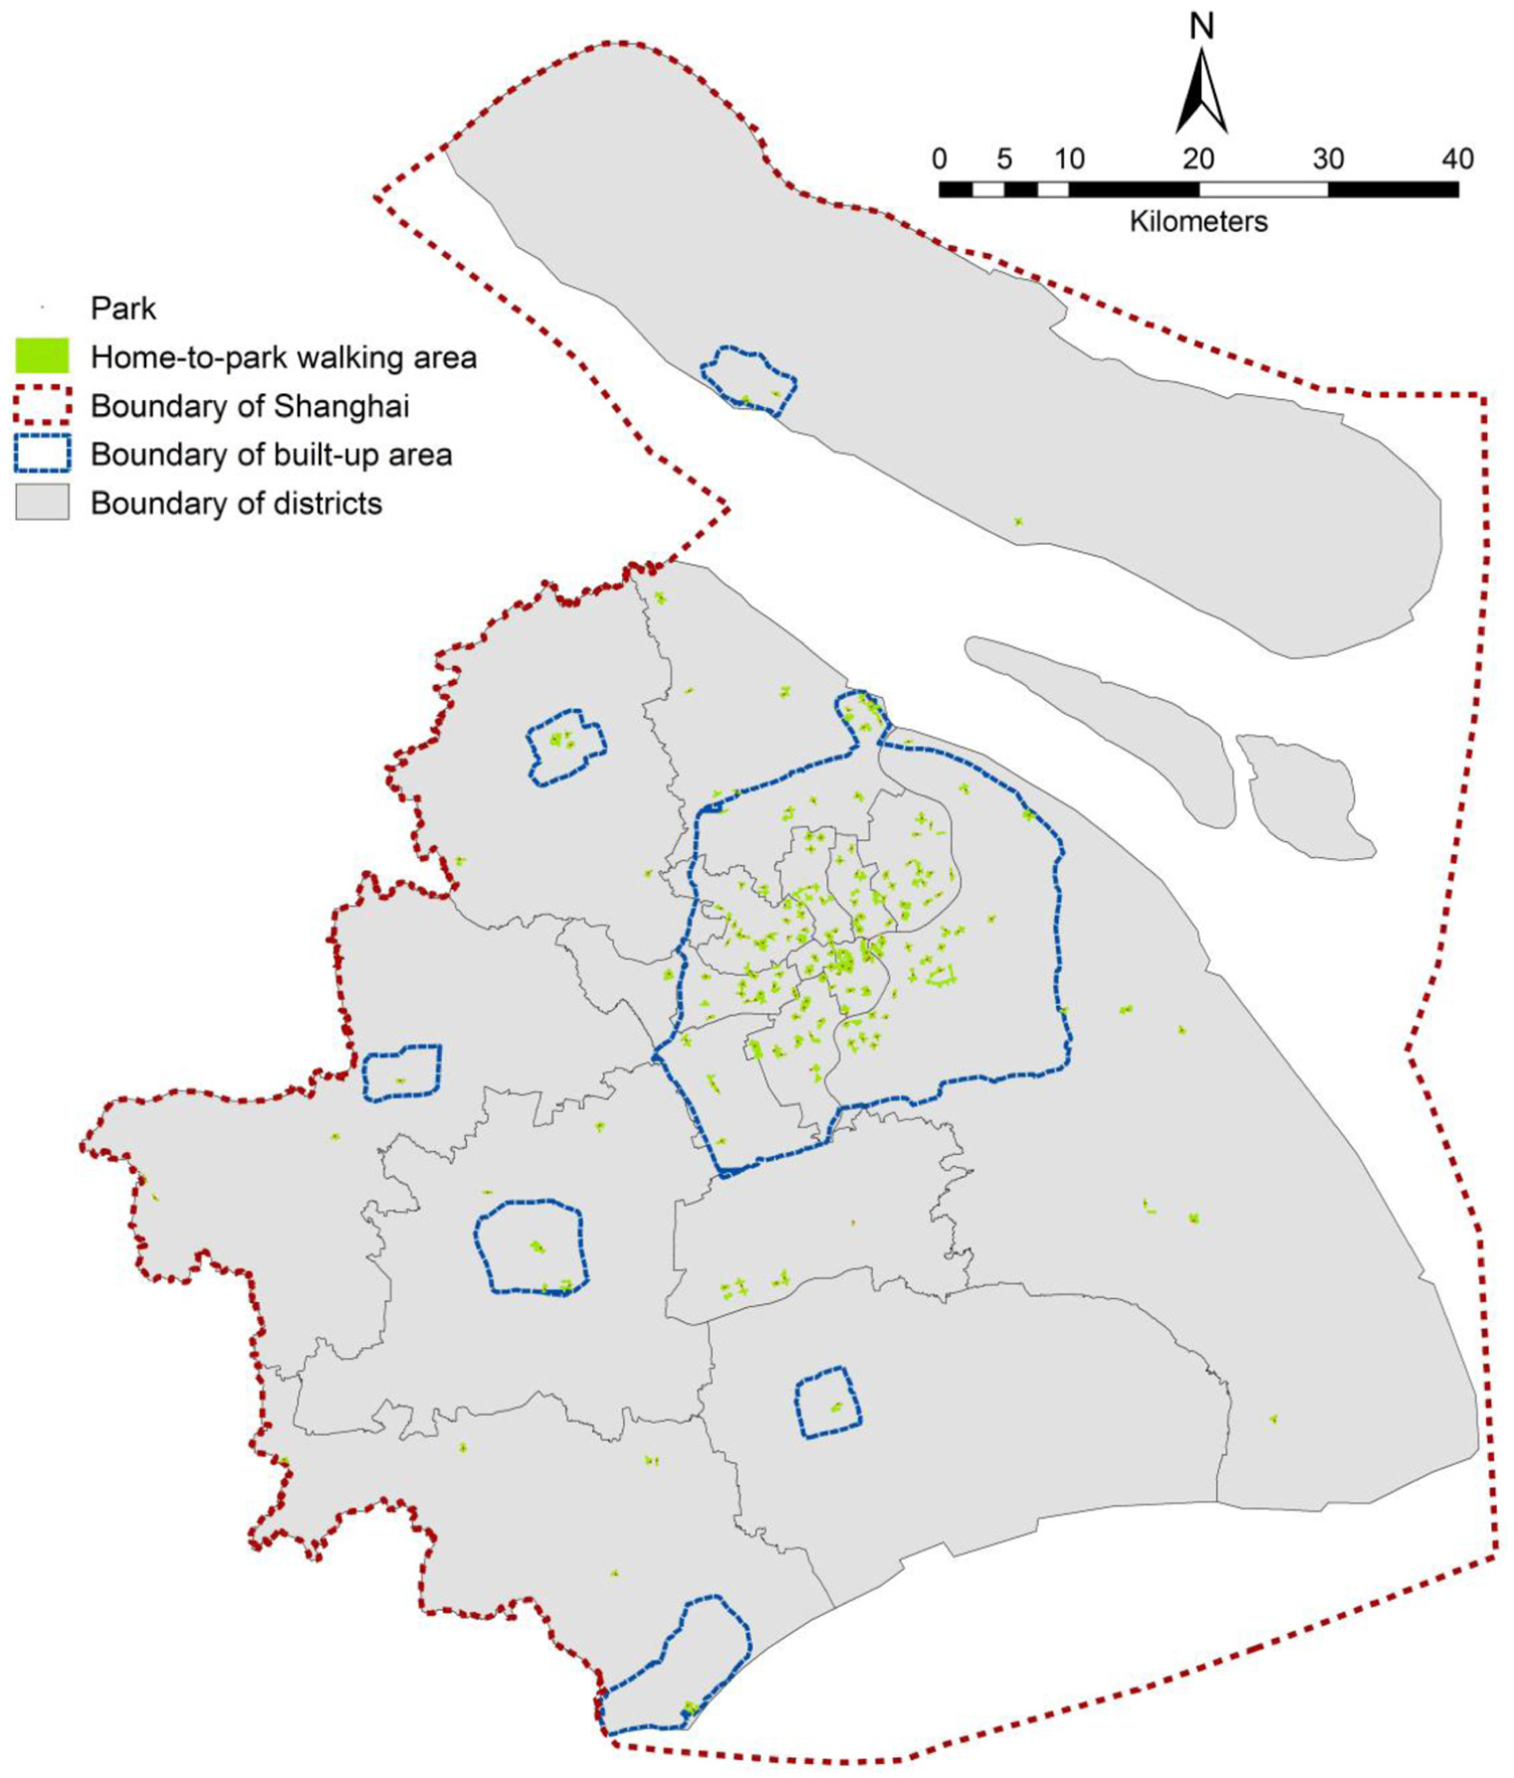
Home to park walking areas.
Citizens prefer public transport to automobiles for multiple reasons, such as strong regulatory controls of private car, heavy traffic and environmental factors (Costa and Markellos, 1997; Gorham et al., 2002; Hensher, 2007; Paulley et al., 2006; Shannon et al., 2006). Hence, for home to park or park from home distances larger than 800 m, public transport is the main method for home to park commuting. Considering only public transport mode when distances between home and park are above 800 m, approximately 99.95% of home to park routes in Shanghai would include public transport, as shown by district in Figure 4. The proportion of public transport routes to parks from communities are less for older towns than in new districts. Hence citizens living in new districts tend to rely more on public transport to go to parks than those living in old towns.
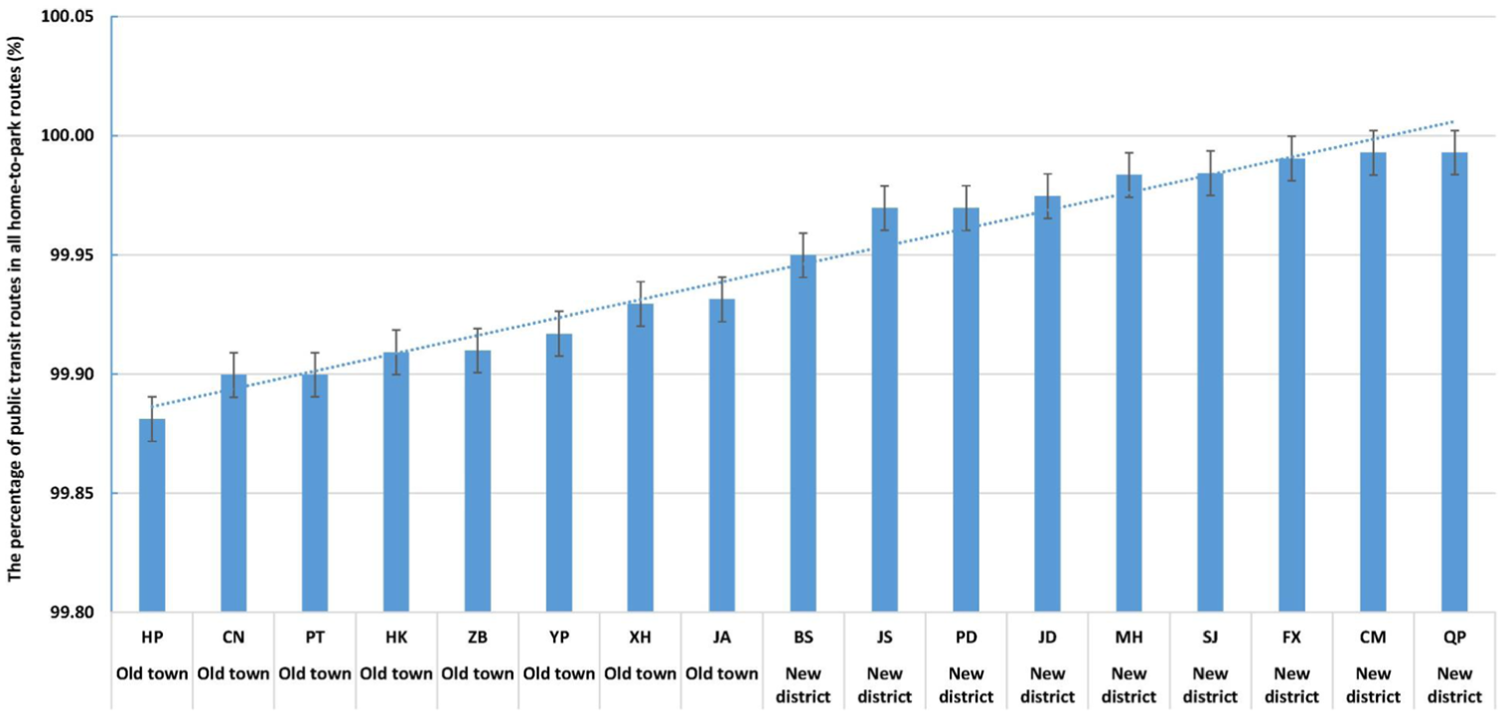
Home to park proportion of public transport by district.
Home to park public transport accessibility
The distribution of home to park public transport accessibility is uneven, as shown in Figure 5. It shows strong space polarisation, with public transport accessibility decreasing from the centre to fringe regions of the city. The patches with best accessibility tend to be distributed in the built-up area in the city centre. Most areas of Chongming island, the southwestern region of the city, and the regions along the southeastern coast line, have the worst home to park public transport accessibility. Figure 6 shows that accessibility in the eight old towns is significantly better than for the nine new districts: the means of home to park public transport accessibility in old towns are all below 8 minutes, whereas the new districts are all above 10 minutes. The home to park public transport accessibility of Chongming island is significantly worse than the other 16 districts, as shown in Figure 6. It indicates that the community public transport service to urban parks is generally better in the old towns than new districts. The Chongming district has the most inconvenient home to park public transport.

Home to park public transport accessibility overall.
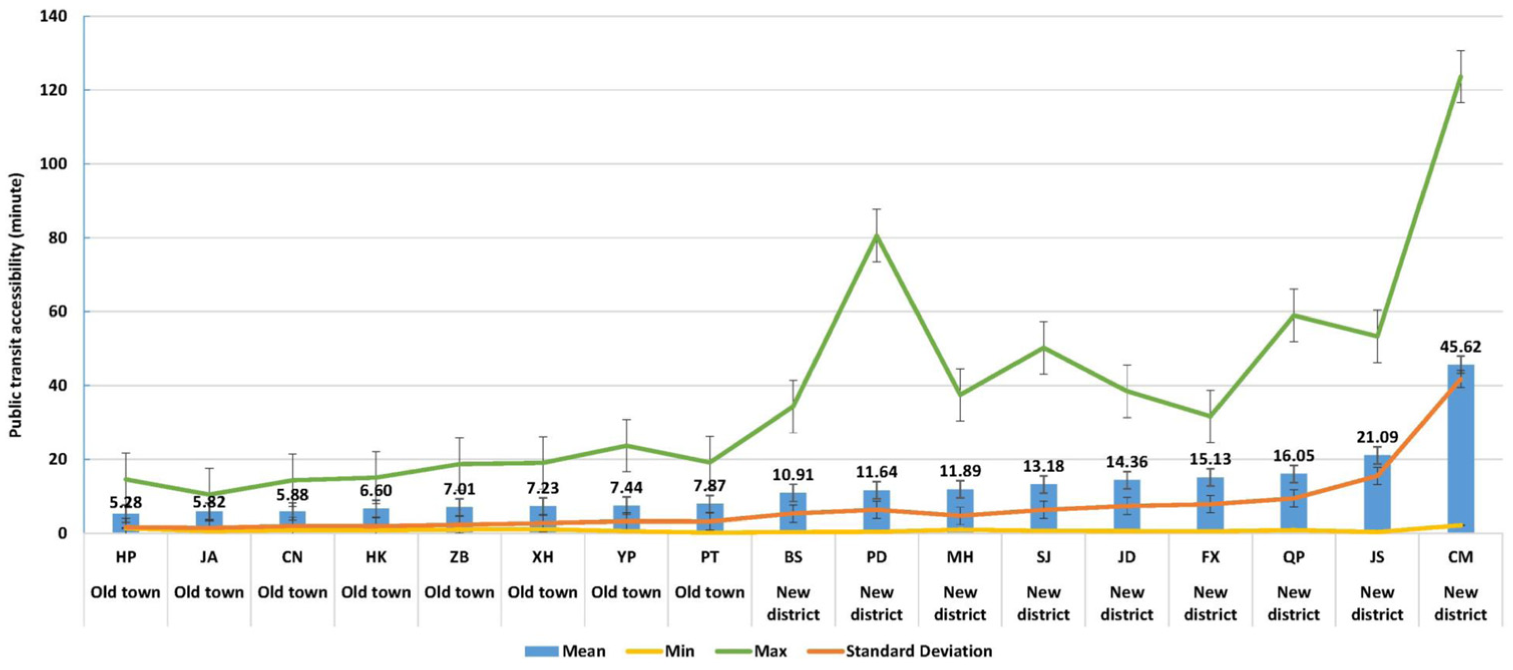
Home to park public transport accessibility by district.
Park from home public transport accessibility
Unlike the distribution of home to park public transport accessibility (Figure 5), the distribution of park from home public transport accessibility (Figure 7) has no correlation with district development stage. Although the communities in built-up area and old towns have better community to park public transport accessibility than those outside of built-up areas or in new districts, parks in built-up areas and old towns do not have better park from home public transport accessibility than those outside of built-up area or in new districts. The parks with higher star rating usually need better park from home public transport accessibility. Unfortunately, the park from home public transport accessibility does not have positive correlation with the star rating of urban parks (Figure 7). Many parks with higher star rating have worse public transport accessibility, while many parks with lower star rating have better public transport accessibility, such as the five parks (1 for star rating 5, 1 for star rating 4, 1 for star rating 2 and 2 for star rating 1) outside of built-up area at the southeast part of Pudong district. The park from home accessibility has no correlation with park rating or size. It indicates that public transport service in Shanghai takes no account of the factors of park star rating or size.
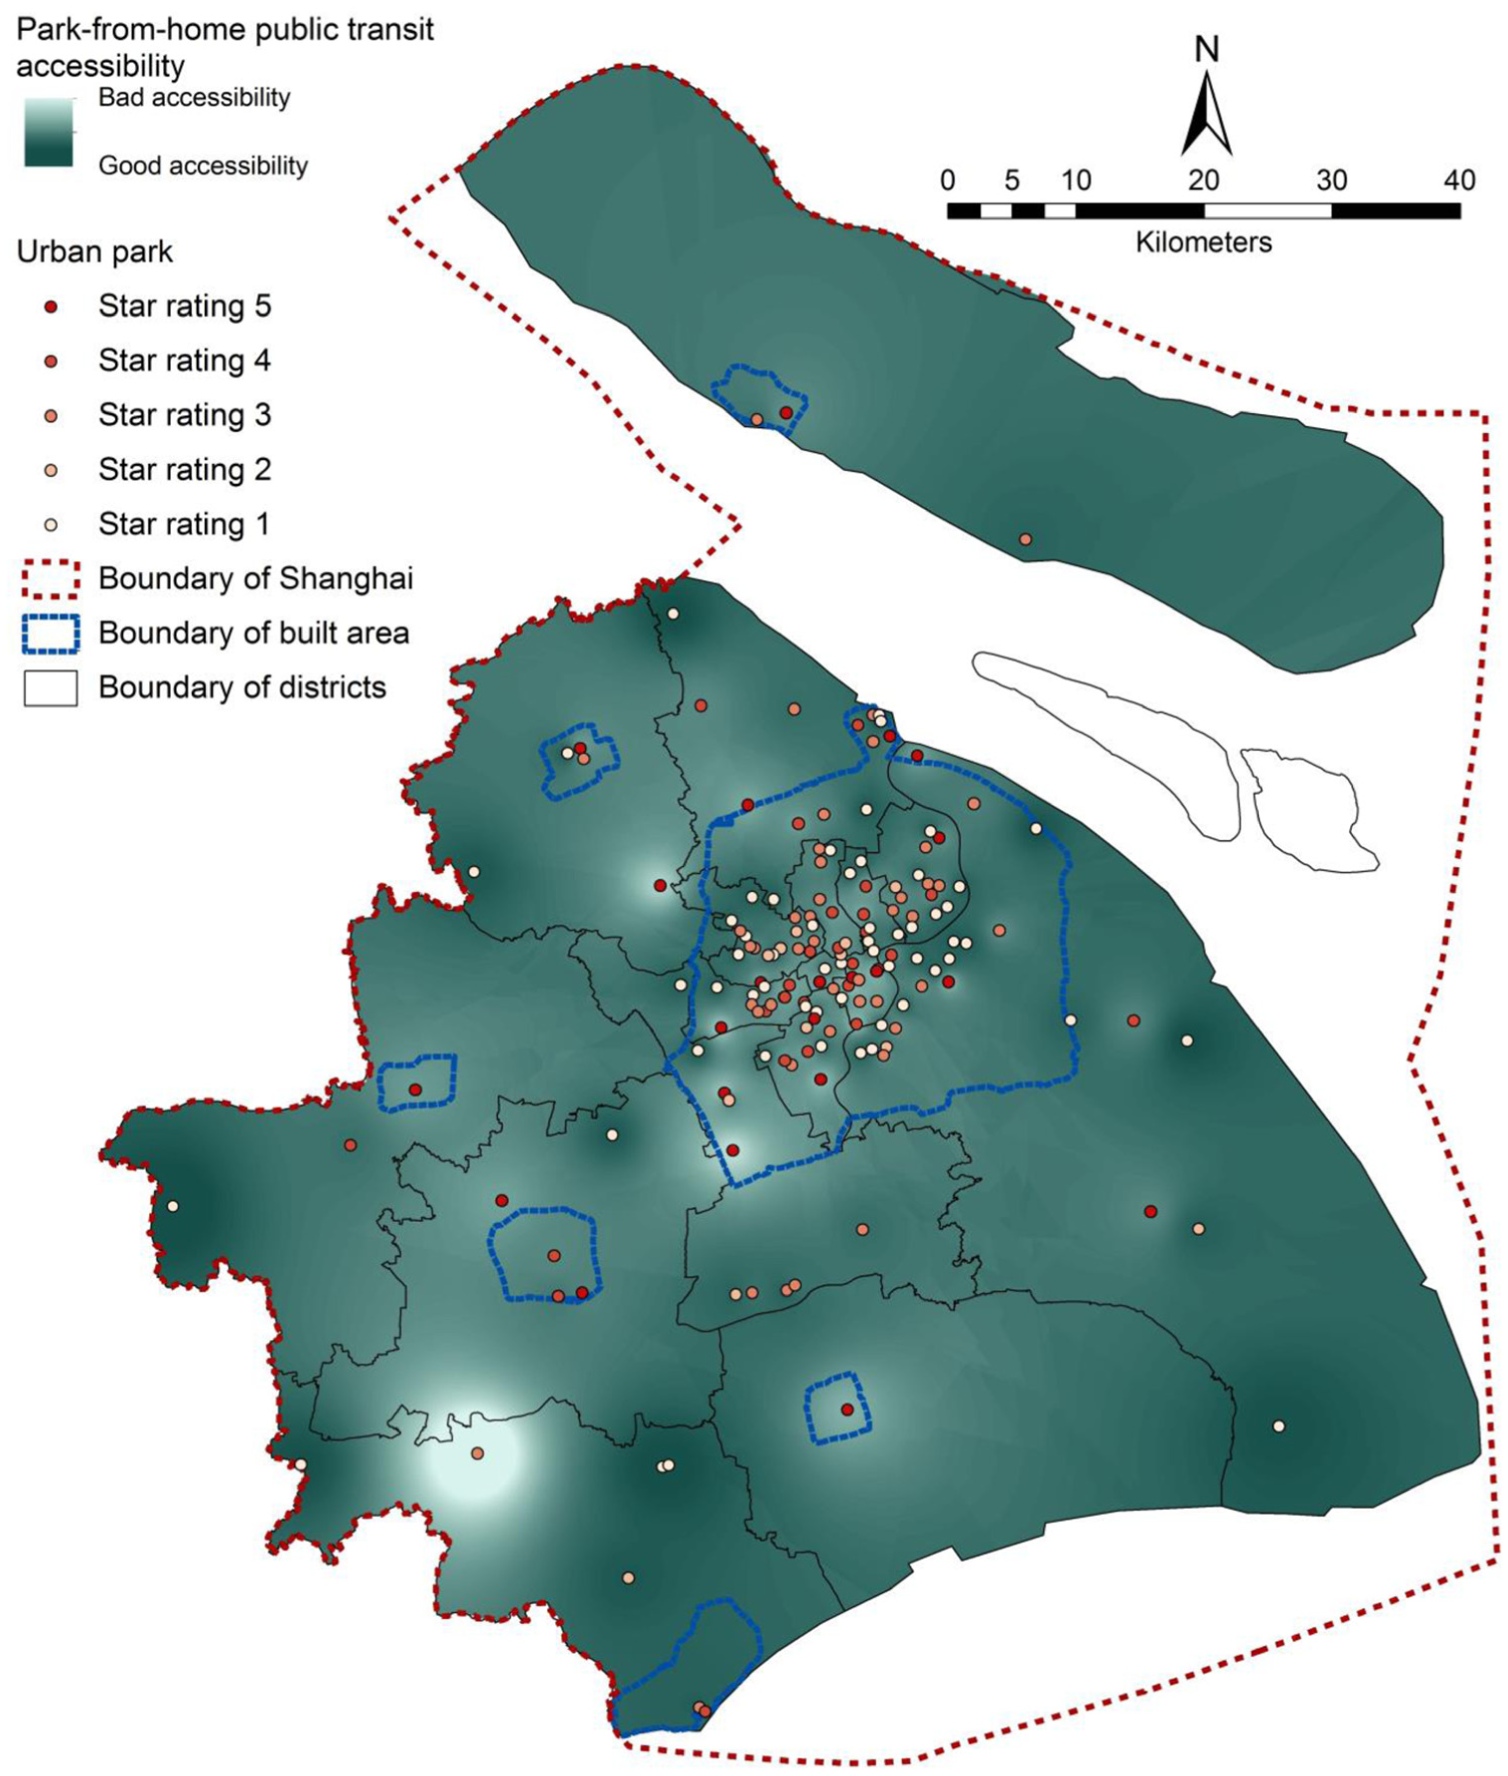
Park from home public transport accessibility overall.
Home to park public transport accessibility and demographics
Figure 8 shows the negative relationship between average home to park weighted public transport travel time and population densities of districts. As population density increases, home to park access time via public transport decreases, i.e. districts with more dense populations often have better home to park public transport accessibility. Hence allocation of public transport for park visits in Shanghai broadly follows the population distribution.
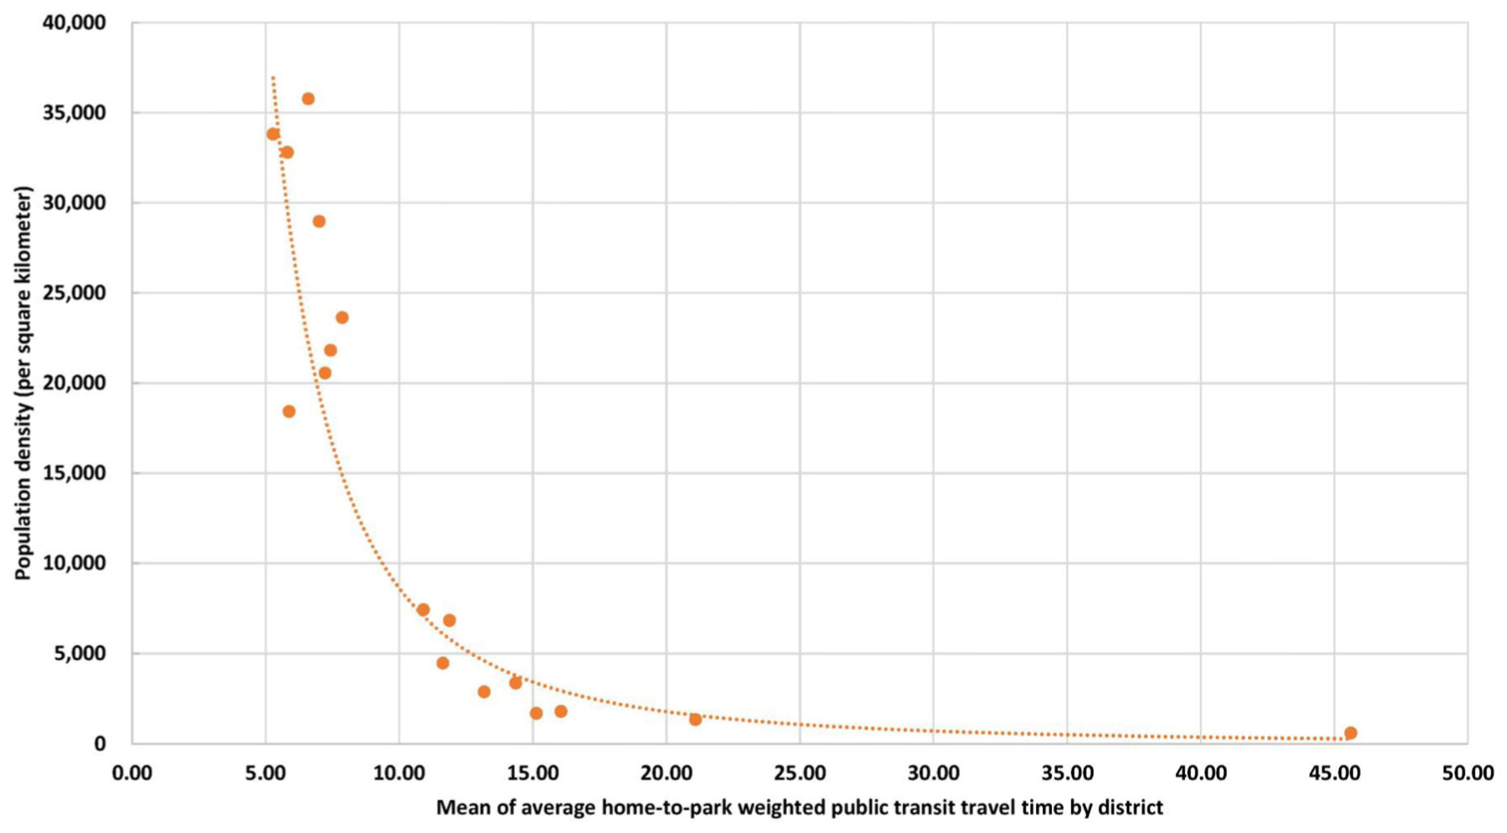
Home to park public transport accessibility and population density by district.
Discussion
The distribution of park public transport accessibility is broadly related to population distribution. It might be because of the local planning requirements for green spaces and parks. Also different development stage might be another reason. Unlike old towns with a long development history, new districts are still being developed and have more need of parks construction and public transport services improvement. Considering only public transport mode, approximately 99.95% of home to park routes beyond walking scope for citizens require public transport. Public transport service to urban parks is quite unequal in the 17 districts. It is much worse in the nine new districts than the eight old towns, and particularly in Chongming island. Various factors could contribute to the difference, such as low density public transport networks, indirect public transport routes, inefficient transport stop arrangements, and inadequate park distribution. Thus, increasing the public transport supply and park construction according to the analysis results in this paper would reduce the inconvenience and disparity of citizen’s park catchment. Home to park public transport accessibility in the 17 districts, especially the new districts, could be improved by adding urban parks, optimising locations between parks and communities, and supplementing public transport service supply. Public transport service improvement in Shanghai could take account of the factors of the park, such as park star rating or size.
This research provides four important contributions: (1) Urban park accessibility measures are focused on public transport modes, which fills a gap in the literature; (2) more accurate and advanced calculations than previous studies (Coombes et al., 2010; Comber et al., 2008; Dai, 2011; Neuvonen et al., 2007; Oh and Jeong, 2007) from employing access distance and park star ratings as variables; (3) based on the spatial distribution of urban parks, the methods applied here provided more precision and objectiveness than the literature in many respects, such as actual travel path (from GIS network analysis), entrance to entrance OD cost matrixes, and multiple accessibility on the basis of home to park paths; (4) this research assessed home to park and park from home access via public transport mode and analysed the results to evaluate public transport supply for urban parks.
However, there are some limitations. This study did not source information directly from residents to develop and calibrate the accessibility measures. The duration of public transport journey was assumed to be the critical factor for route selection, which neglects the effects of transport transfer. Some citizens may prefer public transport journeys with less transfers rather than strictly shorter duration. We used a fixed 7 minutes average public transport waiting time to calculate total travel time, but this does not consider some traffic factors for more realistic scenarios, such as service frequency, traffic condition and waiting times for different transit lines, at different stations and different times. Different service frequencies may cause markedly different wait times for different commuting times and routes. Different traffic conditions and waiting times may cause markedly different travel time for different traffic lines and at different times. Other variables in perceptions of different parks, weekday/weekend, seasonal, etc. which may cause different accessibility were neither not considered. These factors are needed to be considered and analysed in more detail for the accessibility assessment in future study.
Conclusions
This research proposed a measure for public transport accessibility to urban parks, analysed multi-mode transport home to park accessibility for the megacity of Shanghai, and provided valuable insights for urban planners and designers to develop a sustainable city with an equal and accessible public transport service to urban parks. Combining GIS network analysis and accessibility calculation methods, the methods applied here allowed a more realistic estimation of public transport accessibility than reported previously. The findings can assist in presenting the abundance and/or shortage of public transport provision for urban parks in Shanghai, improving public transport service, and optimising urban park distribution to ensure convenience in accessibility.
Footnotes
Funding
This research received no specific grant from any funding agency in the public, commercial, or not-for-profit sectors.