
Abstract
Socio-spatial differentiation has been identified not only in capitalist market economies but also in transitional countries, including post-reform China. However, most prior studies on this topic in Chinese cities are limited to a spatial resolution of the sub-district level, and finer scale analyses remain scarce. Drawing on this gap, this article provides a block-level examination of the socio-spatial changes in the central city of Beijing by employing the Beijing Travel Survey data, which contain rich socio-economic information. Latent class analysis and GIS visualisation are used to stratify the residents into different levels of socio-economic well-being based on multiple attributes and analyse their spatial distribution. The findings reveal a dramatic transformation of the socio-spatial landscape in Beijing in only five years between 2005 and 2010; 90% blocks show a greater than 10% increase or decrease in the average social stratification index of their residents. The socio-spatial changes can to a large extent be related to the market reform of China’s economy and housing distribution, which exerts its influence through not only commercial developments but also profound interactions with the public sector.
Introduction
Socio-spatial differentiation is one of the most common and long-lasting phenomena in human societies (Hamnett, 2001). The term describes the dynamics involved in the uneven distribution of individuals, households and groups, differentiated by socio-economic status, ethnicity, demographic characteristics and lifestyles, among other variables (Kabisch et al., 2012; Knox and Pinch, 2014). It has been identified not only in capitalist market economies (Atkinson, 2000; Hamnett, 2001; Musterd, 2005; Musterd and Ostendorf, 2013; Walks, 2001), but also in transitional countries (Marcińczak and Sagan, 2011; Sýkora and Bouzarovski, 2012). Before the market reform, urban households in China had homogeneous income, social welfare and minimal segregation in urban areas, in accordance with the egalitarian ideology (Wu and Li, 2005). Most Chinese cities were characterised by mixed social areas that were mainly built upon different land uses rather than social status. With a so-called work-unit housing system (Danwei in Chinese), cadres and general staff lived in the same area close to their workplace, regardless of social status (Li and Wu, 2006; Zhou and Logan, 1996). However, the economic reform implemented in 1978 has dramatically changed the socialist egalitarian urban space. With an enlarged income disparity and the replacement of the welfare housing distribution by the housing market, Chinese cities are undergoing an on-going process of socio-spatial differentiation (Li and Wu, 2006; Wu, 2002; Wu and Li, 2005; Wu et al., 2014).
Although several studies have examined this phenomenon in Chinese cities (Li and Wu, 2006; Wu, 2002; Wu and Li, 2005; Wu et al., 2014), the spatial resolution of most studies is limited to the sub-district level (jiedao in Chinese), 1 and finer-scale analyses remain scarce (Wu et al., 2014). Drawing on this gap, our study provides a block-level examination of the socio-spatial changes in the central city of Beijing by introducing the Beijing Travel Survey data, which contain rich socio-economic information collected at a fine scale, the Traffic Analysis Zones (TAZs). The TAZs are divided in accordance with the road networks by the Beijing Municipal Commission of Transport and in most cases are similar to the size of a block, except for at the urban fringes where several blocks may be merged into one TAZ. The sizes of TAZs range from 0.1 km2 to 15 km2 and the median size is 1 km2. The particularity of this analysis lies in the following aspects.
- the use of fine-scale block-level data
- the quantitative measurement of the changes through uniformly collected and analysed data from 2005 and 2010
- a focus on the period when the housing marketisation reform (HMR) 2 was almost completed, whereas most prior studies have focused on the period before 2000, when HMR was still on-going and the socialist welfare housing distribution was not fully abolished.
Furthermore, in order to probe into the processes and driving forces underlying the socio-spatial changes, we also employed the data of planning permits and discussed the relationship between the socio-spatial changes and housing (re)development projects and other factors. The main contribution of this article lies in the revelation that the socio-spatial landscape in Beijing is experiencing rapid change in the post-reform era, which has been seldom quantitatively and holistically revealed before. Moreover, although we acknowledge that in-depth field survey work is needed to fully understand the mechanism of the changes, we argue that the on-going marketisation of China’s economy forms the basic context and works as an important driving force in this process.
Beijing is chosen as the empirical case study based on two considerations. First, it has undergone vast urban redevelopment in the past few decades. It is necessary to examine the social consequence of these physical changes. Second, as the capital city of a transitioning country, Beijing manifests a complicated interaction between the socialist regime and the free market and between the inflowing rural migrants and the new rich; it therefore represents a rich context for this type of analysis.
The rest of the article is organised as follows. The second section reviews the existing research on the socio-spatial differentiation in Chinese cities and explains how our work fills the gaps of research. The third section introduces the data sets and methodology. The fourth section presents the results on the stratification of social groups and the socio-spatial changes between 2005 and 2010, and discusses the processes and drivers of the observed changes. The final section concludes and discusses the caveats of our work.
Previous research on socio-spatial differentiation in China
The post-reform socio-spatial differentiation and the distinctive underlying mechanisms in Chinese cities have received considerable research attention. Most of these works have identified a dramatic restructuring of the urban social space from a homogeneous pattern in the pre-reform era towards a stratified and segregated one. For instance, Wu (2002) examined the spatial differentiation of housing prices in Shanghai in 2000 and identified three implications of the market reform for the urban space. Wu and Li (2005) analysed the spatial inequalities among selected sub-districts of Shanghai in 1990 and 2000, and they noted that the differentiation of social spaces in Chinese cities includes but is not limited to several dimensions: educational attainment; occupational and working status; and the status of household registration (the hukou system, in Chinese) (Wu and Li, 2005). Another case study by Li and Wu on three distinctive neighbourhoods in Shanghai confirmed that residents with a stratified socio-economic status are being sorted into stratified neighbourhoods (Li and Wu, 2006). Zhao measured the indexes of social segregation in Beijing in 1990, 2000 and 2005 and identified an increase in residential segregation in Beijing (Zhao, 2013). Wu et al. (2014) performed what is probably by far the most fine-grained analysis of the socio-spatial structure of Nanjing on a community scale (juweihui in Chinese) in 2000, revealing that higher social clusters and the very lowest social areas displayed a tendency to become more segregated and that the market forces increased segregation (Wu et al., 2014).
Regarding the mechanism of socio-spatial reorganisation, Wu (2002) identified three transforming processes under the market reform: the first is the revitalisation of the pre-socialist spatial division, the second is the further socio-spatial differentiation brought by commercial development and the third is the privatisation of real estate itself. Wu and Li (2005) mentioned five key interrelated processes: the revealing of historical legacies; fragmentation of the structure of housing provision; the market economy and urban development; globalisation and economic restructuring; and rural–urban migration, in which the factors of both the market economy and the socialist institution are at work (Wu and Li, 2005). Wu and Li (2005) further summarised that the underlying mechanism of neighbourhood change is rooted in the complicated interrelations between the market, the state and the urban history. This argument is more or less shared by Zhao (2013) and Wu et al. (2014). Zhao (2013) found that the resources and opportunities in Chinese cities are distributed to social groups based on their wealth in the market-orientated system, jointly affected by institutional factors such as the residential registration system. Wu et al. (2014) also addressed the joint influence of the institutional forces and the market system.
Despite the rich empirical evidence and theoretical evidence provided by the literature, studies are more or less limited in the following aspects. First, the confidentiality of fine-scaled census data in China is always an obstacle to this line of research. Most of the above-mentioned works utilise sub-district-level census data, except for that of Wu et al. (2012), which managed to acquire community-level data. Our work takes an alternative approach and exploits the travel survey data collected by the transportation department of the local authority, which also contain rich socio-economic information on residents and are collected at a very fine-grained scale. Second, probably also due to the data availability problem, many existing works present only single-year, cross-sectional results. Instead, we directly and quantitatively visualise the changes of socio-spatial restructuring by using two data sets collected in 2005 and 2010 respectively. Third, most existing works focus on the period before 2000. Residential disparity was still considered ‘nascent’ at that time (Li and Wu, 2006). Since China introduced the Housing Monetisation Reform in 1998 and joined the World Trade Organization in 2001, a deepened economic reform and a more complete market transition have occurred. This article therefore takes a closer look at the socio-spatial changes during this period, which have not been covered before.
Methodology
Data and study area
The main data sets used in this study are the Beijing Travel Survey 2005 and 2010, which, though designed for transport purposes, contain rich demographic and socioeconomic information for social stratification analysis, including demographic composition, education level, job status, vocation, car ownership, housing floor area and residential registration status (Beijing Hukou) etc. The survey recorded the 24-hour travel diaries of 80,000 households and 210,000 individuals in 2005 and 47,000 households and 116,000 individuals in 2010 (for more information, see Long and Thill, 2013). The data were collected at a spatial resolution of TAZs, which are delineated by main roads and are mostly 0.5 to 2 km2, except for a few large pieces at the urban fringe due to sparse road networks (up to 15 km2; see Figure 1). This resolution is much higher when compared with traditional census data that are collected at the sub-district (jiedao) level, equal to five to twenty TAZs in most cases. It should be noted that the partitions of TAZs in 2005 and 2010 were not exactly the same, but the differences were marginal. Besides, a data set of planning permissions issued between 2003 and 2007 is employed to analyse the physical changes in relation to the socio-spatial changes. The data set contains information with regard to the location, the footprint, the function and the type (commercial development, various government-led development schemes, etc.) of each permitted project. The data between 2003 and 2007 is used both because of data limitation and because there is usually a gap of two to three years between the issue of planning permission and the completion of a project.

The study area and sample size in 2010. 3
The study area is the central city of Beijing, with an area of c. 1085 km2 and 880 TAZs (in 2010). Within this area, 430 TAZs are surveyed. The area covers more than 90% of the residential areas in the city, and the unsurveyed TAZs are mostly commercial areas, offices and public facilities. The sampling rate is 1.5% of the entire population in Beijing. The sample sizes in most surveyed TAZs are larger than 30 households.
It is worth noting that the ‘blocks’ described in this research are much larger than those in European and American cities. A block in the US census usually has a population of around 100, while the population in the blocks in this research can range from 500 to more than 10,000. This is because of both the relatively large block sizes in Chinese cities (Long et al., 2016) and the high population density (Smith, 2015). Therefore, the fine-scale resolution of this study should be perceived only in a relative sense compared with other existing research on this topic and on Chinese cities.
Methods
Latent class analysis (LCA) is carried out to stratify the sample households into groups of different socio-economic status. LCA identifies unmeasured class membership from multiple observed characteristics. The number of classes and their sizes are not known a priori. It is similar to standard cluster analysis techniques in that the goal is to form segments. However, LCA is more preferable for our task in the following aspects. First, LCA assumes the existence of a latent variable that induces spurious relationships among the observed variables rather than just looking for similarities (Hagenaars and McCutcheon, 2002). This corresponds to our notion that there is a latent social class membership that links to the differences in socio-economic indicators. Second, LCA is similar to other cluster analysis techniques in that the allocation of objects to clusters should be optimal according to some criteria; however, the choice of a criterion is more arbitrary in cluster analysis (Hagenaars and McCutcheon, 2002), such as an arbitrarily chosen distance measure. Other strengths of LCA include providing a probabilistic estimate of object class membership and being more flexible in terms of the data type. Due to these advantages, LCA is becoming a more popular clustering tool (Hagenaars and McCutcheon, 2002).
LCA models with different numbers of latent classes, and different combinations of model variables, are tested and compared to locate the best fitting and most reliable model, based on Akaike’s Information Criterion (AIC), Bayesian Information Criterion (BIC) and log-likelihood and G-square fit statistics (Linzer and Lewis, 2011). Models with lower AIC, BIC and G-square fit statistics but a higher log-likelihood are preferred. The relative sizes of the latent classes, and their interpretability, are also considered in the model selection process (Byles et al., 2018; Lanza et al., 2010). Analyses are performed using R package poLCA (Linzer and Lewis, 2011).
According to prior studies, the differentiation of social well-being in urban China includes but is not limited to income, occupation, education level and housing condition (Logan et al., 1999; Long and Shen, 2015; Wu and Li, 2005). Each alone is not enough to produce a reliable estimation. For instance, though income sounds straightforward for social stratification, it does not always reflect a household’s financial status without taking into account housing rent and mortgage. Additionally, considering the dependency among household members, it is more reasonable to use household instead of individuals as the unit of social stratification. Based on the above considerations and data availability in the transport survey, the following variables are included in the latent class analysis (Table 1).
Input variables in LCA.

It should be noted that although the two surveys were conducted in a consistent manner, there were slight differences in the variables collected. Therefore, the choice of variables in the LCA model for the two years may also not be exactly the same.
With all sample households stratified into a social group, we then calculate the location quotient index (LQ) of each social stratum in each block to measure the distribution of social groups for both years.

where sni and ti are the population of social stratum n and the total population in block i; and Sn and T are the population of social stratum n and the total population in the study area (Brown and Chung, 2006). The LQ index is particularly useful in this study to remove the impact of unequal population of social groups (He, 2010). Hence, if the percentage of a social group in a block matches its percentage for the urban area overall, LQ = 1; if the percentage in a block is greater than that for the urban area overall, LQ > 1; if the percentage in a block is less than that for the urban area overall, LQ < 1 (Brown and Chung, 2006).
Furthermore, we calculate the average social stratification index (ASSI) of all sample households in each block to indicate the average social composition and a social restructuring index (SRI) and thus to indicate the change in social composition in the study period.
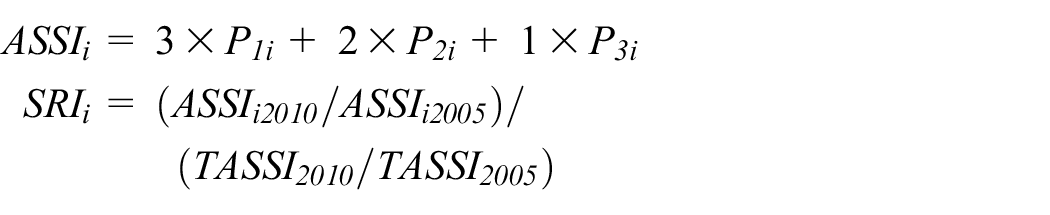
where P1i , P2i and P3i are the percentage of strata 1, 2 and 3 in block I; and TASSI2010 and TASSI2005 are the ASSI of all sample households in 2005 and 2010, which are included to remove the impact of varying social composition between the years. If the average social composition remains unchanged in a block, SRI = 1; if there is social upgrading in a block, SRI > 1; if there is social downgrading, SRI < 1. The identified socio-spatial changes are then examined against the planning permission data, to analyse the relationship between the physical and social changes and probe into the driving forces of the socio-spatial changes.
Results and discussion
Social stratification in contemporary Beijing
By testing with all possible combinations of the above-mentioned variables and different clustering numbers, we find that the model performs best (produces the lowest AIC, BIC and G-square fit statistics and the highest log-likelihood) when the class number is three for both 2005 and 2010. The combination of model variables that produced the best performance is blue-collar worker ratio, car ownership, housing type and housing floor area for 2005 and highest education in the household, car ownership, housing market value and housing floor area for 2010. The three classes are labelled as ‘the best-off’ (Stratum 1), ‘the middle class’ (Stratum 2) and ‘the least well-off’ (Stratum 3).
It should be noted that the variables included in the chosen models are not entirely the same between the two years, which is the consequence of inconsistent measurements in the two surveys. It does not pose an issue for our analysis since household samples from the two years are classified with two separate LCA models instead of mixed into the same model. In fact, it is not reasonable to evaluate the socio-economic status in different years in the same model considering the overall socioeconomic changes. For instance, the proportion of households with cars increased from 46% in 2005 to 55% in 2010 in the best-off group and from 29% to 32% in the middle group. The proportion of households living in an apartment larger than 100 m2 rose from 49% in 2005 to 69% in 2010 in the best-off group and from 1% to 7% in the middle group. Additionally, the changes in the shares of strata indicate a slightly widening social gap, which is related to the growing wealth gap and increasing numbers of migrants from poorer provinces.
The profiles of the three social strata in each year are as follows (Figure 2). Stratum 1 households in 2005 usually had few household members working as blue-collar workers and lived in match-box housing or commercial housing with a floor area of more than 75 m2 or even more than 100 m2. About half of them owned at least one private vehicle. In Stratum 2 households, usually no more than half of household members were blue-collar workers. Most of these households lived in match-box housing with a floor area of less than 75 m2 and did not own cars. Stratum 3 was not significantly different from Stratum 2 in terms of blue-collar workers and car ownership. However, the living conditions were much poorer, as most of them resided in old bungalows smaller than 50 m2. Compared with 2005, the common housing size of the Stratum 1 increased from 75 m2 to 100 m2 in 2010, while car ownership did not change much. Additionally, Stratum 1 households usually had at least one member with a bachelor’s degree or higher and lived in an apartment/house (owned or rented) with a market value of more than four million RMB. In 2010, the majority of Stratum 2 households lived in apartments smaller than 75 m2, with market values of less than four million RMB; a small proportion of them owned a private vehicle, and the highest degrees in the household were usually junior college or bachelor’s. In Stratum 3, the housing floor areas were usually less than 50 m2, and the market values were less than two million RMB. Only a small number in this group owned a personal vehicle and had a household member with a bachelor’s degree or higher.

Socio-economic characteristics of the three social strata identified by LCA.
Changes of socio-spatial differentiation between 2005 and 2010
Figure 3 shows the LQ index of each TAZ in both years. As mentioned previously, some TAZs at the urban edge are much larger than those in the city centre due to the sparse road network, resulting in one or two outstanding large colour patches. However, it does not necessarily indicate a large population of the specific social group there.
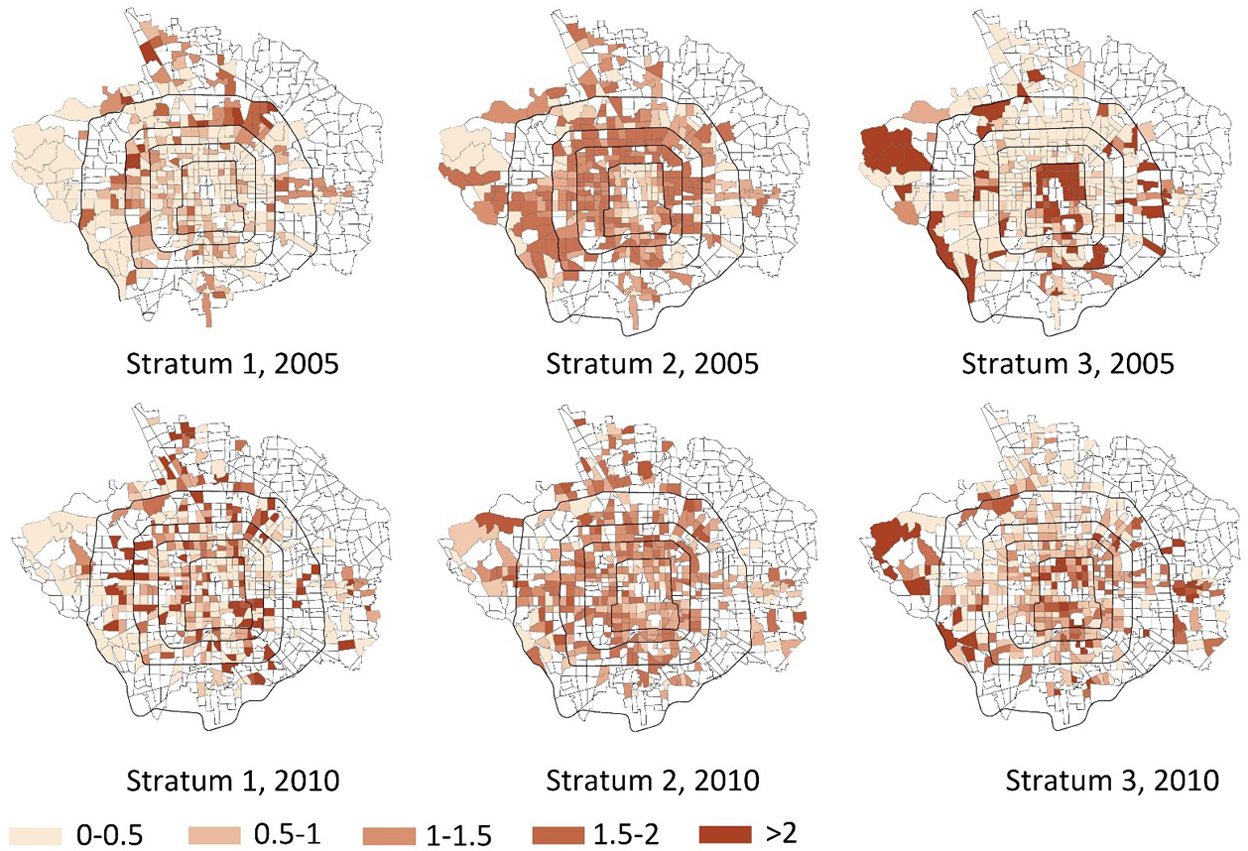
LQ of three social strata in 2005 and 2010.
The most outstanding pattern observed in 2005 is the high proportion of Stratum 3 households in the old city, which is related to the concentration of dilapidated old courtyard housing there. It is also observed that there are a few TAZs with a relatively high proportion of Stratum 3 households at the urban fringe, where there are many semi-urbanised villages providing cheap, informal houses to rent. In contrast, Stratum 1 households more commonly resided in the outer parts of the city – specifically, outside the fourth ring road in the north and outside the third ring road in the west, where houses were mostly built later and of better quality. Stratum 2 households were more evenly distributed across the city compared with the other two groups, except for in the old city which is mainly resided in by Stratum 3. However, both the concentration of third-stratum households in the old city and first-stratum households in the outer parts (the third to fifth ring roads) became less prominent in 2010. Instead, there was a trend for the third stratum to move outwards and the first stratum to move inwards, manifested by the increase of third-stratum households outside the second ring road and the increase of first-stratum households in the old city. The second stratum also showed a tendency to move into the old city.
Regarding the ASSI index, in 2005, indexes in the old city and the urban edges further out were notably lower and those between the third and fifth ring roads were higher (Figure 4). The landscape in 2010 turned out to be less distinctive and formed a more mosaic pattern, since the highest and the lowest social strata began to move into one another’s former residences. The ASSI in the area between the third and fifth ring roads remained high but was less prominent compared with 2005.
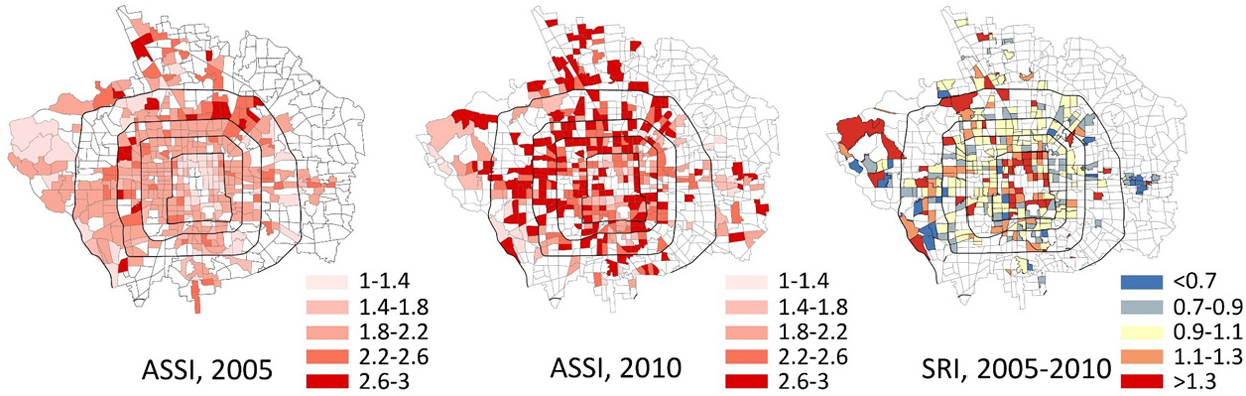
ASSI and SRI in 2005 and 2010.
The landscape becomes clear again when the SRI is calculated: the old city and the urban fringes at the north and west turned out to be areas of prominent social upgrading. Social downgrading did not happen in a very clear spatial pattern. In the next section, we will take a closer look into the results of the SRI and discuss the urban processes and drivers.
Marketisation as the context of the changes
In this section, we will discuss the contexts and processes that contributed to the observed socio-spatial changes, based on the planning permission data and other supplementary data sets. It should be noted that the socio-spatial changes can involve complicated interactions among the government, the developers and the local residents, which may or may not relate to physical changes. Therefore, although the planning permission data can provide a detailed account of the construction work going on in the study area, it alone is not enough to generate a complete and concrete explanation for the complicated process of socio-spatial changes, which may need to be assisted by in-depth field surveys.
Figure 5 shows the locations and footprints of permitted housing projects between 2003 and 2007 overlapped with the SRI of TAZs. The projects are grouped into four types, based on the development schemes, which are commercial housing projects, government-led redevelopment projects (weigai in Chinese, meaning renovating ramshackle buildings), small renewal and extension projects and affordable housing projects. Commercial housing projects were the most common and most marketised. In contrast, affordable housing projects were the least marketised but of much smaller volume. The weigai and small renewal and extension projects were in the middle of the government-market spectrum. They were usually jointly implemented by the local authority and private developers, and as a balance between the welfare of local residents and the need for profit making, which will be further discussed later in the text.
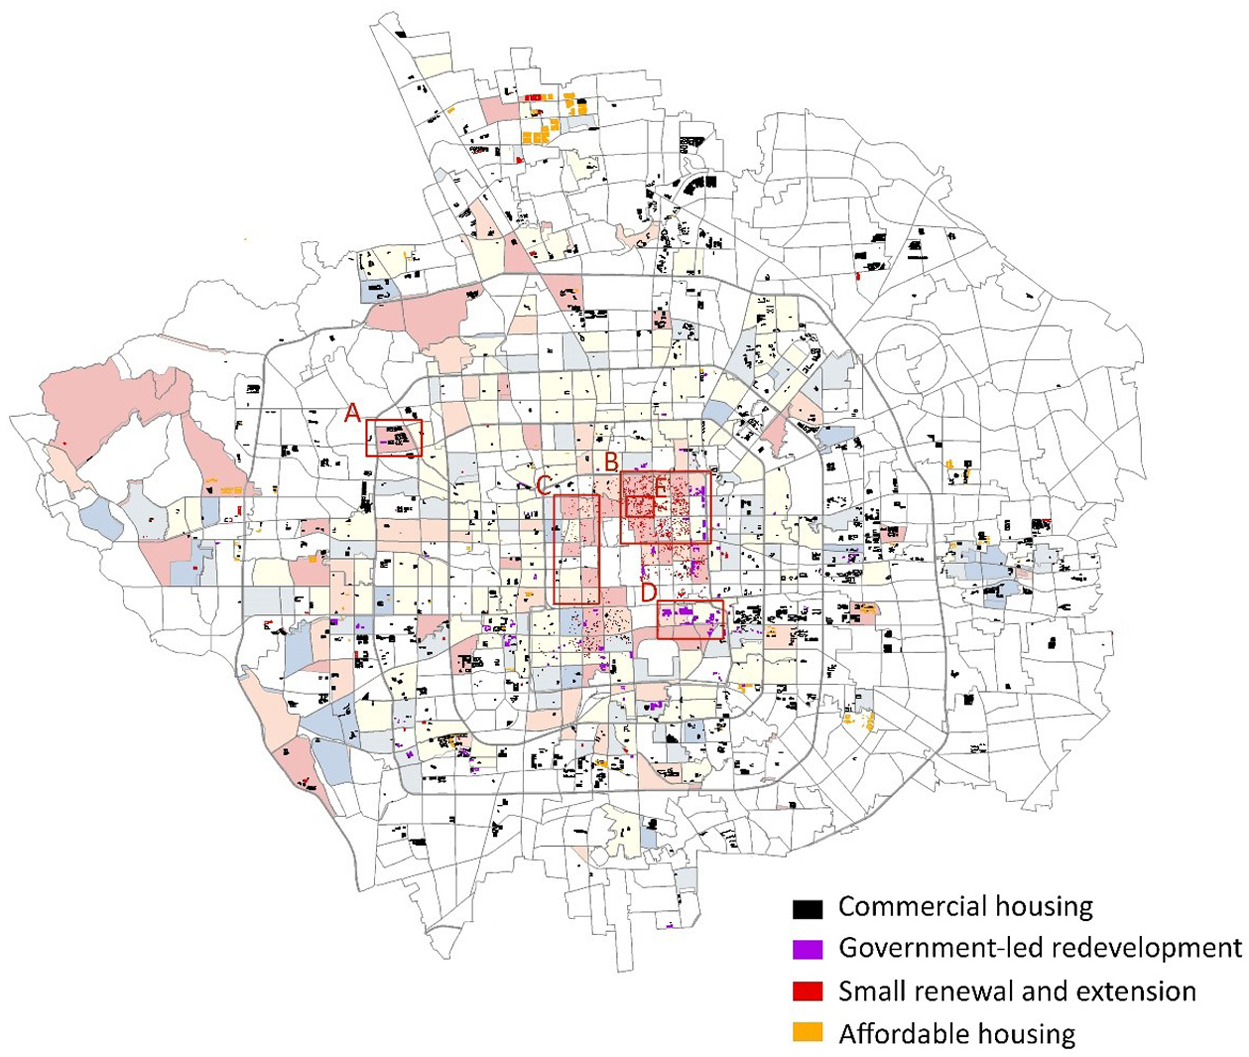
Housing (re)development projects and social changes.
It can be observed that most of the TAZs with an apparent amount of development showed more or less social upgrading. For instance, a large proportion of the TAZs at the north-western corner of the fourth ring road (zone A) and those in the north-eastern part of the old city (zone B) were (re)developed. Correspondingly, all of these TAZs experienced more or less social upgrading. Statistical analysis shows that there is significant correlation between the volume of construction (excluding affordable housing) and the SRI (p < 0.05).
However, it should be noted that some TAZs without an apparent amount of development also showed significant social upgrading, for instance those in the western part of the old city (zone C). As mentioned before, field survey is needed for a detailed and concrete explanation of what actually happened in the process. Nonetheless, part of the explanation can be related to the monetarisation of the access to high quality public services, especially top primary schools, which will also be further discussed later in the text.
Generally speaking, the correlation between housing construction and social upgrading indicates that the opening-up of the real estate market and the monetisation of housing allocation after the economic reform of China are playing a big role in the socio-spatial restructuring. Before the market reform, urban households in China had homogeneous income, social welfare and minimal segregation in urban areas, in accordance with the egalitarian ideology (Wu and Li, 2005). The so-called work units (Danwei in Chinese), which were state-owned enterprises, factories, etc., were in charge of housing construction and distribution for their staff. In this work unit-based housing system, cadres and general staff lived in the same area close to their workplace, regardless of social status (Li and Wu, 2006; Zhou and Logan, 1996). However, the economic reform since 1978 and the housing monetisation reform since 1998 have dramatically changed the socialist egalitarian regime. In this market system, it is not surprising that the development of commercial housing would result in the displacement of poorer residents by those with higher purchasing power. Actually, the housing price in Beijing had soared after the reform. It was estimated that a 1% increase in the speed of GDP growth was related to a 20% increase in housing prices from 1998 to 2010 (Chen et al., 2013). Particularly in the old city, which is the most central part, the housing price increase was even fivefold in this period. In this situation, even if the original residents can be paid a large amount of money by the developers for taking over their houses, they are not very likely to be able to afford the redeveloped houses and move back, and even less so the tenants.
However, not all housing development and social upgrading happened through the straightforward process of land purchase and displacement. Instead, as mentioned before, some (re)development projects involved complicated interactions among the local authority, the developers and the local residents. For instance, the weigai projects, launched by the local authority, aimed to improve the living conditions of the residents in the old ramshackle buildings and were designed to relocate most former residents back to the original site or close by after the redevelopment. However, faced with the profitability requirement of private developers that implemented the projects, thousands of households were relocated to outlying suburban locations to leave enough land for commercial housing development (He, 2007; Shin, 2016; Wang and Lau, 2009; Wu and Li, 2005). Consequently, many weigai projects ended up transforming the presence of low-income residents in many areas in the city centre into a larger presence of high-end buildings and upper-income residents, which can be observed in the TAZs in zone D.
For another instance, small renewal and extension projects were also launched by the local authority as a new approach to urban redevelopment, featuring small-scale and self-directed renovation, restoration, maintenance and infill projects (Fang, 1999; Zhang, 1996). Since no large-scale demolition and reconstruction would be involved, they were supposed to induce minimal change to the social composition of the original neighbourhood. However, to raise funds for upgrading the infrastructure, beautifying the streets and providing subsidy for residents, the local authority (usually through a government-sponsored property management company) still needed to make revenue from the projects. Funds were raised by clearing out several courtyard compounds and then selling or renting them out as luxury properties or office spaces. Therefore, it is also observed that many of the areas with a large number of small renewal and extension projects also experienced social upgrading (zone B). For example, in the case of the Nanluogu Alley (zone E), approximately 1300 households were displaced (Lv, 2012), and the SRI was 1.4 (for a detailed investigation of this case, please refer to Shin, 2010).
The experience of weigai and small renewal and extension projects further demonstrates the growing power of the market in housing provision and distribution in post-reform China. Both of the two schemes were introduced to benefit the original residents and minimise displacement. However, in order to provide economic stimulus for various interested parties, the market value of these properties was leveraged as a major funding source, at the expense of displacing low-stratum residents.
As mentioned before, the social upgrading in TAZs without an apparent amount of housing (re)development could at least partly be related to the access to high quality public services, which also experienced monetarisation in the market reform. Specifically, the access to education resources, especially top primary schools, became an important driver of socio-spatial changes, which may work jointly with physical constructions, or just independently. In Beijing, primary schools can be categorised into three strata: city-level top schools, district-level top schools and non-top schools. For historical reasons, top schools are mainly located in the old city, which was the political and cultural centre, and the north-western part of the city, where top universities and research institutes are located (Figure 6). Thirty-two of the 47 city-level top schools are located in these two areas, while their total land area is only 39% of the entire central city. Correspondingly, 66% of the TAZs in the old city and the north-western part of the city experienced social upgrading, while the proportion of upgraded TAZs was 46% outside these areas.

The locations of city-level top schools.
The spatial distribution of top schools had an influence on the socio-spatial landscape due to the existence of the school zoning policy, which requires that only registered residents in a school’s catchment area can be enrolled to the school (Wu et al., 2015). Since education is a critical social field for the strategic formation and maintenance of middle-class status (Butler and Robson, 2003), well-off middle-class parents are willing to purchase an apartment in the catchment zone of a top elementary school at an inflated price and after finishing the education, sell it on to a new family at a virtually guaranteed good price (Wu et al., 2015). As a result, properties in the catchment areas of top schools gain premium prices, which low-stratum households usually cannot afford. Hence, these top-school-qualified neighbourhoods are gradually taken over by high-stratum households. It is estimated that being in the catchment area of a leading primary school caused an 8% premium on the housing price in 2011 and that the appreciation speed was 1.5 times that of the others (Hu et al., 2014). Therefore, in the process of housing commodification in China, the access to some location-based resources can also be commodified and reflected in the housing price, which also reflects the influence of market reform.
Conclusion
In this article, fine-grained travel survey data are transplanted from their original use to analyse the changes of the socio-spatial differentiation in Beijing. Our work addresses the gap in prior studies on Chinese cities, which were mostly conducted at the sub-district level and were not fine-grained enough. The TAZ-block-level results allow us to perform a more detailed examination of the changes and mechanisms of the socio-spatial restructuring in Beijing, some of which would otherwise be averaged out.
The results reveal a dramatic transformation of the socio-spatial landscape in Beijing in only five years between 2005 and 2010 – 90% of blocks show a greater than 10% increase or decrease in the average social stratification index of their residents. There was a general trend for high-stratum households to move from the outer areas of the city to the redeveloped city centre or to areas with access to good education resources, while the low-stratum groups were squeezed out of the city centre to the urban peripheries. These findings confirm the prior research that social space in urban China has been experiencing fundamental reorganisation in line with the economic reform (Wu and Li, 2005). This study goes one step further to measure and visualise these changes in quantitative terms. The socio-spatial changes can to a large extent be related to the market reform of China’s economy and housing distribution. However, the influence of marketisation does not always happen through the straightforward process of land purchase, commercial development and displacement. Some (re)development projects may involve complicated interactions among the public sector, the developers and the residents, which in another way demonstrate the growing power of the market in housing provision and distribution in the post-reform era.
There are some caveats to our work. First, the data sets do not contain large samples at the level of detail reported. The average number of sample households is 73 in each TAZ, which may include large margins of error, as in the case of the American Community Survey (Spielman and Singleton, 2015). Although clustering methods could help mitigate this problem by using ensembles of variables, the risk of potential error should not be overlooked (Spielman and Singleton, 2015). Second, the two data sets are only five years apart, which is not long enough to demonstrate a long-term trend. Hence we are not able to confirm whether the socio-spatial restructuring in the studied period was accelerated or slowed down compared with earlier stages of the market reform. Besides, due to the lack of comparable data both in China and abroad, it is also hard to tell whether the observed changes were dramatic or moderate compared with the experience of cities in other contexts. Third, as mentioned before, more fieldwork is needed to obtain comprehensive knowledge on the full story of neighbourhood transformation, such as the socio-economic profiles of displaced residents and new occupiers and the gains and losses of interested parties. Future research can help deepen the understanding on this topic by examining longer trends or the detailed processes that contribute to the socio-spatial changes.
Footnotes
Declaration of conflicting interests
The author(s) declared no potential conflicts of interest with respect to the research, authorship, and/or publication of this article.
Funding
The author(s) received no financial support for the research, authorship, and/or publication of this article.