



Abstract
Geography of innovation, creative clustering, urban buzz and innovation districts are place-based concepts that have emerged as a result of the US economy’s transformation to knowledge-intensive economies. The notable built environment characteristics of these concepts are spatial clustering, walkability and proximity to urban amenities, diversity, regional connectivity and agglomeration. While several of these characteristics have been associated with urban sprawl in previous studies, there is a lack of direct evidence on how urban sprawl affects innovation productivity. This national study seeks to examine the relationship between urban sprawl, place-based characteristics and innovation productivity. We used Multilevel Modelling to account for built environment characteristics at both neighbourhood and regional levels. We found that innovative firms tend to locate more in census tracts that are less compact but offer spatial proximity to firms in related business sectors. This is likely due to the higher land and property value in compact areas, which could make it unaffordable for small businesses. We also found that the regional compactness positively and significantly affects the number of innovative firms. This is likely due to the role of compact regions in supporting public transit investments, enhancing social capital and reducing poverty and racial segregation.
Introduction
It is evident that in recent decades the US economy has become more knowledge intensive (Powell and Snellman, 2004). The traditional economy used to rely on factories, mass manufacturers and an intensive labour force, while the modern knowledge economy relies heavily on entrepreneurs, educational institutions, innovative businesses and talented human capital (Morisson, 2015). This transformation has also been a topic of interest for urban planners and policy makers seeking to understand how urban form can support knowledge production and innovation (Katz and Bradley, 2013). California’s Silicon Valley and Boston’s Route 128 Technology Corridor are examples of the influence of location and urban setting on innovation generation.
Much of this research focuses on cities and metropolitan areas, as regional industry clusters act as key drivers of the national and global economy (Currid, 2008; Scott and Storper, 2003). Like other industry clusters, creative and knowledge-based firms tend to co-locate in order to benefit from larger markets, thick and specialised labour pools and knowledge spillovers, which are made possible through formal and informal networking opportunities (Scott, 2000). Knowledge intensive and creative firms and workers are particularly drawn to cities because of their social and economic diversity, urban environments and high quality amenities (Florida, 2002). Therefore, cities may catalyse agglomeration dynamics, leading to enhanced learning, innovation and productivity across industry clusters (Chatman and Noland, 2014).
However, at the local scale, place-based clusters in the form of creative districts, hubs and quarters are also theorised to support innovation productivity by supporting face-to-face contact and knowledge exchange (Currid, 2008; Storper and Venables, 2004).
The notions of ‘geography of innovation’, ‘creative clustering’ and more recently ‘industrial districts’ have emerged, as a result of this trend, where the goal is to provide supportive built environments that attract innovative industries and offer quality work and life experience for the creative class (Florida, 2002; Katz and Wagner, 2014; Morisson, 2015; Porter and Stern, 2001). Some of these studies focus on the built environmental preferences of the creative class as talented human capital (Florida, 2002, 2014). Others apply foundational urban economic theories which focus on business clustering and business location decision making (Fischer, 2006).
The majority of these studies point out the place-making characteristics that lead to mixed use, walkable and transit-accessible developments coupled with proximity to the leading-edge educational institutions and talented human capital (Katz and Wagner, 2014). Diverse, mixed use developments enabling the co-presence of innovative anchors, incubators, hubs and start-ups as well as walkability and third places are considered vital for informal networking, knowledge exchange and innovation spillovers (Katz and Wagner, 2014). The attractiveness and ‘authenticity’ of a place is also assumed to support the creative milieu (Coll-Martínez and Arauzo-Carod, 2017; Silver, 2012).
Compact (as opposed to sprawling) developments are often characterised by walkability, a mix of land uses, local and regional accessibility and quality place-making that would support public transit (Ewing and Hamidi, 2017), enhance social capital (Ewing et al., 2016; Nguyen, 2010) and reduce poverty and racial segregation (Bramley and Power, 2009; Margo, 1992; Wheeler, 2006).
While existing literature has addressed how these characteristics are related to innovation and overall economic development at different scales (e.g. Bettencourt et al., 2007; Carlino et al., 2007; Glaeser, 2011), the relationship between compactness and innovation productivity is under-investigated.
This national study aims to address this gap by examining the relationship between compactness and innovation generation. Using Multilevel Linear Modelling (MLM), we accounted for the degree of compactness at both neighbourhood and regional levels. This study also employs disaggregated data on innovation awards from the Small Business Innovation Research (SBIR) programme coordinated by the Small Business Administration (SBA). Since 1982, the SBIR programme has awarded and continues to award competitive federal grants to innovative small businesses (Black, 2005). Our study covers a 15-year time frame and includes all SBIR-awarded firms from 2000 to 2015. One great advantage of using SBIR over other databases is the fact that it is designed to support small businesses which otherwise could not compete with large firms such as Google and Apple. While the disaggregated SBIR data offer the opportunity for such study at the national level, it is important to note that innovation awards are just one measure of innovation productivity and could not be generalised to other innovation outputs such as patent data, or measures related to the process of innovation such as start-ups. We gathered neighbourhood-level data from various sources and we used the widely cited Ewing and Hamidi (2014) metropolitan compactness index for the measure of urban compactness.
Drivers of innovation capacity
A large number of studies have addressed different factors that contribute to innovation capacity. These studies suggest social and human capital (e.g. reciprocity, trust, skills, education) as the building blocks of innovation generation, creating a reinforced effect on innovative capacity (Dakhli and De Clercq, 2004). In addition, sociodemographic diversity (e.g. foreign-born people, racial, income and sexual diversity) has been shown to be the subject of particular attention in recent years (Florida et al., 2008; Qian, 2013).
Equally important at the regional scale, previous studies highlighted the role of university RandD and research expenditure that, while contributing to agglomeration economies through RandD spillovers, could be conducive to innovation productivity as its primary engine (Audretsch and Feldman, 1996; Furman et al., 2002). Black (2005), for instance, investigated the impact of RandD activities on small firm innovation productivity and found that universities and private firms could lead to the sustained growth of innovation capacity through their RandD activities (Black, 2005).
In addition to these factors, the importance of location for innovation generation and the emergence of place-based innovation theories stem from several leading and historical trends. One significant contributor to the emergence of innovation districts is the change in American family preferences and structure. Residential preferences changed substantially in recent years as a result of socio-demographic shifts such as delayed marriage, smaller numbers of children in the family and smaller household sizes. These changes led to an increasing preference for living in compact and walkable neighbourhoods (Nelson, 2013). The preference for a walkable distance to retail, cultural and educational institutions is even greater for the creative and educated class (Florida, 2002). Walkability is also recognised as an important factor for university-educated millennials when they choose a place to live and work after graduation (Leinberger, 2013).
According to Florida, the educated working class and creative human capital are the generators of creative economies (Florida, 2002). High-tech firms and businesses follow the knowledge workers; thus they tend to relocate to denser, more compact and more accessible urban areas (Ranft and Lord, 2000). Therefore, the areas that offer appealing living environments for them are more successful in attracting knowledge intensive companies, which in turn results in higher innovative activities and more economic prosperity. While this line of research share argues that knowledge-based and creative firms follow knowledge and creative works, Storper and Scott (2009) argue that the presence of anchor businesses and institutions is the force influencing skilled labour mobility and consequential growth. While scholars continue to debate who came first and who initiated the growth, there is a consensus regarding the key role of location- and place-based characteristics in innovation productivity (Jacobs, 1969; Storper and Venables, 2004).
From the scholarly standpoint, investigation of the link between location and innovation has begun by accepting the existence of spatially-mediated knowledge spillover. Jacobs (1969), and more recently Katz and Bradley (2013), documented the necessity of spatial proximity for industries, businesses and universities in order to have access to human capital and flow of knowledge with lower marginal costs (Jacobs, 1969; Katz and Wagner, 2014). A large body of associated research confirmed geographical concentration (clustering) among the innovative activities of firms, referring to creative clustering, geography of innovation, global cities and, more recently, innovation districts (Acs et al., 2002; Audretsch and Feldman, 1996; Jaffe, 1989).
Global cities are megacities where highly specialised skilled workers in accounting, advertising, banking and law work, live and interact (Sassen, 2013). Recently, the built environmental characteristics of global cities have become a focus of attention (Hall et al., 2011).
At the regional and local levels, creative clustering refers to the geographical concentration of creative industries such as the art, architecture, design and communication sectors (Wood and Dovey, 2015). Creative industries are not necessarily innovative. Innovation in the economic terminology (referring to Schumpeter’s aforementioned definition) is a broader and more inclusive phenomenon that contains creative industries, STEM (science, technology, engineering and science) industries and KIBS (knowledge intensive business services) (Markusen et al., 2008).
More recently, innovation districts have been introduced as compact, transit-accessible areas that provide a mix of housing, offices and retails. Innovation districts bring together leading-edge research institutions and high-tech companies and connect them to start-ups, business incubators and accelerators (Katz and Wagner, 2014). As a result, innovation districts facilitate innovation generation through creating, attracting and retaining the creative class and knowledge-intensive companies (Morisson, 2015; Stimson et al., 2006).
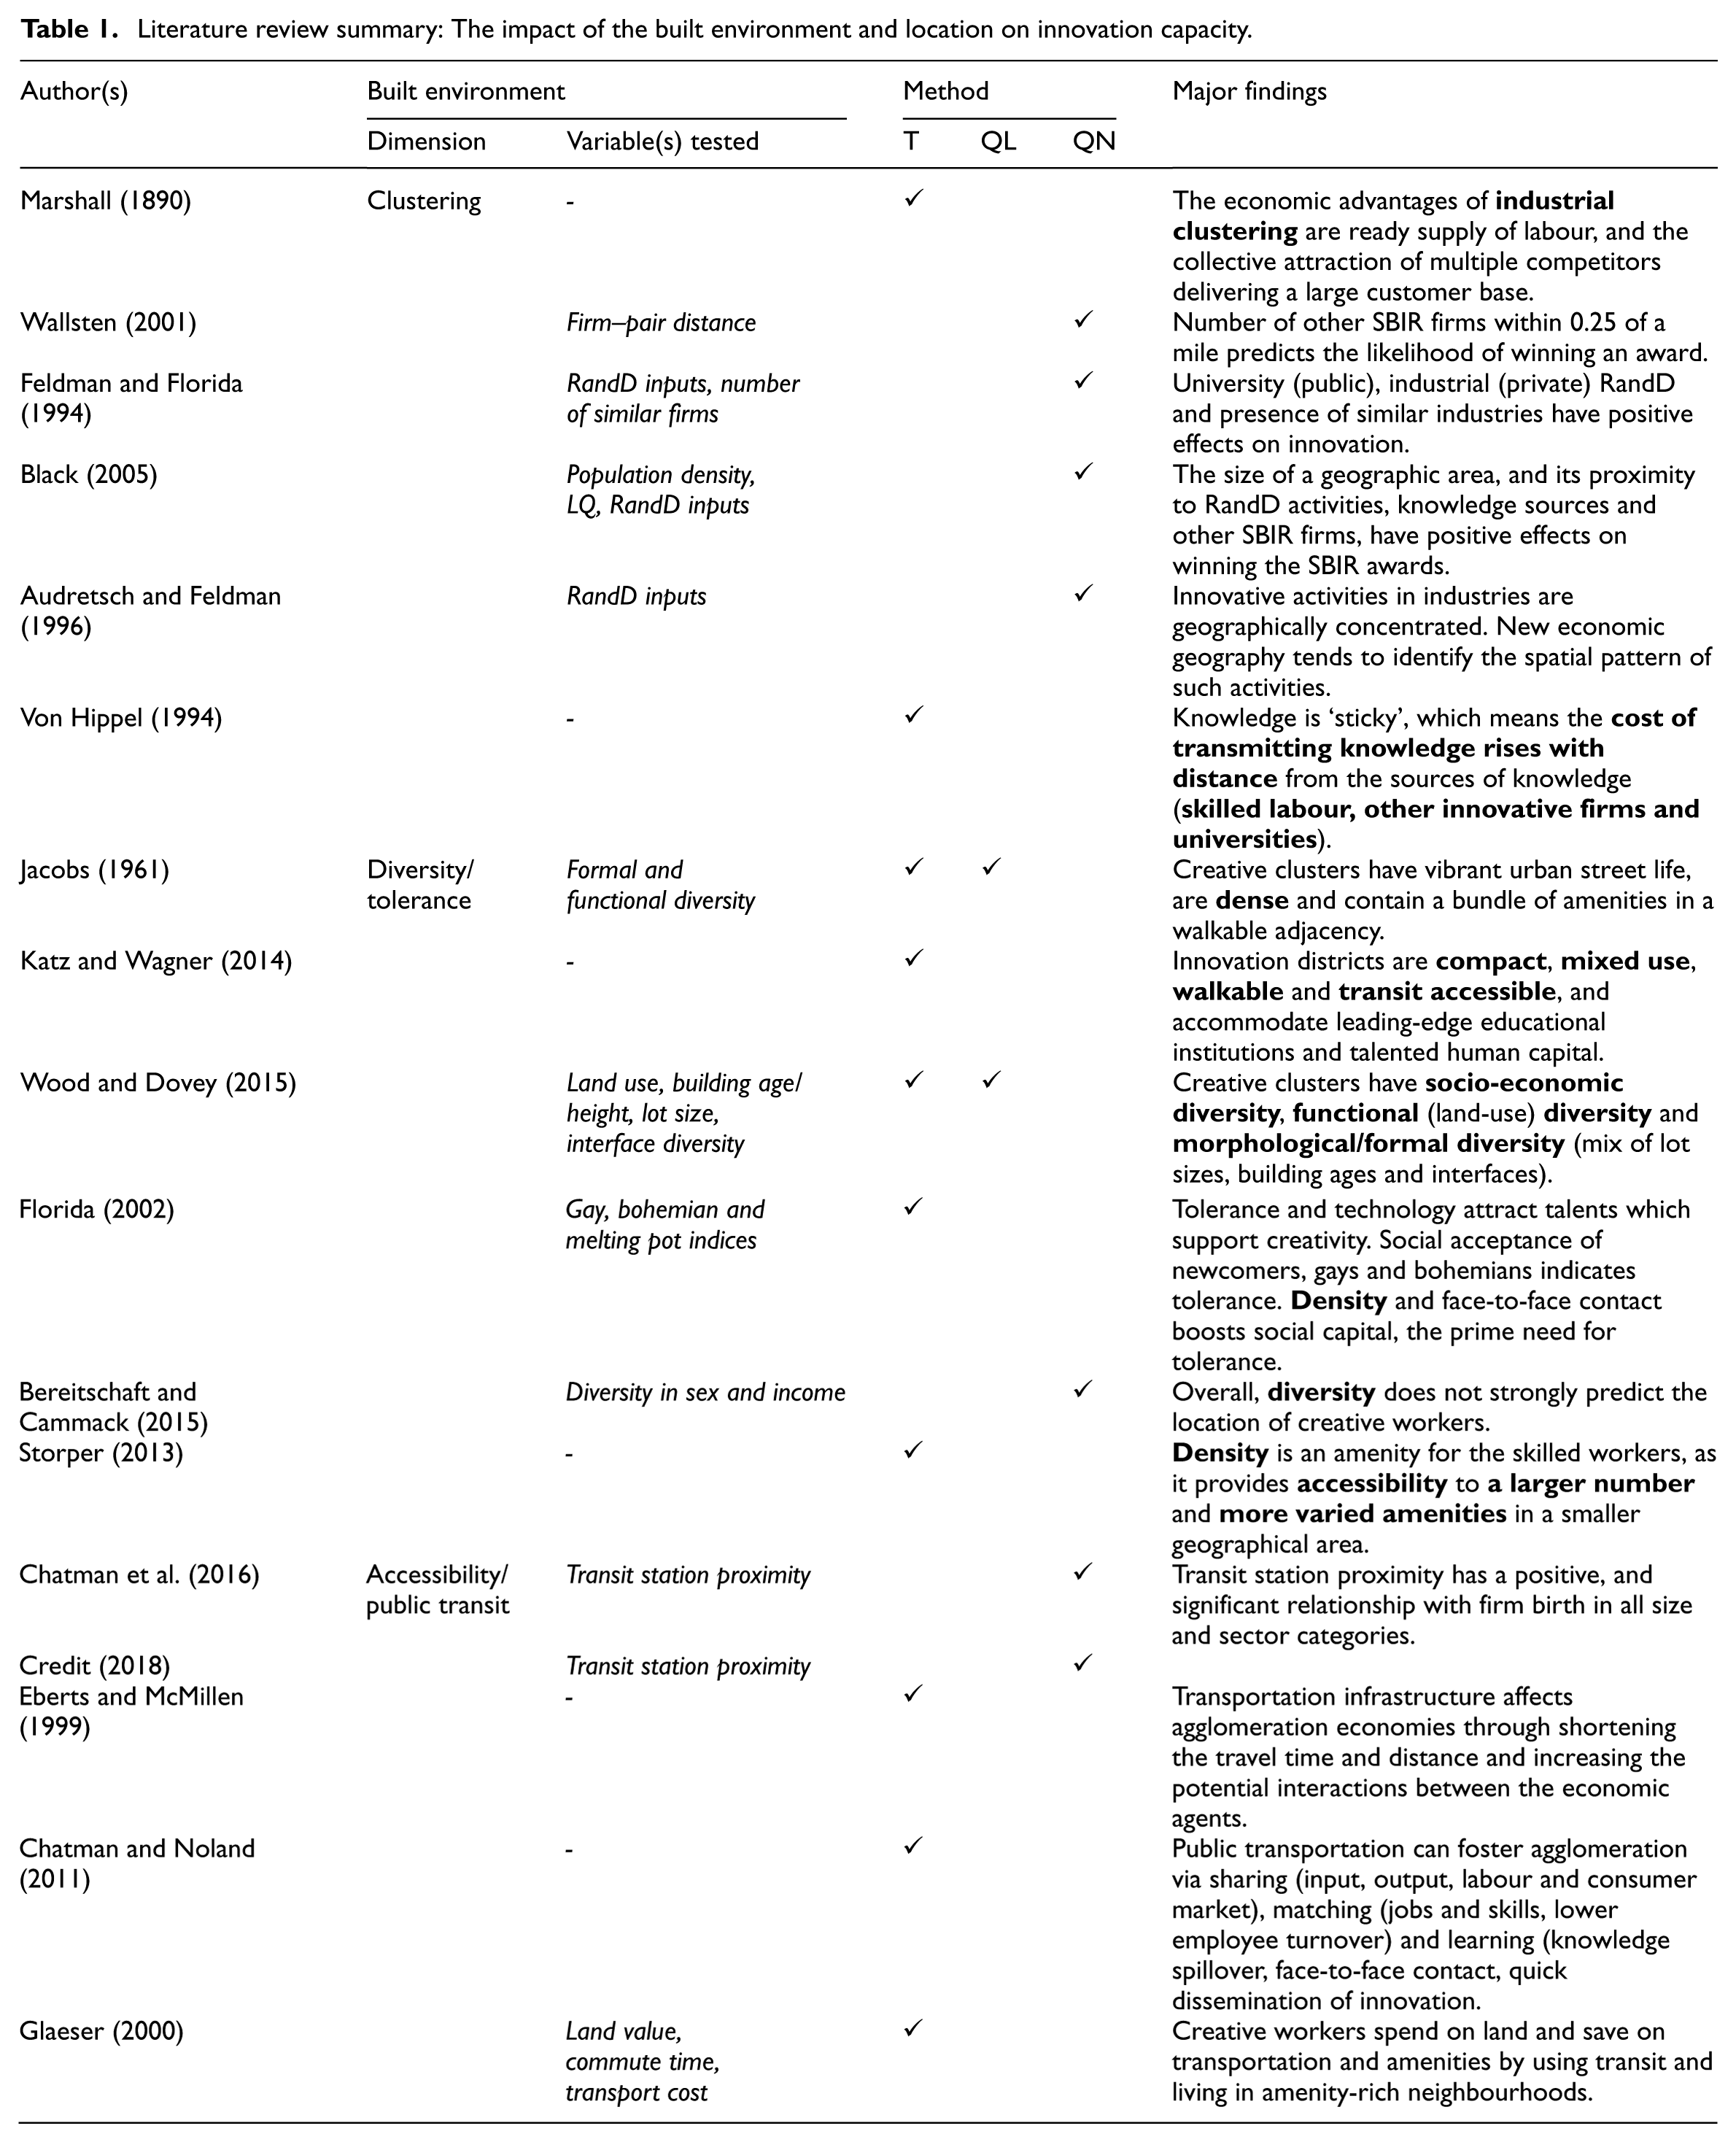
The notions of innovation districts, creative clustering and geography of innovation have one goal in common. Along with studies summarised in Table 1, they emphasise the role of place-based characteristics such as accessibility, spatial proximity, walkability, mixed land use, third places and aesthetics in attracting knowledge-based workers, firms and, consequently, innovation generation. A large body of literature also links these place-based characteristics to urban development patterns such as urban sprawl and compactness. In the next section, we review these studies and explain the possible associations between urban sprawl and innovation productivity at different geographical scales.
Literature review summary: The impact of the built environment and location on innovation capacity.
Innovation capacity and compact urban development
Previous attempts to understand the geography of innovation, most often, have identified spatial proximity as the key driver of innovation through catalysing agglomeration dynamics and knowledge spillover (Ashiem and Gertler, 2005; Romijn and Albaladejo, 2002). Spatial proximity is also a key characteristic of urban compactness, which demonstrates an indirect possible relationship between compactness and innovation productivity. To better investigate this relationship, it is necessary to first define compactness and its components.
Previous studies have defined compactness (as opposed to urban sprawl) as a development pattern that demonstrates moderate to high density, a mix of land uses, the presence of strong centres and high levels of accessibility (Ewing, 1997; Ewing and Hamidi, 2015; Galster et al., 2001). While compactness includes each of these prototypical characteristics, it could be related to innovation capacity in several ways and at different geographical scales.
The first and more obvious association of compactness and innovation capacity is through providing higher accessibility and spatial proximity. The proximity or, to use a broader term, ‘accessibility’ of industries, business services and anchor institutions is a driving force for innovation (Blind and Grupp, 1999; Sternberg and Arndt, 2001). Accessibility provides networking opportunities for these entities through increased interactions, collaborations and knowledge spillover (Credit, 2018). Metropolitan sprawl is characterised in the literature as areas with poor accessibility. In scattered and commercial strip development, the consumer must pass other uses on the way from one store to the next – the antithesis of multipurpose travel to an activity centre. In sprawling and single-use development, everything is far apart because of large, private land holdings and segregation of land uses. In sprawl, poor accessibility between land uses may leave residents with no alternative to miles of automobile travel. Compact areas with stronger transportation accessibility foster networking opportunities between people via the enhancement of social capital (Nguyen, 2010). In contrast, the less dense nature of urban sprawl could provide less opportunity for knowledge flow and interaction between innovative people, resulting in less innovation and knowledge production.
Second, several studies have documented the role of compact areas in providing pedestrian-friendly places, urban social life and higher quality-of-life outcomes (Ewing and Hamidi, 2017), which in turn would attract educated millennials as the driving force behind knowledge production and an innovation-based economy (Florida, 2014; Glaeser et al., 2001; Leinberger, 2013; Nelson, 2013). Quality place-making and mixed use developments could also maximise social and cultural exchange, thus increasing networking opportunities and knowledge spillovers, leading to stronger social capital (Freeman, 2001; Leyden, 2003). Therefore, denser neighbourhoods can provide better access to human and social capital which would both affect innovation capacity (Dakhli and De Clercq, 2004; Zheng, 2010).
Third, the role of regional compactness in enhancing innovation capacity can be explained through discouraging poverty and racial segregation in dense and compact regions. According to Richard Florida (2002), tolerance (and socioeconomic diversity) is a key ingredient in creative class theory (along with talent, technology and the recently added quality of place) that denotes openness, racial diversity and social inclusion. With this widely accepted definition, existing literature suggests a positive relationship between racial diversity, social inclusion and human capital and innovation (Florida et al., 2008; Qian, 2013). The existing literature also suggests that sprawling regions discourage tolerance and diversity and, in contrast, promote segregation (Bramley and Power, 2009; Margo, 1992). For example, Wheeler (2006) conducted a statistical analysis inquiring if urban decentralisation and income inequality were associated with one another. The study found an inverse relationship between urban density and the degree of income inequality within metropolitan areas, suggesting that as cities spread out, they become increasingly segregated by income (Wheeler, 2006).
While there are many reasons to believe that urban sprawl has a significant impact on innovation capacity at different geographical scales, there is little empirical evidence on the exact and direct nature of the relationship. This study seeks to address these gaps by employing multilevel modelling techniques and gathering data from various sources at the neighbourhood and regional levels. In the next section, we will explain the data, variables and methodology.
Methods
Sample
The sample in this study is limited to all census tracts in medium and large metropolitan areas and metropolitan divisions where the compactness indices are available. It initially included a total of 228 areas with a 2010 population of more than 200,000. Parenthetically, a total of seven metropolitan areas and divisions were ultimately dropped from our sample due to the lack of local employment household dynamics (LEHD) data, a key data source for measuring sprawl. These metropolitan areas, or a portion of them, are located in Massachusetts, which does not participate in the LEHD programme. This reduces the final sample size to census tracts in 221 MSAs (Metropolitan Statistical Areas) and metropolitan divisions. Therefore, our sample consists of 49,673 census tracts that are nested in the 221 MSAs.
Data and variables
The complete set of the variables’ definitions and data sources is presented in Table 2.
Variables’ description and data sources.
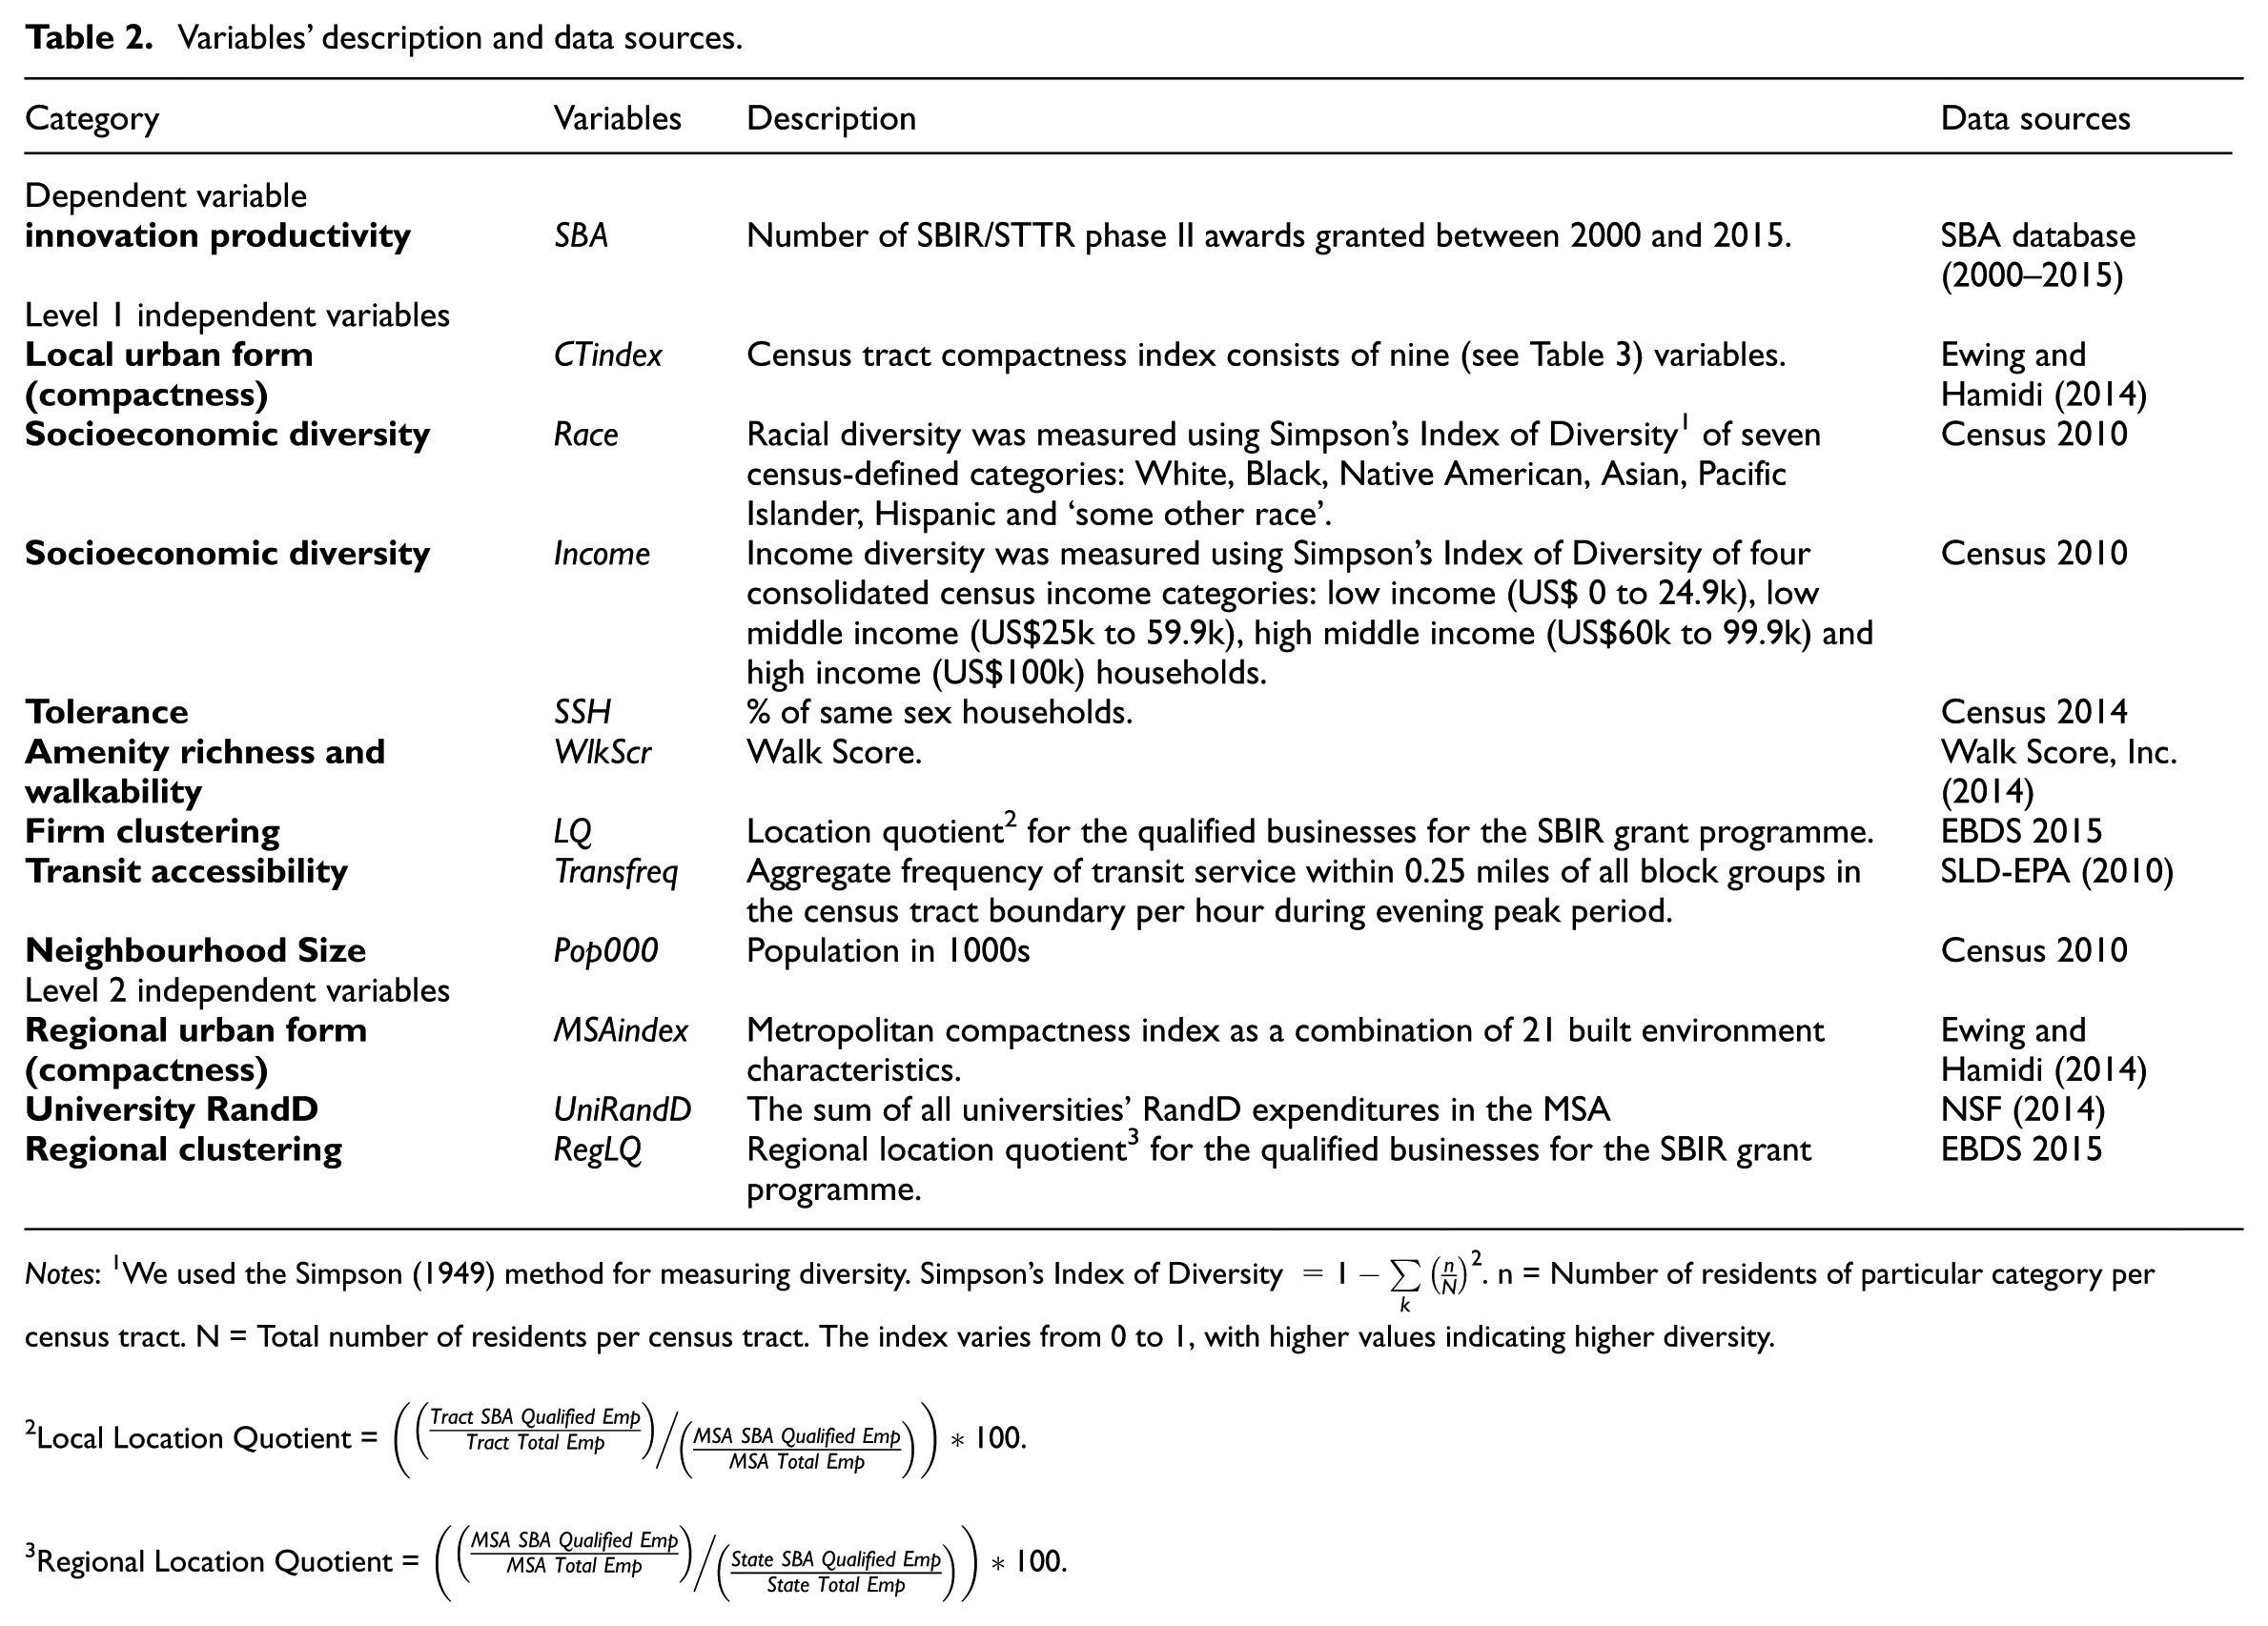
Notes: 1We used the Simpson (1949) method for measuring diversity. Simpson’s Index of Diversity
Local Location Quotient =
Regional Location Quotient =
Neighbourhood-level innovation capacity
Our dependent variable is the number of innovation awards in each census tract as obtained from the SBA. The SBIR database is one of the most widely used measures of innovation capacity under the innovation counts category (Feldman and Florida, 1994; Wallsten, 2001). The SBA serves as the coordinating agency for two national innovative award programmes: SBIR and Small Business Technology Transfer (STTR). Both recognise innovative activities accomplished by small businesses. SBIR awards are given to innovations developed solely by small businesses, while STTR awards are given to collaborative innovative activities between small businesses and research institutions. SBIR and STTR awards are granted in three phases.
Phase I recognises innovative concepts from small businesses. At this phase, the feasibility of the idea and proof of concept are assessed.
Phase II covers the full research and development for a prototype among Phase I grantees.
Phase III is the commercialisation phase. Phase I/II grantee products, services, technologies or processes are produced and delivered.
In this study, we use the SBIR and STTR database as our measure of innovation capacity. In comparison with other measures, the SBIR and STTR database is inclusive and does not favour large companies as the RandD database does. Also, it evaluates and recognises innovation for both process and product through a competitive three-phase assessment method from proof of concept to development and commercialisation. Our study includes both SBIR and STTR phase II between 2000 and 2015. The SBA provides a substantial award in phase II to research and development of an innovation. The 15-year time frame allows us to obtain a consistent measure of innovation awards rather than relying on a single-year data.
Measuring compactness
This study accounts for the level of urban compactness at both local and regional levels. At the regional level, we used the metropolitan compactness index developed by Ewing and Hamidi (2014). Developing indices to measure sprawl/compactness at MSA and county levels began over a decade ago, when Ewing et al. (2003), among other scholars, represented compactness and sprawl as opposite ends of the urban development spectrum. Ewing et al.’s (2003) compactness indices have been widely used by other scholars to study how sprawl/compactness is related to a range of quality-of-life outcomes such as housing affordability; traffic congestion; traffic safety; open space preservation; physical activity and obesity; social capital; air quality; housing and transportation affordability and upward mobility (Ewing et al., 2016). Studies often reported negative outcomes of sprawl, although some exceptions exist (see, for example, Holcombe and Williams, 2012). In a recent attempt, Ewing and Hamidi (2017) updated and refined sprawl/compactness indices using the most recent data. In line with the earlier study, the metropolitan compactness indices consist of 21 built environment variables of four distinct dimensions: development density, land use mix, population and employment centring, and street connectivity. These refined indices incorporate more variables and have more validity as compared with those developed a decade earlier. The indices were constructed so that the more compact a metropolitan area was, the larger its index value. In this study, we utilised the refined indices to measure compactness.
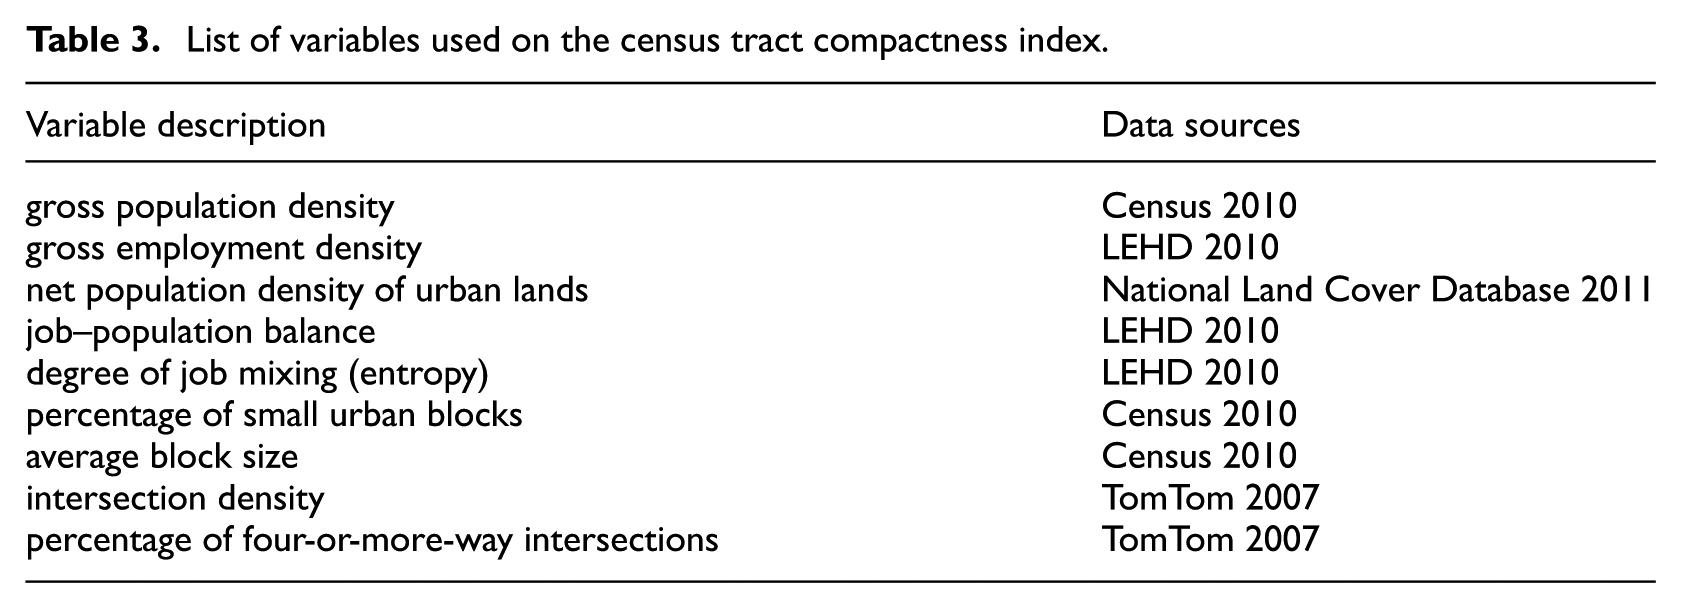
To control for compactness at both local and regional levels, we used sprawl-like metrics for census tracts within metropolitan areas developed by Ewing and Hamidi (2014). The census tract is equivalent to an individual’s neighbourhood. This index places urban sprawl at one end of a continuous scale and compact development at the other and consists of six variables representing development density, land use mix and street connectivity. To develop this particular index, Ewing and Hamidi (2014) extracted principal components from multiple variables using principal component analysis, and transformed the first principal component to an index with the mean of 100 and a standard deviation of 25. The larger the value of the index, the more compact the census tract. Table 3 shows the list of variables measured and combined to extract the census tract-level compactness index.
List of variables used on the census tract compactness index.
Other control variables
Other control variables include measures of socioeconomic diversity, tolerance, place-making, transit quality, firm clustering, the RandD input of high-tech industries and university RandD expenditure.
We used Walk Score as the measure of walkability and access to neighbourhood amenities. It was computed using data from Walk Score, Inc. to measure proximity to amenities with varying amenities weighted differently. The amenities included in this measure include grocery shops, restaurants, shopping centres, banks, coffee shops, parks, schools, bookshops and other entertainment destinations. Walk Score employs the distance decay function to discount amenities as the distance to them increases up to one mile and a half, where they are assumed to be no longer accessible on foot. The distance decay function starts with a value of 100 and decays to 75 per cent at half a mile, 12.5 per cent at one mile and zero at 1.5 miles.
We also accounted for transit availability and quality through the transit service frequency data retrieved from the Smart Location Database (SLD) developed by the Environmental Protection Agency (EPA). The transit service frequency dataset was calculated based on the average number of scheduled transit services per hour during the evening peak period (4.00 to 7.00 pm on a weekday) for all block groups in the US. We aggregated up the block group data and computed this variable at the census tract level.
We controlled for the level of specialised clustering in the area through developing location quotient indices at both census tract and MSA levels. Following the same methodology as Wallsten (2001), we estimated the location quotient indices for businesses that are eligible for the SBA programmes (see Table 2 for more details). We used the SIC codes for identifying these sectors. These sectors are as follows:
We computed the location quotient indices at both census tract and MSA scales using the firm-level data from ESRI Business Data Source 2016 (EBDS). Although scholars conventionally used Longitudinal Employer–Household Dynamics (LEHD) from the US Census Bureau data to control for the RandD of high-tech industries, our location quotient could provide a more precise indicator.
Employing the same methodology as the Simpson’s Index of Diversity, we also computed two measures of sociodemographic diversity including racial diversity and income diversity at the census tract level. Simpson’s Index has been widely used by other scholars studying neighbourhood diversity and the creative class (Bereitschaft and Cammack, 2015). Finally, we controlled for neighbourhood tolerance using the percentage of same sex households in the census tract. In Table 2, we explain the formula and computation details for these three sociodemographic indicators.
At the MSA level, we also controlled for the RandD of high-tech industries, university RandD expenditure and crime rate. We employed the 2011 Longitudinal Employer–Household Dynamics (LEHD) from the US Census Bureau, which is based on North American Industry Classification System (NAICS) codes for the RandD of high-tech sectors. The RandD of high-tech companies is computed as the proportion of high-tech jobs to population. As suggested by the literature, we included two high-tech sectors: 1) mining, quarrying and oil and gas extraction; and 2) manufacturing industries. We used Standard Industrial Classification (SIC) codes of 28, 35 and 36 as high-tech employment sectors (Acs et al., 2002) and converted them into NAICS. As for the university RandD expenditure, we gathered data from the publicly available 2011 National Science Foundation Business Research and Development and Innovation Survey. Using Geographic Information Systems (GIS), we aggregated and computed the university RandD expenditure at the MSA level.
Analytical model
As shown in Table 2 and Figure 1, the data used in this analysis have a ‘nested’ structure and should be analysed accordingly. Since the census tracts located in an MSA share the characteristics of that MSA, such as the metropolitan compactness index, they could not be treated independently of one another. The nesting feature causes the dependence among cases, violating the independence assumption of OLS regression. In this situation, the standard errors of regression coefficients associated with MSA characteristics based on OLS will then be underestimated, and regression coefficients themselves will be inefficient (Raudenbush and Bryk, 2002).
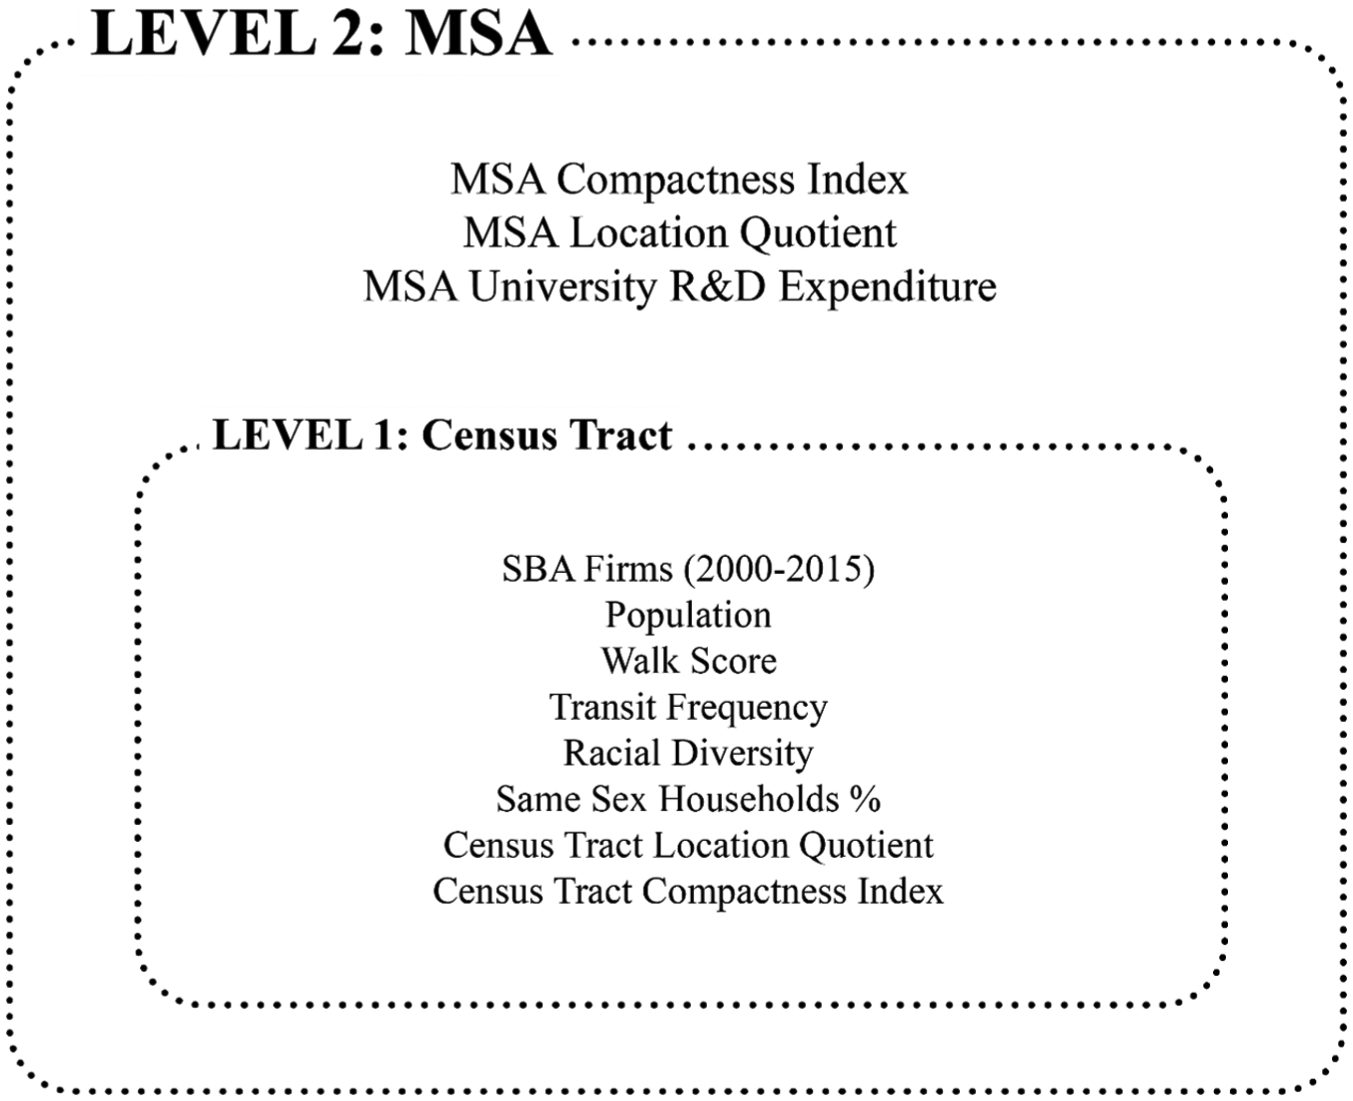
Conceptual framework showing the nesting structure of variables.
Multilevel Modelling (MLM) addresses the issue of nesting structure and dependence among cases and leads to more accurate coefficient and standard error estimates. In this analysis, the numbers of innovative firms were regressed on neighbourhood characteristics in level-1 models. The intercepts and coefficients of level-1 models were regressed on regional characteristics in level-2 models. Initially, we estimated two different models. In the first model, only the intercept was allowed to randomly vary across respondents, while all of the regression coefficients were treated as fixed. These are referred to as ‘random intercept’ models. Later on, regression coefficients were allowed to randomly vary across higher-level units as well, and interactions between levels were allowed. These are called ‘random coefficient’ models. As cross-level interaction terms seldom proved significant, we reverted to the random intercept model. Only this model is presented in the next section.
The other statistical complication relates to our dependent variable. Our dependent variable is the number of innovative firms (count data) in a census tract. Two basic methods of analysis are available when the dependent variable is a count, with nonnegative integer values, many small values and few large ones. These analysis methods are Poisson regression and negative binomial regression. The two models differ in their assumptions about the distribution of the dependent variable. Poisson regression is appropriate when the dependent variable is equidispersed, meaning the variance of counts is equal to the mean. Negative binomial regression is appropriate when the dependent variable is overdispersed, meaning that the variance of counts is greater than the mean. Popular indicators of overdispersion are the Pearson and χ2 statistics divided by the degrees of freedom, so-called dispersion statistics. If these statistics are greater than 1.0, a model is said to be overdispersed (Hilbe, 2011). By these measures, we have overdispersion of innovative firm counts in our dataset, and the negative binomial model is more appropriate than the Poisson model. Therefore, we employed negative binomial multi-level modelling in this study.
Results
We estimated a multi-level negative binomial model using HLM 6.8. The results of the best fitted model are presented in Table 4. The coefficients of most variables are significant and have the expected signs. The significant variables are in bold font.
Multi-level negative binomial regression analysis of innovation productivity, urban compactness and other environmental charactersitics.
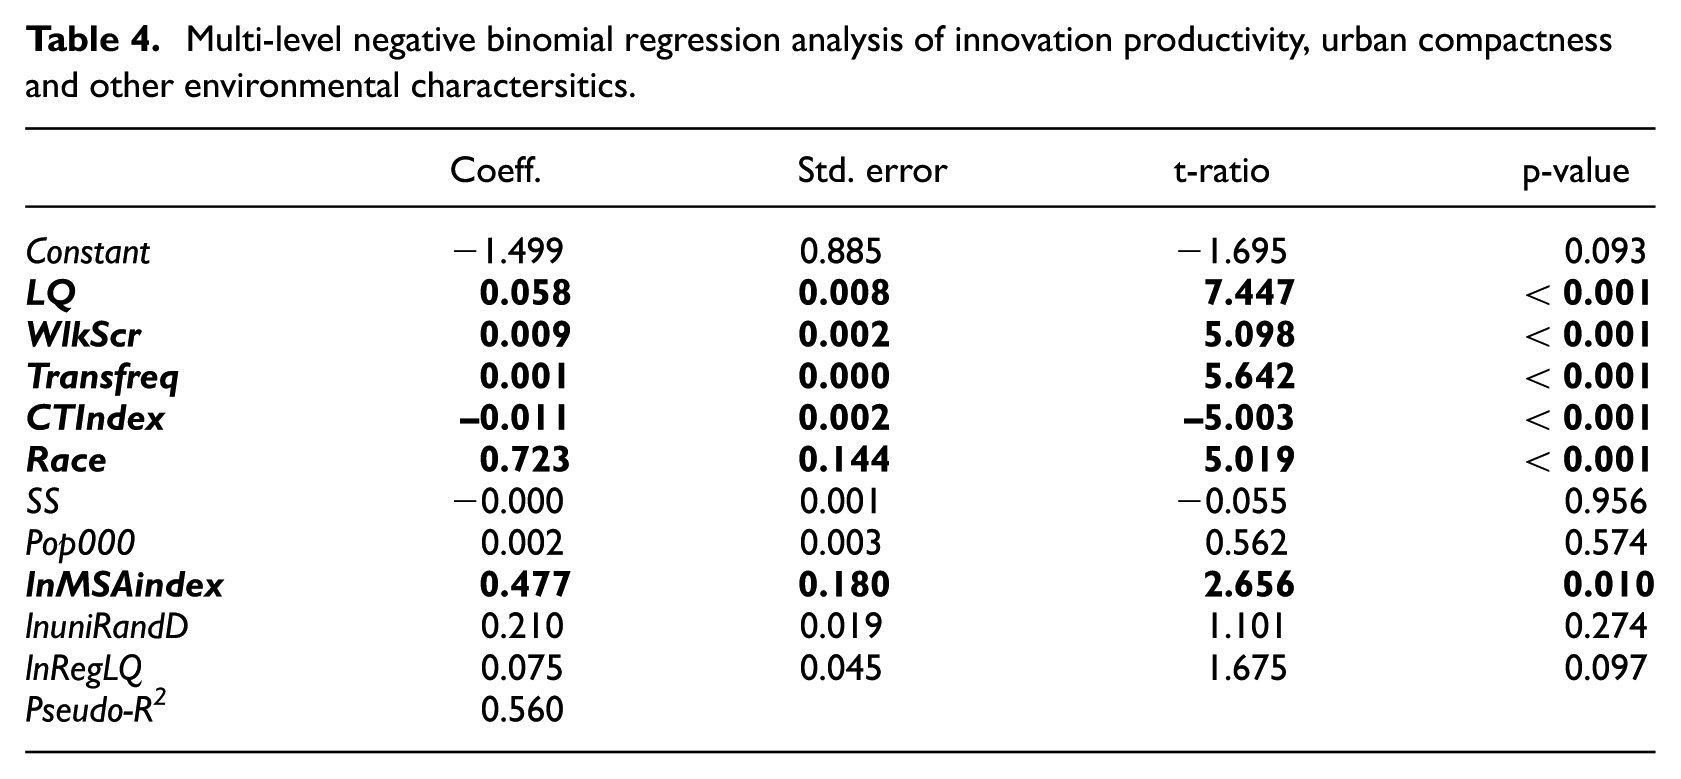
We found that the number of innovative firms in a census tract is positively and significantly associated with Walk Score, transit frequency, racial diversity and spatial clustering (location quotient). Walkable neighbourhoods attract more knowledge-based workers and provide more opportunities for face-to-face contact, and thereby facilitate knowledge spillover (Florida, 2002; Jacobs, 1969; Storper and Venables, 2004). We also found that neighbourhoods that enjoy access to quality transit services are more attractive for innovative small firms.
The most significant variable in the model is the location quotient, which indicates the importance of firm clustering above neighbourhood amenities on innovation productivity. Indeed, location quotient at both regional and neighbourhood levels has a relatively strong relationship with a neighbourhood’s number of innovative firms, although at the MSA level it approaches the significance level at 0.1. It confirms that Marshallian specialisation externalities favour a neighbourhood innovation capacity (Marshall, 1890). Small innovative firms tend to co-locate with firms in similar industries (Black, 2005).
At the regional level, our results suggest that compactness is more significant than firm clustering (location quotient) as it relates to small innovative firm locations. Sprawling areas are heavily car-dependent and hence do not accommodate regional accessibility (Florida, 2002; Katz and Wagner, 2014). Compact places increase the chance of social interaction, networking and knowledge spillover (Katz and Wagner, 2014; Leyden, 2003).
At the local level, we found other place-based characteristics suggesting that the compactness index has a significant and negative relationship with a census tract’s number of small innovative firms. One possible explanation is that locating in compact neighbourhoods would be unaffordable for small innovative firms due to higher property and land values in compact areas (Richardson et al., 1990).
Our findings regarding the significance of sociodemographic diversity characteristics on innovation productivity are mixed. While the number of small innovative firms in the census tract positively and significantly relates to racial diversity, its relationship to the percentage of same sex households is negative and not significant. This is in disagreement with Florida (2002) and other studies that recognise sexual diversity as a key indicator of tolerance that would attract creative industries and contribute to the creative clustering in the neighbourhood (Bereitschaft and Cammack, 2015). Our results suggest that sexual diversity may not play a significant role for the attraction of innovative industries. A racially diverse neighbourhood is more welcoming of skilled workers from a variety of races.
Finally, our model suggests a positive but insignificant relationship between university RandD expenditure at the regional scale and the number of neighbourhood-level innovative firms. Less than 10 per cent of SBA awards between 2000 and 2015 were allocated to university-business collaboration innovation. Thus, the collaboration between high-tech industries, particularly small businesses, and universities needs further research.
Discussion and conclusions
Compact developments often share many of the place-based characteristics presumed to support knowledge-based firm productivity, such as mix of uses, walkability and access to urban amenities, spatial proximity and accessibility, enhancing social capital, supporting public transit and encouraging social integration. Yet, there is very little research regarding the relationship between urban compactness and the productivity of innovative firms.
According to our analysis, the most important place-based driver of innovation is spatial clustering, where firms in related business sectors cluster together in order to benefit from larger markets, thick and specialised labour pools and knowledge spillovers, which are made possible through formal and informal networking opportunities (Scott, 2000).
These findings suggest that spatial clustering would attract small innovative firms to a neighbourhood, in addition to walkable and transit-accessible neighbourhoods. Walkable and mixed use developments foster vibrant environments for networking, learning and collaborating (Hamidi and Zandiatashbar, 2017; Katz and Wagner, 2014; Murphy, 2001; Storper and Venables, 2004).
While walkability, mixed uses, transit access and opportunities for spatial clustering are the shared characteristics of compact areas, we found that once controlling for them, the relationship between neighbourhood compactness and the number of innovative firms is negative and significant. In other words, compactness is a significant discouraging factor for small knowledge-based businesses to locate in a neighbourhood, possibly due to higher land and property values in compact areas which could make it unaffordable for small businesses (Richardson et al., 1990).
Compactness at the regional level, however, is a significant driver of local innovation generation. In other words, a typical census tract in a compact metropolitan area is more attractive for small innovative firms than the same census tract in a sprawling metropolitan area. This could be attributable to the widely held fact that denser and more compact metro areas provide higher accessibility to regional destinations, industries and anchor institutions as primary engines of regional innovation generation. Compact regions also support public transit investments, leading to a reduction in distance, transportation costs and travel time, as well as increasing the potential for interaction between economic agents. While our findings confirm the significance of local spatial clustering, regional spatial clustering is not a significant driver of innovative firm location, once controlling for regional compactness.
This study has some limitations. First, while the disaggregated SBIR data offer the opportunity for such study at the national level, it is important to note that this is just one measure of innovation productivity and could not be generalised to other innovation outputs such as patent data, or measures related to the process of innovation such as start-ups. Moreover, the SBIR data only include small businesses; our findings regarding the role of compactness and other environmental characteristics are not applicable to larger firms, headquarters and corporations.
The research findings open up several lines of research for further inquiry. First, our findings offer mixed conclusions regarding the role of neighbourhood compactness in innovation productivity. On one hand, we found several shared characteristics of compactness such as walkability, access to transit and spatial clustering to be key attractions for small innovative firms; on the other hand, the direct role of compactness is negative and significant. Future research could unpack these interactions by accounting for both direct and indirect impacts of compactness on local innovation productivity. Furthermore, it remains unclear how much of an impact anchor firms have on local-level innovation productivity. Innovation-friendly built environments could be key attractors for these firms, due to the desirability of quality place-based amenities as well as proximity to highly skilled workers and other hubs of activities. Further research is needed to track these dynamics over time by investigating the role of these anchors along with built environmental preferences in innovation productivity. Finally, SBIR data is only one innovation generation outcome. More research is needed to understand the role of the built environment on other innovation outcomes such as start-ups and patent generation.
As cities and regions transition away from an industrial economy, policy makers and planners are continually looking towards the importance of strengthening knowledge and creative-based industries. Detroit, MI, Houston, TX and Buffalo, NY are examples of cities that have sought to incorporate the concept of an innovation district in their future plans. Some cities have already started to implement the concept of innovation districts, for example, the Boston Route 128 Technology Corridor (Cohen, 2015). Although economic geographers and planners have long recognised the value of place in attracting creative and knowledge-based firms and workers, there has been little attention paid to the role that urban compactness could play in these dynamics. This research suggests that there are untapped synergies between compactness and knowledge-based economies. By integrating planning efforts, planners and policy makers may be better equipped to create places that not only benefit industry clusters, but that provide the framework for a more robust regional innovation ecosystem.
Footnotes
Declaration of conflicting interests
The author(s) declared no potential conflicts of interest with respect to the research, authorship, and/or publication of this article.
Funding
The author(s) received no financial support for the research, authorship, and/or publication of this article.