
Abstract
Various studies have shown that minorities bear a disproportionate exposure to environmental pollution. To understand the causes of this environmental inequality, it is important to analyse which structural conditions foster environmental inequality. This study uses an original dataset by combining the German 2011 census with georeferenced pollution data to analyse the variation in environmental inequality between German cities. While structural characteristics derived from standard theories of environmental inequality do a rather poor job of explaining regional differences, an overlooked indicator correlates strongly with environmental inequality: the geographic centrality of polluting facilities within the urban space. Including this structural measure into the city-fixed effects multilevel analysis accounts for more than 25% of the variation between cities. This highlights the importance of taking geographic conditions into account when analysing environmental inequality.
Introduction
A huge body of research in the United States and also a growing body of research in Europe has shown that ethnic minorities are exposed to a disproportionately high amount of environmental pollution (e.g. Ard, 2015; Ash and Fetter, 2004; Diekmann and Meyer, 2010; Downey and Hawkins, 2008; Padilla et al., 2014; Pastor et al., 2001, 2005; Rüttenauer, 2018). However, the level of environmental inequality varies considerably between different cities (Downey, 2007; Downey et al., 2008; Padilla et al., 2014), which offers an opportunity to analyse the structural conditions that foster environmental inequality. As has been argued by Schweitzer and Stephenson (2007), comparative research is needed to investigate the influence of urban conditions on the distribution of environmental hazards across social groups. For instance, previous research has shown that riversides, transportation routes and agglomeration economies can all play an important role in determining facility locations (e.g. Baden and Coursey, 2002; Elliott and Frickel, 2015; Wolverton, 2012). Identifying such decisive urban conditions helps to improve our understanding of the underlying causal mechanisms, and, in turn, may help urban planners to avoid the persisting disadvantage of minorities.
So far, systematic analyses of the varying inequality levels have been constrained to the United States, and it is unclear to what extent findings from the United States are transferable to Germany. First, environmental inequality in the United States is mostly concerned with ethnic minorities like black Americans, Hispanics and Asians, while minorities in Germany are mostly immigrant minorities and stem from relatively recent immigration from other European countries or Turkey. Second, the United States exhibits much higher levels of residential segregation, having dissimilarity indices between 41 and 64 (depending on the ethnic group), compared with indices of 20 in Germany (Musterd, 2005). Third, the urban structures differ between the United States and Europe, with a higher population density and more centrally organised cities in Europe (Huang et al., 2007). Those characteristics might play an important role for facility siting decisions or residential mobility, and therefore could on the one hand affect the extent of environmental inequality, but on the other hand also play an important role regarding the causal forces. Thus, it is important to investigate the structural conditions that foster environmental inequality in a different context.
The current study addresses this aim by analysing a novel dataset, combining pollution data from the European Pollutant Release and Transfer Register with socio-demographic data from the 2011 German census on the level of 1 square km grid cells and information on the level of German cities. In a first step, city-fixed random-slope multilevel models show that the level of environmental inequality varies considerably between German cities. In the second step, I investigate whether the effect-heterogeneity between the cities can be explained by structural differences between the cities. The findings show that structural characteristics derived from the standard strand of reasoning in environmental inequality literature – like residential segregation – do a relatively poor job of explaining inter-city differences. This is surprising, but in line with previous research from the United States. Still, further analyses emphasise the importance of taking the urban landscape into account. Including the average centrality of industrial facilities explains more than 25% of the inter-city variation in environmental inequality. This result challenges the importance of the standard theory in environmental inequality research, as residential segregation only plays a minor role in determining environmental inequality. Conversely, the analysis highlights the importance of considering the urban space, where social processes like siting or migration take place. Doing so can enhance our knowledge about the causes of environmental inequality, but can also offer new insights into the unintended consequences of urban structures and urban planning.
Theoretical background and literature review
Previous literature on environmental inequality has concentrated on two possible explanations for the disproportionate exposure of minority households to environmental pollution: selective siting and selective migration (for an overview, see Mohai and Saha, 2015a).
The argument of selective siting assumes that polluting facilities temporally follow the settlement of minority households. The reason that polluting facilities choose areas predominantly occupied by minorities are threefold: taste-based discrimination, profit maximisation and the avoidance of political protest (Campbell et al., 2015; Grant et al., 2010; Hamilton, 1995). First, decision makers may predominantly belong to the majority group and choose to locate unwanted industrial facilities close to minority households and far away from their own group. Second, housing and land-use prices may be lower around high-minority areas, as minority households exhibit generally lower incomes and consequently live in low-rent areas. If companies were economically rational, they would choose low-cost amenities and – as a side-effect – locate close to the minority population. Third, companies may seek the ‘path of the least resistance’ (Saha and Mohai, 2005) and, thus, choose locations where political protest is assumed to be low. If decision makers within companies assume that minority groups are less likely to organise collective actions against facility siting (‘not in my backyard’) due to their limited resources and political efficacy, minority areas may provide an attractive siting location.
Several studies have used longitudinal data to test the argument of selective siting. Using spatially aggregated data, Funderburg and Laurian (2015), Mohai and Saha (2015b), Pastor et al. (2001), Saha and Mohai (2005) and Shaikh and Loomis (1999) conclude that demographic disparities in facility-hosting areas already existed prior to the siting process, which supports the argument of selective siting. However, other longitudinal studies do not exhibit a consistent association between the demographic composition of an area and the probability of receiving a new industrial facility (Been and Gupta, 1997; Downey, 2005; Oakes et al., 1996), and still others rather emphasise infrastructural and historical patterns of facility siting (Baden and Coursey, 2002; Elliott and Frickel, 2013; Wolverton, 2012). Thus, empirical results remain mixed regarding the role of selective siting.
In contrast to selective siting, the argument of selective migration assumes that the in-flow of minority residents temporally follows the occurrence of polluting facilities. Again, two alternative reasons exist: the ‘racial residential discrimination thesis’ and the ‘racial income-inequality thesis’ (Best and Rüttenauer, 2018; Crowder and Downey, 2010; Pais et al., 2014). The ‘racial residential discrimination thesis’ posits that ethnic minorities are discriminated against in the housing market. Independent of socio-economic characteristics, ethnic minorities are steered into neighbourhoods with a lower environmental quality, because housing agents or landlords may fear declining attractiveness due to minority in-migration, or spuriously anticipate lower preferences for environmental quality (e.g. Turner and Ross, 2005). The ‘racial income-inequality thesis’, in contrast, argues that selective migration of minority households results from economic disparities between ethnic groups. Assuming that households prefer a high environmental quality over a low environmental quality, demand, rents and housing prices are higher in clean neighbourhoods. At the same time, the willingness or ability to pay for environmental quality depends on income. Thus, rich households sort into high-quality neighbourhoods, while poor households end up in less desirable and more polluted neighbourhoods (e.g. Banzhaf and Walsh, 2008; Sieg et al., 2004). As minority households hold lower economic resources than their majority counterparts do, those households sort into low-quality neighbourhoods because they simply cannot afford rents and housing prices in high-quality neighbourhoods.
When analysing the aggregated socio-economic development after hosting a new facility, most existing research does not support selective migration as a cause of environmental inequality (e.g. Downey, 2005; Funderburg and Laurian, 2015; Mohai and Saha, 2015b; Oakes et al., 1996; Pastor et al., 2001, 2005). In contrast, studies using individual data and moving trajectories indeed find evidence in favour of the selective migration argument. Best and Rüttenauer (2018), Crowder and Downey (2010) and Pais et al. (2014) conclude that minority households selectively move into more polluted areas than majority households. Even when controlling for income, these disparities in moving behaviour persist, indicating that selective migration is not mainly driven by income. This is further supported by the finding that minorities exhibit a lower willingness to pay for the avoidance of environmental pollution (Depro et al., 2015). However, agent-based models of Campbell et al. (2015) indicate that the finding of minorities selectively moving into low-quality areas may be a result of similarity preferences rather than the tendency of choosing lower quality neighbourhoods. Thus, it is unclear how decisive those selective migration processes are for the observed extent of environmental inequality.
Macro-structural predictors
Regarding the extent of environmental inequality, previous studies have shown that some cities exhibit a high level of environmental inequality, while others show none or only low levels (Downey, 2007; Downey et al., 2008; Padilla et al., 2014). To explain these variations, this section first describes hypotheses derived from the standard strand of reasoning (outlined in the previous section) and subsequently develops a novel hypothesis that has not been tested by previous research.
The theory of selective siting highlights two factors explaining the level of environmental inequality on the macro level: political efficacy and ethnic residential segregation. First, assuming that companies choose facility locations based on the level of expected political resistance, higher political efficacy of majority members should increase the ‘externalisation’ of pollution onto minority groups. Second, independent from the actual motives, decision makers should only be able to place facilities disproportionately close to minority residents if residential segregation exists. In cities where minority residents are evenly distributed in space (absolutely desegregated), companies cannot discriminate against minority households and choose a facility location that is disproportionately close to minorities. Thus, higher residential segregation should increase the possibility of selective siting and consequently increase the level of environmental inequality.
The same argument applies for selective migration. An absolutely desegregated area makes selective migration implausible as an explanation for environmental inequality. In a desegregated city, there is no possibility that minority households would have moved selectively into polluted areas in the past, while majority households would not. If selective migration were at work, minorities would live segregated in areas closer to industrial facilities as a consequence of selective migration. Thus, selective migration processes should produce higher levels of segregation. Second, according to the ‘racial income-inequality thesis’, economic disparities should be the main reason for selective migration processes. Thus, higher levels of economic inequality within a city should lead to higher levels of environmental inequality.
In sum, the standard strand of reasoning in environmental inequality research leads to the following hypotheses. The level of environmental inequality increases with:
H1)increasing levels of residential segregation (selective siting and migration),
H2)increasing political efficacy of the majority group (selective siting: avoidance of political protest),
H3)increasing economic inequality (selective migration: ‘racial income-inequality thesis’).
However, previous research produced rather inconclusive results regarding those hypotheses. For instance, Rüttenauer (2018) finds considerable clustering processes of minorities around hazardous industrial pollution, concluding that residential segregation might be a main driver of environmental inequality, and Ard (2016) shows that – for most segregation measures – increasing segregation leads to increasing health risks especially for minority residents. Nonetheless, comparing the level of environmental inequality in US metropolitan areas, Downey et al. (2008) find mixed results regarding the role of income inequality and residential segregation. Though both have a significant effect in some models, the results vary with respect to the operationalisation of the dependent variable and the ethnic group under consideration. Similarly, Downey (2007) finds a significant association between residential segregation and the ethnic toxic concentration ratio, but the effect is small in magnitude and the explanatory power of the model only marginal, which seems to be odd given the emphasis on selective siting and migration in the field.
One explanation for this finding could be that the spatial proximity of industrial facilities to minority households is mainly driven by labour-market characteristics. For example, Hersh (1995) finds that working-class households are located closer to facilities because of attractive job opportunities. Similarly, Been and Gupta (1997) and Wolverton (2012) identify the percentage working in manufacturing as an important driver of facility siting. On the one hand, industrial workers offer an attractive labour force for companies, leading to selective siting; on the other hand, people employed in industry may trade-off environmental quality for attractive jobs, leading to selective migration (Wolverton, 2009). If minorities are overrepresented in the class of manufacturing or industrial workers, minorities experience a disproportionate burden. Thus, the extent of environmental inequality might depend on the share of people working in the industrial sector. In line with this hypothesis, Krieg (1995) identifies a higher correlation between minority share and toxic waste sites in older industrialised towns, which leads to the hypothesis that the level of environmental inequality increases with:
H4)an increasing share of people employed in the industrial sector (selective siting and migration: job allocation).
Note that this argument conforms to both theoretical lines (selective siting and migration), but assumes a sub-mechanism based on the allocation of jobs rather the mechanisms commonly outlined in the literature (see previous section).
Another explanation is that studies of environmental inequality ‘fail to take the spatial distribution of environmental hazards within metropolitan areas into account’ (Downey, 2007: 970). The results of Downey (2005) in Detroit point out that ethnic minorities were somewhat separated from (new) polluting facilities because they lived – due to high residential segregation – in areas where industrial facilities decreased. While the black population resided segregated in central areas of the city, new facilities emerged in suburban and predominantly white areas. This process ‘prevented’ the black population from living in areas of newly emerging facilities and led to the conclusion that facilities were not sited selectively in black neighbourhoods between 1970 and 1990.
Elliott and Frickel (2015) support this implication in a historical analysis of hazardous industrial sites in four US cities, finding a persisting geographical accumulation of industrial sites around the urban core. Moreover, they conclude that the extent of environmental inequality diminished over time due to the increasing churning of white middle-class households into those central areas, where minorities have been overrepresented so far. Also for NO2 concentration levels (including also mobile sources), Padilla et al. (2014) find a positive correlation between deprivation and pollution only in those cities with high deprivation levels in the inner city.
It is well known from segregation research (e.g. Massey and Denton, 1989) that minorities generally tend to cluster around the central city districts. As stated above, this can also prevent minorities from being exposed to environmental pollution if the pollution occurs in more peripheral areas. Altogether, this suggests that, when taking the spatial distribution of pollution into account, the centrality of pollution in particular is a crucial driver of environmental inequality. If facilities are located close to the city centre – where minority groups usually cluster – we expect to observe a high correlation between minority share and environmental pollution. This leads to the last (and so far overlooked) hypothesis that the level of environmental inequality increases with:
H5)increasing centrality of facilities within the urban space.
Though previous results point towards the importance of the spatial distribution of pollution, this hypothesis has not been explicitly tested in previous research.
Analytical strategy
Data
The European Pollutant Transfer and Release Register (E-PRTR; European Commission, 2006) is a register capturing industrial activities and emission reports on all German facilities that fall under one or more of the 65 E-PRTR activities (European Commission, 2006: 79–82) and exceed a pollutant-specific threshold of emissions (European Commission, 2006: 83–86). The regulations of this pollutant register are similar to those of the US Toxics Release Inventory (TRI). All facilities exceeding a pollutant-specific threshold have to report their emissions and geo-locations. 1 In 2011, the dataset contained a total of 1479 facilities reporting nearly 1 billion tonnes of emissions to air and nearly 90 million tonnes of processed waste. Of those facilities, 367 (24.81%) are located within a 2 km buffer around the 79 metropolitan areas and report emissions to air. Most of the air-polluting facilities in metropolitan areas operate in the energy or waste management sector (both 28%), metal production, the chemical industry (both 10%) or the mineral industry (9%).
The 2011 German census (Statistische Ämter des Bundes und der Länder, 2015) provides information about the German population on the level of 361,478 equally distributed 1 km grid cells. Reducing this dataset to non-missing observations (excluding cases with fewer than 3 of inhabitants) and German metropolitan areas (more than 100,000 inhabitants) results in a final dataset of 9061 grid cells clustered within 79 cities. In total these grid cells capture approximately 24 million inhabitants and contain on average 2650 (median: 1717) inhabitants.
In addition, the socio-demographic data of the 2011 German census are further enriched by characteristics of the 79 metropolitan cities, provided by the ‘Indikatoren und Karten zur Raum- und Stadtentwicklung’ database (INKAR; BBSR, 2017). This is done by using the level of districts (‘Landkreise’), as 66 of the 79 cities are districts by themselves (‘Kreisfreie Stadt’) and this level provides additional variables not available at the municipality level. Though for 13 of the cities, district-level characteristics also include sub-urban regions, additional analyses excluding these cities yield nearly identical results.
Variables
The main variable of interest is the amount of air pollution for each census grid cell. Therefore, I created a 2 km buffer around the geo-referenced location of each E-PRTR facility and allocated the reported emissions to air proportionate to the spatial overlap between the buffer and each census grid cell. This method is similar to the method Banzhaf and Walsh (2008) apply to the US TRI data. This leads to a dataset of 9061 census grid cells containing the proportionate amount of industrial emissions to air (including greenhouse gases, chlorinated substances, heavy metals and other gases and organic substances), without weighting them by toxicity. The reason for not weighting the pollution by toxicity is that using EPA’s RSEI toxicity weights reduces the effective number of facilities within the cities to 179 with only 49 cities holding at least one facility. However, additional analyses using toxicity weights lead to similar results with the same conclusions, no matter whether including or excluding cities with no toxic facilities (see Figure B1 of the Supplementary Material online). To take the right skewness of the emissions into account, the natural logarithm of the emissions (+1) is calculated.
The main explanatory variable on the census level is the minority share, which is available as the percentage of foreigners (not holding German citizenship) in each census cell. Additional control variables on the grid cell level include population (which equals population density because of same-sized spatial units), the percentage of people aged 65 or older, the percentage of vacant housing and the living space per inhabitant (in m2). The latter can be seen as a proxy for wealth, especially within cities. Furthermore, I control for infrastructural characteristics by including the distance to motorway junctions and railway lines (e.g. Wolverton, 2012), obtained from OpenStreetMap.
I use the following city-level indicators: residential segregation, economic inequality, political efficacy, the share of employees in industry and facility centrality. As a measure for segregation, the spatial information theory index (
To calculate the facility centrality, I geo-coded each city’s town hall as the city centre. 2 Subsequently, I computed the distance of each industrial facility within a 2 km range of the city boundaries to the city centre. Finally, the average of these distances was taken and divided by the maximum possible distance between the city centre and each point of the city boundary, ensuring that the centrality measure does not depend on the city’s actual size but becomes a relative measure. For ease of interpretation, I calculated the inverse of this average relative distance to receive the average centrality of industrial facilities. Formally, the facility centrality for each city j = 1,…,N can be written as:

where
Method
The analyses rely on multilevel models, nesting the 9061 census grid cells within the 79 cities (e.g. Hox and Wijngaards-de Meij, 2015). The main research question is the comparison of within-city environmental inequality between the cities. As in previous literature (e.g. Ash and Fetter, 2004; Diekmann and Meyer, 2010; Downey and Hawkins, 2008; Rüttenauer, 2018), the air pollution is regressed on the percentage of foreigners, and this regression coefficient is interpreted as the level of environmental inequality. To obtain a within-city effect, the first level (census grid cell) variables are group mean centred (for a discussion on centring, see Enders and Tofighi, 2007). This is similar to city-fixed effects estimators (including a dummy for each single city), meaning that all city-wide characteristics are controlled for in the first-level estimates (e.g. generally higher pollution in larger cities). The model can be written as:
for all i = 1,…,N observations and j = 1,…,J cities, where
The cross-level interactions (
Results
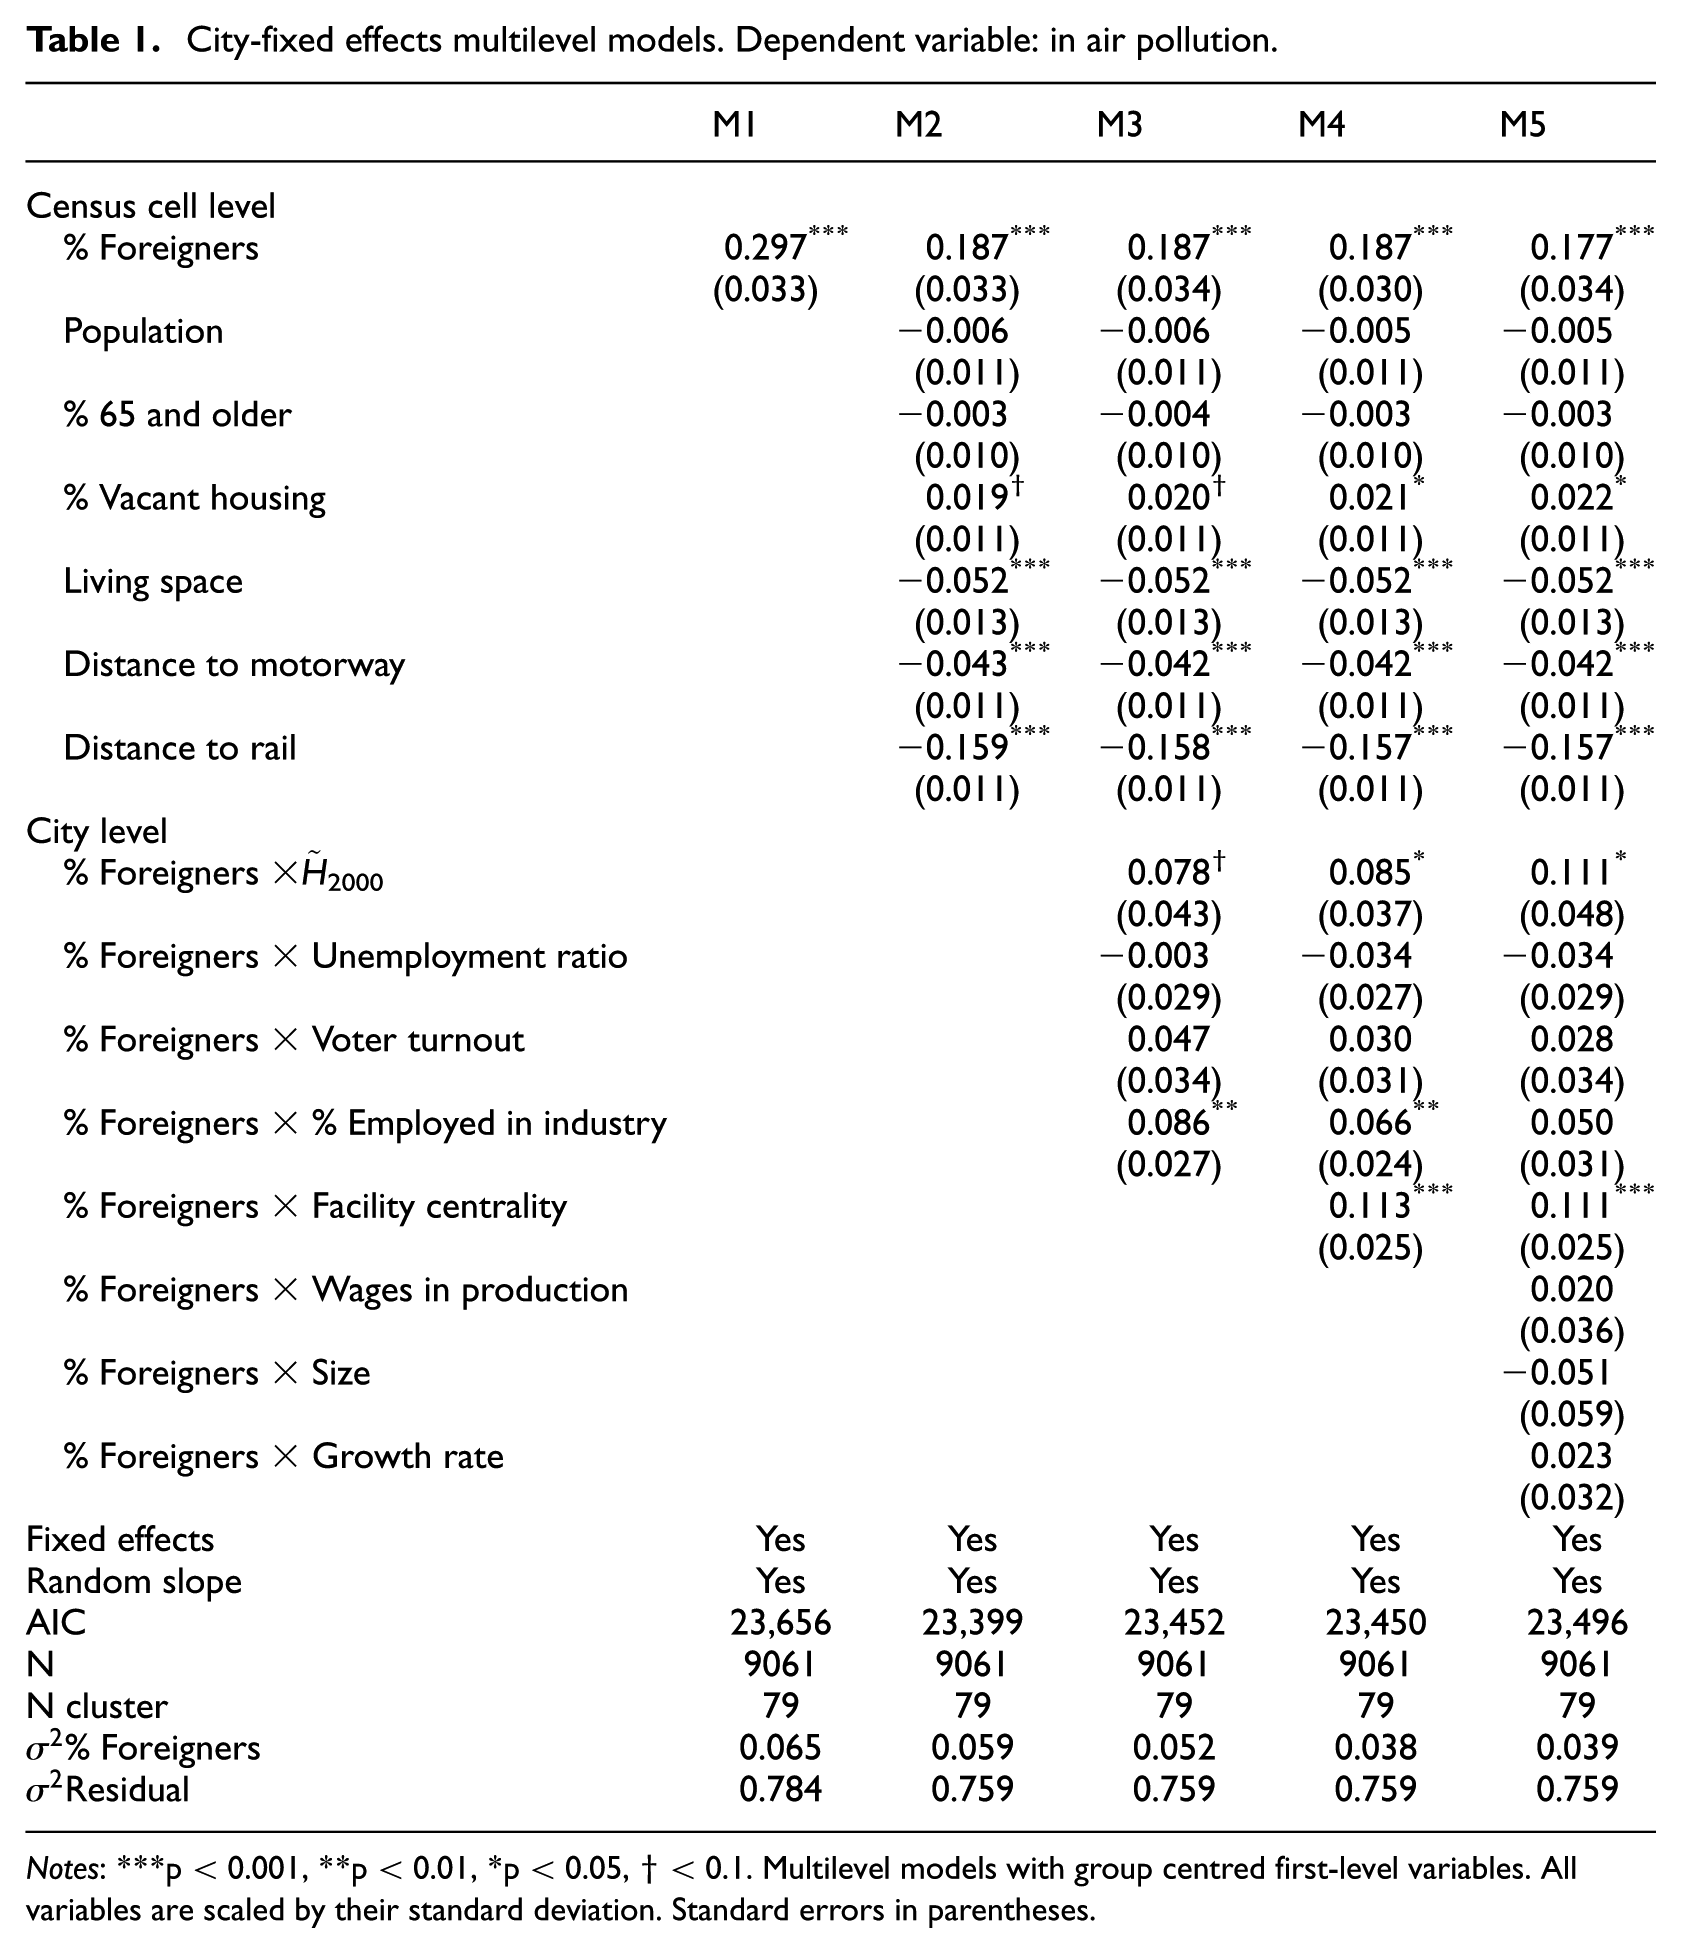
Model M1 in Table 1 presents the baseline model, only including the minority share as a predictor. The model confirms that, within German cities, there is a significant and strong correlation between minority share and environmental pollution. Furthermore, this effect varies considerably and significantly between cities (compared with a model without random slope:
City-fixed effects multilevel models. Dependent variable: in air pollution.
Notes: ***p < 0.001, **p < 0.01, *p < 0.05, † < 0.1. Multilevel models with group centred first-level variables. All variables are scaled by their standard deviation. Standard errors in parentheses.
While some cities have a negative coefficient, that is, the majority is actually disproportionately more affected by environmental pollution, others have a very strong positive coefficient pointing towards a strong disadvantage of minority groups. For a descriptive inspection, Figures 1 and 2 show the spatial distributions of air pollution and minorities in cities with the highest levels of environmental inequality (Figure 1) and cities with the lowest levels of environmental inequality (Figure 2).

Distribution of pollution and minorities for cities with a high level of environmental inequality.
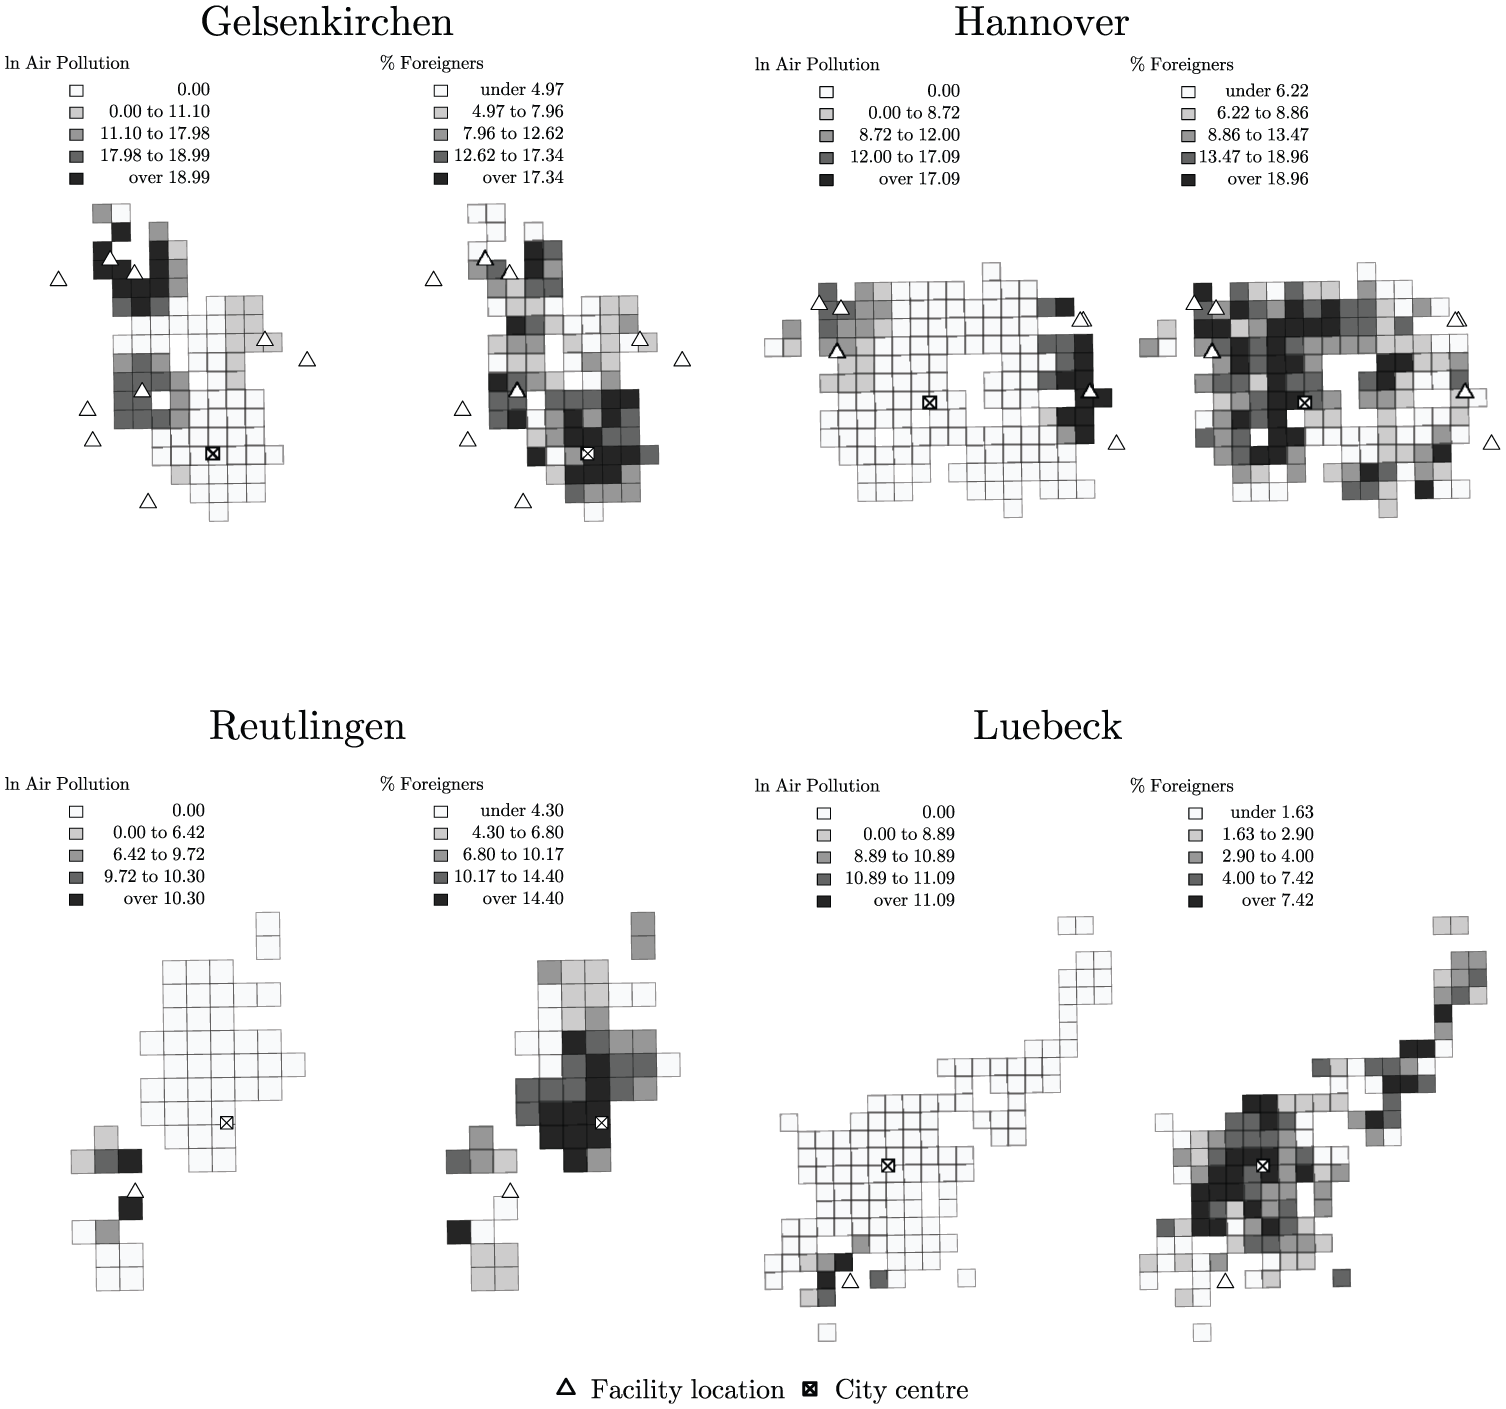
Distribution of pollution and minorities for cities with a low level of environmental inequality.
Regarding the distribution of the minority population (right panel for each city), minority households experience relatively identical levels of residential segregation, but tend to live closer to industrial facilities in the four cities of Figure 1 than in the cities of Figure 2. Again in both figures, the minority share is higher around the city centre, meaning that minorities in all eight cases cluster around the city centre – a pattern similar to cities in the US (Massey and Denton, 1989). However, the figures exhibit an interesting difference: pollution and facilities appear closer to the city centre in cities with high levels of environmental inequality (Figure 1). Facilities in cities with low levels of environmental inequality (Figure 2), in contrast, are located more distant from the city centre. In those cities, where pollution happens to be strong in the peripheral areas, majority groups seem to be equally or even more affected by pollution than their minority counterparts.
To investigate the influence of the city-level characteristics statistically, models M2–M5 of Table 1 present the results of the multilevel models including census-level controls and cross-level interactions. Model M2 adds the census-level control variables. The living space per inhabitant – which can be seen as a proxy for wealth in urban areas – is negatively associated with the level of environmental pollution. In line with Wolverton (2012), a higher distance to motorway junctions and railway lines is associated with lower levels of environmental pollution. Moreover, including the control variables reduces the minority effect, which is mainly driven by the living space and the distance to railway lines. This indicates that part of the minority disadvantage can be attributed to a higher minority share in less wealthy regions with a higher proximity to transportation routes. Yet, a high level of environmental inequality net of the census-level controls remains.
To analyse the influence of city-specific differences on the level of environmental inequality, models M3–M5 add the cross-level interactions between structural indicators and the minority share. Model M3, which includes the structural characteristics derived from the standard literature of environmental inequality, presents challenging findings. Neither economic inequality nor political efficacy has a significant influence on the level of environmental inequality. The coefficient regarding economic inequality does not show the assumed direction: higher economic inequality is associated with lower levels of environmental inequality – though it is far from significant. Residential segregation, in contrast, shows the expected sign: higher residential segregation is associated with higher levels of environmental inequality. However, the effect is only significant at the 10% level and is relatively weak in magnitude. Alternative segregation indices like the spatial dissimilarity index
Model M4 adds the facility centrality as a cross-level interaction to test the influence of the geographic distribution of polluters. In line with the impressions from Figures 1 and 2, the centrality of facilities within a city shows a highly significant and positive association with environmental inequality. The higher the average centrality of facilities, the stronger the correlation between minority share and pollution. While a one standard deviation increase in minority share corresponds to a 0.187 standard deviation increase in pollution at the average value of facility centrality, this effect increases by 60% to 0.3 (0.187 + 0.113) when the facility centrality lies one standard deviation above the mean. Minorities are disproportionately affected by industrial pollution especially in cities with centrally located facilities. Interestingly, once facility centrality is controlled for, the coefficient for residential segregation is significant at the 5% level. In addition, including the facility centrality explains a large proportion of the random-slope variance. When comparing models M4 and M3, more than one quarter of the slope variance ((0.052−0.038) / 0.052 = 0.27) can be explained due to the centrality of industrial facilities; more than due to all other variables combined. This highlights the importance of the facilities’ centrality within the urban space for the extent of environmental inequality.
Model M5 adds further cross-level controls. Though none of those exhibit a significant effect, they have some influence on other effects of interest. First, the segregation effect increases in its magnitude and now equals the facility centrality effect. This is mainly due to controlling for the city size. Second, the effect of the share employed in the industrial sector is lower in its magnitude and does not reach significance in model M5. This is mainly due to the collinearity between the share of industrial workers and wages in the industrial sector. Still even when adding further controls, the centrality of industrial facilities exhibits a highly significant effect on the extent of environmental inequality.
The findings are robust against a variety of model specifications. 3 When applying RSEI inhalation toxicity weights and thereby excluding greenhouse gases, similar results are obtained regarding the centrality of facilities. Residential segregation and the share of industrial workers, in contrast, exhibit no significant effect on the level of environmental inequality when using toxicity-weighted pollution (see Figure B1 of the Supplementary Material). In sum, the results clearly contradict the hypotheses that the level of environmental inequality increases with increasing political efficacy (H2) or increasing economic inequality (H3). Though we observe some evidence that environmental inequality increases with the level of residential segregation (H1) and with the share of people employed in the industrial sector (H4), both effects are sensitive to model specification. The centrality of facilities within the urban space, in contrast, exhibits a strong and significant effect on the level of environmental inequality and a large explanatory power throughout all model specifications (H5).
Discussion
Does this mean that environmental inequality is not mainly driven by selective siting or selective migration processes, but rather a result of the urban structure? It is important to keep in mind that this is a cross-sectional finding, making it hard to interpret why the centrality of facilities is so important. In my opinion, there are two possible interpretations: the centrality of facilities is either a confounding or a mediating mechanism.
First, the impact of facility centrality may be the result of two independent processes. Minorities cluster around the city centre for reasons other than environmental quality (e.g. infrastructure, social networks or similarity preferences). At the same time, industrial air pollution occurs around the urban core for infrastructural or historical reasons. Elliott and Frickel (2013), for instance, find a persisting clustering of industrial facilities close to waterways, independent of socio-demographic characteristics. In combination, those two independent processes lead to the fact that minorities bear a disproportionately high level of environmental pollution, questioning the causal link between pollution and minority share.
Second, the centrality of industrial facilities may be driven by some kind of selective siting, independent of the applied measures for political efficacy and economic inequality; or the clustering of minorities may be driven by high pollution within the urban core. In contrast to the first interpretation, this would suggest a causal link between pollution and minority share, mediated by the centrality of industrial facilities.
Yet, additional models (Table 2) do not provide an easy conclusion regarding the predictors of facility centrality. The location of the facilities is indeed independent of the centrality of the minority population within the city. Model M1 of Table 2 regresses the facility centrality on the relative minority centralisation index (Massey and Denton, 1988), but does not exhibit a significant correlation, meaning that facilities are not located more centrally if minorities live centrally. Similar conclusions apply to the level of segregation (M2). Interestingly, models M3 and M4 indicate that facilities are located more centrally in cities with higher economic inequality and higher political efficacy. While the first model rather supports the interpretation of the facility centrality as a confounding mechanism, models M3 and M4 rather point to its role as a mediator. Additionally, models M5 and M7 show that neither the share of industrial workers nor the centrality of rivers (measured as the minimal distance to the city centre) nor the extent of public transport opportunities (measured as the public transport stops per square kilometre) yield a significant effect on the centrality of industrial facilities. Though central facilities are often located next to rivers, many cities exhibit central rivers but no centrally located facilities. Thus, it remains inconclusive why some cities exhibit centrally located facilities, while others do not. Further research using longitudinal data is needed to draw appropriate conclusions about the occurrence of centrally located facilities.
Linear OLS models (city level). Dependent variable: facility centrality.

Notes: ***p < 0.001, **p < 0.01, *p < 0.05, † < 0.1. All variables are centred around their mean and scaled by their standard deviation. Standard errors in parentheses. a Relative Centralization Index as described by Massey and Denton (1988): proximity of the foreign population to the city centre relative to the proximity of the German population to the city centre.
Conclusion
Though many studies investigate environmental inequality, there is surprisingly little consensus about the causal forces. While some empirical studies confirm that selective siting plays an important role, others rather emphasise the role of selective migration. The present study analyses under which circumstances we observe high levels of environmental inequality by investigating varying levels of environmental inequality between German cities and testing whether different structural characteristics explain those variations.
The results of the city-fixed effects multilevel models reveal that residential segregation, economic inequality and political efficacy of the majority population do a rather poor job of explaining the level of environmental inequality. Though segregation has the expected positive effect, its significance depends on model specifications and its explanatory power is rather low. This is also what Downey (2007) concludes for the US, but nonetheless is a surprising result given the importance of residential segregation for the most common explanations of environmental inequality. Without a substantial level of residential segregation, neither selective siting nor selective migration seem to be plausible explanations. Though the share of employees in the industrial sector is significantly correlated with higher levels of environmental inequality, pointing towards the importance of employment opportunities, this effect is sensitive to different specifications and disappears when using toxicity weights. In contrast, the spatial distribution of pollution within the urban space exhibits a strong and quite robust effect on the level of environmental pollution. Including the spatial centrality of industrial facilities as a cross-level interaction explains more than 25% of the random-slope variance. Though the measure of centrality applied in this study is rather simple (not considering the spatial distribution or density of facilities), it does a very good job of explaining the varying levels of environmental inequality. Minorities are disproportionately affected if pollution occurs around the city centre – where minorities tend to cluster. These results point to the importance of incorporating the spatial structure of polluters within the urban space into the analysis of environmental inequality.
The results pose some questions for further research. First, the analysis is based on Germany, which has low levels of residential segregation and rather dense metropolitan areas. Further research has to test whether the presented findings apply to other countries with other structural conditions. Second, the analysis relies only on industrial air pollution, while ignoring pollution coming from mobile sources like traffic. Results for mobile sources are likely to differ, as pollution is generally more concentrated around the urban core. Third, this study is cross-sectional in nature. Hence, it is not possible to investigate the temporal order of facility siting and residential moving behaviour. Finally, further research should also aim to enrich the analyses by additional data of the urban form. Other factors than the centrality of rivers or public transport could play an important role in determining the centrality of industrial facilities. For instance, distinct transitions from manufacturing to service economies or historical patterns of infrastructure may have fostered the presence of centrally located facilities.
Nonetheless, the findings of this study challenge the standard reasoning of environmental inequality research. While most environmental inequality research focuses on individual decisions, only a few studies have analysed the spatial context in which those individual processes occur. However, structural constraints seem to play an important role in determining the level of environmental inequality observed at the macro level. This is not to say that selective migration or siting do not occur, but only that the importance of these causal mechanisms may be overstated. Though companies may consider the minority share next to potential sites, other factors may be more important (e.g. Elliott and Frickel, 2015; Wolverton, 2012). Similarly, environmental quality certainly plays a role for moving decisions, but other factors may be more important. For instance, Alba et al. (1999) showed that speaking the language of the host country facilitated access to other networks and infrastructures, increasing the probability of moving from the city centre to suburban districts for immigrant households. Still, structural conditions may contribute to the (possibly unintended) consequence that minorities end up in more polluted neighbourhoods. This interpretation of the findings is also supported by the fact that agent-based models do not reach realistic levels of environmental inequality until similarity preferences are included as part of the migration decision (Campbell et al., 2015).
In sum, the results encourage further research not only to ‘bring the polluters back in’ (Grant et al., 2010), but also to bring the urban space back in, thereby considering the geographic location of polluters within urban areas. This might also help urban planners to develop strategies for avoiding or reducing the disproportionate exposure of minority households to environmental pollution.
Supplemental Material
cus-480-18-05-File005 – Supplemental material for Bringing urban space back in: A multilevel analysis of environmental inequality in Germany
Supplemental material, cus-480-18-05-File005 for Bringing urban space back in:A multilevel analysis of environmental inequalityin Germany by Tobias Rüttenauer in Urban Studies
Footnotes
Acknowledgements
I would like to thank Henning Best, Julia Schulte-Cloos, the editor, two anonymous reviewers, and participants of the Analytical Sociology Seminar 2017 at the Venice International University for helpful comments on earlier versions of this manuscript.
Declaration of conflicting interests
The author(s) declared no potential conflicts of interest with respect to the research, authorship, and/or publication of this article.
Funding
The author(s) received no financial support for the research, authorship, and/or publication of this article.
Notes
References
Supplementary Material
Please find the following supplemental material available below.
For Open Access articles published under a Creative Commons License, all supplemental material carries the same license as the article it is associated with.
For non-Open Access articles published, all supplemental material carries a non-exclusive license, and permission requests for re-use of supplemental material or any part of supplemental material shall be sent directly to the copyright owner as specified in the copyright notice associated with the article.