
Abstract
As one of the more important recent population shifts in the USA, the migration of Hispanics into new immigrant metropolitan gateways has received significant scholarly attention. Much of this attention has been paid to understanding how Hispanic residential experiences and environmental characteristics differ between new and traditional destinations. This study contributes to this literature by using 2013 American Housing Survey data to examine differences in the levels and determinants of Hispanic neighbourhood satisfaction by Hispanic destination type. The study pays specific attention to the role of neighbourhood social capital and explores differences between native- and foreign-born Hispanics. Findings reveal that Hispanics report higher neighbourhood satisfaction levels in new destinations compared with new destination white residents and Hispanics living in established destinations. The effects of social cohesion, social control and physical disorder on neighbourhood satisfaction are similar across destination type and nativity. However, the influence of metropolitan area characteristics varies by destination type and is specific to foreign-born Hispanics. Whereas low-skilled employment and Hispanic isolation affect the neighbourhood satisfaction of Hispanic immigrants in established areas, foreign-born segregation influences satisfaction levels in new destinations. The study provides evidence of Hispanic residential adaptation in new destinations with differential determinants across destination type and nativity.
Introduction
The Hispanic population in the USA has experienced rapid growth in the past 30 years and is projected to continue increasing in the foreseeable future, reaching nearly one-third of the total population by 2060 (Colby and Ortman, 2015). The Hispanic population is not only growing in size, but also dispersing across the country. Approximately one-half of all Hispanics live outside of traditional Hispanic destination states such as California and Texas with this percentage expected to increase (Johnson and Lichter, 2008). The remarkable growth of the Hispanic population and its dispersion from traditional Hispanic gateways to new destinations is one of the most important demographic trends in recent US history.
Given these dramatic population shifts, much scholarly attention has been paid to comparing new Hispanic destinations with traditional gateways. A primary concern in this literature is understanding whether and how new destination Hispanics are adapting to unfamiliar and potentially hostile environments. If these environments are disadvantaged, isolated, and hostile, then Hispanics in new destinations face an ‘unfavorable context for adaptation, integration, and assimilation’ (Massey, 2008: 349). Prior work has examined adaptation from the perspective of civic participation (Okamoto and Ebert, 2010), health and wellbeing (Brazil, 2017; Monnat, 2017), and socioeconomic attainment (Painter and Yu, 2008). This study approaches incorporation from a residential or neighbourhood perspective. Neighbourhoods are important environments to study because they represent key organising units of social and economic processes, and have strong associations with individual wellbeing independent of personal and household characteristics (Sampson, 2012). An important measure of residential incorporation and overall neighbourhood quality is neighbourhood satisfaction. Neighbourhood satisfaction is the global evaluation about how well a neighbourhood meets physical and social needs and desires (Lu, 1999). Residents who are satisfied with their neighbourhoods are less likely to leave them, ensuring population stability and building neighbourhood resilience to disorder (Bolan, 1997; Speare, 1974). Furthermore, neighbourhood satisfaction has been linked to higher overall life satisfaction, better mental health, greater civic participation, and increased investment in the neighbourhood (Adams, 1992; Sirgy and Cornwell, 2002). Despite the implications that neighbourhood satisfaction has on Hispanic individual wellbeing and neighbourhood adaptation, no study has examined the levels and determinants of neighbourhood satisfaction in new destinations. This study combines the extensive scholarly research on neighbourhood satisfaction and new Hispanic destinations to fill this non-trivial knowledge gap.
Using data from the 2013 American Housing Survey (AHS), this study examines differences in the levels and determinants of Hispanic neighbourhood satisfaction bet-ween new and traditional Hispanic metropolitan areas. Given the uneven distribution of native- and foreign-born Hispanic populations across these areas (Johnson and Lichter, 2008), the study also examines differences by nativity. The 2013 version of the AHS is particularly relevant for the study’s objectives as it is the first nationally representative survey to measure neighbourhood social capital, a resource influencing both place satisfaction and immigrant adaptation (Carpiano, 2006; Clark and Lisowski, 2018). I test the influence of neighbourhood social capital along with other important determinants established by the neighbourhood satisfaction literature including physical disorder, perceived access to amenities, residential segregation, and metropolitan area measures of socioeconomic disadvantage and employment structure.
Addressing the study’s objectives contributes to various strands of research. The study contributes to the growing new Hispanic destination literature by examining variables – neighbourhood satisfaction and social capital – that capture neighbourhood adaptation with implications for social health outcomes. As such, this study connects with the broader literature on co-ethnic and immigrant community ties and their importance in integration and incorporation. Although some studies have examined these issues within a new destination context, they are typically relegated to single cities (Flippen and Parrado, 2012; Oropesa, 2012). By using data on a large sample of metropolitan areas, this study’s results are farther reaching. The study also contributes to the neighbourhood satisfaction literature by examining the determinants of neighbourhood satisfaction for Hispanics, an overlooked population in this research domain which has typically focused on the overall population or black–white differences.
Differences in neighbourhood satisfaction levels across destination type
The push and pull factors driving Hispanic resettlement into new destinations may help explain differences in the levels and determinants of neighbourhood satisfaction across destination type. This section draws on relevant studies that examined individual- and contextual-level differences between new and established destinations to establish how Hispanic neighbourhood satisfaction might differ across these areas. These differences can be broadly categorised along three dimensions: characteristics of Hispanic residents, the neighbourhood environment, and the broader metropolitan context.
There are a number of factors that may help explain lower Hispanic neighbourhood satisfaction in new destinations. An important factor is the shorter history of Hispanic settlement in new gateways. As an unfamiliar population, Hispanics may encounter an unwelcoming neighbourhood environment, especially if they are perceived to be siphoning resources away from native residents and contributing to neighbourhood problems. Hispanics, in particular Hispanic immigrants, are often portrayed as harbingers of crime and disorganisation (Barranco, 2013). For example, Fennelly (2008) found that native residents in Minnesota expressed negative feelings towards incoming Mexican immigrants given concerns about their impact on crime and cultural cohesion. Other concerns include a decrease in local wages owing to an influx of a low-wage population and the draining of community resources such as public assistance and other social services (Massey and Capoferro, 2008). For these reasons, local residents may harbour unfriendly and hostile sentiment towards their Hispanic neighbours.
Shorter Hispanic settlement histories may also mean that new destinations lack the critical mass of Hispanic residents to promote the development of social support systems that assist minorities in securing employment, housing, and other valued com- munity services. A social and institutional resource particularly important to enhancing residential satisfaction and Hispanic incorporation is neighbourhood social capital, which is the resources that are available through local social networks and relationships based on trust, shared norms, and reciprocity (Putnam, 2000). Without an established community, new destination Hispanics have less access to the types of social and institutional mechanisms that foster social capital, including formal community organisations and informal settings conducive to social networking such as Hispanic grocery stores and religious organisations. In addition to fostering stronger social ties, neighbourhood social capital can reduce crime and disorder, which is higher in new destinations (Barranco, 2013; Harris and Feldmeyer, 2013), shield Hispanics from the hostility and disadvantage present at broader geographic scales, and provide access to opportunities for socioeconomic advancement such as jobs, home loans, and better schools for children (Dominguez and Watkins, 2003).
Another factor potentially contributing to lower neighbourhood satisfaction in new destinations is their higher levels of residential mobility. The systemic model of neighbourhood satisfaction posits that neigh-bourhood residential stability increases social interaction amongst residents, which increases attachment to, and satisfaction with, the neighbourhood (Kasarda and Janowitz, 1974). Studies have found higher residential mobility rates in new destinations, particularly for immigrants, who are twice as likely to migrate out as their counterparts in traditional gateways (Kritz et al., 2011). In addition to neighbourhood-level residential stability, household- or individual-level residential duration, which is influenced by home ownership status, influences satisfaction levels. Homeowners may feel increased satisfaction because they have a greater financial commitment to the neighbourhood and a decreased willingness to abandon it at the first sign of difficulties. Studies have found lower homeownership rates amongst native and immigrant Hispanics in new destinations (Painter and Yu, 2008; Sánchez, 2019).
The expectation that Hispanic neighbourhood satisfaction is higher in new destinations is grounded in the evidence showing greater socioeconomic advantages in new destinations compared with traditional gateways. Crowley and Lichter (2009) found that poverty and unemployment rates declined over the 1990s in new Hispanic destinations. Ludwig-Dehm and Iceland (2017) found that Hispanics experience a lower level of concentrated poverty in new destinations compared with traditional gateways. Although finding lower home ownership rates in new destination in an earlier paper (Painter and Yu, 2008), Painter and Yu (2014) found that Hispanic immigrants in traditional destinations experienced greater declines in homeownership rates after the Great Recession compared with their new destination counterparts. New destination areas also offer favourable labour market conditions, particularly for Hispanic immigrants seeking low-skilled employment (Kandel and Parrado, 2005).
The better socioeconomic conditions in new destinations are pull factors that help explain a neighbourhood satisfaction advantage in new destinations. Push factors, that is the environmental context in traditional gateways, may also help explain this advantage. Hispanics are moving to new destinations not just because they offer more employment opportunities, but also because traditional gateways are confronting saturated labour markets, which is largely due to the mass legalisations of undocumented migrants through the passage of the Immigration Reform and Control Act (Massey and Capoferro, 2008) and a slower job and housing market recovery from the Great Recession (Painter and Yu, 2014). Another important push factor is the increasingly unfavourable political environment for Hispanics in traditional gateways. For example, Proposition 187 in California denied undocumented immigrants access to various social programmes. Hispanics moving into new destinations may exhibit greater neighbourhood satisfaction simply because they are fleeing areas experiencing increasingly unfavourable social and economic conditions.
An important background factor potentially moderating the relationship between neighbourhood satisfaction and destination type is nativity status. Empirical studies have found that a higher percentage of the Hispanic population is foreign born in new destinations than in traditional gateways (Johnson and Lichter, 2008). This could produce differences in neighbourhood satisfaction and its determinants between the two areas. Immigrants may experience less neighbourhood satisfaction because of general language and cultural barriers preventing access to social and physical neighbourhood amenities (Cassel, 1999). In contrast, immigrants may exhibit higher levels of neighbourhood satisfaction because they tend to sever ties during the migration process and thus are forced to establish new connections to compensate for the ones they lost.
Differences in the determinants of neighbourhood satisfaction across destination type
In this section, I discuss how determinants of neighbourhood satisfaction may differ between new and established destinations, focusing the discussion on aspects especially important for understanding patterns of neighbourhood satisfaction: socioeconomic context, social capital, perceptions of amenity access and disorder, employment structure, and racial/ethnic segregation. Socioeconomic determinants of neighbourhood satisfaction include employment opportunities, neighbourhood poverty and income (Hipp, 2009; Kearney, 2006; Lu, 1999). The influence of socioeconomic determinants may differ between new and established destinations not only because of differences in the quantity and quality of accessible resources, but also the individual motivations for settling in these areas. Employment is a primary motivation for Hispanics moving to new destinations (Parrado and Kandel, 2008). Moreover, labour market characteristics influence the decision to remain or leave new destination areas (Kritz et al., 2013). As such, Hispanics may place greater importance on job access relative to other factors such as access to amenities. However, this does not mean to say that Hispanics in traditional gateways place lower value on job opportunities relative to new destination Hispanics. Prior work has shown that employment-seeking Hispanics migrate to new destinations specifically for low-skilled job opportunities (Crowley and Lichter, 2009). In this case, employment opportunities matter for Hispanics in both traditional and new gateways, but the types of opportunities that matter may differ.
The quantity of job opportunities may matter less if access is limited by institutional barriers and unfamiliarity with local norms. In order to overcome these barriers, racial/ethnic minorities will rely on own race/ethnic networks to access job opportunities and other economic and social resources. These networks are built through neighbourhood social capital, which may have differing effects across destination type. On the one hand, neighbourhood social capital may play a greater role in influencing neighbourhood satisfaction for Hispanics in traditional destinations because of greater access to the social and institutional mechanisms that help build social capital. Some point to the large array of institutional resources and services available to immigrants in large metropolitan areas with long histories of immigration and how they deter migrants from moving out (Waters and Jiménez, 2005). These resources include the greater prevalence of informal settings such as Hispanic grocery stores and formal mechanisms such as involvement in community organising, access to public leaders to address grievances, and membership in formal neighbourhood groups.
On the other hand, neighbourhood social capital may play a greater role for Hispanics in new destinations. Without an established community, new destination Hispanics are forced to create their own social ties upon arrival, which then helps them navigate the pathways towards broader cultural assimilation and socioeconomic opportunities. These informal ties become integral ingredients to neighbourhood satisfaction for new destination Hispanics not only because they create tighter knit communities, but also because they are needed to offset structural disadvantages and fill in for the lack of formal immigrant-serving amenities. Furthermore, the smaller, tighter knit networks in new destinations may offer closer, more informal neighbourhood relationships that shield Hispanics from disadvantage and hostility. For these reasons, neighbourhood social capital may play a greater role in shaping neighbourhood satisfaction in new destinations.
Social networks are shaped by the racial/ethnic makeup of one’s neighbourhood, which is tied to the segregation levels in the metropolitan area (Small, 2007). Immigrant groups in particular incorporate nativity concentration in their internal migration decisions after controlling for economic conditions (Kritz et al., 2011, 2013). Hispanics are segregated from non-Hispanic whites in new destinations, often at levels greatly exceeding those in established places (Hall, 2013; Lichter et al., 2010). The role of segregation in influencing neighbourhood satisfaction is unclear. On one hand, because segregation is linked to greater levels of neighbourhood socioeconomic disadvantage for racial/ethnic minorities (Quillian, 2012), greater segregation will decrease Hispanic neighbourhood satisfaction. On the other hand, segregation may increase satisfaction if greater Hispanic contact with other Hispanics creates more personal ties that lead to economic and social resources. Greater social resources may be particularly important for new destination Hispanics if they face hostile social environments. Here, residential isolation may increase neighbourhood satisfaction by decreasing exposure to out-group hostility from other race/ethnic groups and increasing exposure to own-ethnic support networks that help buffer against these groups.
There may also be differences in the determinants of neighbourhood satisfaction between native- and foreign-born Hispanics within each destination type. Native-born Hispanics are better positioned than their foreign-born counterparts to spatially assimilate because of their greater familiarity with the mechanisms linked to upward socioeconomic mobility in the USA including higher educational attainment and homeownership (Clark and Ledwith, 2007). As such, native Hispanics may heavily factor socioeconomic context in their evaluations of their residential circumstances. In contrast, as a population with weak English language skills and unfamiliar with US norms and values, Hispanic immigrants may focus more on the neighbourhood factors that will help them adapt to their new cultural and socioeconomic settings including access to basic amenities, low-skilled job opportunities and neighbourhood social capital. This also includes increased contact with other Hispanics, in particular Hispanic immigrants, as some have argued that enclaves provide immigrants with social capital that furthers their social integration and socio-economic mobility (Portes and Sensenbrenner, 1993).
Data and methods
Data sources
The analysis relies on the national public sample of the 2013 AHS. The AHS surveys heads of households at regular, semi-annual intervals to ask them about their housing and neighbourhood conditions. This study extracted respondents living in metropolitan areas with complete data on all the variables used in the study. Metropolitan areas are the smallest geographic units identified in the AHS. They have been commonly used to define Hispanic destinations in prior studies (Kandel and Cromartie, 2004; Painter and Yu, 2014). Missingness was generally not an issue; however, only a subset of household heads were selected to fill out a survey on neighbourhood social capital. These filters yielded an analytic sample of 14,833 respondents.
Following prior work on Hispanic destinations (e.g. Crowley and Lichter, 2009; Kandel and Cromartie, 2004; Painter and Yu, 2014), I divided metropolitan areas into three categories: (1) established destinations which have established Hispanic populations in 1990 (Hispanic population shares of 1.5 times the metropolitan area average (14.9%)); (2) new destinations which have high rates of Hispanic growth from 1990 to 2010 (Hispanic growth that is 1.5 times the metropolitan area average growth (225%)); (3) other metropolitan areas. Metropolitan areas with both established Hispanic populations and high rates of growth are treated as established gateways. The result is 126 metropolitan areas, 25 of which are classified as established Hispanic destinations, 58 as new Hispanic destinations, and 43 as other metropolitan areas.
Dependent and independent variables
The outcome of interest is neighbourhood satisfaction, which is measured by the question ‘How would you rate your neighbourhood on a scale of 1–10?’. The operationalisation of neighbourhood satisfaction has varied, with the most common taking on a 10-point scale as in this study, a 5-point ordinal scale, or combining several indicators of global neighbourhood satisfaction. Studies have found that these measures are highly correlated, with most studies using either a 5- or 10-point scale measure (Dassopoulos and Monnat, 2011; Greif, 2015; Hipp, 2009).
The main independent variables in the analysis are those capturing perceptions of various social and physical aspects of the neighbourhood environment. The AHS does not define the geographic boundaries of a respondent’s neighbourhood. As such, how a neighbourhood is conceptualised is up to the respondent. The main set of variables measure the five components of neighbourhood social capital: shared expectations for social control, social cohesion and trust, organisational involvement, neighbourhood social ties, and activism. Previous neighbourhood social capital surveys were limited to specific neighbourhoods within major cities. In recognition of the importance of social capital in neighbourhood research and the lack of social capital data at larger scales, AHS introduced 21 questions measuring social capital in its national and metropolitan samples in the 2013 survey. The module represents the first survey of neighbourhood social capital representative at the national level and for a large sample of metropolitan areas.
Social cohesion measures whether households consider their neighbourhood to be close-knit. It was captured by the mean response to five questions scaled on a 4-point scale (strongly agree, somewhat agree, somewhat disagree, strongly disagree) such that higher values signify greater cohesion. The cohesion scale included the following items: ‘I live in a close-knit neighbourhood’; ‘People in my neighbourhood generally get along with each other’; ‘People in my neighbourhood are willing to help their neighbours’; ‘People in my neighbourhood share the same values’; and ‘People in my neighbourhood can be trusted’. Shared expectations for social control capture how likely neighbours would be to report or intervene to solve a neighbourhood problem. It was measured using the average of responses to five questions scaled on a 4-point scale (very likely, likely, unlikely, very unlikely). The questions asked respondents how likely a neighbour would intervene if they witnessed a child was acting out, a fight breaking out, a local fire station was threatened by budget cuts, children skipping school, and children spraying graffiti. The combination of social cohesion and shared expectations for control is known as neighbourhood collective efficacy.
Organisational involvement measures the degree to which residents participate in neighbourhood groups, religious organisations, and civic organisations. It was measured using the average response to four questions (0 = No; 1 = Yes) asking whether the respondent or someone in the household belongs to a neighbourhood group, religious organisation, civic organisation, and a volunteer group. Neighbourhood activism integrates elements of organisational involvement and social cohesion whereby residents tackle neighbourhood problems by reaching out to public leaders or organising local meetings or groups that are specific to problem solving. It was defined by a scale (0 = No; 1 = Yes) that averages responses to questions that asked the respondent if a household member had participated in the following activities: attended a neighbourhood meeting concerning a problem, organised neighbours to do something about a neighbourhood problem, spoken with a local politician concerning a neighbourhood issue, spoken to a specific person or group causing a problem, and spoken to a local religious leader about a neighbourhood problem. Neighbourhood ties were measured by the self-reported number of friends in the neighbourhood (1 = None; 2 = one or two; 3 = three to five; 4 = six to nine; 5 = 10 or more).
I included a measure of perceived physical disorder, which averages responses (0 = No; 1 = Yes) to questions asking whether there is trash, abandoned or vandalised buildings, and buildings with metal bars on windows within a half block of the respondent’s residence. I also included variables indicating whether the respondent’s residence is within a half block of factories or other industrial structures, open space (e.g. parks), and railroads, airports or highways with at least four lanes. I included an indicator variable of whether the respondent is within 15 minutes of full-service grocery store. Finally, I included a variable of whether the respondent indicated that there was satisfactory police protection for the area (0 = No; 1 = Yes).
I also tested metropolitan area characteristics capturing objective measures of socioeconomic context. I included log median household income to capture socioeconomic status and percent of low-skilled employment 1 to capture labour market structure. I also included a measure of residential segregation to capture contact between race/ethnic groups. This is measured using the multigroup Information Theory Index H which is a measure of evenness – the extent to which groups are evenly distributed among neighbourhoods within an area. The race/ethnic groups are non-Hispanic white, non-Hispanic black, non-Hispanic Asian, Hispanic, and other. These metropolitan area characteristics reflect the socioeconomic, occupational, and segregation context of the total population. I also tested metropolitan area characteristics specific to the Hispanic population. I included the median household income of Hispanic households to capture Hispanic socioeconomic status. I used a Hispanic specific measure of segregation – the Isolation Index P– to capture Hispanic residential contact with other Hispanic residents. The Hispanic Isolation Index takes on the following formula

where
I also included a measure of contact between native-born and immigrant residents. This is measured using the Dissimilarity Index D

where
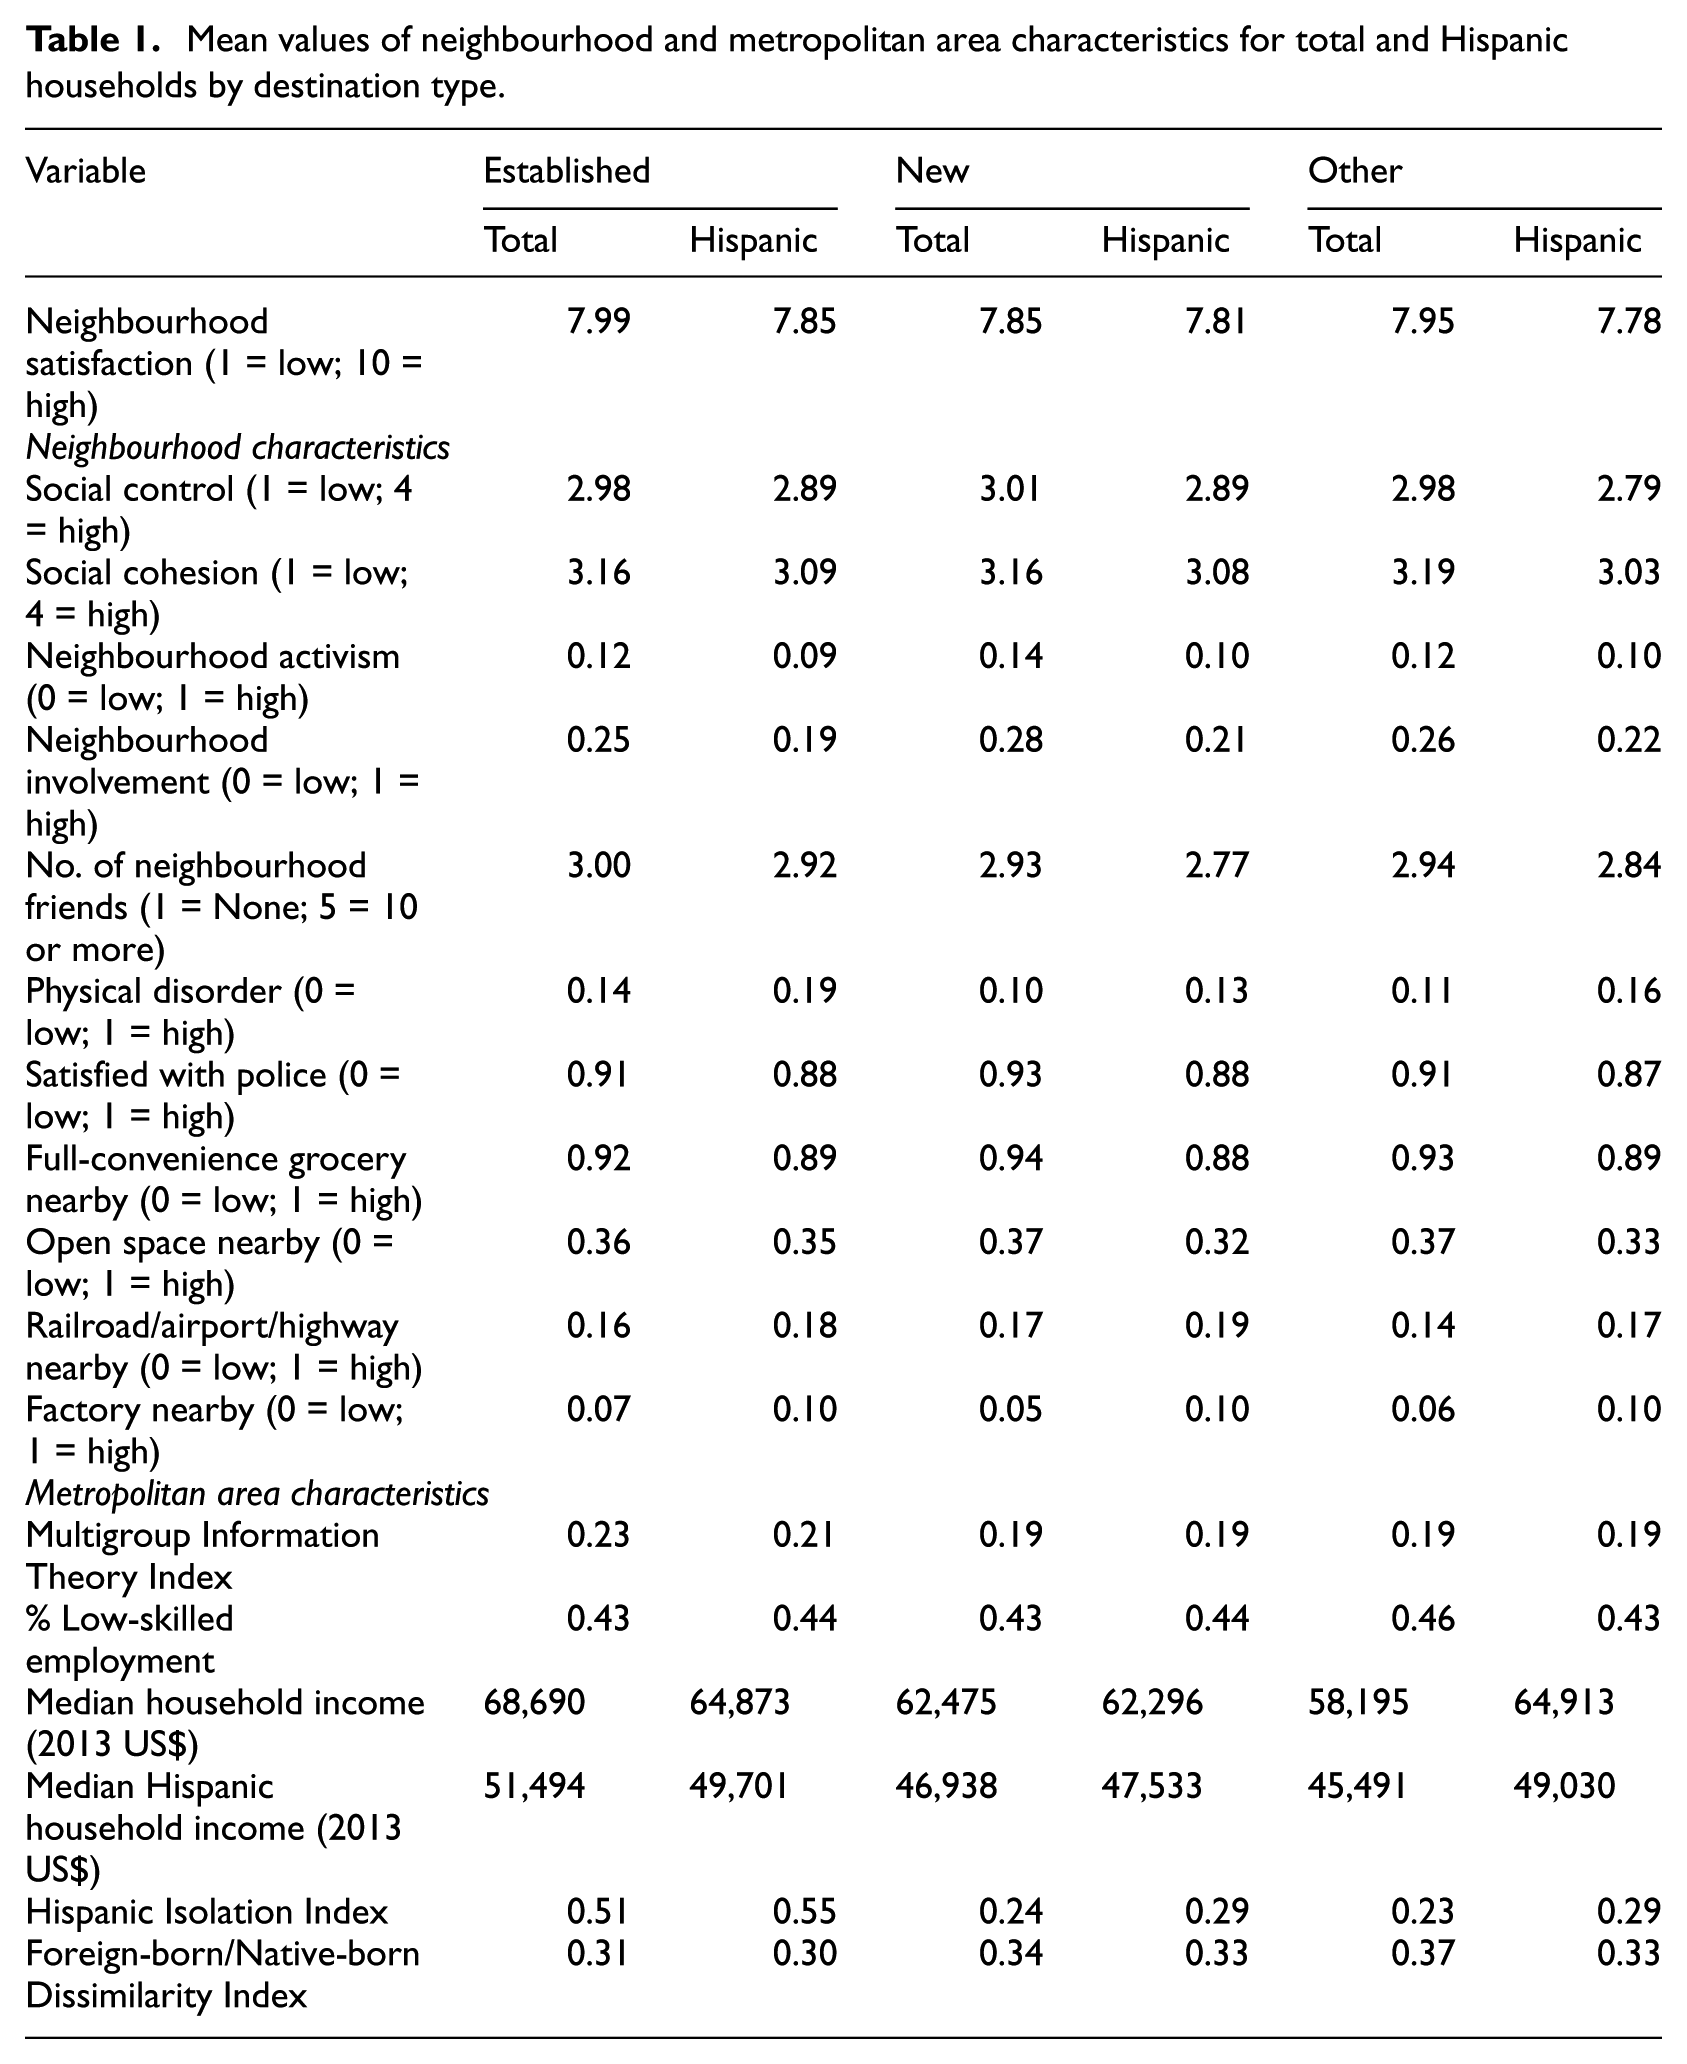
Mean values of neighbourhood and metropolitan area characteristics for total and Hispanic households by destination type.
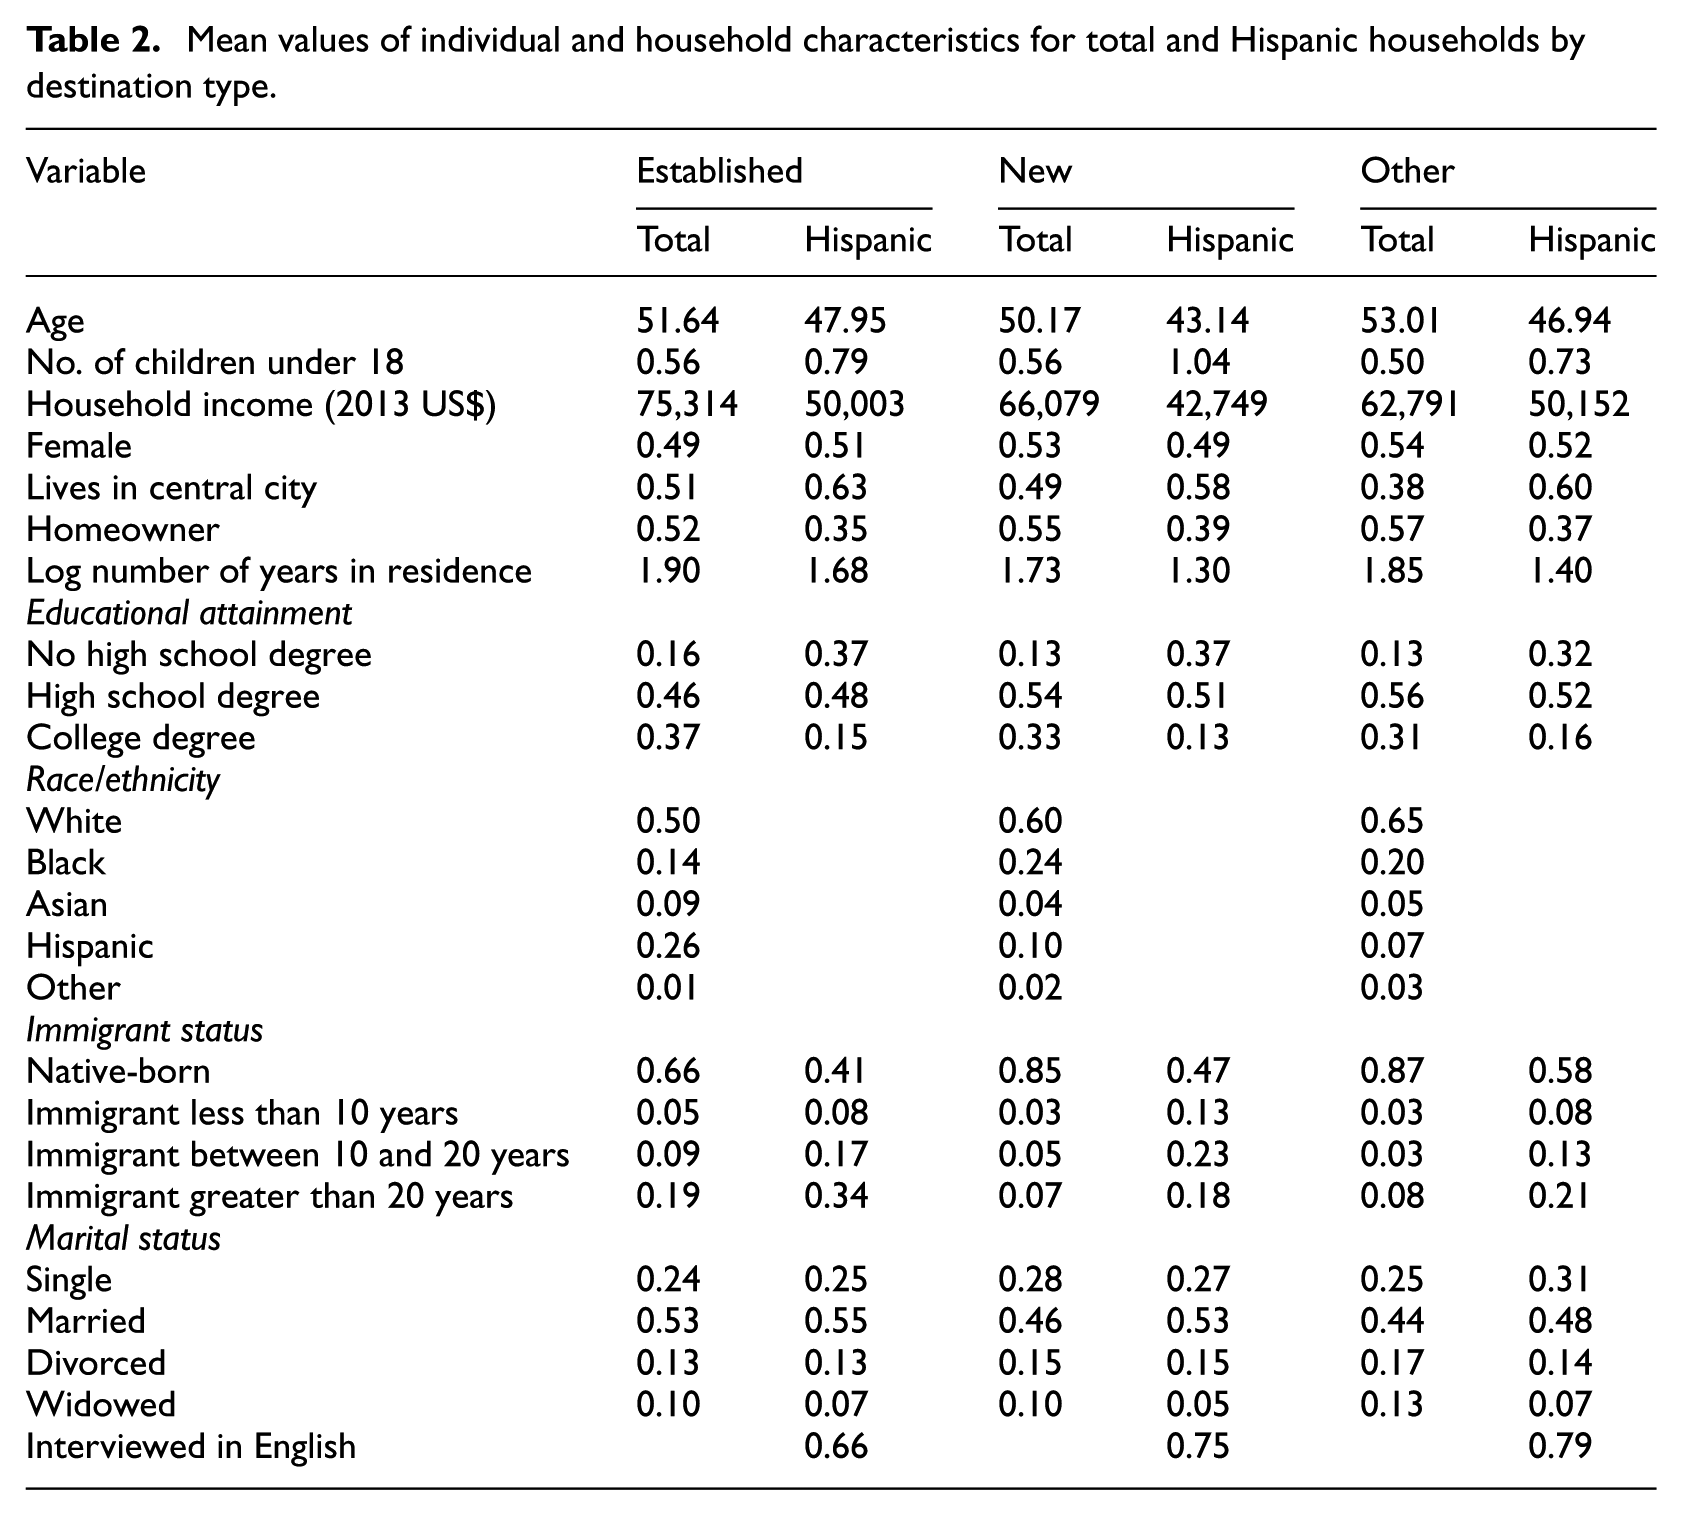
I controlled for a set of personal characteristics known to be associated with neighbourhood satisfaction. These characteristics included educational attainment (no high school degree, high school degree, bachelor’s degree), marital status (single, divorced, widowed, and married), gender, race/ethnicity (non-Hispanic white, non-Hispanic-black, non-Hispanic Asian, Hispanic, and other), nativity (native and foreign born separated by time since arrival to the USA), log household income, age, age squared, the number of children under the age of 18 living in the housing unit, homeowner status (owner/renter), and log number of years lived in current residence. I also controlled for whether the respondent lives in the central city or suburbs. I ran ordinary least squares models to assess multicollinearity. No variables had variance inflation factors above 4, which is well below the recommended cutoff (Hair et al., 1998) Summary statistics of individual and household control variables by destination type for the total sample and the Hispanic population are shown in Table 2.
Mean values of individual and household characteristics for total and Hispanic households by destination type.
Analytic approach
I used multivariate hierarchical linear modelling (HLM) to account for the nested structure of the data – respondents are nested within metropolitan areas – and to examine the influence of objective measures of the contextual environment. I first ran models using the total sample for all destinations combined and then separately. The purpose of these models is to establish differences in neighbourhood satisfaction levels for the total sample across destination type and compare Hispanics with other race/ethnic groups, primarily whites. I then ran multilevel models on just the Hispanic population. Similar to models on the overall population, I ran Hispanic-specific models for all destinations combined and then separately. I included a variable that proxies English proficiency (whether the interview was conducted in English) and replaced metropolitan area characteristics reflecting the overall population with their Hispanic equivalents. I kept the measure of low-skilled population but replaced the overall median household income with median Hispanic household income and the Information index with the Hispanic Isolation and foreign-born/native-born Dissimilarity indices.
I then ran models that examined differences between native- and foreign-born Hispanics within each destination type. In order to directly compare coefficients between these two groups, I ran a single model interacting destination type, nativity and all neighbourhood and metropolitan area characteristics. In order to simplify comparisons, I grouped foreign-born residents into a single category rather than separate them by duration. Because these models include numerous interaction terms, the interpretation of standard regression coefficients is difficult. Instead, I show bar graphs displaying the marginal effects of each neighbourhood variable for native-born and foreign-born Hispanics by destination type.
Results
Neighbourhood satisfaction levels by destination type
Table 3 presents HLM estimates of the determinants of neighbourhood satisfaction using the pooled sample of all metropolitan areas followed by samples of the destination areas, established, new and other. The estimation sample includes white, black, Asian, Hispanic and other race/ethnic households with whites acting as the reference group. Because the objective of these models is to establish differences in satisfaction levels for the total sample across destination type and to compare Hispanics with other race/ethnic groups, I do not show results for the independent variables, which are provided in the Appendix. I find that residents in new Hispanic destinations and other areas have lower neighbourhood satisfaction levels compared with residents living in established gateways. The coefficients indicate that the average resident in a new Hispanic destination or other metropolitan area reports a neighbourhood satisfaction level that is 2.5% and 1.9% lower than the average resident in an established Hispanic gateway.
A comparison of neighbourhood satisfaction across Hispanic destination type and race/ethnicity.

Notes: *p < 0.05, **p < 0.01, ***p < 0.001.
Results for individual, household, neighbourhood, and metropolitan area variables are provided in the Appendix.
I find that Hispanics are the only race/ethnic group reporting a higher level of neighbourhood satisfaction relative to white residents in the pooled sample. Hispanics report a neighbourhood satisfaction that is 2.1% higher compared with the average white resident. Hispanics also have higher satisfaction levels in new gateways and other areas, reporting neighbourhood satisfaction levels that are 3.0% and 3.8% higher than the average white resident. Hispanics, however, report similar satisfaction levels to white, Asian, and other race/ethnic groups in established destinations.
Table 4 presents regression estimates comparing differences in the levels and determinants of neighbourhood satisfaction for Hispanic residents. In contrast to the total sample, I find that Hispanic residents in new Hispanic gateways and other areas report higher neighbourhood satisfaction levels than their established destination peers. In comparison with the average Hispanic resident in an established metropolitan area, Hispanics in new destinations and other areas report neighbourhood satisfaction levels that are 3.1% and 4.1% higher after controlling for background characteristics. These results along with the findings from Table 3 indicate that new destination Hispanics are not only reporting greater levels of satisfaction relative to all race/ethnic groups, but are showing higher levels relative to their traditional destination counterparts.
Hierarchical linear regression estimates of Hispanic neighbourhood satisfaction by Hispanic destination type.

Notes: *p < 0.05, **p < 0.01, ***p < 0.001.
Determinants of Hispanic neighbourhood satisfaction by destination type
Turning to the determinants of neighbourhood satisfaction shown in Table 4, I find that social control, social cohesion, and physical disorder influence Hispanic neighbourhood satisfaction in both new and established destinations, revealing the robust importance of collective efficacy as a social determinant of satisfaction levels and signs of physical disorder as a physical determinant. In order to provide comparisons of the magnitude of these associations, the effects of moving from the 25th to the 75th percentile on physical disorder, social control, and social cohesion in established destinations are −0.49, 0.30, and 0.61, respectively, which translate into changes of −6.2%, 3.8%, and 7.7% in the neighbourhood satisfaction of the average Hispanic resident. The effects are larger in new destinations with Hispanics moving from the 25th to the 75th percentile on physical disorder, social control, and social cohesion experiencing a −0.91, 0.19, and 0.78 change, respectively, which translate into changes of −11.5%, 2.4%, and 9.9% for the average new destination Hispanic resident.
The other components of social capital – neighbourhood ties, activism, and organisational involvement – have no influence on Hispanic neighbourhood satisfaction in all destination types. Satisfaction with the local police and proximity to a full-convenience store are positively associated with satisfaction for Hispanics living in established destinations but not for Hispanics in new destinations. Conversely, proximity to an open space positively influences satisfaction for new gateway Hispanics but not for their established destination counterparts.
I also find important differences in the influence of metropolitan context. For the pooled sample, only Hispanic Isolation affects neighbourhood satisfaction. Here, higher levels of Hispanic residential contact with other Hispanic residents increases satisfaction levels. This finding, however, is only true in established destinations. Hispanics in established gateways are also sensitive to the percent of the labour force in low-skilled jobs, which is negatively correlated with neighbourhood satisfaction. In contrast, neither Hispanic segregation nor employment structure affects satisfaction levels in new destinations. Instead, foreign-born/native-born segregation positively influences neighbourhood satisfaction in new gateways. Hispanic socioeconomic status has no influence on Hispanic neighbourhood satisfaction in new and established destinations, but increases satisfaction levels for Hispanics living in other areas.
Hispanic neighbourhood satisfaction by nativity
The results in Table 4 show that neighbourhood satisfaction between native-born and immigrant Hispanic residents do not differ by destination type. However, there may be important differences in their determinants of neighbourhood satisfaction. Bar graphs displaying the marginal effects of neighbourhood and metropolitan area characteristics by nativity and destination type are shown in Figures 1 and 2. These graphs include 95% confidence intervals and only show results for the neighbourhood and metropolitan characteristics that exhibit statistically significant associations from 0 for any nativity group and destination type combination.
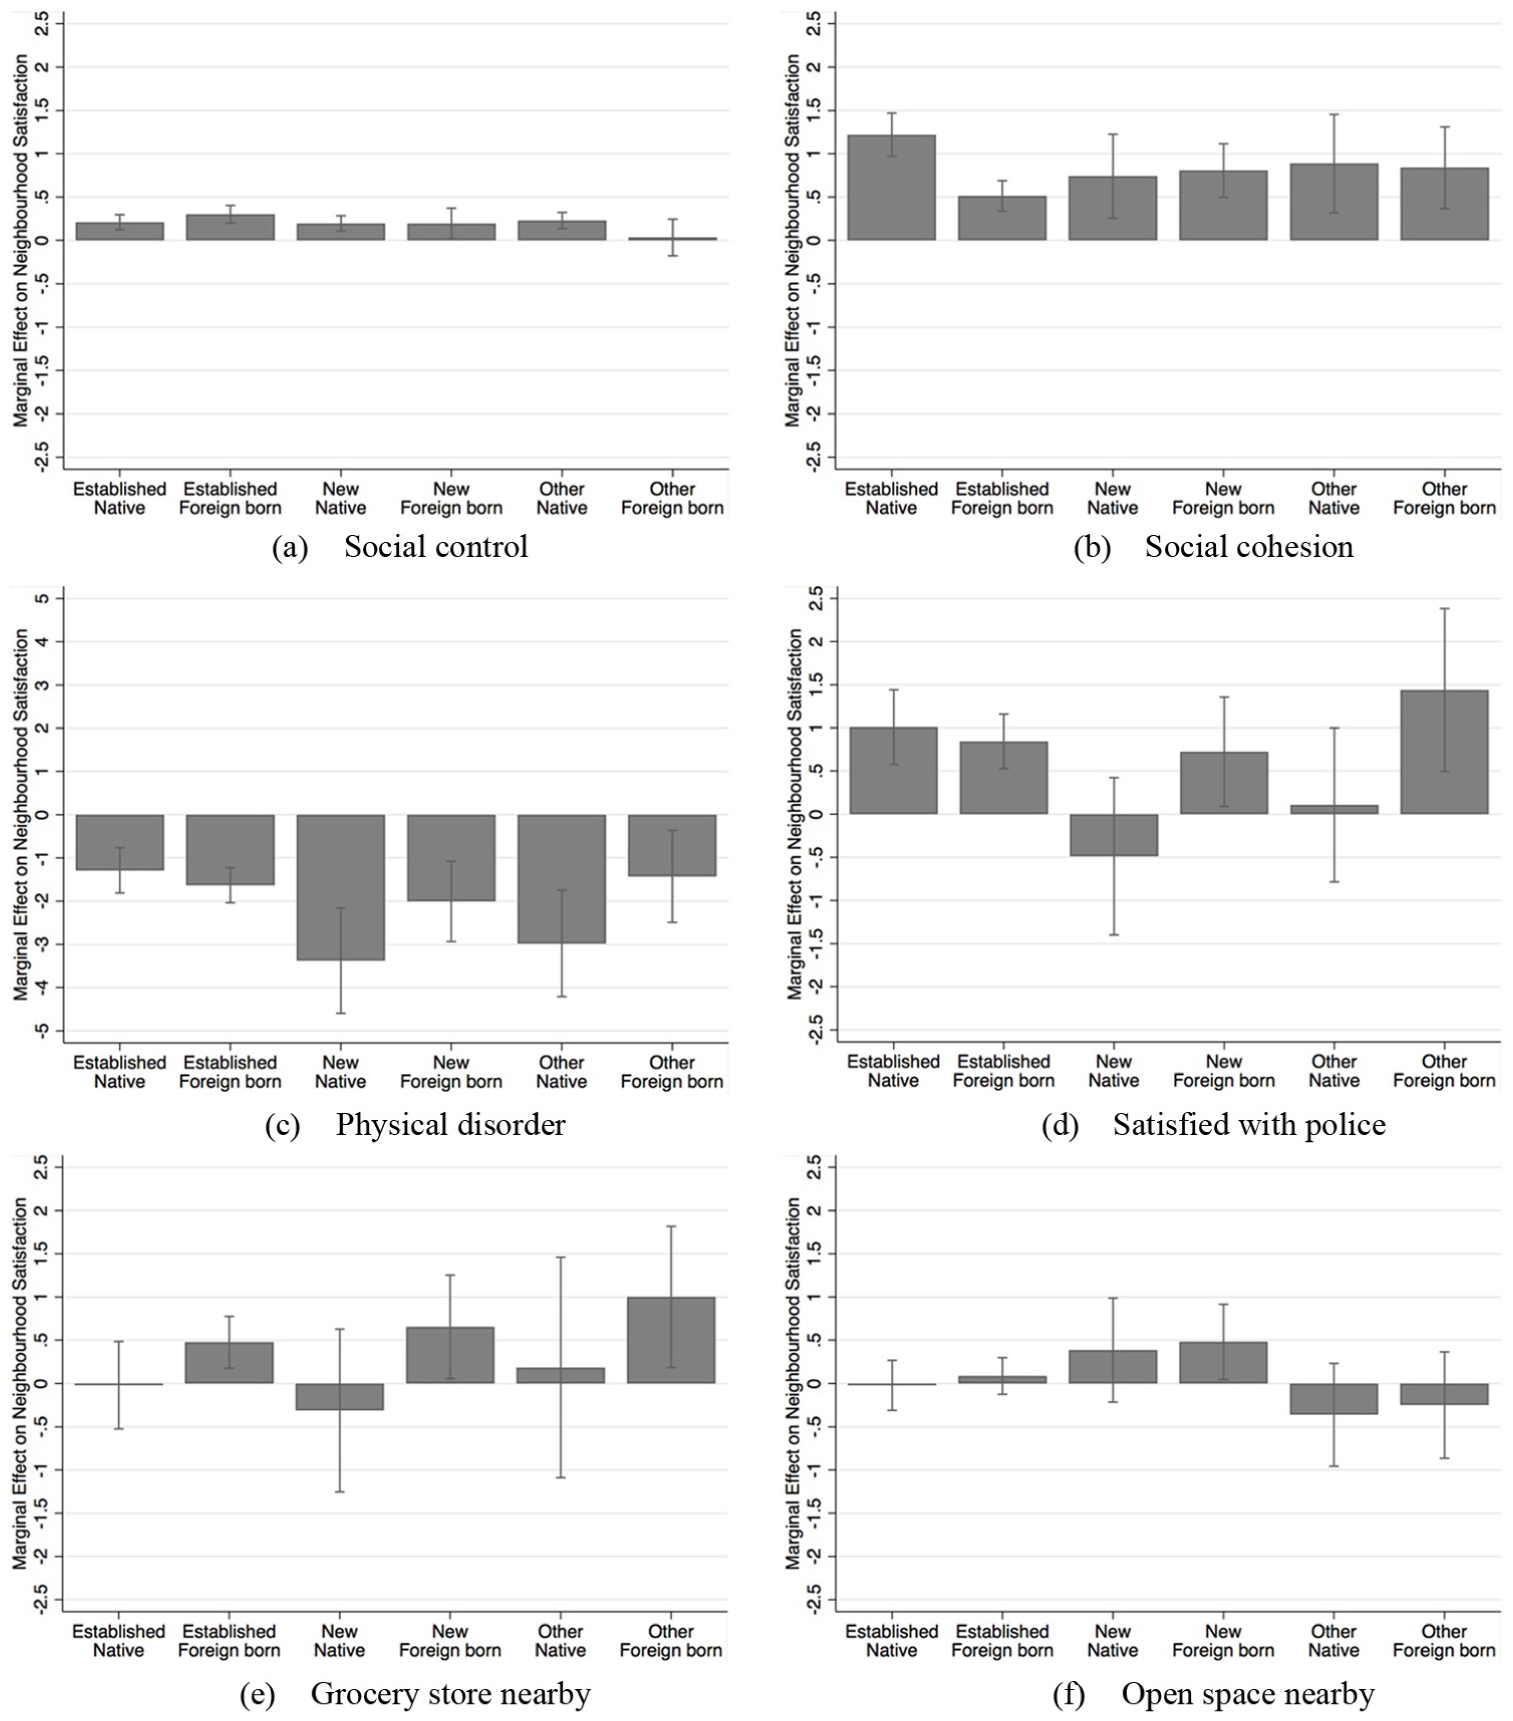
Marginal effects of neighbourhood characteristics on Hispanic neighbourhood satisfaction by nativity and destination type.
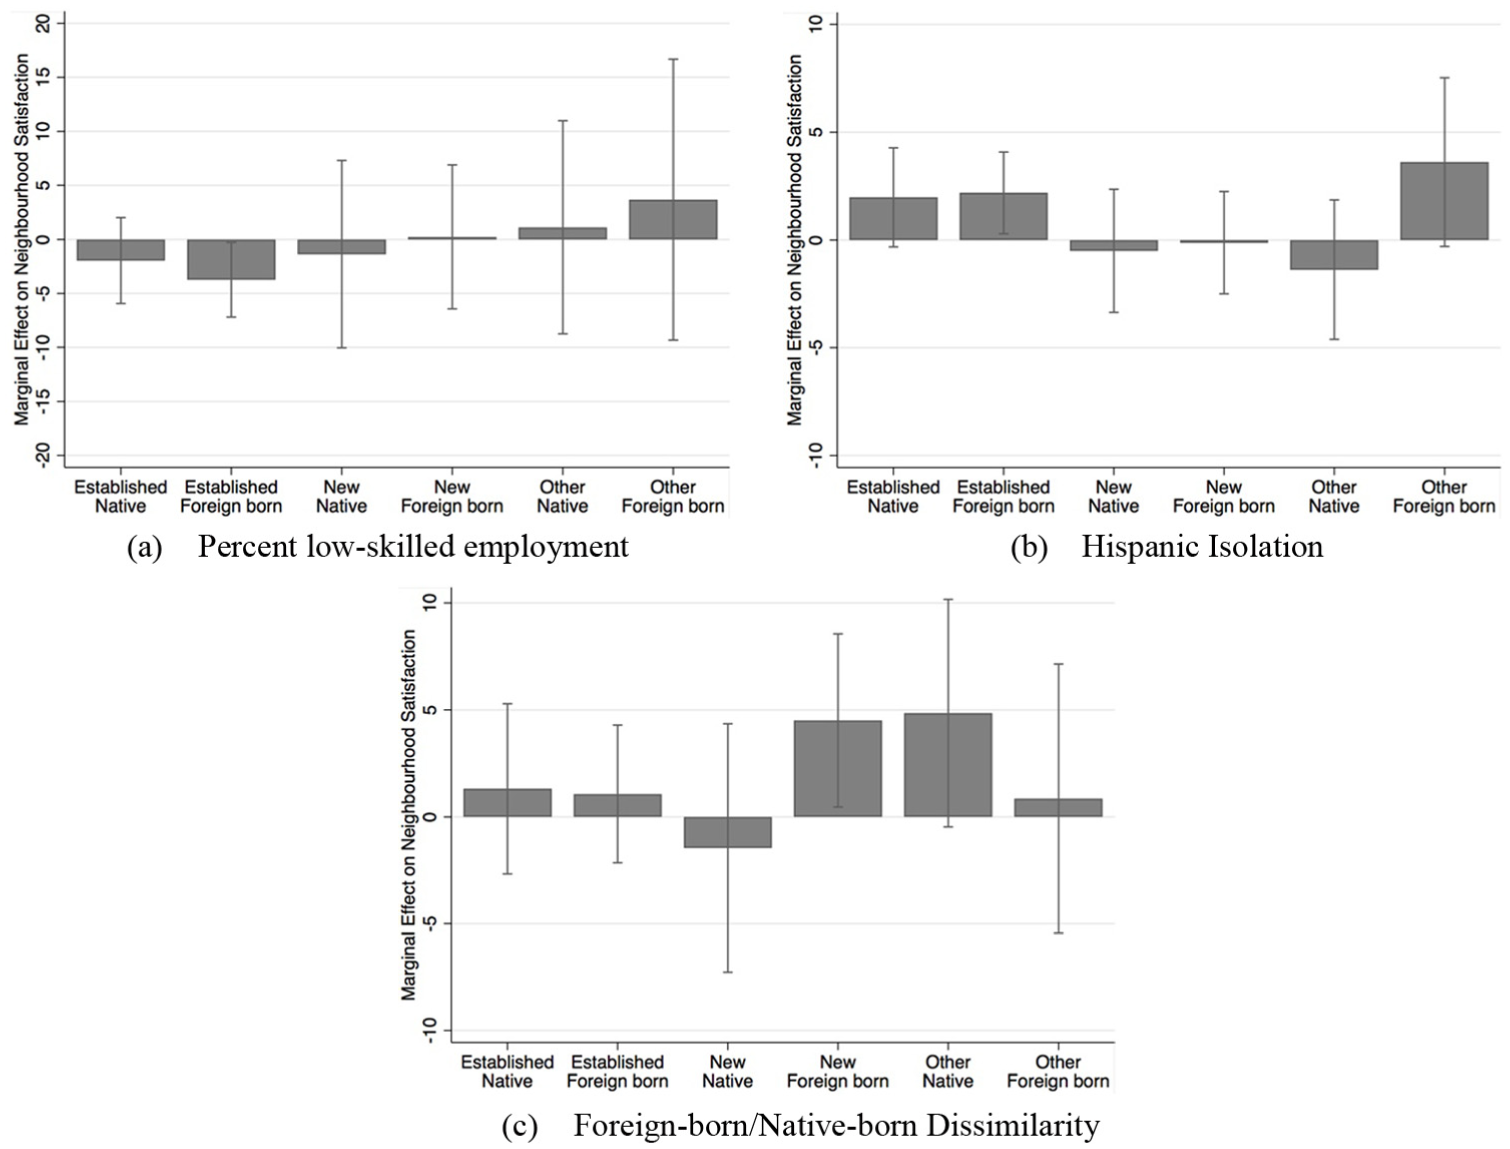
Marginal effects of metropolitan area characteristics on Hispanic neighbourhood satisfaction by nativity and destination type.
Several important findings emerge from these analyses. First, social cohesion, social control and physical disorder are associated with neighbourhood satisfaction across destination type and nativity (Figure 1(a)–(c)). These findings show the robustness of the association between these characteristics and neighbourhood satisfaction across nativity and destination type. Second, satisfaction with police is also statistically associated with satisfaction in established gateways for native- and foreign-born Hispanics, but is only significant for foreign-born Hispanics in new destinations (Figure 1(d)).
Relatedly, more neighbourhood characteristics exhibit statistically significant differences from 0 for foreign-born Hispanics relative to their native-born counterparts. Whereas native-born Hispanic residents incorporate physical disorder and collective efficacy, Hispanic immigrants are also influenced by satisfaction with the police, proximity to open space, and proximity to a grocery store in either or both new and established destinations.
This wider set of characteristics associated with neighbourhood satisfaction also includes metropolitan area context. Figure 2 shows that the significant associations of metropolitan area context shown in Table 4 apply only to foreign-born Hispanics. Hispanic immigrants in established destinations show statistically significant associations between neighbourhood satisfaction and percent low-skilled employment and Hispanic segregation. Similarly, the positive association of foreign-born/native-born segregation is true only for foreign-born Hispanic residents in new destinations.
Discussion and conclusion
This study’s first objective was to examine differences in neighbourhood satisfaction levels between residents living in new and established Hispanic metropolitan destinations. I demonstrate that residents in established destination neighbourhoods report lower levels of neighbourhood satisfaction after controlling for a wide set of individual and household characteristics. These results, however, apply to the total sample. New destination Hispanics report higher satisfaction levels compared with Hispanics in established destination cities. They also report higher satisfaction levels relative to white residents, which is not true for established gateway Hispanics and all race/ethnic groups in both destination types. Neighbourhood satisfaction measures the congruence, or lack thereof, between a resident’s actual and desired situation (Lu, 1999). Under this perspective and using Hispanics in traditional gateways and other race/ethnic groups, in particular whites, as benchmarks, the results indicate that Hispanics in new destinations are adapting to their residential environments.
The study’s second objective was to examine differences in the contextual characteristics associated with neighbourhood satisfaction. Of the neighbourhood social capital variables examined, only social cohesion and social control were associated with neighbourhood satisfaction for Hispanics across nativity and destination type. I found little evidence that other components of neighbourhood social capital influence Hispanic neighbourhood satisfaction. This result suggests that in the context of neighbourhood attachment, it is the specific construct of collective efficacy that matters for Hispanics. This result corroborates prior work showing collective efficacy as a distinct dimension of social capital separate from ties and involvement (Sampson and Graif, 2009). It is not ties or formal organisational involvement that influences Hispanic residential satisfaction, but the nature of informal social relationships and the norms and expectations generated from these relationships.
Social relations are likely affected by the broader spatial distribution of residents across race/ethnicity and class. I found that Hispanic neighbourhood satisfaction is associated with socioeconomic and racial/ethnic metropolitan context. However, I found differential associations by nativity group. I found that labour market structure and segregation enhances residential satisfaction for Hispanic immigrants in both new and established destinations, but not for native-born Hispanics. These results corroborate findings from Kritz et al. (2011), who concluded that immigrants consider both labour market characteristics and nativity concentration in their internal migration decisions. I add to these findings by showing that contextual effects differ by destination type. It is greater residential contact with Hispanics regardless of nativity that increases neighbourhood satisfaction for foreign-born Hispanics in established communities. In contrast, it is greater residential contact with immigrants that positively influences satisfaction for foreign-born Hispanics in new destination cities. The larger Hispanic population sizes, longer histories of Hispanic settlement, and greater availability of Hispanic cultural and socioeconomic amenities potentially blur the line between native and foreign-born distinctions in established Hispanic gateways. This is not the case in new destinations where Hispanic presence is generally lacking, and thus co-immigrant rather than co-ethnic residence matters more as an adaptation mechanism. Immigrant enclaves may also act as supportive buffers against a foreign and potentially hostile native-born population (Flippen and Parrado, 2012).
Physical disorder also plays an important role in the assessment of neighbourhood quality in new destinations. In addition to collective efficacy, physical disorder influences Hispanic neighbourhood satisfaction across all destination types and nativity groups. Policy makers often weigh the importance of physical and social aspects of neighbourhoods in best maintaining residents’ quality of life. My results indicate that both are important. As such, strategies should address modifications in the built environment that not only increase access to amenities and decrease physical signs of decay but also create opportunities for neighbours to interact and build social ties.
A limitation of the current study is that it relies on a single year’s data. Although the AHS is a longitudinal study of housing units, the neighbourhood social capital module was administered only in 2013. A cross-sectional analysis cannot preclude the possibility that greater neighbourhood satisfaction leads to greater collective efficacy rather than the opposite direction. This data limitation prevents the study from making strong causal claims. The study’s findings also cannot generalise to rural Hispanic destinations. Rural communities have experienced significant growth in Hispanic residents, many of which would lose population in the absence of Hispanic immigration (Kandel and Cromartie, 2004). These communities are likely to experience continued influxes of Hispanic and immigrant populations, and this process will accelerate given generational succession (Lichter and Johnson, 2006). Although the study’s findings are specific to metropolitan areas, they contribute to the literature on Hispanic rural settlement. An important question regarding rapid resettlement into rural areas unaccustomed to Hispanic and immigrant populations is whether Hispanics are able to adapt to these unfamiliar and potentially inhospitable communities. One domain of adaptation is socioeconomic wellbeing, which prior studies have found mixed results (Lichter and Johnson, 2009; Painter and Yu, 2014; Stamps and Bohon, 2006). This study shows that new destination Hispanics are acclimating on one measure of adaptation – residential satisfaction. Moreover, increasing collective efficacy appears to be a robust social mechanism for increasing residential satisfaction. These findings suggest that political and community stakeholders in new destination rural areas experiencing rapid Hispanic and immigrant population growth might consider social cohesion and control as avenues for easing incorporation. Increasing collective efficacy may lead to increases in neighbourhood satisfaction, which in turn is connected to residential stability, investment, and higher quality of life. For these reasons, understanding the factors contributing to increased social cohesion and social control in new destinations is an important avenue of future research for urban and rural researchers alike.
Footnotes
Appendix
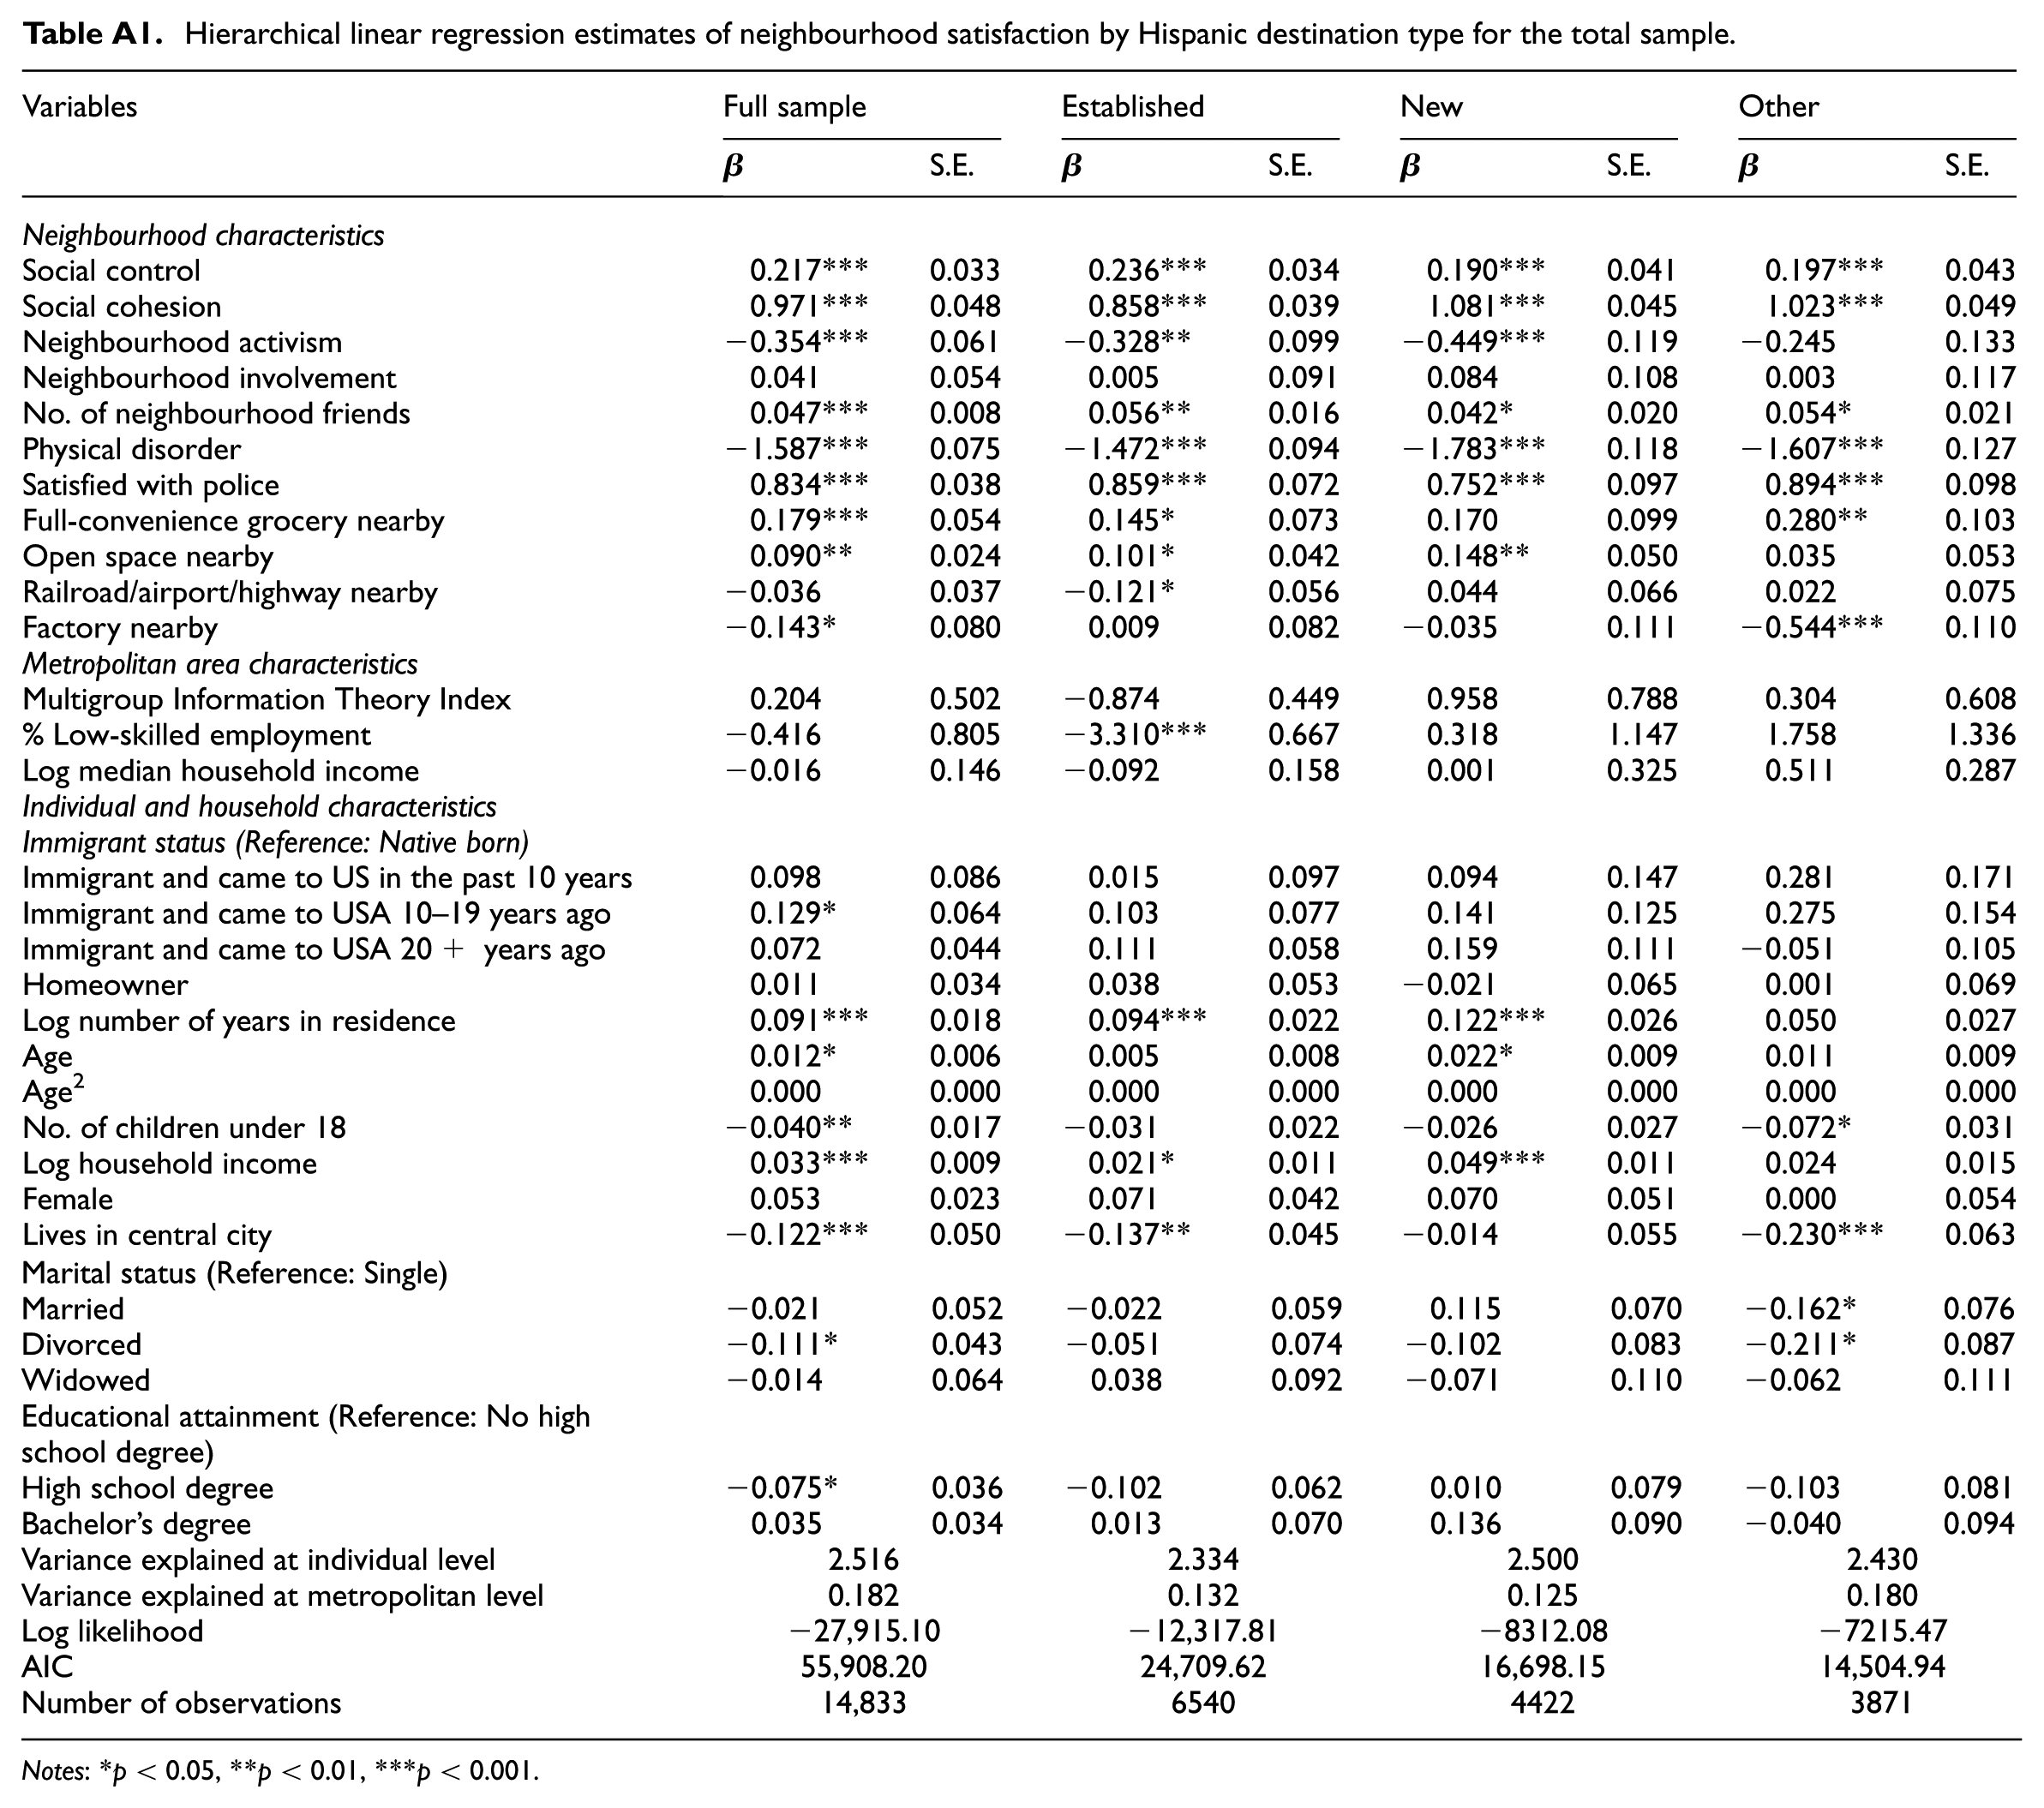
Hierarchical linear regression estimates of neighbourhood satisfaction by Hispanic destination type for the total sample.
| Variables | Full sample |
Established |
New |
Other |
||||
|---|---|---|---|---|---|---|---|---|
|
|
S.E. |
|
S.E. |
|
S.E. |
|
S.E. | |
| Neighbourhood characteristics | ||||||||
| Social control | 0.217*** | 0.033 | 0.236*** | 0.034 | 0.190*** | 0.041 | 0.197*** | 0.043 |
| Social cohesion | 0.971*** | 0.048 | 0.858*** | 0.039 | 1.081*** | 0.045 | 1.023*** | 0.049 |
| Neighbourhood activism | −0.354*** | 0.061 | −0.328** | 0.099 | −0.449*** | 0.119 | −0.245 | 0.133 |
| Neighbourhood involvement | 0.041 | 0.054 | 0.005 | 0.091 | 0.084 | 0.108 | 0.003 | 0.117 |
| No. of neighbourhood friends | 0.047*** | 0.008 | 0.056** | 0.016 | 0.042* | 0.020 | 0.054* | 0.021 |
| Physical disorder | −1.587*** | 0.075 | −1.472*** | 0.094 | −1.783*** | 0.118 | −1.607*** | 0.127 |
| Satisfied with police | 0.834*** | 0.038 | 0.859*** | 0.072 | 0.752*** | 0.097 | 0.894*** | 0.098 |
| Full-convenience grocery nearby | 0.179*** | 0.054 | 0.145* | 0.073 | 0.170 | 0.099 | 0.280** | 0.103 |
| Open space nearby | 0.090** | 0.024 | 0.101* | 0.042 | 0.148** | 0.050 | 0.035 | 0.053 |
| Railroad/airport/highway nearby | −0.036 | 0.037 | −0.121* | 0.056 | 0.044 | 0.066 | 0.022 | 0.075 |
| Factory nearby | −0.143* | 0.080 | 0.009 | 0.082 | −0.035 | 0.111 | −0.544*** | 0.110 |
| Metropolitan area characteristics | ||||||||
| Multigroup Information Theory Index | 0.204 | 0.502 | −0.874 | 0.449 | 0.958 | 0.788 | 0.304 | 0.608 |
| % Low-skilled employment | −0.416 | 0.805 | −3.310*** | 0.667 | 0.318 | 1.147 | 1.758 | 1.336 |
| Log median household income | −0.016 | 0.146 | −0.092 | 0.158 | 0.001 | 0.325 | 0.511 | 0.287 |
| Individual and household characteristics | ||||||||
| Immigrant status (Reference: Native born) | ||||||||
| Immigrant and came to US in the past 10 years | 0.098 | 0.086 | 0.015 | 0.097 | 0.094 | 0.147 | 0.281 | 0.171 |
| Immigrant and came to USA 10–19 years ago | 0.129* | 0.064 | 0.103 | 0.077 | 0.141 | 0.125 | 0.275 | 0.154 |
| Immigrant and came to USA 20+ years ago | 0.072 | 0.044 | 0.111 | 0.058 | 0.159 | 0.111 | −0.051 | 0.105 |
| Homeowner | 0.011 | 0.034 | 0.038 | 0.053 | −0.021 | 0.065 | 0.001 | 0.069 |
| Log number of years in residence | 0.091*** | 0.018 | 0.094*** | 0.022 | 0.122*** | 0.026 | 0.050 | 0.027 |
| Age | 0.012* | 0.006 | 0.005 | 0.008 | 0.022* | 0.009 | 0.011 | 0.009 |
| Age2 | 0.000 | 0.000 | 0.000 | 0.000 | 0.000 | 0.000 | 0.000 | 0.000 |
| No. of children under 18 | −0.040** | 0.017 | −0.031 | 0.022 | −0.026 | 0.027 | −0.072* | 0.031 |
| Log household income | 0.033*** | 0.009 | 0.021* | 0.011 | 0.049*** | 0.011 | 0.024 | 0.015 |
| Female | 0.053 | 0.023 | 0.071 | 0.042 | 0.070 | 0.051 | 0.000 | 0.054 |
| Lives in central city | −0.122*** | 0.050 | −0.137** | 0.045 | −0.014 | 0.055 | −0.230*** | 0.063 |
| Marital status (Reference: Single) | ||||||||
| Married | −0.021 | 0.052 | −0.022 | 0.059 | 0.115 | 0.070 | −0.162* | 0.076 |
| Divorced | −0.111* | 0.043 | −0.051 | 0.074 | −0.102 | 0.083 | −0.211* | 0.087 |
| Widowed | −0.014 | 0.064 | 0.038 | 0.092 | −0.071 | 0.110 | −0.062 | 0.111 |
| Educational attainment (Reference: No high school degree) | ||||||||
| High school degree | −0.075* | 0.036 | −0.102 | 0.062 | 0.010 | 0.079 | −0.103 | 0.081 |
| Bachelor’s degree | 0.035 | 0.034 | 0.013 | 0.070 | 0.136 | 0.090 | −0.040 | 0.094 |
| Variance explained at individual level | 2.516 | 2.334 | 2.500 | 2.430 | ||||
| Variance explained at metropolitan level | 0.182 | 0.132 | 0.125 | 0.180 | ||||
| Log likelihood | −27,915.10 | −12,317.81 | −8312.08 | −7215.47 | ||||
| AIC | 55,908.20 | 24,709.62 | 16,698.15 | 14,504.94 | ||||
| Number of observations | 14,833 | 6540 | 4422 | 3871 | ||||
Notes: *p < 0.05, **p < 0.01, ***p < 0.001.
Declaration of conflicting interests
The author(s) declared no potential conflicts of interest with respect to the research, authorship, and/or publication of this article.
Funding
The author(s) received no financial support for the research, authorship, and/or publication of this article.