
Abstract
Existing research on how the built environment affects physical activity and obesity has mainly focused on neighbourhood-scale features, such as land use mix, street connectivity and density. This research hypothesises that metropolitan-scale built-environment characteristics, such as polycentricity, should also play an important role. The impacts of the metropolitan built environment on individual travel behaviour will further affect how individuals allocate their time for sedentary activities, moderate physical activities and vigorous exercise, which in turn should affect individual weight status. This research uses the American Time Use Survey from 2003 to 2007 and spatial statistical polycentricity metrics for hypothesis testing. A multi-level path analysis reveals that living in a relatively polycentric region is significantly associated with a lower obesity probability with multiple paths: individuals living in relatively polycentric regions tend to spend less time on sedentary activities and more time on moderate-to-vigorous physical activities, which increases their daily energy expenditure; beyond the linkage to energy expenditure, living in a relatively polycentric region is directly associated with a lower obesity probability, which suggests other ways that the polycentric structure influences individual weight status. This research furthers the literature by examining how the formats of metropolitan spatial development are relevant to broader issues of individual lifestyles and public health. The results suggest that regionwide efforts to cultivate suburban centres of increased density could lead to significant public health benefits.
Introduction
How the built environment has impacted physical activities and thus population health has been richly researched (Frank et al., 2004; Frumkin, 2002; Frumkin et al., 2004; Hales et al., 2017; Handy et al., 2002; Papas et al., 2007; Sallis and Glanz, 2006). A growing amount of literature demonstrates the important impact of built environment on physical activity patterns; much of this has concentrated on neighbourhood-level aspects of built environment, such as land use mix, residential density and street connectivity (Handy et al., 2002; Zhou et al., 2017). Less is known about the influence of the metropolitan/regional-level built environment, such as the degree of concentration or decentralisation, the clustering of suburban activities, regionwide access to work and retail opportunities and the degree and formats of polycentric development.
Towards this end, this article investigates the influence of the metropolitan-level built environment, particularly polycentric development, on individual active lifestyles and weight status in the US. It uses American Time Use Surveys (‘ATUS’) from multiple years, and their Eating and Health Modules (‘EH’), for testing the mechanisms by which the metropolitan-scale built environment influences individual weight status by affecting individual time use for sedentary activities, moderate physical activities and vigorous exercise.
By doing so, we aim to advance our knowledge of how metropolitan-level planning, including large-scale infrastructure intervention, can help promote individual physical activity and population health. Compared with community organisations and city governments that plan, design and manage the built environment at the neighbourhood scale, regional councils and metropolitan planning organisations encourage the land use coordination of local governments in order to shape the metropolitan-scale built environment (Envision Utah, 2003; MAPC, 2005). The way these metropolitan or regional planning efforts for alternative metropolitan-scale built environment patterns might affect individual lifestyles and population health has not been systematically examined, something which also motivated this research.
Literature review
Physical activity and the built environment at different scales
The term ‘built environment’, as used in the existing literature, can take on different meanings, depending on the geographic scale. The effects of the built environment on physical activity can be evaluated at the site level, neighbourhood level or regional level, each with different implications for health-promoting strategies. One group of studies approaches the macro built environment by examining the regional urban development characteristics of metropolitan areas (Kelly-Schwartz et al., 2004; Shen, 2000; Yang et al., 2012). The other group, motivated by an interest in the site or in urban design and enabled by the availability of spatially detailed data, employs a micro approach and studies the influence of neighbourhood design characteristics.
The micro approach has received most attention in the literature. At the site level, a lively environment may attract more sedentary people to initiate physical activity (King et al., 2006; Zhou et al., 2017; Zimring et al., 2005). Other studies show that the physical characteristics of a neighbourhood, particularly the presence of green spaces and parks, can encourage physical activity (Bancroft et al., 2015; Ellaway et al., 2005). On a larger scale, such as at the county level, making travel, recreation or entertainment opportunities accessible via non-motorised transportation also matters. Proximity to biking paths, trails and non-residential destinations (Ewing et al., 2003; Frank et al., 2004; Saelens et al., 2003), and accessibility to public transport within walking distance (Krizek and Johnson, 2006; Smith et al., 2017), all promote physical activity. In addition, the literature has emphasised non-motorised transportation as a bridge between the neighbourhood-level built environment and physical activity. Density, land use mix and street connectivity are believed to be important factors, since they are relevant to individual travel mode selection (Handy et al., 2002), the efficient use of infrastructure and possibly vibrant street life (Forsyth et al., 2008).
Despite the significant research steps mentioned above, one should exercise caution when applying micro-level empirical research results to policy-making or planning in a large urban context. Individuals’ activities are not only affected by the neighbourhoods or counties in which they live; they are also affected by the conditions of the built environment in the neighbouring communities and counties and even the whole metropolitan region, which is particularly true when individual travel is considered (Lathey et al., 2009; Yang and Ferreira, 2008). In the past decade, the metropolitan landscape has cultivated automobile-based mobility in North America, which in turn enables individuals and households to seek jobs, housing, shopping and entertainment opportunities throughout the metropolitan region, rather than being limited only to opportunities nearby. The decentralised urban spaces in North America have significant impacts on how people travel, the length of time they spend travelling, where they shop for food and how they allocate their daily time. In the US, the metropolitan-scale built environment could thus have significant impacts on individual time allocation for physical activities.
One fundamental change in the metropolitan-scale built environment is the emergence of polycentric development. Here, polycentric structure refers to the physical forms of the metropolitan region (Kloosterman and Musterd, 2001), and is defined as the decentralised but clustered formation of relatively high-density activities (Yang et al., 2012). Since the 1950s, there has been a substantial growth in the number of jobs and residents in suburban areas (Bogart and Ferry, 1999). These suburban activities either clustered in suburbia, or sprawled out without significant clustering. A polycentric structure results from the emergence of high-density nodes in the suburban area, while a monocentric structure results from the sprawl of urban land use without significant centring (Kloosterman and Musterd, 2001). A distinction should be drawn between the polycentric structure and high density. In order to be polycentric, a region should have significant density variation. High density everywhere or low density everywhere does not create a polycentric structure. To examine whether a polycentric structure matters or not is not to examine whether neighbourhood or regional density makes a difference, but whether the spatial variation of density matters.
Health impacts of the metropolitan-level built environment: Multiple mechanisms
While the perspective of the metropolitan built environment has important implications for health research and policy-making, current research on whether density matters does not capture the full impact of the high-density suburban nodes. Metropolitan built environment, such as decentralisation and suburban centring, could affect the morbidity of obesity in various ways. First, the polycentric structure has been demonstrated to be a more influential factor affecting physical activity behaviours than site-level or neighbourhood-level aspects of built environment (Horner, 2002; Shen, 2000; Sun and Yin, 2018; Wheeler, 2008; Yang and Ferreira, 2008). The polycentric structure suggests the spatial variability of neighbourhood-level density, or more broadly the variability of neighbourhood-level built environment, as street connectivity and land use mix tend to change according to density. Since the high variability of neighbourhood-level built environment could match varieties of demand of individual households, it could then improve the chance of individual households establishing residence in neighbourhoods without being forced to commute long distances (Cervero and Wu, 1997; Schwanen et al., 2003). Since long and exhausting commutes could reduce individual exercise time and increase time spent on sedentary activities, the savings in travel could release time and energy for more physical activities.
The increase in physical activities then could reduce the morbidity of obesity in different ways. First, moderate- and vigorous-intensity activities could increase the metabolic rate and thus add to the energy cost of individuals. For example, moderate-intensity activities, including walking and biking, require a 3.0 to 5.0 times higher metabolic rate (MET) than resting; vigorous-intensity activities, including fast jogging, running and other sweat-inducing activities with rapid breathing and a substantial increase in heart rate, require over 6.0 times higher MET (US Department of Health and Human Services, 2008). By doing moderate-to-vigorous physical activities, individual energy expenditure could be increased and the risk of obesity could be decreased. Second, many moderate-to-vigorous intensity activities are muscle-strengthening activities, which could help increase the basal metabolic rate and thus decrease the risk of obesity (Oja and Titze, 2011; Zurlo et al., 1990). In contrast, sedentary activity could mediate muscle loss, reducing the basal metabolic rate and thus increasing the risk of obesity (Paddon-Jones, 2006; Ravussin et al., 1988).
Furthermore, not only can the polycentric structure impact the activities of the residents who live there, but it can also draw travellers across the region for work, dining, shopping and recreational purposes. Strong suburban centres in the low-density suburban area provide not only urban amenities to local residents who live in suburban clusters, but also aggregated points of interest which can offer better trip chaining opportunities for residents in the wide metropolitan area. Better trip chaining opportunities then increase not only physical activity itself, but also the accessibility of healthy food and sports facilities, as strong suburban centres tend to more easily attract the numbers of customers needed for operating healthy food retails (Larsen and Gilliland, 2008), which can emancipate suburban residents from the unhealthy food deserts (Walker et al., 2010). Therefore, the health impacts of the polycentric structure are not merely through mediating travel modes and physical activity behaviours, but also through other mechanisms. Without sufficiently accounting for these multiple mechanisms (Figure 1), estimates of the impacts of metropolitan-level built-environment variables on physical activity and obesity could potentially be biased. To prevent such bias, we try to enrich the existing literature by developing metropolitan-scale built-environment measures, assessing their impacts on individual activity patterns and weight status and exploring the planning implications.
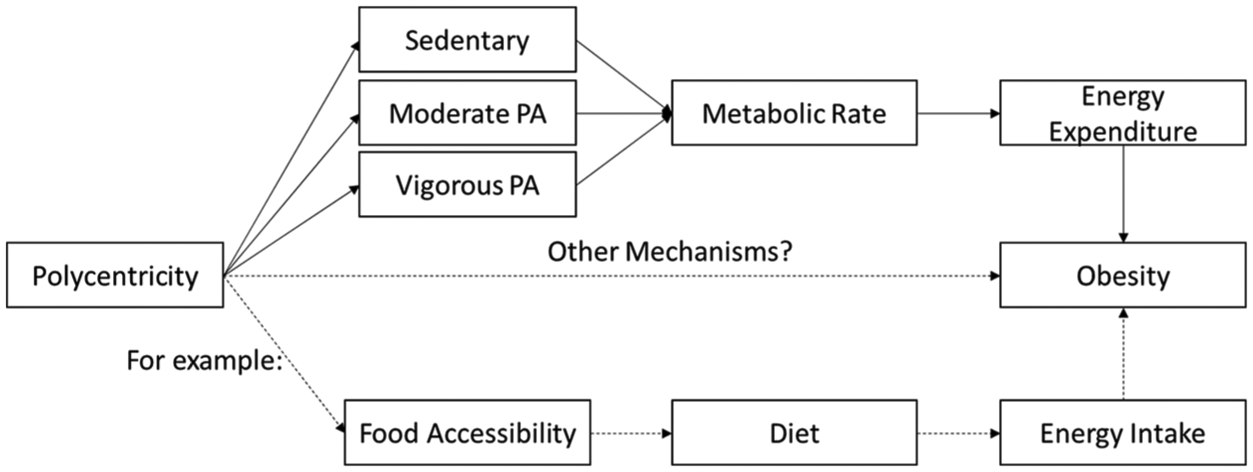
Multiple mediating path impacts of polycentric development upon individual weight status: A conceptual model. (This study is going to test the mechanisms with solid lines).
Materials and methods
Measuring polycentric development in US metropolitan areas
We characterise the metropolitan built environment with policy-sensitive polycentric measures so that analysis results can be used to inform metropolitan/regional planning. Census-tract-level population data is used to compute the polycentricity scores for the 50 largest US metropolitan areas (US Census Bureau, 2000). We categorise the census tracts of the US into four groups according to population density, i.e. low, moderate, relatively high and high-density.
After this, a polycentricity indicator is developed to quantify the spatial distribution of high-density tracts (see Yang et al., 2012 for detailed calculations). The calculation of the polycentricity scores is based on the spatial distributions of census tracts with different population densities. Two directional distribution ellipses were calculated to respectively characterise the dispersion of high-density tracts (with over 10 times the average population density) and the entire metropolitan region, which includes every tract. The polycentricity score is equal to the area of the ellipse of the high-density tracts divided by the area of the regional ellipse. The value of the polycentricity score ranges from 0 to 1. The higher the value, the more widely distributed the high-density tracts, and the more polycentric the region is.
The calculated polycentricity score for each metropolitan area is sensitive not only to the size of its suburban centres, but also to their number and location. Increases in population size in the given centres or in the number of suburban centres, or an outward shift of a centre, are all associated with increased polycentric scores. This spatial statistical approach can also be used to calculate polycentricity scores for employment, retail and entertainment opportunities, by simply replacing the population distribution data with that of employment, retail and entertainment opportunity data. These polycentric measures, therefore, complement existing regional planning efforts to retrofit American suburban areas by cultivating relatively high-density suburban activity centres. An extended discussion of our polycentricity measure can be found in Yang et al. (2012).
The American Time Use Survey
The American Time Use Survey (ATUS) is used in this study. The ATUS is conducted by the Bureau of Labor Statistics annually (http://www.bls.gov/tus/). Households are selected randomly from those participating in the Current Population Survey (CPS). We use the ATUS data of the period 2003–2008, comprising over 85,000 individual time uses of different types of activities over the course of 24 hours. About 25,000 of ATUS respondents were selected to participate in the survey on Eating and Health. Compared with other data sources in public health research, this subset of the ATUS dataset has rich information on the time use of different activities and helps us explore the metabolic rates of both task and rest, that is, two core determinants of individual weight status. ATUS also provides socioeconomic and demographic information such as age, gender, marital status, ethnicity, education, income and residence location, as well as individual self-reported height and weight, among a subset of respondents. In addition to the detailed activity and socioeconomic information, one advantage of the ATUS national survey data is good geographic coverage. In order to reveal how polycentricity affects physical activity and obesity, multiple metropolitan areas with varied polycentricity should be included for statistic inference. We find that this survey includes metropolitan areas of different sizes, development histories and polycentricity scores.
The various physical activities were categorised into three types: sedentary activity, moderate activity and vigorous activity. Then, the daily time use of each type of activity was calculated. Since the impacts of built environment on individual activities are cumulated for years and the impacts of activity on weight status are also cumulated for years, we use the average daily time use of each activity from the five years’ surveys instead of a single year’s data. To examine the contribution of physical activity in affecting METs, the Compendium of Physical Activity was used to assign ATUS activity codes with certain MET values (Ainsworth et al., 1993; Tudor-Locke et al., 2009). With the time use of individual activities and the MET value for each activity, daily accumulated METs were calculated to represent the energy expenditure level of the total physical activity (PA) (Kang et al., 2018). Individual weight status is measured using the Body Mass Index (BMI), which is calculated as an individual’s body weight divided by the square of their body height (BMI 18.0 to 24.9 = Normal; BMI 25.0 to 29.9 = overweight; and BMI 30.0 or more = obese) (Merck Manuals Professional Edition, 2014). The individual height and weight data in the later years of the survey (2006 and 2007) were used in this study to represent the results of the cumulative influence.
The average daily time spent on sedentary, moderate and vigorous activities is 808.9 mins, 93.4 mins and 4.5, respectively. In Figure 2, the average daily time spent in sedentary activities varies significantly among metropolitan areas. While one might expect less-sprawling regions to be associated with more active living and less time for sedentary activities, the correlation is not straightforward on the map. For example, both the sprawling Atlanta and the high-density New York region belong to the relatively non-active group, which suggests that alternative measures for large-scale built-environment and robust statistical models are needed in order to produce valuable information for urban development planning for city/county governments and metropolitan planning organisations.
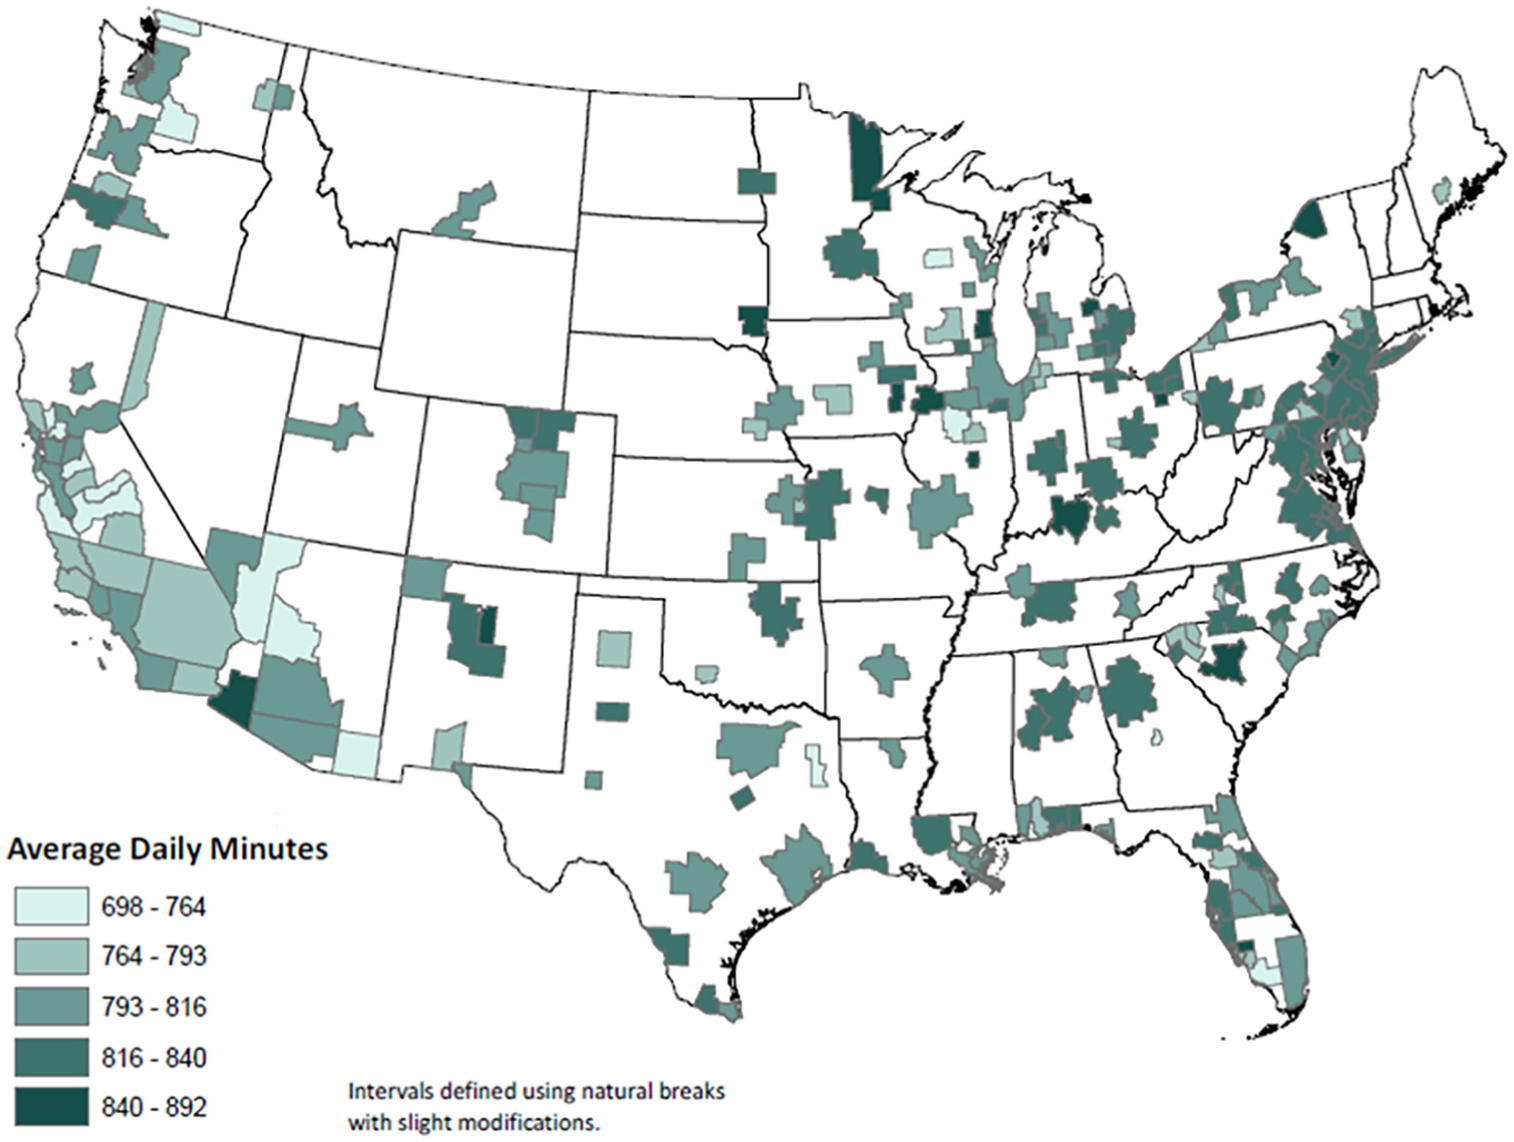
Average daily minutes spent on sedentary activities by metropolitan area (2003–2007).
Multi-level path analyses: Linking polycentricity and obesity
By examining how polycentric development affects individual weight status in conjunction with individual physical activities of different intensities and their accumulated METs, we hope a connection can be identified between metropolitan-scale built environment and public health. First, two-level regressions are estimated to see the significance of the effect of polycentric structure, where the within-level represents the individuals and the between-level represents the counties, that is, individuals nested within counties. Model 1 is a binary logistic regression model for individual weight status, which equals 1 when an individual is obese. Model 2 is a linear regression model for the daily time use of sedentary activity. Models 3 and 4 are log-linear regression models using the daily time use of moderate and vigorous activities as the dependent variables, as the time uses of the three activities are not normally distributed.
The polycentricity score is considered as a county-level independent variable. We consider a polycentricity score higher than 0.25 to be a high polycentric structure, as it means the equivalent radius of the high-density ellipse is over half of the total radius of the metropolitan region. Our analyses include two control variables to characterise the metropolitan-level built environment: the land area of the metropolitan region (by square mile), and the population density of the region (people per square mile); both are also collected from the census-tract-level population data (US Census Bureau, 2000). As suburban centres are often developed along with the spatial expansion and density changes of the metropolitan region, it is necessary to examine the impacts of the polycentric structure together with metropolitan size and density. Otherwise, the estimated coefficients could be biased.
Following relevant literature on physical activity and obesity (Gordon-Larsen et al., 2006; Wen and Zhang, 2009), our models include eight groups of individual-level socioeconomic attributes. These are age, gender, parental status, marriage status, if the individual is a parent of a child or not, education, income and ethnicity. The residence location variable, which indicates whether the individual lives in a principal city (the largest city of the metropolitan region), is also controlled. The individual and geographic variables and participants’ distributions on major variables of interest are listed in Table 1.
Socioeconomic and geographic features of samples.

Second, two-level path analyses are estimated, where the within-level represents the individuals and the between-level represents the counties, that is, individuals nested within counties. The within and between levels of independent variables were the same with the multi-level regressions, and the dependent variable is individual weight status, which equals 1 when an individual is obese. Individual physical activities of different intensities were modelled as mediators, since the polycentric structure of the metropolitan area may have various influences on different types of physical activities and then affect individual weight status. The individual accumulated METs were also modelled as a mediator since physical activities of different intensities make various contributions to accumulated METs, and then affect individual weight status. Since the health issue here is the obesity epidemic, the path analyses exclude those individuals who are underweight or of normal weight, and focus on the overweight and obese groups. The dependent variable is thus a binary variable (0 for overweight, 1 for obese).
We use sampling weights in the estimation of parameters. Unlike their younger counterparts, older people may not have commuting travel behaviours and their metabolic rate cannot be equally compared with that of younger groups; older groups (over 65) were therefore excluded from the models. In the end, 7880 observations were considered in our models. The goodness-of-fit indices test includes the Comparative Fit Index (CFI), Tucker-Lewis Index (TFI) and Root Mean Square Error of Approximation (RMSEA) (Hu and Bentler, 1999). Standardised path coefficients are reported, to compare the effects of independent variables. We apply Mplus Version 7.1 for the multi-level path analyses (Muthen and Muthen, 2012).
Results
Weight status and physical activity: Effects of individual and metropolitan-level built environment
Table 2 shows the associations between individual weight status (Model 1), time for sedentary physical activities (Model 2), time for moderate physical activities (Model 3), time for vigorous physical activities (Model 4), socioeconomic status and metropolitan-level built environment factors. These statistical relationships appear to reveal similar relationships between socioeconomic status and obesity to the existing literature (Gordon-Larsen et al., 2003). After controlling for these socioeconomic variables, individual weight status is shown to be significantly associated with the metropolitan level. Lower polycentric regions and larger metropolitan areas tend to have a higher prevalence of obesity, and higher-density metropolitan areas tend to have a lower prevalence of obesity.
Effects of individual socioeconomic status and metropolitan-level built environment on weight status and physical activities.
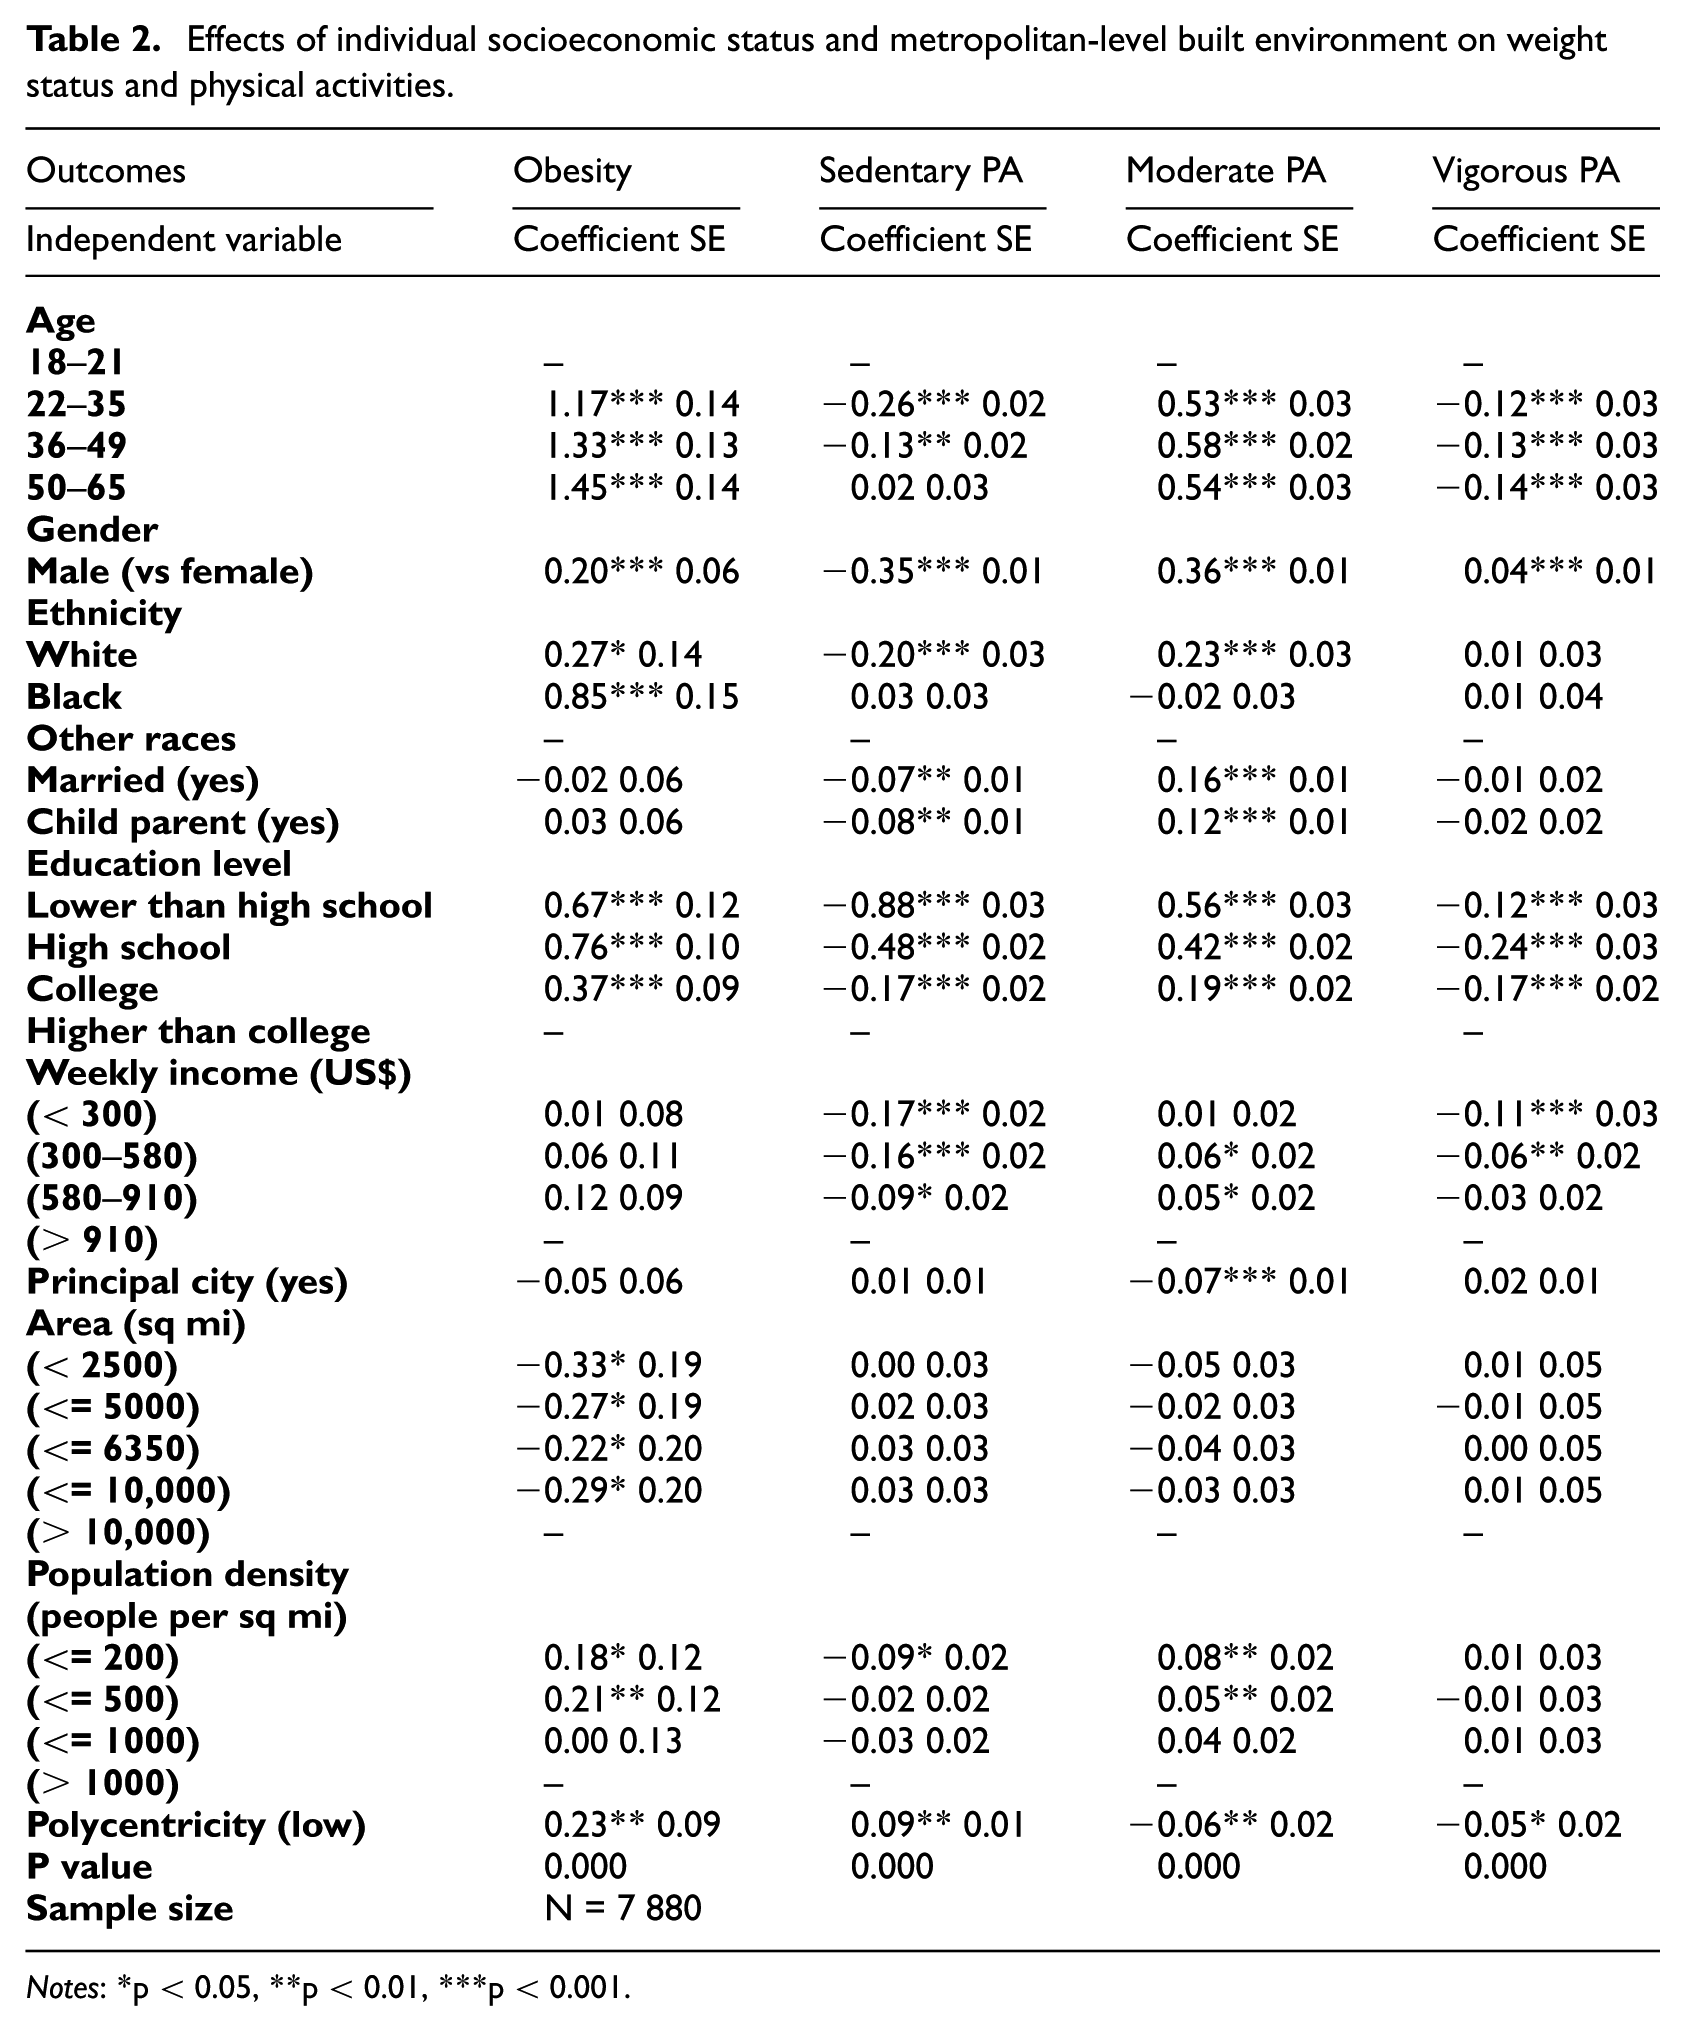
Notes: *p < 0.05, **p < 0.01, ***p < 0.001.
The associations between metropolitan-level variables and physical activities of different intensity are various. Individuals in a region of lower polycentricity tend to spend more time on sedentary activities, and less time on moderate physical activities and vigorous exercise, which suggests a higher prevalence of obesity based on the linkage to energy expenditure. The associations between obesity and metropolitan size and density are less obvious. Individuals in metropolitan regions with a population density less than 200 per square mile tend to spend less time on sedentary activities; individuals in metropolitan regions with a population density less than 500 per square mile tend to spend more time on moderate activities. Individuals in a metropolitan region of greater land area tend to spend more time on moderate physical activities.
Path analysis: How does polycentric structure affect individual weight status?
The results of the multi-level path analysis are shown in Figure 3. The CFI (1.00 > 0.95), TLI (1.00 > 0.95) and RMSEA (0.000 < 0.06) demonstrate the fitness of the models. According to the results, individual weight status is related to the metropolitan-level polycentric structure in three ways. First, it is associated with polycentric structure effects through individual time use on different physical activities which accumulate the time of certain metabolic rates of tasks (Mechanism 1). Individuals living in a region of high polycentricity tend to spend less time on sedentary activities (b = −0.671, SE = 0.206, p < 0.001) and more time on moderate (b = 0.669, SE = 0.217, p < 0.01) and vigorous (b = 0.399, SE = 0.200, p < 0.05) physical activities, which accumulate high MET of tasks (b = 0.020, SE = 0.004, p < 0.001 for sedentary; b = 0.051, SE = 0.003, p < 0.001 for moderate physical activity; b = 0.116, SE = 0.002, p < 0.001 for vigorous physical activity) and thus increase the energy expenditure and reduce the risk of obesity (b = −0.052, SE = 0.017, p < 0.001).

Path analysis testing multiple mechanisms by which polycentricity affects the prevalence of obesity.
In particular, individual weight status is associated with the polycentric structure through individual time use on sedentary and vigorous physical activities, which are associated with the metabolic rate of rest per time unit (potential Mechanism 2). Individuals living in a region of high polycentricity tend to spend less time on sedentary activities, which postpones muscle loss so as to maintain the metabolic rate of rest, maintain energy expenditure and reduce the risk of obesity (b = 0.039, SE = 0.018, p < 0.05); they tend to spend more time on vigorous activities, which strengthens the skeleton muscles so as to increase the metabolic rate of rest, increase energy expenditure and reduce the risk of obesity (b = −0.057, SE = 0.012, p < 0.001). The association between moderate physical activity and the prevalence of obesity is not significant (dashed line) after mediating the accumulated MET, which indicates that moderate physical activity mainly influences individual weight status by its relatively high metabolic rate of task, rather than by changing the metabolic rate of rest.
Beyond the mediating effects of physical activities, individual weight status is also associated with the polycentric structure through other potential mechanisms. Apart from the indirect effects of polycentricity upon the prevalence of obesity, the analysis shows that polycentricity is still directly and negatively associated with the prevalence of obesity (b = −0.387, SE = 0.170, p < 0.05).
Discussion
The statistical connection between polycentricity and obesity, therefore, can be confirmed with a perspective on individual health behaviour in the ATUS data. According to the path analysis, polycentric development may reduce the prevalence of obesity not only by increasing the accumulated time spent on moderate-to-vigorous physical activity with high metabolic rate of task (Mechanism 1), but also by increasing the metabolic rate of rest in each time unit as more muscle-strengthening exercise (some vigorous physical activities) and less muscle-losing sedentary activities (potential Mechanism 2) can help to maintain a better quality of body muscle.
One immediate question would be: how do individuals in a more polycentric region find more time and energy for physical activities? Do they save energy and time by reducing the time spent on other activities? The answer may come from the relationship between individual travel and polycentric development. Using the same ATUS data, we find that individuals in a more polycentric region tend to have fewer daily trips and shorter travel times (Yang and French, 2013). The saving in travel time could lead to a reduction in stress and make available more time and energy for increased physical activity and thus a lower prevalence of obesity. In another study of how polycentric development has affected commuting duration and modes in the past decades in 50 US metropolitan areas, Yang et al. (2012) found that individuals in a more polycentric region tend to spend less time commuting. In growing metropolitan areas, average commuting duration increases as urban areas expand. However, an increase in polycentricity can slow down the growth of commuting time. Given the conceptual support from the above time use models and the relevant transportation research, the revealed statistical connection between obesity and polycentric development is unlikely to result from random variations in the research data, particularly when ATUS’s rigorous sampling strategy is also considered.
Another immediate question would be: beyond the links to energy expenditure through physical activity, how could the polycentric structure affect individual weight status in other ways? One possible way may come from the relationship between healthy/unhealthy food accessibility and polycentric development (potential Mechanism 3). Compared with urban sprawl without clustering, strong suburban centres tend to more easily meet the threshold for the number of customers needed to operate healthy food retails (Larsen and Gilliland, 2008), which can emancipate suburban residents from unhealthy food deserts. In addition, strong suburban centres could provide better trip chaining opportunities that will also increase accessibility to healthy food. As diet plays a key role in individual energy intake (Swinburn et al., 2004), polycentric development may reduce the prevalence of obesity by affecting not only individual energy expenditure but also energy intake.
One may further wonder why polycentricity, a variable depicting the spatial variation of density, performs so differently from the crude density measure in the regression models. One primary explanation is that polycentricity suggests the spatial variability of neighbourhood-level population density or more broadly the variability of neighbourhood-level built environment. Being a high polycentric region implies high-density neighbourhoods not only close to the urban core, but also in the suburbs. In a spatially decentralised job market, this spatial variability of residential built environment could help individual households locate housing and neighbourhoods that better match their preferences without being forced to commute long distances. The savings in time and energy stemming from travel reduction could release some time and energy for physical activity and exercise. In addition, living in a neighbourhood better matching one’s preference could also lead to psychological benefits. These benefits stemming from the spatial variability of density cannot be characterised with a crude regional-level density indicator.
Since our polycentricity indicator measures the spatial distribution of relatively high-density neighbourhoods, the significant health benefits of polycentric development confirm the findings of existing literature on neighbourhood-level density, physical activity and individual weight status, but from a regional perspective. Our analysis does not conflict with the existing literature, which states that high-density neighbourhoods tend to promote physical activity and healthier lifestyles (Rundle et al., 2007; Saelens et al., 2003). However, the impacts of regional average density on health behaviours should not be treated the same as the impacts of neighbourhood-level density.
While having a full five years’ activity information, ATUS only provides state and county identifiers, which prevents us from incorporating neighbourhood-level social and built environment variables into the analysis. In the future, a study of the joint impacts of the regional and local built environment should provide a clearer picture of how the built environment affects physical activity and obesity. In addition, some other important variables may affect individual PA in North America but are not considered in this study, including the existence of rail transport, and the annual rainfall and snowfall, which need to be considered in future studies. Although this study proposes a potential mechanism for how polycentric development affects individual weight status by shaping energy intake, data on the spatial distribution of food retailing and individual diet are needed in future studies to test this mechanism. In addition, although using average time use of activity instead of data for a single year, this study does not consider changes in physical activity or in weight status. Longitudinal models are generally believed to be better than cross-sectional models in causality inference because of potential individual self-selection bias. This is particularly true for studies on the neighbourhood-level environment. Individuals could migrate from one neighbourhood to another to find a place that better matches their preference. Individuals who desire to engage in physical activity are more likely to live in neighbourhoods that foster and support these activities. The statistical association between health outcomes and neighbourhood-level built environment may be partially attributed to individual preferences. This self-selection issue, however, is less problematic in our cross-sectional model of metropolitan-level built environment, as it is unlikely that individuals would migrate between metropolitan regions simply because one region is more or less polycentric (Bento et al., 2005).
Conclusions
By using quantitative indicators of polycentric development, this research furthers the literature by examining how the formats of metropolitan spatial development are relevant to broader issues of individual lifestyle and public health. As the consequences of existing patterns of metropolitan growth have been largely understood, the new generation of Americans are increasingly ready for the changes in metropolitan and regional development practices (Berube, 2007; MAPC, 2005), and empirical research is needed to inform the debates on regional planning. Any empirical research, which can demonstrate whether or how regional planning for alternative metropolitan growth is capable of bringing changes in individual lifestyle and population health, should help to turn this momentum for a healthy metropolitan future into specific healthy practices of metropolitan development.
Our empirical research strongly suggests a potential of polycentric development to affect physical activity and other health behaviours related to individual weight status. The policy implications of this empirical study are obvious. If the policy goal is to promote health by reducing obesity, urban planning strategies such as urban growth boundaries will limit urban sprawl, reduce the rate of urban expansion and help maintain density, which will lower the BMI for the obese group. In addition, if strategies of urban growth boundaries are unavailable due to the weak power of the regional planning organisations, polycentric development should be a useful alternative as it does not rely on the influence of a strong regional planning council or metropolitan government on land development control. The Atlanta Regional Commission’s Livable Center Initiative is one of those examples. It uses transportation infrastructure funding to leverage local governmental cooperation on relative high-density development in suburban areas. Furthermore, the need for polycentric development is well reflected by the on-the-ground situation. In the past decades, spatially decentralised development in the 50 most populated US metropolitan regions has actually been associated with decreased polycentricity scores, which suggests that suburban centring has been outpaced by low-density suburban expansion (Yang et al., 2012).
Footnotes
Acknowledgements
We are grateful to four anonymous referees for their constructive comments on an earlier version of the article.
Declaration of conflicting interests
The author(s) declared no potential conflicts of interest with respect to the research, authorship, and/or publication of this article.
Funding
The author(s) disclosed receipt of the following financial support for the research, authorship, and/or publication of this article: This research was funded by the National Natural Science Foundation of China, grant number 51678004.