
Abstract
Socio-spatial segregation has been recognised as an important factor affecting school segregation and educational attainment in urban schools. As urban populations grow and socio-spatial segregation has become a pressing issue in many contexts, a more sophisticated understanding of the interconnections between spatial and school segregation is needed, including the role of school catchment areas as a possible mediating factor. In our article, we focus on the two-way relationship between urban residential mobility and catchment area segregation in Helsinki, Finland. Using fine-grain statistical data we analyse how the long-term changes in spatial segregation have changed catchment area populations and how residential mobility of families with children is, in turn, related to catchment area composition. The analysis focuses on the majority population whose residential choices typically have the strongest impact on segregation patterns in cities. Our main finding is that there is a systematic relationship between socio-spatial segregation and catchment area differentiation, where the disadvantaged areas are consistently left behind in the general socio-economic development. Even though the institutional school quality is high throughout the city, the residential choices of families with children feed into the self-perpetuating cycles of segregation, as the most disadvantaged areas are rejected and privileged areas favoured in mobility patterns. The results highlight the need for urban educational policies with a high sensitivity to the persistent socio-spatial inequalities shaping educational opportunities.
Introduction
Throughout Western cities, families with children frequently report schools as a major consideration in residential decisions (e.g. Boterman, 2013; Butler and Hamnett, 2007; Owens, 2017). The residential flows of educationally motivated families make access to particular schools one of the factors shaping the social landscape of urban areas. Butler and Hamnett (2007: 1167) describe the British middle-class families’ drive to ensure their children’s safety and educational success by stating that their strategies ‘will range from residential moves towards areas with “better” schools or “better” social composition, to attempts to get the child into a “good” state school’. While the parental preferences on school quality, reputation and social composition have received plenty of attention, the complex spatial links between schools, catchment areas and residential decisions are not yet thoroughly understood (see Owens, 2017).
The role of school catchment areas as geographical boundaries mediating the effects of urban segregation on school segregation has lately received particular interest. This has prompted efforts to identify how the boundary-setting of the catchment areas affects the social mix within the area and the school, as well as analyses of the ways in which these boundaries can influence the residential decisions of families (Monarrez, 2018; Owens, 2017; Richards, 2014). School- and catchment area-related residential decisions feed into growing socio-spatial segregation through either attracting families in or prompting out-mobility and residential avoidance.
In this paper, we follow residential moves between school catchment areas for the first time in the Finnish context, linking the institutional boundaries to the mobility flows and residential patterns. We aim to contribute to the understanding of the interconnected dynamics between urban segregation, school catchment area segregation and residential mobility of families with children, using empirical data from the capital city Helsinki. The analysis is focused on the residential mobility decisions of the families with a Finnish background, as it has been demonstrated both in international and in previous Finnish studies that it is particularly the majority population’s choices for housing and schools that shape the patterns of segregation in cities (e.g. Andersson, 2013; Kauppinen and van Ham, 2019; Kosunen, 2016; Vilkama, 2011). The majority population tends to be better able to choose their residential locations than most minority groups, and they are also more likely to show ‘flight’ or ‘avoidance’ behaviour in their search for a ‘good’ school and neighbourhood.
Our main focus is to analyse how socio-economic segregation of the school catchment areas is linked to residential decisions. In a wider perspective, we track down elements of the ‘two-way relationship’ between schooling and geography, as described by Gordon and Monastiriotis (2007: 1225). In this case: how urban socio-economic segregation affects the social composition in school catchment areas, and how this, in turn, is linked to the residential decisions of families, potentially further exacerbating segregation. Block-level GIS-data and neighbourhood-level residential mobility data are used to track down how changes in residential segregation have affected the differentiation of primary school catchment areas in Helsinki in the long term, and how urban segregation is further affected by the residential mobility of families with different-aged children in different socio-economic neighbourhood contexts.
As both segregation and educational inequalities are becoming increasingly pressing issues in most Western cities (Tammaru et al., 2016), there is a growing need for the analysis of residential decisions, social and ethnic diversity and school networks in a shared spatial framework to understand the interlinked dynamics of urban and school segregation. Although residential choices are complex and reflect changes in family situations and housing needs, as well as the quality and availability of different types of housing and neighbourhoods, families’ mobility patterns also reflect the parents’ interests in choosing or rejecting particular schools (e.g. Boterman, 2013; Bridge, 2006; Butler and Hamnett, 2007; Vilkama et al., 2016). More importantly, the residential choices of families – made for whatever reason – further shape the social landscape of the catchment areas, potentially exacerbating the processes of segregation. If we can observe residential mobility patterns which consistently relate to the local socio-economic privilege or disadvantage at the school catchment area level, we are better equipped to understand the dynamic links between urban segregation, school segregation and neighbourhood development – and the role of catchment areas as mediators between spatial and school segregation. Understanding these drivers is crucial for developing policy solutions to target the growing challenges of urban and educational inequalities.
Findings in an egalitarian Nordic context have been argued to be relevant for understanding the drivers of change also across more segregated systems, as the educational and welfare systems are geared at reducing inequalities (see Bernelius and Vaattovaara, 2016). Helsinki is a particularly interesting setting for school-related research, as the egalitarian national and local welfare state policies are strong even in the Nordic context, targeting both schools and neighbourhoods. The Finnish schools are renowned for their quality and relatively equal outcomes and, with the strong public control and financing that acknowledges differences in pupil compositions in schools, school quality is generally assumed to be fairly consistent (Bernelius, 2013; OECD, 2016).
In this context, most of the observed differentiation of outcomes between schools has been demonstrated to stem from socio-spatial and pupil segregation rather than pedagogical or resource differentiation (Bernelius, 2013; Kosunen, 2016). These local features have been argued to reduce the effects of ‘shopping’ for school quality through residential moves. As there is no need to avoid certain schools in the fear of poor pedagogical quality, the local social mix has been observed to be the dominating feature in school choices and school-related housing choices (Bernelius, 2013; Harjunen et al., 2018). On the other hand, the school network is based on a strong catchment area system where school allocation is tied to home address. This kind of strong spatial linkage has been demonstrated to highlight the interlinked dynamics between residential decisions and schools through catchment area borders (Cheshire and Sheppard, 2004; Harjunen et al., 2018; Owens, 2017). This yields the Helsinki context as a relevant case laboratory for research on the effects of segregation.
Segregation, schools and parental strategies of social reproduction
The theoretical foundation of our analysis is built on one hand on the observed spatial links between urban and school segregation (Andersson et al., 2010; Gordon and Monastiriotis, 2007) and on the other hand on the theoretical framework of middle-class social reproduction as a driver of selective school and residential choice (Ball, 2003; Kosunen, 2016; Maloutas and Ramos Lobato, 2015; Owens, 2017; Raveaud and Van Zanten, 2007).
In general terms, the socio-spatial differentiation of cities is reflected in the schools’ social environment and pupil base. However, local variations in the socio-spatial and policy context produce strongly differentiated environments for school networks and the choices available for families (see, e.g., Boterman, 2013; Butler and Hamnett, 2007; Gordon and Monastiriotis, 2007; Hamnett and Butler, 2013). The association between residential and school segregation is especially strong when school allocation is regulated through catchment areas, but it is also visible in choice-based systems (e.g. Boterman, 2019; Cheshire and Sheppard, 2004). Spatial differences in educational background, employment and other dimensions of social disadvantage affect the social fabric and reputation of neighbourhoods, which is further reflected in the schools’ pupil base and the interaction between the school and the neighbourhood (Hamnett and Butler, 2013).
A growing body of research has described ways in which segregation may affect educational outcomes (Andersson et al., 2010; Bernelius, 2013; Gordon and Monastiriotis, 2007; Nieuwenhuis and Hooimeijer, 2015). As the family background is linked to educational outcomes at the individual level, the composition of the pupil base in a certain school affects the school’s capacity for educational attainment. The statistical links between socio-economic background and educational outcomes are similar throughout all Western countries: despite local variation in effect size, higher parental status tends to translate to better pupil outcomes (OECD, 2013). The effect of ethnic background, on the other hand, varies greatly between ethnic groups and national contexts from positive to negative associations between minority status and educational outcomes (OECD, 2013). In Finland, immigrant background is generally correlated to significantly lower educational outcomes than having a Finnish background, and in Helsinki the socio-economic and ethnic differentiation of the pupil base have together been demonstrated to account for over 60% of the variation in the educational outcomes of primary schools (Bernelius, 2013; OECD, 2013: 75).
School segregation and the differentiation of educational outcomes are further reflected in school choices, as the parents who apply active choices tend to favour the schools with less observable social disadvantages. The most active group in the school market are middle-class parents, whose decision-making surrounding their children’s education involves numerous considerations of the schools’ supposed qualities, and opportunities offered to children both through the institutional structures as well as the peer group (Ball et al., 1996; Butler and Robson, 2003; Byrne, 2006; Noreisch, 2007; Raveaud and van Zanten, 2007; Vincent et al., 2010). Parental views on desirable schools tend to be strongly associated with social and ethnic composition to access certain types of social capital and to avoid ‘problematic’ socialisation (Boterman, 2013; Butler and Hamnett, 2007; Byrne, 2006; Karsten et al., 2003).
The motivations for school choices have been researched in the Finnish context in different qualitative and quantitative settings (e.g. Bernelius, 2013; Kosunen, 2016; Kosunen et al., 2016; Seppänen, 2006). These studies have pointed out that as the institutional qualities vary relatively little between schools, there are no official school ranking lists available to parents, and the curriculum, funding and teacher qualifications are relatively consistent, school choice appears to be particularly linked to the observed and presumed social aspects of the schools. In parental interviews, school qualities such as available selective classes, for example music education, are frequently mentioned, but school reputation, perceived social problems and the socio-economic and ethnic backgrounds of the pupils are also considered remarkably often (Kosunen, 2016; Seppänen, 2006). It is especially notable that parents very rarely mention distrust in pedagogical aspects as a reason for rejecting certain schools (Kosunen, 2016). Quantitative studies have confirmed that choice decisions are linked to the social mix in the schools and the socio-spatial characteristics of the catchment areas, rather than institutional qualities, especially in rejecting disadvantaged neighbourhood schools (Bernelius, 2013; Bernelius and Vaattovaara, 2016; Kosunen et al., 2016).
School network and residential mobility
The identified drivers of school choice may also motivate the residential mobility of families with children. Although it is well-known that the foremost trigger of families’ residential mobility is changing family and work situations, and hence mobility is affected by changes in housing needs (e.g. Rossi, 1955), the crucial question is where new housing is sought. Residential mobility decisions can be conceptualised as a two-step process, where the first step includes the actual decision to change housing, while the second step involves the decision on where to move (Brown and Moore, 1970). Neighbourhood- and school-related reasons may become relevant particularly in the second stage of the decision making, when families start looking for a new dwelling that suits their housing needs. Both the built environment and the socio-economic and ethnic composition of neighbourhoods and schools are carefully scrutinised when decisions to move are made (Musterd et al., 2016; Vilkama et al., 2016).
Factors affecting residential decisions are thus multiple, and with schools it is challenging to separate the effects of pedagogical qualities from the effects of the social mix. However, previous studies clearly demonstrate that schools in general can be considered central to research on urban segregation and neighbourhood development when families with children are concerned (see, e.g., Bridge, 2006; Musterd et al., 2016). In qualitative housing preference studies, parents typically report that finding a neighbourhood that is good for children is one of the most important considerations when choosing where to live, and schools are viewed as integral to that package also in the Helsinki context (Dhalmann et al., 2013). It has also been demonstrated that schools appear to influence housing prices. This indicates that families may be willing to pay a premium for access to certain schools or social networks within those schools (Cheshire and Sheppard, 2004; Harjunen et al., 2018).
Boterman (2019) demonstrates how the physical proximity to certain schools may play an important role for families even though access to schools is not limited by institutional catchment area policies. When the school network is organised around physical catchment areas, geography becomes even more relevant for education. In this case, the catchment area borders represent direct institutional access to certain schools, as well as mediating the effects of urban segregation on the pupil mix within the neighbourhood school (Monarrez, 2018; Owens, 2017; Richards, 2014). The lines dividing institutional access thus become a factual spatial consideration for parents motivated to either avoid or favour a certain school. This may affect the development of the catchment area composition, especially if the choices manifest in avoidance of disadvantaged areas.
The relationship between residential location and school allocation is strong in Helsinki, as the city is divided into 85 primary school catchment areas; pupils are allocated to schools based on their home address. Since the mid-1990s families have had a right to choose a school outside their own catchment area, but admission depends on the available places or specific entrance criteria. The role of public schools in Finland is strong by international standards, as the number of private schools is low and they are highly controlled by the national curriculum. None of the schools are entitled to charge a fee, and many of the existing private schools have their own catchment areas, making them effectively public schools managed by private bodies. Opting out of the public-school network is thus not a valid option for most families, and currently well over 80% of primary school children attend the school within their own catchment area.
Despite the recent research evidence on the possible association between schools and residential decisions in Helsinki, there has thus far been no research tackling the relationship between school catchment area composition and residential mobility in the city. Furthermore, all urban and educational policies in the city are formulated on the assumption that there is no association between these factors. As there is very little qualitative differentiation between the schools in Helsinki, and the level of urban segregation is still relatively moderate, the urban and educational policies have assumed that residential decisions are not systematically linked to socio-economic differentiation of the school catchment areas in the way hypothesised in more segregated contexts. However, based on previous research, our key hypothesis is that the middle-class preferences may act as a driver for residential choices also in the Finnish context. If the results show consistent selectivity in residential flows, the observations would be relevant to local policies as well as the academic understanding of the dynamics between the school qualities versus social composition as drivers for residential mobility of the educationally motivated families.
Research design
In this paper, we explore the connections between urban and school segregation by analysing the longitudinal effects of urban segregation on the school catchment areas, and by assessing the possibility of further differentiating effects of residential decisions by examining mobility flows into and out of privileged and disadvantaged school catchment areas. The research questions are: (1) How has the socio-economic and ethnic differentiation in Helsinki affected the segregation of school catchment areas from 1995 onwards? and (2) How are residential decisions related to catchment area segregation, and can they further exacerbate segregation? To specify: Are residential mobility flows of families with children between school catchment areas random, or can we observe patterns which are consistent with patterns of segregation?
We concentrate on the municipality of Helsinki. Although Helsinki is part of the wider urban region, local differences in municipal school policies complicate inter-municipal comparisons. However, the variance in the urban structure is similar across the metropolitan municipalities, and Helsinki houses very urban neighbourhoods, as well as large suburban areas. The results can thus be relatively well generalised to the whole metropolitan region.
The mobility pattern analysis is focused on the residential mobility choices of the majority population, that is, families with a Finnish background, operationalised in the data as families with Finnish as their mother tongue. This includes all residents, regardless of their nationality, who are registered to speak Finnish as their first language. The mobility flows of families with a foreign background (unless registered as Finnish-speakers) are excluded from the analysis. The Swedish-speaking minority (6% of the population) is also excluded as the Swedish schools form their own spatial network and catchment areas.
Our data sets consist of fine-grain spatial data on the socio-economic and housing characteristics, and data on residential mobility flows to and from Helsinki neighbourhoods. The mobility data are constructed by Statistics Finland and they can be broken down by age in one-year intervals. The socio-economic and housing data are drawn from the Municipal Building and Population Registers as well as from the Statistics Finland Grid Database, which covers the city in a 250-m grid. These data sets have been aggregated to primary school catchment areas (one school per area) using GIS and statistical software on multiple years from 1995 to 2011/2015. Urban segregation over time is also analysed via dissimilarity indexes (see, e.g., Tammaru et al., 2016).
The mobility data include yearly inwards and outwards residential moves of children in the neighbourhoods of Helsinki from 2005 to 2014. Both inter-municipal and intra-municipal residential mobility flows are included in the data set. However, within-neighbourhood moves have been omitted. The data do not include socio-economic or household information on the movers, and therefore the residential mobility of primary-school-aged (7–12 years) and younger children is used as an instrument to illustrate mobility patterns of families with children. By comparing mobility patterns and net-mobility flows to and from school catchment areas, we can determine how attractive different catchment areas appear as living environments for families with children. Mobility rates are measured as a percentage of in- and out-movers from a total (annual average) population in a given age-group and school catchment area. Net-mobility rates illustrate the balance between in- and out-movers. If net-migration is positive, there are more in-movers than out-movers, and vice versa.
We have grouped the school catchment areas into three categories based on their average income and the share of adults without secondary education in 2012. These two socio-economic characteristics are known to correlate strongly with educational attainment in schools (Bernelius, 2013). Areas falling to the lowest or highest quartiles according to both indicators were selected in the ‘disadvantaged’ and ‘well-off’ categories. There were exactly 13 areas in both of these groups. The remaining areas were grouped as an ‘in-between’ category, which forms the third group of catchment areas. There is some overlap in income and educational level between the areas belonging to the disadvantaged and the middle category, and to the well-off and the middle category, as can be seen in Table 1 (and in Figure 3 in the Results section). However, as our aim is to the focus the analysis on the areas with multiple disadvantage and privilege, the catchment areas belonging to the low (or high) end of the distribution in only one of the indicators – not both – fall in the middle group. Our hypothesis is that if the schools and their catchment areas have some effect on the mobility choices of families with children – in other words, if some areas are avoided and some found attractive – it should be most visible in the migration flows of the most clearly disadvantaged and privileged areas.
Descriptive statistics on socio-economic and housing characteristics of the school catchment areas in Helsinki 2012/2015 (data: Statistics Finland Grid Database; Municipal Building and Population Register).

There are some limitations to this approach: static catchment area categorisation does not allow areas to move from one category to another, despite possible changes in socio-economic status. However, this does not pose a major problem, as neighbourhood-level socio-economic compositions change rather slowly (see, e.g., Vilkama and Lönnqvist, 2014). Such categorisation is needed for us to be able to follow and compare migration flows between different catchment area types over a 10-year period.
In addition to socio-economic categorisation, the catchment areas have been grouped into three categories in relation to their time-distance location in the urban structure: downtown, inner-urban ring and outer-urban ring.
Table 1 depicts the average socio-economic and housing characteristics of the disadvantaged, well-off and other catchment area categories, and the map (Figure 1) shows their locations. The most disadvantaged areas consist predominantly of multifamily-housing and rental units. All but one of these areas are located in the outer suburbs in the north-eastern part of the city where housing is less expensive. The most privileged, well-off areas are more varied in their housing structure and location. Six of these areas are located in the dense, affluent downtown area consisting solely of multifamily-housing, while the other half is situated in the inner and outer urban ring with larger shares of family-sized dwellings and detached and row houses. The other areas, the third category, are situated in both the inner and outer urban ring of the suburbs, with four areas in downtown. While there are some clear differences in housing and tenure types between the catchment area types, these differences are more pronounced between the three locational categories: downtown, inner urban and outer urban areas. This suggests that families seeking to proceed in their housing career may have to relocate in the urban structure, but they do not necessarily have to move out of their neighbourhood type – in terms of its socio-economic status – in order to find family-sized housing.
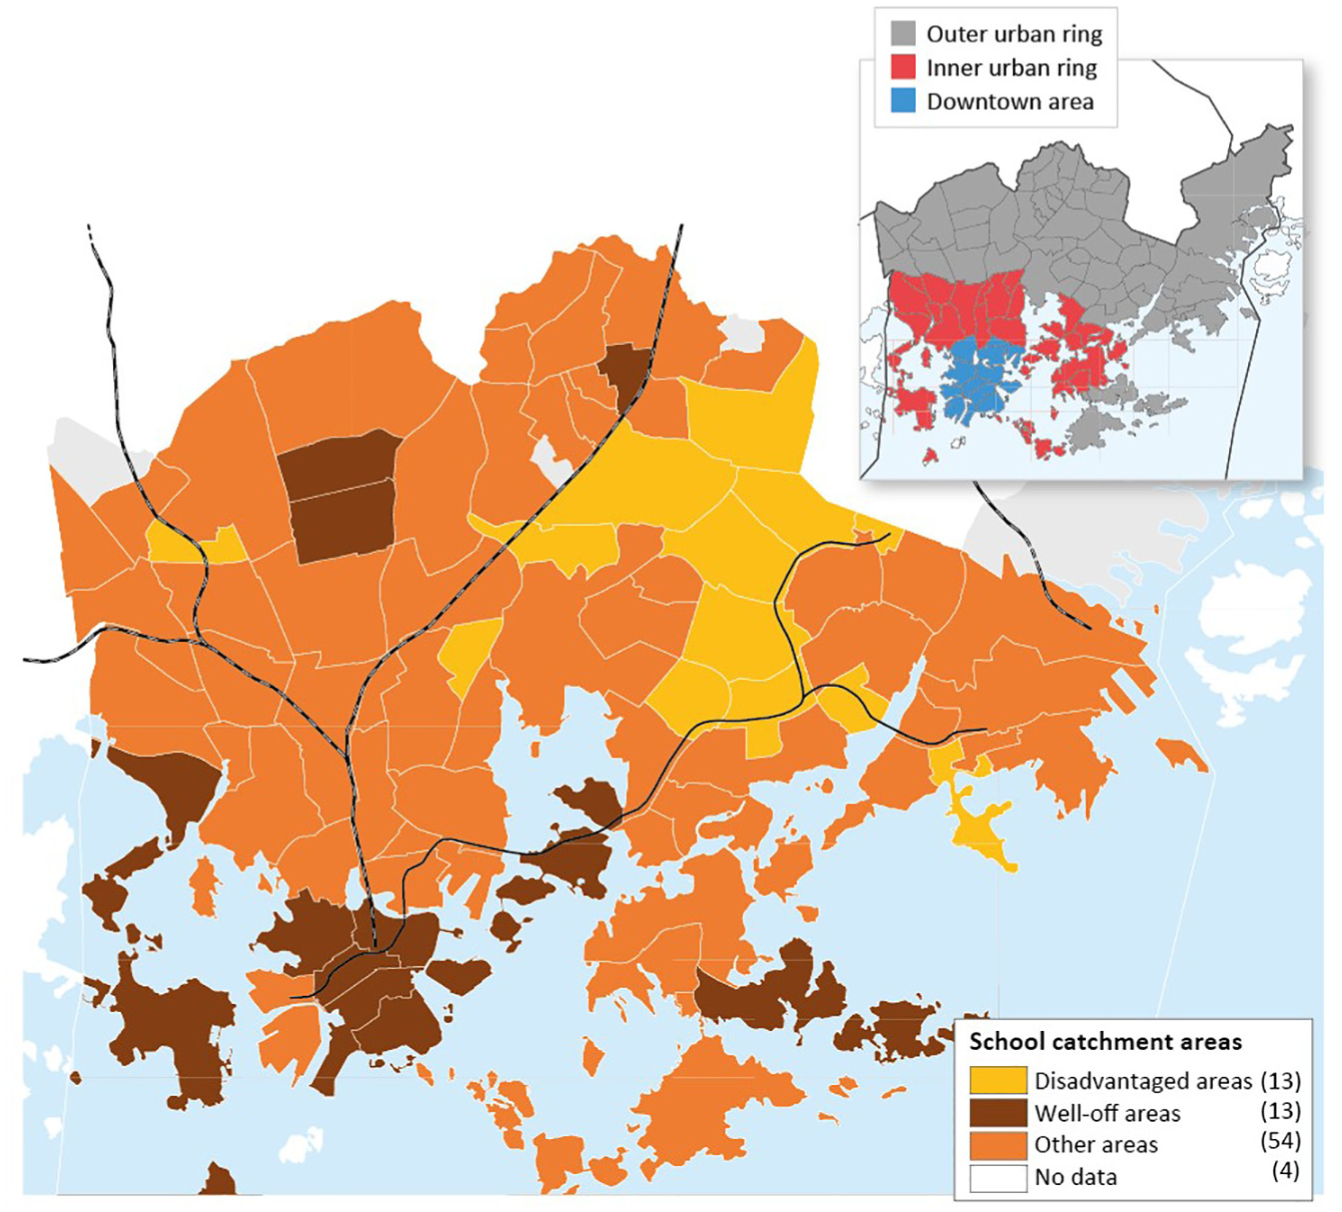
The location of school catchment areas in Helsinki.
Results
Increasing segregation of neighbourhoods and school catchment areas
Urban socio-spatial segregation has traditionally been moderate in Helsinki, compared with many other European cities (see, e.g., Tammaru et al., 2016). However, during the last three decades socio-economic and ethnic differences have increased between urban neighbourhoods. The most notable change can be traced back to the 1990s and early 2000s (Figure 2) when the recession of the early 1990s and the following ICT-led boom changed the economic and labour-market structures (see, e.g., Vaattovaara and Kortteinen, 2003): higher education has become an important asset in the labour market, whilst the amount of low-skilled manual work has decreased. This has resulted in increases in structural long-term unemployment. Increasing levels of immigration have further strengthened the socio-spatial segregation patterns, as most immigrants, particularly those coming from non-Western countries, have settled in neighbourhoods where socio-economic deprivation has been most visible (Kortteinen and Vaattovaara, 2015; Vilkama et al., 2014). Currently, 16% of the population, and 20% of children aged 0–15 years, have a foreign background.

Dissimilarity indexes in Helsinki, by income, education and ethnicity, in 1995–2015.
Figure 2 depicts the changes in urban segregation levels in Helsinki neighbourhoods in 1995–2015. The dissimilarity indices show a clear rise in both ethnic and income segregation especially between 1995 and 2005. Segregation by income and education are both notably higher than the level of ethnic segregation. This indicates that although spatial patterns of ethnic and socio-economic segregation are strongly overlapping (see also Saikkonen et al., 2018), it is the socio-economic differentiation of neighbourhoods that is foremost in characterising urban segregation in Helsinki.
The analysis also reveals high segregation amongst children compared with the population overall (see also Saikkonen et al., 2018). This resonates with former findings on families with children as the population group most concerned about socio-economic and ethnic characteristics when choosing a new place to live (Dhalmann et al., 2013; Vilkama et al., 2016). Levels of segregation amongst children are pronounced both in family income and ethnicity.
The longitudinal analysis shows that increasing urban segregation in neighbourhoods has had a direct impact on schools’ socio-spatial context. Schools in Helsinki operate in a very different urban setting compared with the early 1990s, and differences between school catchment areas have increased significantly. Figure 3 illustrates this by showing changes in value-adjusted average incomes (a), proportions of highly educated (b), and proportions of residents with a foreign background (c) in school catchment areas from 1995 to 2011. Spatial disparities between the areas have grown noticeably despite generally increasing income and educational levels. At the same time, the rank order of the areas has remained fairly stable. In other words, those areas that were at the high-end or low-end of the income distribution or education level in 1995 have retained their position. There are a few exceptions to this rule because of new housing schemes and gentrification of some areas but, overall, upward or downward changes between areas have been scarce.
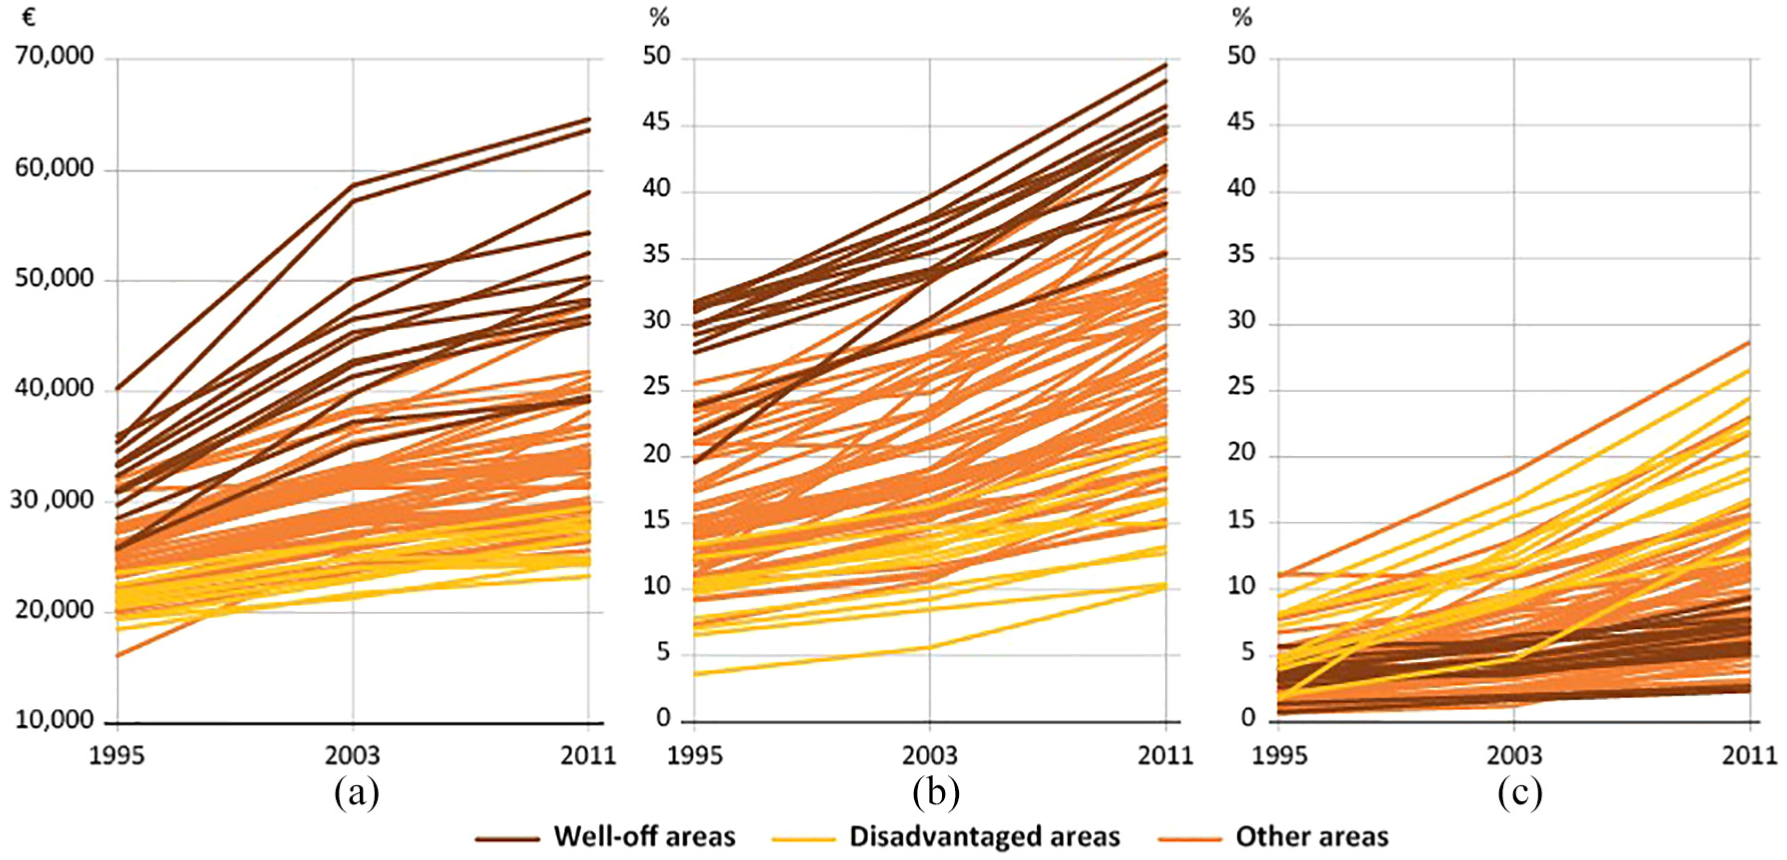
Spatial differences between the school catchment areas in 1995–2011: (a) average income; (b) proportions of highly educated; and (c) proportions of residents speaking other languages than Finnish or Swedish as mother tongue.
Similar processes of growing differences between catchment areas can be seen in the shares of residents with a foreign background. However, owing to recent immigration history starting in the mid-1990s, patterns of ethnic spatial differentiation have begun to stabilise only in the latter part of the 2000s. The dissimilarity index shows a slight increase in ethnic segregation between neighbourhoods since 2005 (Figure 2). In absolute terms, the increase in spatial differentiation has been more notable, as shown in Figure 3(c). The percentage of residents with a foreign background has increased rapidly particularly in many disadvantaged school catchment areas, and in some other areas, while at the other end of the spectrum there has been hardly any change.
Mobility patterns and mechanisms for increasing segregation
The analysis of mobility flows reveals patterns that are clearly connected to catchment area segregation. First, the data indicate that families with children are most mobile when children are very young. Moving propensity is at its highest among families with children under 2 years and quickly declines afterwards (Figure 4). The most notable drop in mobility happens when children reach the school starting age of 7 years. It thus seems that families try to optimise their housing choices before their children start school, and then prefer to stabilise.
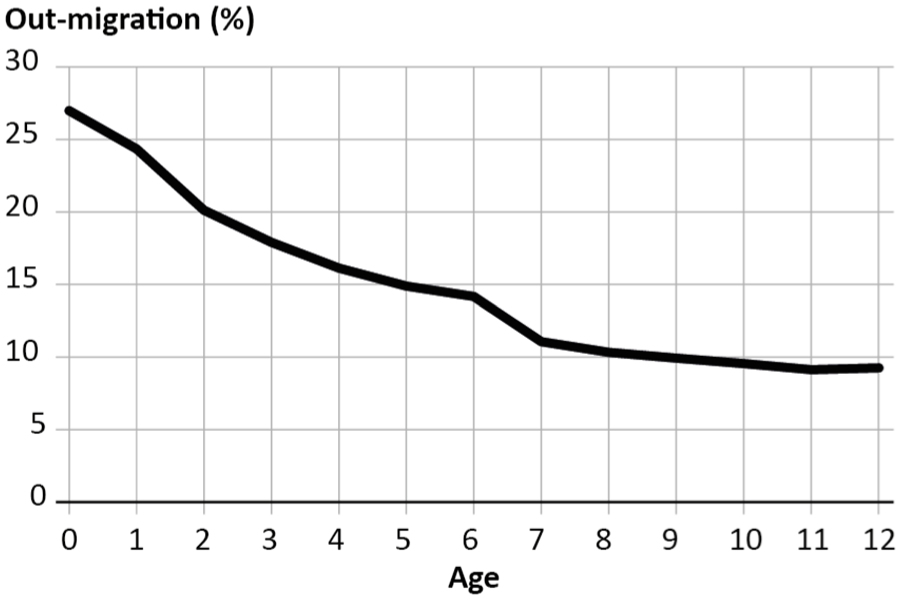
The average annual percentage of children who moved house in 2005–2014 (i.e. moved out of their neighbourhood), by age group. The data include Finnish-speaking children only.
This finding is not completely new; it has been indicated previously that families with school-aged children generally move less frequently than other households. It has also been demonstrated that when they do move, they prefer to move shorter distances to maintain the children’s social and institutional networks (see, e.g., Vilkama et al., 2016). However, our data are the first to document the moving patterns between school catchment areas. The data set excludes the moves which happen within the same neighbourhood, thus eliminating the effect of moves which may be chosen to maintain the same school and peer group for children. We are thus able to examine the decisions that may be tied to school choices, among other reasons for mobility, and document only the decisions which later affect school segregation through the changes in population composition of the catchment areas.
Further analysis of residential mobility flows shows notable differences in the flow dynamics into and out of catchment areas. Although the overall pattern of higher mobility for families with small children is similar in most of the catchment areas, there are significant differences in net mobility. Some school catchment areas lose Finnish-speaking children, while others attract significant numbers of newcomers. There is a clear difference in the migration flows of the most disadvantaged and the most well-to-do areas.
Figure 5 illustrates these differences by depicting the average net-mobility rates (%) separately for the under-school-aged children (Figure 5a and c) and school-aged children (Figure 5b and d) in the disadvantaged and the well-off areas, respectively. Figure 5(a) and (b) shows a clear loss of families with children in the most disadvantaged school catchment areas. These areas have systematically lost Finnish-speaking children in all age groups. Although the net loss has been strongest among younger children, it is striking that most of these areas have also lost school-aged children in a way and at a scale not observed in the well-off areas. There are only three disadvantaged areas which contrast with this finding. Two of these areas are characterised by recent construction of new family housing and renewal of old housing estates, while the third, inner-urban area, has recently been going through a process of gentrification.
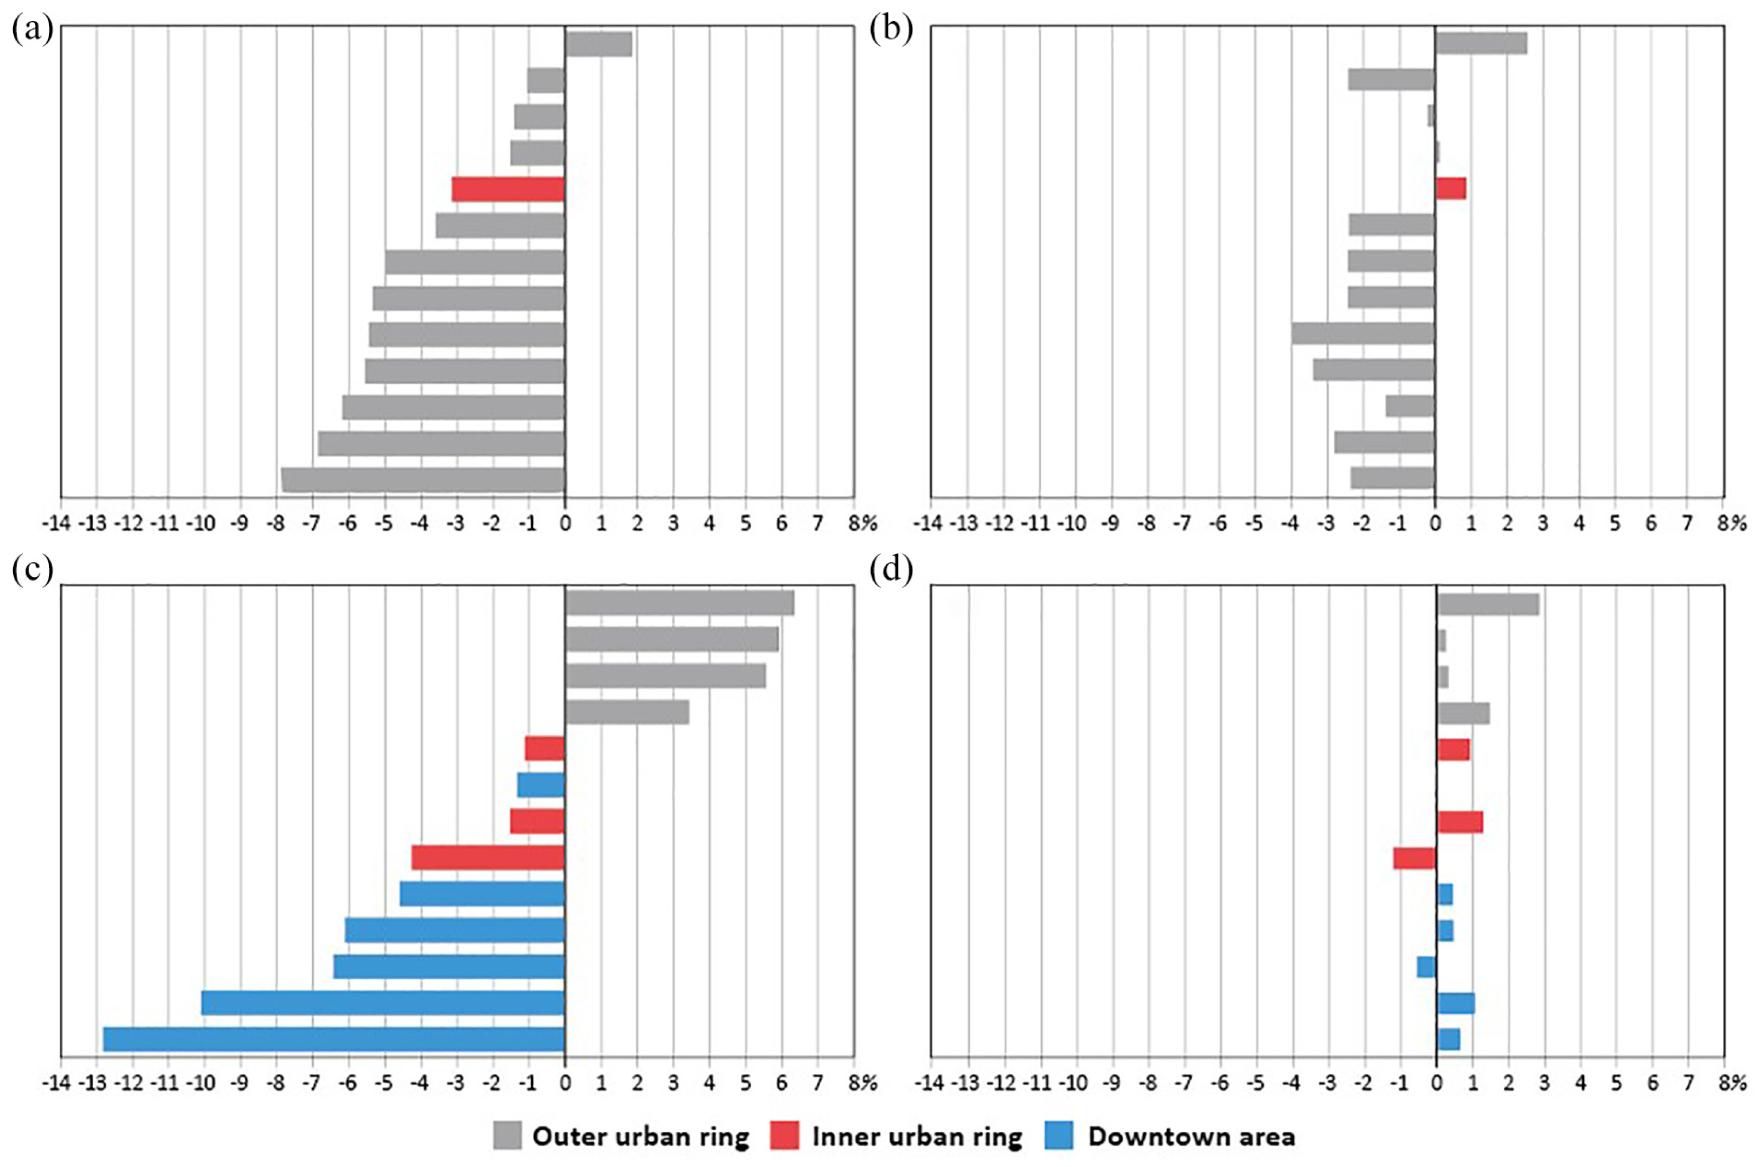
Average net-mobility (%) of children 0–6 years (a) and school-aged children (b) in the disadvantaged school catchment areas, and children 0–6 years (c) and school-aged children (d) in the well-off school catchment areas, in 2005–2014. Mobility flows of school-aged children are presented in the same spatial order as the flows of small children to enable catchment area comparisons.
In the most well-off catchment areas, residential flows appear very different from the disadvantaged areas (Figure 5c and d). The mobility patterns of families with small children are more divided, which seems connected to the housing structure and market situation. Affluent catchment areas in downtown Helsinki, where large family housing is more rare and very expensive, have lost families with small children, apparently as families flow to neighbourhoods with larger units. At the same time, well-off neighbourhoods in the outer suburbs, characterised by large units, have gained substantial net-mobility of families with small children (Figure 5c). Second, in all but a few, the net-mobility of school-aged children has been positive, or close to neutral (Figure 5d). In other words, these areas have either gained more school-aged children than have moved out, or the amount of in- and out-movers has been balanced. The well-off areas have housing and schools that are highly sought after, and they are able to attract a constant flow of newcomers to replace those who move elsewhere. It thus seems that in the most well-off school catchment areas, both socio-economic and housing characteristics are part of the explanation influencing the residential choices of families. The disadvantaged school catchment areas, on the other hand, have not succeeded in attracting sufficient numbers of Finnish-speaking families to replace those who have moved out, despite the availability of large and affordable family-sized housing.
The observed patterns of consistently rejecting or favouring certain types of school catchment areas are most significant at the extreme ends of the scale. In the ‘in-between’ catchment areas the mobility flows of families with children are less systematic, showing both negative and positive net-mobility flows.
A closer look into the mobility flows reveals that the patterns described above have been fairly stable from 2005 to 2014 (Figure 6). Although there have been clear annual fluctuations in net-mobility in some areas, the overall patterns have remained relatively unchanged. In the disadvantaged areas the net-mobility flows have been predominantly negative throughout the 10-year period, with the few aforementioned exceptions. Although there are no signs of accelerating mobility out of these areas, the loss of Finnish-speaking families with children has been systematic (Figure 6a and b).
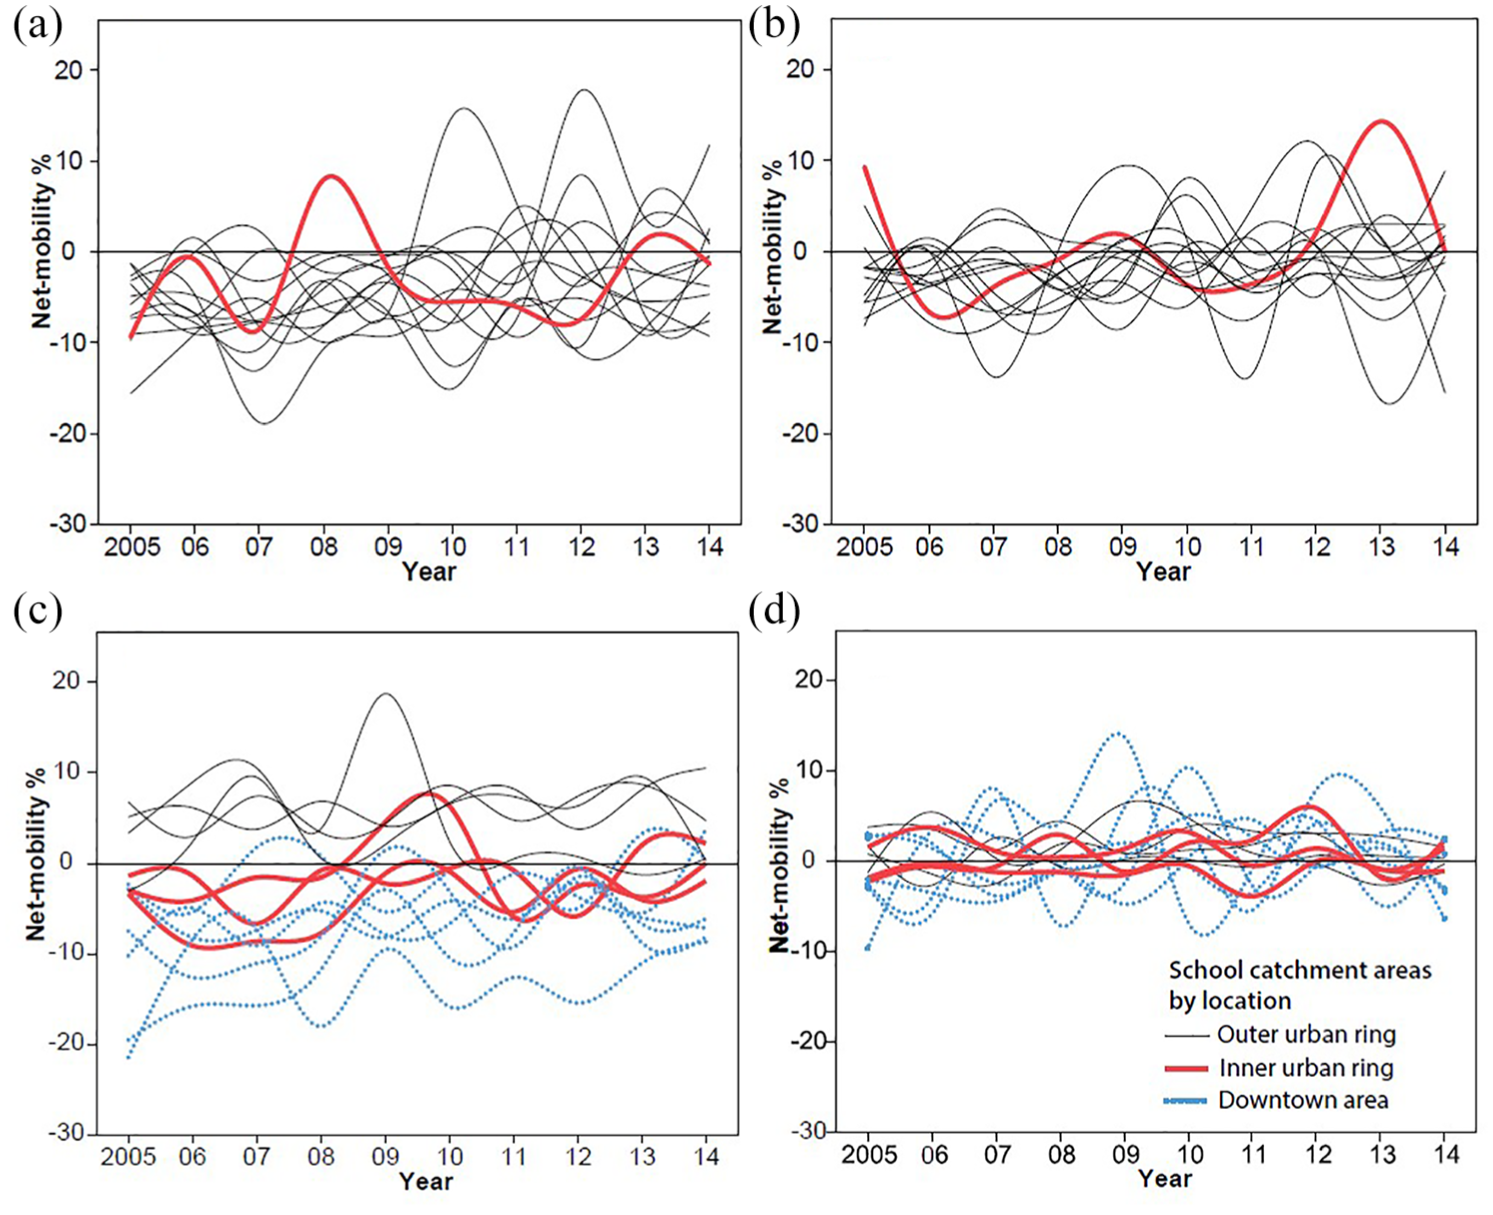
Annual net-mobility rates (%) of children 0–6 years (a) and school-aged children (b) in the disadvantaged school catchment areas, and children 0–6 years (c) and school-aged children (d) in the well-off school catchment areas, in 2005–2014. Each line represents one school catchment area and its average net-mobility rate among small and school-aged children.
In the most well-off catchment areas, the annual mobility flows have been slightly more stable (Figure 6c and d): the areas with net-gains or net-losses have kept their relative position, and no big changes in mobility trends can be noticed.
The uneven spatial patterns in the residential mobility of families with children, and the relative stability of these flows, suggest that school catchment area development and residential choices are closely interconnected. Families with children choose between areas in their search for suitable housing and a good place to raise children. Their choices have the capacity to both reproduce and exacerbate segregation patterns between schools and catchment areas, yet at the same time these very patterns also influence the choices they make. Although there are no signs of accelerating differences in the mobility flows, the stability of the net-losses in some areas and the net-gains in others keeps shaping the socio-spatial landscape of the city and increases the social differences between the areas year by year.
Previous studies on urban segregation in Helsinki have indicated that there is an association between segregation, schools and residential mobility. Although housing-related reasons are, by far, the most important reasons for moving, it has been demonstrated that increasing levels of neighbourhood segregation are connected to processes of selective mobility also in the Helsinki context (e.g. Kauppinen and van Ham, 2019; Vilkama, 2011; Vilkama et al., 2016). Our results confirm these findings and highlight the importance of school catchment area boundaries for the processes of urban segregation.
Discussion and conclusions
Our findings elaborate the closely woven links in a ‘two-way relationship between schooling and geography’ (Gordon and Monastiriotis, 2007) in the Nordic context. The results emphasise the role of school catchment areas as geographical boundaries mediating this relationship, even when the institutional differences between schools are themselves small. Owens (2017: 77) describes the shaping of the relationship in the US context by stating: ‘Neighborhood residence is often pointed to as an explanation for school segregation, but concerns about schooling also contribute to neighborhood segregation. Parents consider trade-offs across school districts, neighborhoods, schools, and housing units when making residential decisions.’ Our findings appear consistent with the nature of these dynamics also in the case of a stronger welfare state, universalist educational policies and relatively moderate segregation, although the magnitude of the effect varies.
In the case of Helsinki, increasing socio-spatial segregation impacts the catchment area characteristics, affecting the level of school segregation through student allocation. School and catchment area segregation, in turn, are linked to the residential decisions of families with children. This finding is consistent with former studies on school choice, and the same drivers appear to influence residential choices (e.g. Bernelius, 2013; Kosunen, 2016). It is notable that, in our results, the patterns emerge relatively strongly even though the analysis is concentrated only on residential mobility of the native Finnish families as such, without further information on their socio-economic status. More detailed information may show even more polarised patterns of mobility, as suggested by the findings on middle-class motivations in social reproduction (see, e.g., Ball, 2003; Maloutas and Ramos Lobato, 2015; Raveaud and Van Zanten, 2007).
The analysis of the growth in socio-spatial segregation in both the city and its school catchment areas in recent decades documents the consistent nature of effects of urban development on schools. Neighbourhood development directly affects the environment where the schools operate, connecting educational outcomes to local processes of social change and the accumulation of disadvantage. The central observation in this analysis is that the development pathways appear to be fairly stable, with a strong path dependency on the rank order of the catchment areas. This tendency is something to which urban and school policies targeted at underprivileged schools should be very sensitive.
The relevance of socio-spatial segregation analysis for neighbourhood and school policies is further emphasised by the observed segregation patterns of children. As the segregation indices are higher for children than for the general population, the overall segregation level is amplified in the school-aged population and in schools. Compared with other demographic groups, families with children are more sensitive to neighbourhood composition when selecting a new neighbourhood (Owens, 2017). This means that cities should be extremely diligent in regard to schools and catchment areas not only in educational policies, but also in urban policies. The way in which these institutions and institutional boundaries are organised may have a profound effect in shaping the segregation of children and their social and educational environment. For example, US studies have suggested desegregating the catchment areas through analytical redrawing of the boundaries as one way to reduce school segregation (Monarrez, 2018; Richards, 2014). So far, European studies have not modelled the possibilities of these strategies at a larger scale, but this policy tool might be a valuable addition to other anti-segregation policies.
The observed dynamics of mobility patterns consistently reproduce the inequalities between catchment areas. Although choices in residential mobility reflect multiple factors, such as changes in family situations, housing needs and the desire for certain neighbourhood qualities, school catchment areas are linked to the residential mobility patterns of the native Finnish families with children in several systematic ways.
First, between-catchment area mobility depends on the age of children, as moving house is most common when the children are small. When children reach school age, there is a rapid and permanent drop in moves between catchment areas. This appears to confirm the suggestion that families attempt to stabilise their children’s social environment and educational paths well before children start school. Later mobility is more likely within the same catchment area. This observation carries significant policy relevance, as families who do not yet have school-aged children actually appear to be central for school-related residential segregation. Their mobility decisions are shaping the geography of the socio-economic spatial and school segregation, which becomes visible later when children start school. Reflecting on the title of our paper, this, in fact, means that pupils are on the move before they even become pupils.
Second, residential decisions are linked to school segregation through systematic favouring or rejection of the catchment areas depending on their socio-economic and housing characteristics, which carries significance for the nature of both school and neighbourhood segregation. The most well-off catchment areas are mostly favoured in residential choices. The exclusive inner-city neighbourhoods with predominantly smaller apartments appear to be an exception to this, probably as many growing families are unable to find or afford a larger home in these neighbourhoods. However, the prestigious, socio-economically well-off catchment areas in the suburban parts of the city, which are characterised by larger houses and apartments, are systematically winners in the net-mobility flows. While the geographical location of the prestigious neighbourhoods within the urban network varies between cities, the pattern where mobility is directed towards areas with higher status seems transferable between contexts, including the Nordic welfare city characterised with policies of strong social mixing, resonating to a description by Atkinson (2006: 820): ‘These forces appear to reveal deep inclinations towards segregation based on desires for social homogeneity and the predictability and safety that this is perceived to engender.’
Preferences on the privileged catchment areas become especially evident when contrasting them to the most disadvantaged areas. While the mobility rates stabilise particularly strongly in the well-off areas after children start school, the same pattern is absent in most of the disadvantaged areas. Here the outwards mobility of the Finnish families remains higher than the inwards mobility for all age groups of children. The pattern results in a dual disadvantage for these catchment areas: while they have the poorest socio-economic characteristics to start with, they also lose majority population throughout the years the children are in school. Combined with the previous results concerning school choices outside childrens’ own catchment areas, where schools in disadvantaged neighbourhoods are systematically rejected (Bernelius, 2013; Bernelius and Vaattovaara, 2016), we can see a strong pattern of self-perpetuating segregation plaguing the most disadvantaged neighbourhoods and their schools.
To conclude, the results draw a picture of dynamics of segregation through school-related residential mobility and the role of catchment areas as mediators in the process. As Helsinki offers a case where the institutional quality differences as drivers of segregation are minimised, the findings reveal some persistent socio-economic drivers of self-perpetuating segregation potentially relevant for multiple contexts. The observations also raise several considerations for comprehensive urban and educational policies. The observed path dependency, or stability in the rank order of areas, highlights the need for policies which are sensitive to local challenges and to the long-term forces shaping the local situation. These observations are further emphasised by the fact that children appear to be more segregated than adults also in this context. In the urban policies targeting neighbourhood and school segregation, our results imply a need to focus on the effects that catchment area segregation may have on shaping the patterns throughout the whole city, as the process of sorting through residential mobility spans all neighbourhoods.
A practical implication may be to consider the way the boundaries of school catchment areas are drawn within the city, as this may affect the initial socio-economic structure within the area, as well as the future mobility patterns to and from the catchment areas. Furthermore, school and neighbourhood policies should be sensitive to the finding that families whose children are not yet at school are the most active group seeking neighbourhoods in which to raise their children, shaping the future catchment area and school segregation. If families are considered only when children become older, the patterns of socio-economic segregation in the catchment areas have already more or less stabilised through prior sorting.
Finally, at the neighbourhood level, the most pressing questions are related to the disadvantaged neighbourhoods, where the outflow of families with children of all ages highlights the urgency of supporting both neighbourhoods and the local schools. The documented self-perpetuating nature of segregation and loss of school-aged Finnish children in disadvantaged neighbourhoods suggests that having a universally high quality of institutions and support for individual families is not enough for combating the complex processes of segregation. As the local development trajectories appear ‘sticky’ in their path dependency and self-perpetuating social dynamics, the welfare measures aiming to combat segregation have to be able to overthrow the effects in both the school and neighbourhood to change their course.
Footnotes
Acknowledgements
We would like to sincerely thank the two anonymous reviewers for their insightful comments, the city of Helsinki for providing the data for the mobility analyses, and Heini Kekki and Hertta Sydänlammi for their valuable assistance in data management.
Funding
The author(s) disclosed receipt of the following financial support for the research, authorship, and/or publication of this article: This research was supported by NordForsk, project number 86103, University of Helsinki.