




Abstract
Using data from provinces of Iran from 2005 to 2016 and applying panel cointegrating regressions, I find that increases in real house prices have a negative and statistically significant effect on investments in small and medium-sized industrial firms. There are at least three possible mechanisms through which increases in house prices adversely affect industrial entrepreneurship. They (1) generate housing construction investment opportunities with high returns, (2) attract many urban adults with tertiary education to the real estate brokerage industry, and (3) encourage people to save more to buy houses (which is one of the prerequisites for marriage in Iran).
Introduction
The purpose of this study is to examine the effect of real house prices on investments in small and medium-sized industrial firms in Iranian provinces over the 2005–2016 period.
The theoretical and empirical literature emphasises two positive channels and two negative channels through which house prices influence business formation. Recent studies in countries with well-developed financial systems have shown that a housing boom positively influences small business start-ups, entrepreneurship and self-employment through the housing collateral enhancement and the housing wealth effects channels (Adelino et al., 2015; Balasubramanyan and Coulson, 2013; Corradin and Popov, 2015; Fairlie and Krashinsky, 2012; Harding and Rosenthal, 2017; and Kerr et al., 2014, for the US; Black et al., 1996; and Robson, 1996, for the UK; Connolly et al., 2015, for Australia; Schmalz et al., 2017, for France). Under the housing collateral channel, ‘rising housing prices increase the housing equity of residential property owners. This increases the potential borrowing capacity of credit-constrained entrepreneurs, allowing them to finance more entrepreneurial activity by using their housing equity’ (Connolly et al., 2015: 115). Under the housing wealth effects channel, ‘growing house prices increase the wealth levels of entrepreneurs and lead them to start new businesses’ (Kerr et al., 2014: 3).
However, research in China does not support the positive relationship between house price appreciations and business start-ups. For example, Li and Wu (2014) found that high house prices discourage entrepreneurial activities for Chinese urban adults for two reasons. First, rising house prices increase the attractiveness of buying a house relative to starting a business as the return rates of housing investment exceed most types of investment in China. This is known as the ‘housing investment opportunity’ channel. Second, increases in house prices encourage people to save for buying a house (which is a prerequisite for marriage in China) and discourage activities that could delay home ownership, including being an entrepreneur. This is called a ‘marriage crowd-out effect’ channel.
In this study, I focus on Iran’s economy and expect that the increases in housing prices have dampened the investments in small and medium-sized industrial firms, ceteris paribus. The case of Iran is comparable to that of China because: (1) in both countries homeownership has a high social value; (2) both countries have experienced increases in house prices; (3) real estate (particularly housing) is a very popular investment choice for Iranian and Chinese investors; (4) there is evidence in both countries that house price increases have generated real estate investment opportunities with high returns which divert capital away from the industrial sector and into the real estate sector; (5) it is challenging for Iranian and Chinese home owners to cash-out the growth of their housing wealth for other investment purposes, unless they sell their houses (see Gholipour and Lean, 2017; Li and Wu, 2014; Rong et al., 2016).
There is potentially an additional negative channel in Iran that needs to be considered: the growth of the real estate brokerage (REB) industry. The REB industry has significantly grown over the last decade in Iran, mainly driven by increases in house prices and in residential property transactions (Gholipour and Razali, 2017). According to the Statistical Centre of Iran (see Gholipour and Razali, 2017), the number of residential property transactions (intermediated by REB firms) increased from 364,820 units in 2003 to 873,775 units in 2011. Between 2000 and 2011, the gross value added from the REB industry (in real terms, 2011 prices) increased sharply at an average annual growth rate of 15%, rising from 3635 billion Rials 1 in 2000 to 13,931 billion Rials in 2011. In 2011, 71,916 real estate agents were registered and operating in Iran. Out of this number, 15,051 agents (20%) were registered either in or prior to 2000, and 56,864 agents (80%) were registered between 2001 and 2011. The sector employed 117,780 people in 2011, compared with 76,897 people in 2003 (Gholipour and Razali, 2017). The significant growth of the REB industry has attracted many urban adults with tertiary education to this sector, which possibly has had a negative impact on industrial entrepreneurship in urban areas. For example, according to the head of Tehran’s real estate brokerage industry, in 2018, 40% of real estate brokers in Tehran had engineering degrees, 400 were medical doctors and 17–18% had bachelor’s and postgraduate degrees in law. Interestingly, 100 to 120 Islamic Mullahs work as real estate brokers (Mehr News, 2018). In 2018, 158,220 real estate brokerages were registered in Iran. Of those registered, 312 agents had PhD degrees, 2411 had a master’s degree, 19,621 had a bachelor’s degree and 10,893 had an associate’s degree. 2
I empirically examine the relationship between real house prices and investments in small and medium-sized industrial firms using data from 31 provinces of Iran over the 2005–2016 period. The results from panel Fully Modified OLS (FMOLS) estimators show a negative and significant link between real house prices and investments in industrial firms. This finding suggests that the influence of the ‘housing investment opportunity’, ‘growth of the REB industry’ and ‘marriage crowd-out effect’ channels on business formation are stronger than that of the ‘housing collateral’ and ‘housing wealth effects’ channels in Iran. This might be due to the liquidity of housing collateral being very low and housing-related lending products (e.g. home equity loans and cash-out refinancing) being uncommon in Iran. Figure 1 shows the depth of the mortgage market in Iran compared with similar economies, the world rate and high-income countries. It clearly shows that the depth of housing finance is very low in Iran (only about 2% of GDP) compared with the rest of the world, mainly due to weak legal rights for borrowers and lenders, macroeconomic volatility and deficiency of credit information systems (Warnock and Warnock, 2008).
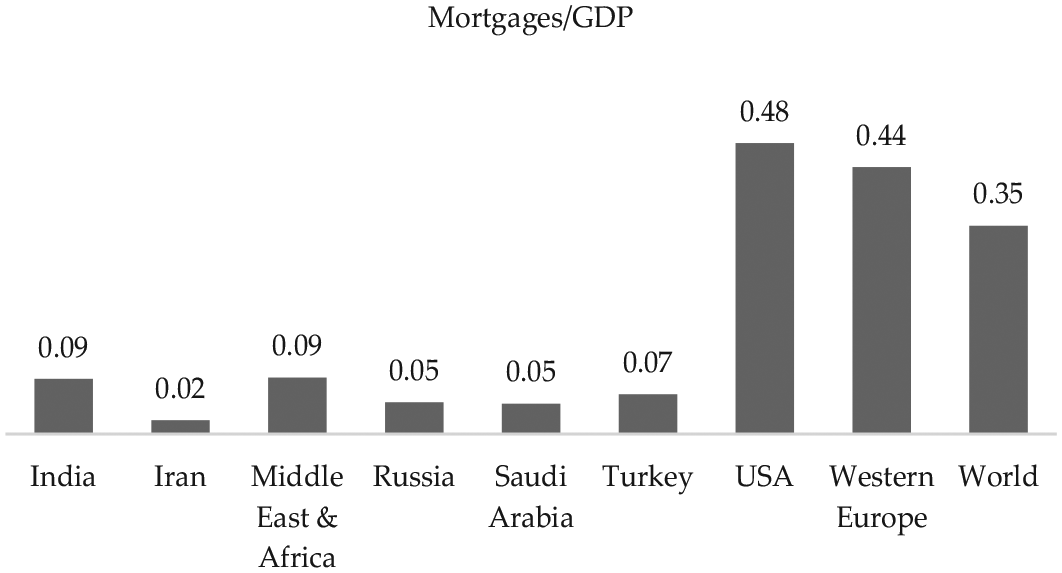
Depth of housing finance in 2016.
In addition, the housing wealth of Iranian households has decreased over the past decade. The percentage of households with home ownership dropped from 67.9% in 2006 to 60.5% in 2016, according to the Statistical Centre of Iran (2016), and households with rented houses increased from 22.9% in 2006 to 30.7% in 2016. Moreover, double-digit growth of the REB sector has made industrial activities less attractive for urban adults with a higher education.
The present study makes three contributions to the literature on the linkage between the housing market and entrepreneurship. First, although there have been some studies on the effect of house prices on business formation in developed countries and China, to the best of the author’s knowledge no empirical study has analysed this link in a Middle Eastern country. Taking advantage of Iran’s recent increases in house prices, this study attempts to fill the gap in the literature on the linkage between the housing market and industrial entrepreneurship. The second contribution is introducing an additional channel to the literature on the linkage between the housing market and business formation, namely ‘growth of REB industry’. Third, increases in house prices in Iran have been blamed for various socio-economic problems such as the high divorce rate, land grabbing crimes, lower marriage rates, lack of housing affordability, income inequality and environmental degradation (for a review, see Farzanegan and Gholipour, 2016; Farzanegan et al., 2017; Gholipour and Farzanegan, 2015; Ranjipour, 2019). One aspect of housing that is yet to be documented is how house prices affect industrial firm formation in Iran. This article focuses on the industrial (or manufacturing) sector, since it commodifies innovation, and patents in this sector are very valuable and more important than in other industries (Hsu et al., 2014; Shih, 2012). In other words, the industrial sector holds strong potential to significantly contribute to long-term economic growth and employment. Moreover, according to World Bank data (World Bank, 2019a), manufacturing accounted for about 14.1% of Iran’s GDP over the 2000–2016 period. The number is higher than average for the Middle East and North Africa (MENA) region (11.7%), but is slightly lower than the world’s average (16.1%). Over the same period, the manufacturing sector contributed about 18% to global employment, whereas the figure is about 11% for the MENA countries.
In terms of policy implications, this study is both important and timely for the Iranian economy because low levels of industrial firm formation and the high unemployment rate of the working age population are the main economic challenges in post-sanctions Iran. Moreover, according to the World Bank (2017), the new government’s challenge (led by Hassan Rouhani) is to boost non-oil sector growth through creating a level playing field for existing and new firms, improving the business environment and the efficiency of labour markets. Therefore, studying the effect of house prices on the formation of industrial firms may help policymakers to better understand the barriers against industrial entrepreneurship.
The rest of the article proceeds as follows: the second section describes the data and the empirical methodology; the third section discusses the results; and the fourth section concludes and provides policy recommendations.
Data and empirical model
Data
I use data from 31 provinces of Iran over the period 2005–2016. The chosen period for the analysis is based on the availability of data on investments in industrial firms (excluding real estate agents and construction firms) across provinces of Iran. In this study, I follow the definition of industrial firms provided by the Ministry of Industry, Mine and Trade of Iran. The ministry includes the production of the following products as industrial products: food and drink, tobacco, textiles, clothing, leather and shoes, wood, paper, printing, petrochemicals, chemicals, rubber and plastic, non-metallic minerals, metals, metal fabrication machinery and equipment, office and accounting equipment, electrical machinery, radio, TV and telecommunication, medical and precision equipment, motor vehicles, other transportation, sofas, recycled goods and computers. New industrial firms in Iran are mostly small and medium-sized enterprises. Over the period of this study, the average number of employees per new industrial firm was about 30 people (Ministry of Economic Affairs and Finance Deputy of Economic Affairs, n.d.).
As a dependent variable, two measures are used: the amount of investments in issued operation permits of industrial firms (LOP$) and LOP$ per capita (LOP$C). The LOP$C is used to capture the size of provinces. An operation permit is granted by a government to a person or business entity to commence its business operations after installing machinery and equipment, recruiting staff and producing sample outputs. Data for LOP$ were obtained from the Ministry of Industry, Mine and Trade of Iran (n.d.) and the Economic and Financial Databank of Iran (Ministry of Economic Affairs and Finance Deputy of Economic Affairs, n.d.). Table A.1 in the Appendix (available online) shows the average annual LOP$ over the period of this study (2005–2016). The data show that Tehran, Khuzestan and Esfahan had the largest LOP$, whereas Kurdestan, Sistan Baluchestan and Kohkyluyeh Boyrahmad scored the lowest LOP$. Tehran (in the north of Iran) and Esfahan (in the centre) are the economic centres of Iran, and most industrial firms are operating in these provinces. Khuzestan (in the south-west) is the major oil-producing region of the country. Kurdestan (in the west), Sistan Baluchestan (in the south-east) and Kohkyluyeh Boyrahmad (in the south-west) are among the least developed provinces of Iran. Figure A.1 also illustrates the evolution of LOP$ in a set of provinces of Iran (which are in different geographical locations and at different levels of economic development). As can be seen, there are significant changes in LOP$ across provinces over the period of study, which provides reasonable variation for regression analyses.
The key independent variable of interest is house prices (HP). I use average house prices per square metre (1000 Rial) at the province level. Data for HP were taken from the Statistical Centre of Iran. It should be noted that data for HP were gathered from the capital city of each province. Figure A.2 shows the evolution of HP in a set of provinces of Iran. Except for the period of 2008–2010, HP experienced an upward trend over the period of this study (2005–2016). The recession in housing prices during 2008–2010 was mainly caused by the government’s rollout of the national affordable housing project – the Mehr Housing Project (Maskan-e Mehr) 3 – and increases in political uncertainties due to Iran’s nuclear programme.
To better identify the effect of house prices on investments in small and medium-sized industrial firms, I include four control variables: economic activities, access to finance, level of education, and sanctions. This choice of control variables is guided by three considerations: the relevance of the variables in panel data modelling of business formation, the availability of data for variables for all provinces over the period of 2005–2016, and the need for a parsimonious specification imposed by the relatively small size of the sample. In the following section, I briefly explain the association between each control variable and business formation. Table 1 provides a description of the variables and summary statistics for all variables used in this study.
Definition and summary statistics of variables (before transformation).
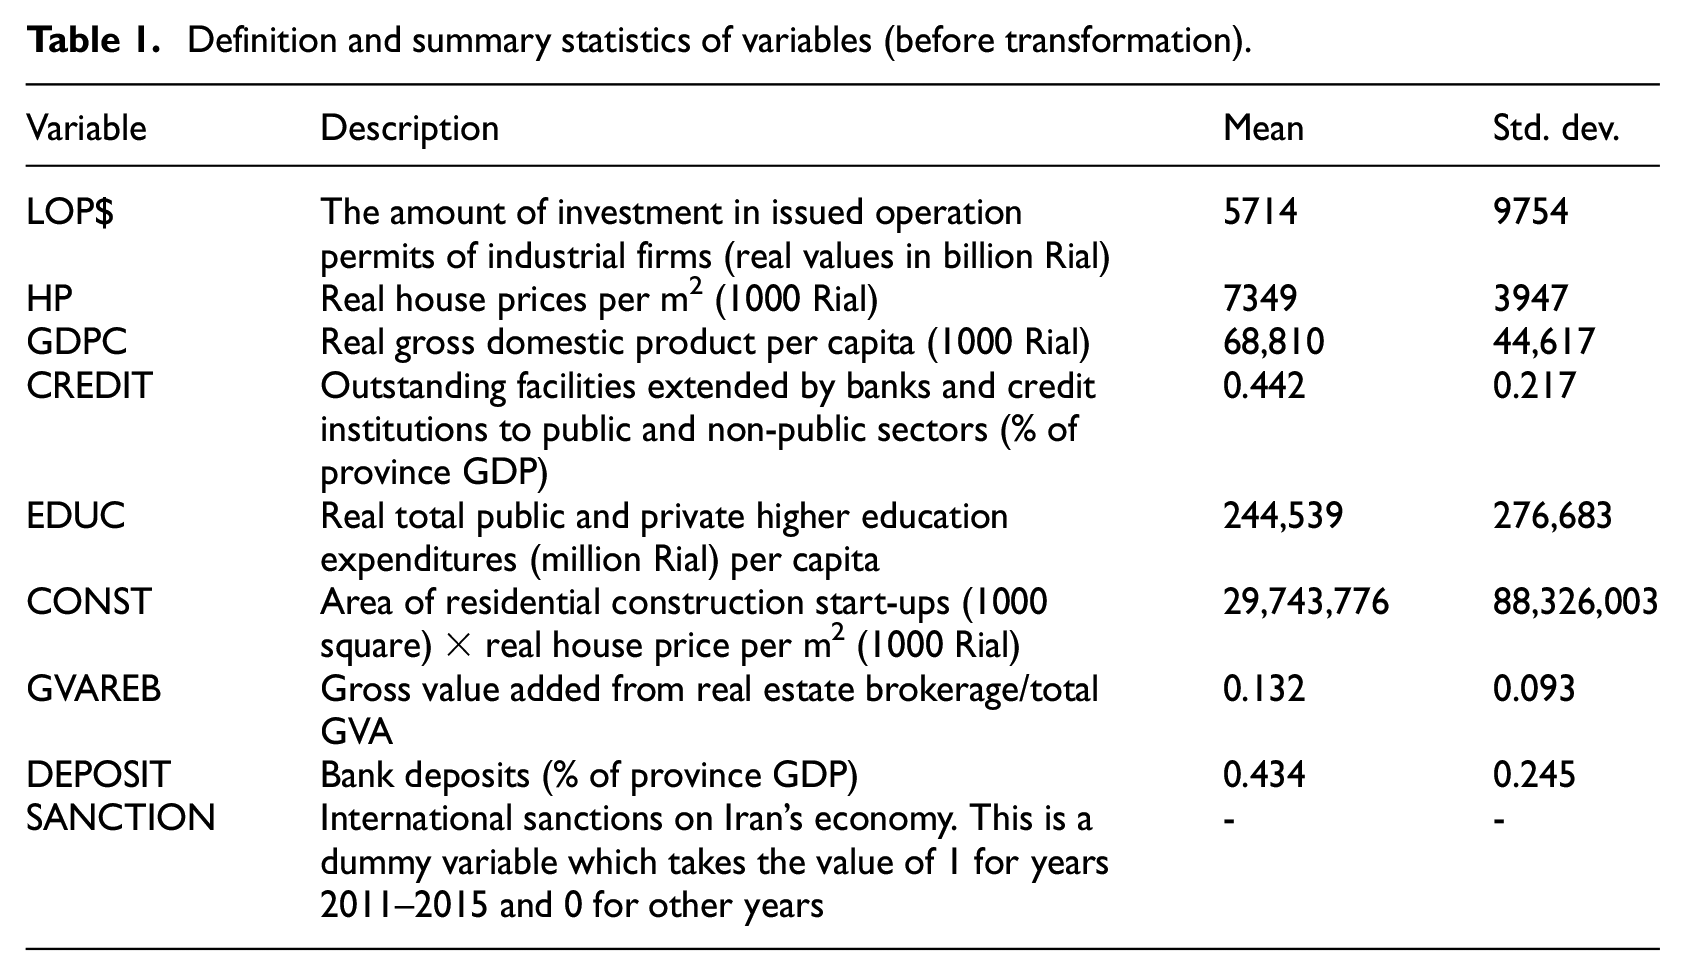
Economic activities: Existing studies have shown that formal business start-ups are positively correlated with higher levels of economic activities (e.g. Farzanegan, 2014; Gholipour and Masron, 2012; Klapper et al., 2006; Thai and Turkina, 2014). This is because economic expansion creates more business opportunities and signals high investment returns, which in turn encourage entrepreneurship. I use gross domestic product (GDP) per capita (GDPC) in each province as a measure of economic activities. Data for this variable were taken from the Statistical Centre of Iran.
Access to finance: It has been proven that greater access to finance (or development of financial systems) is one of the main determinants of business start-ups and formal entrepreneurship (e.g. Farzanegan, 2014; Gholipour and Masron, 2012; Klapper et al., 2006; Thai and Turkina, 2014). This is because well-developed financial systems help potential entrepreneurs (who often lack extensive personal or family wealth) to finance their investment ideas, reduce the risks associated with the investment and decrease the costs of financing. In this study, I use outstanding facilities extended by banks and credit institutions to public and non-public sectors (% of province GDP) as a measure of access to finance (CREDIT) of each province. Data for this variable came from banking data from the Central Bank of Iran (2017).
Education: Research has shown that education (in particular, higher education and training) is one of the major determinants of entrepreneurial activities across countries (e.g. GEM, 2014). This is because higher education enhances individuals’ confidence and capabilities in starting businesses (GEM, 2016). I use public and private higher education expenditures per capita (EDUC) as a proxy for education. The data on education expenditures (million Rial) were obtained from the Statistical Centre of Iran. It should be noted that data over time for other measures of education at the province level are not available.
Sanctions: Finally, I include a dummy variable to capture the impact of sanctions on industrial activities. The sanction dummy takes the value of 1 for years 2011–2015 and 0 for other years. From 2011 to 2015, the United Nations (UN), the US and the European Union (EU) imposed several sanctions on Iran’s economy to force it to halt uranium enrichment. The sanctions significantly reduced Iran’s oil exports and restricted its access to the global financial system for trade (BBC, 2018).
Empirical model
This study tests whether increases in real house prices affect formation of small and medium-sized industrial firms across Iranian provinces over the period 2005–2016. The empirical model is specified as follows:

where INVESTit stands for one of the two measures for investments in small and medium-sized industrial firms of province i in year t (real LOP$ and real LOP$C); HPit stands for real house prices of province i in year t; GDPCit represents real GDP per capita of province i in year t; CREDITit is credit to public and non-public sectors as a percentage of GDP of province i in year t; EDUC represents the real total public and private higher education expenditures per capita in province i in year t; SANCTIONt is a dummy for sanctions imposed on Iran’s economy which takes a value of 1 for years 2011–2015 and 0 for other years; ln is the natural logarithm; βs are the estimated coefficients; and uit is an error term. I use province consumer price index (CPI) to calculate the real values of nominal variables. 4
To estimate the relationships between explanatory variables and dependent variables, I apply the panel FMOLS estimation method. The primary reason for utilising the FMOLS is to account for endogeneity in the model. There is the potential issue of reverse causality: the establishment of small and medium-sized industrial firms might cause higher house prices, rather than the other way around. In other words, one may argue that larger investments in industrial firms increase economic activities as well as household incomes in a province, which can increase housing demand and push house prices up. In addition, the variables are non-stationary at level (but stationary in their first-difference) and there is cointegration between variables. These exclude the application of the standard instrumental variable regressions (to address the endogeneity issue) in this study (Binder et al., 2005; Hahn, 2013). Therefore, we need to apply a cointegrating regression such as FMOLS (Phillips and Hansen, 1990) which uses a semi-parametric correction for endogeneity and residual autocorrelation (Liddle, 2012; Peter and Phillip, 1995). In particular, the FMOLS estimator corrects the endogeneity caused by feedback relationships between independent variables and the dependent variable (Pedroni, 2001; Peter and Phillip, 1995). 5
As for the FMOLS estimation, a preliminary analysis on unit root and panel cointegration is carried out. Once it is established that a long-run cointegration relationship exists, equation (1) is estimated using the FMOLS method.
Analysis and results
Unit root test
I start with a panel unit root test to examine the stationarity (or unit roots) of the data. Since the datasets are unbalanced panels, I perform the IPS unit root test, developed by Im, Pesaran and Shin (2003). One of the main advantages of the IPS test is that it does not require balanced datasets. Moreover, the IPS test relaxes the assumption that all panels share a common autoregressive parameter. Relaxation of this assumption is important because the panel includes Iranian provinces with slightly different cultural contexts (e.g. Persian, Azari, Kurdish, Arab, Turkish). The null hypothesis of the IPS test is that all panels contain a unit root. Table 2 presents the test statistics for the variables. They suggest that all variables appear to contain a unit root in their levels but are stationary in their first-differences, indicating that they are integrated at order one I(1).
Results of panel unit root test.

Notes: Null hypothesis of IPS test: unit root (individual unit root process). Probabilities are computed assuming asymptotic normality. ***p < 0.01.
Panel cointegration tests
Next, I perform Kao (1999) cointegration tests to analyse the existence of the long-run equilibrium relationship between the variables when I use LOP$ and LOP$C as dependent variables followed by other explanatory variables. The Kao tests follow Engle-Granger’s (1987) two-step (residual-based) cointegration tests. The Engle-Granger (1987) cointegration test is based on an examination of the residuals of a spurious regression performed using non-stationary I(1) variables. If the variables are cointegrated then the residuals should be stationary I(0). On the other hand, if the variables are not cointegrated then the residuals will be I(1). Kao (1999) extends the Engle-Granger framework to tests involving panel data. Kao tests the null hypothesis of no cointegration.
The results of the Kao residual cointegration tests are presented in Table 3. The null hypothesis of no cointegration is rejected, suggesting that there is a long-run equilibrium relationship between the variables in each estimated model.
Results of Kao residual cointegration tests.

Notes: Null hypothesis: no cointegration. Newey-West automatic bandwidth selection and Bartlett kernel. ***p < 0.01.
Estimation results
Table 4 illustrates the FMOLS estimation results. 6 Columns 1 and 2 of Table 4 report the results when I use two indicators of dependent variables (LOP$ and LOP$C), respectively. The results show that there is a negative and significant relationship between HP and LOP$ and LOP$C. More specifically, the elasticity of LOP$ with respect to HP is −1.084, suggesting that a 1% increase in real house prices is associated with a 1.084% decrease in the amount of investments in establishment of small and medium-sized industrial firms in Iran (column 1 of Table 4). The elasticity of LOP$C with respect to HP is slightly greater and is −1.257 (column 2 of Table 4).
Real house prices and investments in small and medium-sized industrial firms.

Notes: LOP$ is real Rial values of operation permits of industrial firms; LOP$C is LOP$ per capita; HP is real house prices (1000 Rial); GDPC is real gross domestic product per capita (1000 Rial); CREDIT is outstanding facilities extended by banks and credit institutions to public and non-public sectors (% of province GDP); EDUC is real total public and private higher education expenditures (million Rial) per capita. SANCTION is a dummy which takes a value of 1 for years 2011–2015 and 0 for other years. *** indicates significance at the 1% level. Standard errors are in parentheses. Estimation method: Panel FMOLS. Long-run covariance estimates (Bartlett kernel, Newey-West fixed bandwidth); Cointegrating equation deterministics: C @TREND.
These findings imply that increases in house prices over the greater portion of the last decade have dampened formation of industrial firms in Iran. There are several explanations for these findings. First, house price surges generated housing investment opportunities with high returns (from higher rents and capital gains), which encouraged potential entrepreneurs and wealthy people to divert their capital away from the industrial sector and towards the real estate sector. As a result, the amount of investment in industrial firms has dropped. Second, the significant growth of the REB industry has attracted many urban adults with tertiary education to this industry, which has probably reduced industrial entrepreneurship in urban areas. Third, increases in house prices encouraged people to save more to buy houses (which is one of the prerequisites for marriage in Iran). This, in turn, may have negatively influenced their motivation to start a business in the industrial sector.
One could argue that the relationship between house prices and investments in small and medium-sized industrial firms can be explained by the ‘Dutch disease’ phenomenon in an oil-exporting country. This is where unexpected income from resource discoveries has adverse effects on traded sectors (e.g. manufacturing), mainly through a real exchange rate appreciation, and has positive effects on non-traded sectors (e.g. real estate). 7
However, several theoretical and empirical studies on the Iranian economy have shown that the ‘Dutch disease’ is not relevant to Iran, where oil income has been, and is expected to be, an important feature of the economy for a long period (Esfahani et al., 2013, 2014; Mohaddes and Pesaran, 2014). In other words, they argue that the phenomenon is applicable to economies that have been subject to sudden unexpected income from resource discoveries that are temporary and are not expected to last very long (Esfahani et al., 2014). 8
The evidence from Iran is consistent with Li and Wu (2014), who found that high house prices discourage entrepreneurial activities for Chinese urban adults. Conversely, the results do not support the findings of other similar studies, which show that increases in house price appreciations can have a significant and positive impact on small business start-ups, entrepreneurship and self-employment through ‘housing collateral’ and ‘housing wealth effects’ channels in countries with well-developed financial systems. Such economies experience very high liquidity of housing collateral, and housing-related lending products are very common (e.g. Adelino et al., 2015; Balasubramanyan and Coulson, 2013; Black et al., 1996; Connolly et al., 2015; Corradin and Popov, 2015; Fairlie and Krashinsky, 2012; Harding and Rosenthal, 2017; Kerr et al., 2014; Robson, 1996; Schmalz et al., 2017).
Regarding the control variables, as seen in columns 1 and 2 of Table 4, for CREDIT, a significant and positive association with LOP$ and LOP$C is found. This indicates that investment in industrial firms is greater in provinces of Iran where the private sector has access to more loanable funds. This finding is in line with those of Klapper et al. (2010), Farzanegan (2014), Gholipour and Masron (2012) and Thai and Turkina (2014). Moreover, the coefficient of GDPC has the expected positive sign and is statistically significant (columns 1 and 2 of Table 4), suggesting that higher economic activities contribute to increases in investments in the industrial sector. The findings also show that expenditures in higher education (EDUC) have a significant and positive relationship with investments in industrial firms. Finally, the results indicate that the dummy variable for sanctions (SANCTION) has the expected inverse association with LOP$ and LOP$C and is statistically significant, suggesting that international sanctions on Iran’s economy dampened the country’s industrial sector.
Since I find a negative relationship between real house prices and investments in industrial firms, in the next step I explore three possible mechanisms through which increases in house prices may affect investments in industrial firms for the case of Iran. First, in the analyses I replace house prices with the real value of investment in new housing construction (CONST). This is owing to, one may argue, house prices ultimately influencing industrial firm formation through investment in the housing sector. When house prices increase (often accompanied by an escalation in rents in Iran), potential entrepreneurs and investors are encouraged to allocate their capital to the housing sector to gain more returns. I construct the CONST variable by multiplying area of residential construction start-ups (1000 square metres) and real house price per square metre (1000 Rial). Data for area of residential construction start-ups were collected from the Central Bank of Iran.
The findings from the regressions involving the CONST are presented in Panel A of Table 5. The coefficient of CONST is negative and significant, suggesting that increases in the real value of investment in new housing construction are associated with decreased LOP$ and LOP$C across provinces over the 2005–2016 period. The results also show that the magnitude of the coefficients of CONST across two specifications is smaller than coefficients of HP in Table 4. This is because HP negatively influences industrial firm formation through at least three channels (‘housing investment opportunity’, ‘growth of REB industry’ and ‘marriage crowd-out effect’), whereas CONST affects investment in industrial firms only through the ‘housing investment opportunity’ channel.
Testing the mechanisms by which real house prices influence investments in small and medium-sized industrial firms.

Notes: LOP$ is real Rial values of operation permits of industrial firms; LOP$C is LOP$ per capita; HP is real house prices (1000 Rial); GDPC is real gross domestic product per capita (1000 Rial); CREDIT is outstanding facilities extended by banks and credit institutions to public and non-public sectors (% of province GDP); EDUC is real total public and private higher education expenditures (million Rial) per capita. SANCTION is a dummy which takes a value of 1 for years 2011–2015 and 0 for other years. CONST is area of residential construction start-ups (1000 square) × real house price per square metre (1000 Rial); GVAREB is gross value added from real estate brokerage/total GVA; DEPOSIT represents bank deposits (% of province GDP); *** indicates significance at the 1% level. Standard errors are in parentheses. Estimation method: Panel FMOLS. Long-run covariance estimates (Bartlett kernel, Newey-West fixed bandwidth); Cointegrating equation deterministics: C @TREND.
To test the ‘growth of REB industry’ channel, I replace HP with GVAREB. GVAREB is the gross value added (GVA) from the real estate brokerage sector divided by the total GVA in each province. The results of this test are presented in Panel B of Table 5. The coefficient of GVAREB is negative and statistically significant at 1% (columns 3 and 4 of Panel B). This means that provinces with more activities in the real estate brokerage sector have a lower amount of investments in the industrial sector.
Finally, like the case of China (Li and Wu, 2014), it can be argued that increases in house prices encourage young people to save more to buy houses (which is one of the prerequisites for marriage in Iran) and discourage activities that could delay home ownership, including being involved in industrial entrepreneurial activities. This argument is supported by the findings of Gholipour and Farzanegan (2015), who show that high house prices and rents have decreased family formation across provinces in Iran. Recognising that housing is a major cost associated with marriage, increases in real house prices encourage saving and discourage entrepreneurial activities. In this study, I use the total deposit in the banking system in each province as a percentage of the size of the province economy (GDP). I use this proxy (DEPOSIT) because there are no data on household saving ratio per province over the period of this study. In addition, most Iranians deposit a large part of their savings in the banking system. Panel C of Table 5 presents the estimation results when I replace HP with DEPOSIT. Like the coefficients of CONST (in Panel A of Table 5) and GVAREB (in Panel B of Table 5), significant and negative associations are found between DEPOSIT and LOP$ and LOP$C (Panel C of Table 5).
In sum, it can be concluded that the influence of ‘housing investment opportunity’, ‘growth of REB industry’ and ‘marriage crowd-out effect’ channels on investment in the industrial sector is stronger than that of ‘housing collateral’ and ‘housing wealth effects’ channels in Iran. In addition, the results suggest that increases in house prices over the past decade have played a substitutional role for Iran’s industrial sector.
Conclusion and policy recommendations
Among the upper-middle-income countries, Iran has struggled in terms of creating enough job opportunities for its labour force over the past three decades. Over the 1991–2019 period, Iran’s unemployment rate was 11.28%, whereas the rate was 5.73% for upper-middle-income countries (World Bank, 2019b). This has been partly due to the limited participation of small businesses and industrial entrepreneurship, which can make a significant contribution to innovative outputs, long-run economic growth and employment. Iranian observers have identified several factors that have possibly hindered entrepreneurship in Iran, such as unfavourable business environments, high levels of political risk and corruption, undeveloped financial systems and a lack of government support. In this study, I argue that increases in house prices are another factor that has suppressed industrial entrepreneurship through at least three negative channels: ‘housing investment opportunity’, ‘growth of REB industry’ and ‘marriage crowd-out effect’. In other words, the housing has become a substitute for Iran’s industrial sector by diverting funds into the housing sector, encouraging people to save for homeownership (which is one of the prerequisites for marriage in most provinces of Iran) and attracting educated and skilled people to the real estate brokerage industry.
Using data from 31 provinces of Iran from 2005 to 2016 and applying panel FMOLS estimators, I find evidence of a negative association between house prices and investments in small and medium-sized industrial firms. While several studies have investigated the effect of house prices on entrepreneurship and business start-ups in high-income countries with well-developed financial systems, no empirical research has examined the relationship between house prices and the formation of industrial firms in a Middle Eastern economy. Therefore, findings of this study provide new insights in this area of emerging literature.
How should policymakers in Iran and other countries with similar situations deal with the dampening impact of increases in house prices on entrepreneurship? The results suggest that controlling the growth of house prices needs to be considered by policymakers to boost industrial entrepreneurship. Existing studies on the Iranian housing market have recommended that excessive and speculative housing demand should be limited by (1) introducing an effective property tax that prevents frequent property trading, (2) reducing banks’ lending to the housing sector, (3) minimising banks’ investments in the housing sector, and (4) regulating the real estate brokerage industry, which is the main player in housing speculation. On the supply side, research has recommended that policymakers would be able to increase housing supply and, to some extent, reduce house prices and rents by introducing a system that identifies and taxes long-term vacant houses. Finally, if we assume that house price growth is not controllable, financial regulations in Iran should be reformed to allow industrial entrepreneurs (who have houses or whose parents own houses) to use housing-related lending products, such as home equity loans and cash-out refinancing.
In terms of future research, it may be interesting to examine the relationship between house prices and industrial entrepreneurship by using disaggregate data for industrial subsectors if the data are available across provinces of Iran for several years.
Supplemental Material
Gholipour_Fereidouni_Appendix_1 – Supplemental material for Urban house prices andinvestments in small andmedium-sized industrialfirms: Evidence fromprovinces of Iran
Supplemental material, Gholipour_Fereidouni_Appendix_1 for Urban house prices andinvestments in small andmedium-sized industrialfirms: Evidence fromprovinces of Iran by Hassan F. Gholipour in Urban Studies
Footnotes
Acknowledgements
I would like to thank three anonymous reviewers for their constructive and useful comments on an earlier version of this article. I am also grateful to participants at the Fifth International Conference on Iran’s Economy (in Amsterdam, 2018) and at the event of the Prestigious Award for Distinguished Iranian Young Economist (in Tehran, 2018) for their helpful comments and discussion.
Declaration of conflicting interests
The author declared no potential conflicts of interest with respect to the research, authorship, and/or publication of this article.
Funding
The author received no financial support for the research, authorship, and/or publication of this article.

Supplemental Material
Supplemental material for this article is available online.
Notes
References
Supplementary Material
Please find the following supplemental material available below.
For Open Access articles published under a Creative Commons License, all supplemental material carries the same license as the article it is associated with.
For non-Open Access articles published, all supplemental material carries a non-exclusive license, and permission requests for re-use of supplemental material or any part of supplemental material shall be sent directly to the copyright owner as specified in the copyright notice associated with the article.
